Treasury Board of Canada Secretariat
www.tbs-sct.gc.ca
Common menu bar links
Breadcrumb Trail
ARCHIVED - Using External Service Delivery Key Performance Indicators
 This page has been archived.
Archived Content
Information identified as archived on the Web is for reference, research or recordkeeping purposes. It has not been altered or updated after the date of archiving. Web pages that are archived on the Web are not subject to the Government of Canada Web Standards. As per the Communications Policy of the Government of Canada, you can request alternate formats on the "Contact Us" page.
MAF Category: Citizen-Focussed Service
Theme: Delay Measures
In most of the higher-volume programs that provide in-person services, visitors arrive at the service centre and are greeted by a receptionist. Most queue management systems are able to track the service experience from the time a visitor takes or is given a numbered ticket. All queued service models focus on Average Wait Time (AWT) as one of the most important indicators of customer satisfaction. AWT is the time from initial receipt of the service ticket to the time the client begins service with an agent at the counter. Transaction Time is the duration of the counter service experience. Total Visit Time therefore is the total of Wait Time and Transaction Time.
As with the queued phone service model, the performance target for many in-person service centres is called Service Level. It is expressed as a percentage within a threshold target, e.g. 85 per cent of all clients will be served within 15 minutes. Clearly, Service Level is a primary indicator of customer satisfaction and it is tracked continuously against the published target level.
Average Wait Time (AWT)Average length of time that visitors who have received a service ticket wait prior to receiving service from an agent |
Service LevelThe percentage of visitors who receive service from an agent within a specified time threshold (T); T represents a service threshold considered reasonable, e.g. 20 minutes. Visitors Serviced Within T X
100 |
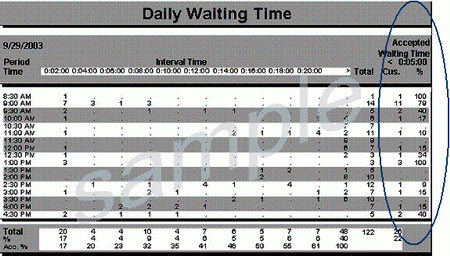
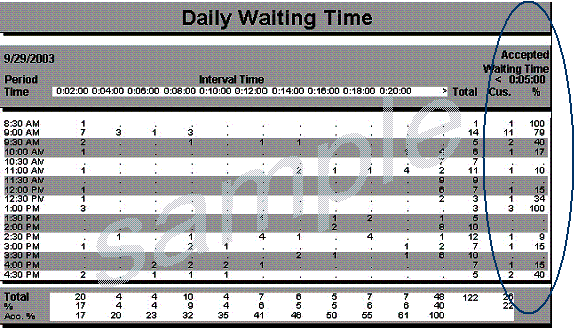
AWT and Service Level: Vendor Specifics (Q-MATIC)
The Waiting Time reports (daily, weekly, and annual) provide these data. Average Wait Time is found in the column Accepted Waiting Time < T, where T is the Service Level threshold. Figure 6-2 is an example of such a report.
Figure 6-2: Daily Waiting Time Report (Q-MATIC)