ARCHIVED - Using External Service Delivery Key Performance Indicators
 This page has been archived.
Archived Content
Information identified as archived on the Web is for reference, research or recordkeeping purposes. It has not been altered or updated after the date of archiving. Web pages that are archived on the Web are not subject to the Government of Canada Web Standards. As per the Communications Policy of the Government of Canada, you can request alternate formats on the "Contact Us" page.
Throughout this document, references are made to various commercial products currently in use for the management of Government of Canada service delivery functions. Reference herein to any specific commercial products, process, or service by trade name, trademark, manufacturer, or otherwise does not constitute or imply its endorsement or recommendation by the Government of Canada. The inclusion of any specific commercial products, process, or service by trade name, trademark, manufacturer, or otherwise shall not be used for advertising or product endorsement purposes. Product names, examples, and trademarks are the property of their respective vendors and have been used with the permission of the vendor. Readers are advised that current or future procurements may result in the replacement of any referenced product.
Table of Contents
1. Introduction and Background
2. Implementing Service Delivery KPIs: Then, Now, and Future
3. External Service Delivery KPIs: Summary
4. Implementing Service Delivery KPIs for Phone Services
5. Implementing Service Delivery KPIs for Internet Services
6. Implementing Service Delivery KPIs for In-person Services
1. Introduction and Background
Key performance indicators (KPIs) are increasingly used by the private and public sectors to effectively monitor organizational goals and business outcomes through defined sets of quantifiable measures. For the Government of Canada (GoC), KPIs are becoming essential to supporting the cost-effectiveness of operations and improving management responsibilities and accountabilities such as those described in the Management Accountability Framework (MAF). The value of standardized measurements was recognized early across government, and in 2003 a project was initiated to establish basic terminology, a common definitional structure, and standardized procedures for strategic and operational KPIs.
The Treasury Board of Canada Secretariat's (the Secretariat's) Business and Service Strategies team is tasked with working closely with GoC departments and agencies to define and implement consistent sets of KPIs for measuring all external service delivery activities. In early fall 2004, a draft document describing proposed KPIs for the phone, in-person, and Internet channels was published in close association with leading departments and agencies. These KPIs have been grouped by specific themes and aligned to the MAF in order to help departments and agencies with reporting requirements. The current version can be found at /si-as/kpi-icr/interim/interim00-eng.asp.
This usage guide has been prepared primarily to assist those organizations that are using external service delivery KPIs. It provides for the following:
- identify and describe specific implementation details for data collection and reporting for appropriate KPIs as they apply to GoC service delivery;
- describe specific usage guidelines and implementation details for existing measurement technologies in current use to support measurement of phone, in-person, and Internet channels; and
- explain initial processes and approaches for a consistent use of external service delivery KPIs within performance management and accountability frameworks.
The guide has been prepared for service delivery managers, planners, leaders, and operations supervisors who are responsible for the direct delivery of service to Canada's citizens, businesses, and visitors.
A concise summary of the published service delivery KPIs is presented in Section 3. Specific guidelines for Service Channel KPIs are described in sections 4 through 6. In some sections, a best practice or measurement convention is presented as a usage tip (highlighted as a text box).
Throughout this document, references are made to various commercial products currently in use for the management of GoC service delivery activities. Product names, examples, and trademarks are the property of their respective vendors and have been used with the permission of the vendors. The inclusion of these products in this document does not constitute an endorsement of any kind by the Treasury Board of Canada Secretariat. Readers are advised that current or future procurements may result in the replacement of any of the referenced products.
Comments, suggestions, and corrections are welcomed and encouraged. These can be e-mailed to cpm-gcr@tbs-sct.gc.ca.
The KPI project team acknowledges and appreciates the contributions of the following GoC employees, who have demonstrated both personal and organizational commitment to excellence in service. Without the continued development of accurate, analytical performance data, the improvement of service to Canada's citizens, businesses, and visitors would be significantly more challenging.
|
Paul Brousseau |
Canada Revenue Agency |
|
Denis C�sard |
Treasury Board of Canada Secretariat |
|
Michael Kelly |
Social Development Canada |
|
Marie Roussel |
Canada Revenue Agency |
|
Sue Smee |
Social Development Canada |
|
Colin Smith |
Canada Revenue Agency |
|
Darryl Somers |
Public Works and Government Services Canada |
|
Kyle Toppazzini |
Passport Canada |
The KPI project team wishes to express its appreciation for information supplied by David Eady of Q-MATIC and Paul Oude-Westeriende of WebTrends, Inc.
2. Implementing Service Delivery KPIs: Then, Now, and Future
The KPI project started with the help of public-sector service delivery managers responsible for the delivery of external services to citizens, businesses, and visitors to Canada. These experienced practitioners have developed business management expertise that maximizes the effective use of resources—employees, facilities, technology, and knowledge—within the limits of existing budgets to meet the service expectations of their clients. Service delivery managers within the GoC contribute and share best practices readily and are eager to understand and use new technologies, techniques, and methods to improve their service capabilities.
It is this community of practitioners that has identified the basic measures that are the foundation of daily management of operational service activities. Several industry standard measures, such as Average Wait Time or Service Level, are already in use by most major GoC service operations. The initial KPI project workshops were characterized by significant agreement on the primary measures used for both operational and strategic decision-making functions. During each workshop, participants reviewed practices, sources, and formulas for calculating measures. Terminology was compared and industry standard terms were quickly adopted. In several areas, the practitioners noted where current technologies would limit the capability or quality of data to calculate a KPI. (Note: These KPIs have been identified in the draft KPI document, and further work will be required to assess their viability and value to overall performance management.) With a consistent set of measures supporting MAF, the Secretariat proposes to use these measures for reporting systems, submissions, major Crown projects, and regular and routine GoC performance management reporting.
Data collection and reporting frequency have been a matter of considerable discussion within the performance measurement community. For those points of service employing management technology, service data are collected in real time (i.e. details on phone calls, visits, and Web traffic are collected as the service request occurs). Various reporting tools are used to aggregate these data. The most sophisticated tools, most frequently categorized as business intelligence software, provide the capability to extract reports on any frequency summarized by time interval.
The "roll-up" of departmental and agency performance data to present an enterprise (and strategic) view of government performance in external service delivery activities will require interoperable technologies, standard business processes, and a common view of the data.
The development of government-wide performance measurement practices is an ongoing priority for all departments and agencies. In the past two years, the Treasury Board has brought together measurement expertise from the private and public sectors to lay a foundation for external service delivery KPIs for both operational and strategic management. The current inventory of KPIs will remain a work in progress for several years.
In the short term, the Secretariat will reconvene the Performance Measurement Working Group and focus on the following tasks:
- finalize the current in-person and Internet measures;
- review the current proposed KPIs for completeness and feasibility;
- add standard cost indicators for all channels;
- complete a comprehensive and effective list of KPIs for the Mail/Back Office Channel;
- support implementation of KPIs across departments and agencies as a means to horizontally measure performance across channels; and
- submit a formal proposal to the Service Management Board to approve core and operational KPIs for consistent measurement across government.
In the medium to longer term, several projects are being conducted concurrently to complete the development of a standard cost and performance management framework for external service delivery. These include the following:
- creation of common service definitions;
- determination of data collection and reporting cycles;
- development of a service management framework incorporating standard service level agreements and associated objectives and indicators; and
- development of an enterprise-level dashboard.
The adoption of standard sets of external service delivery KPIs will:
- enhance the consistency of performance management across government;
- contribute to the utility of the emerging standard performance reporting systems and technologies;
- simplify new service-level agreements between policy and service delivery organizations;
- support benchmarking activity both within GoC and with other governments; and
- clarify executive briefings on external service delivery.
The Secretariat is also considering the benefit of establishing an ongoing Performance Measurement Working Group to be responsible for co-ordinating and implementing standard performance measurement methodologies across the federal government.
3. External Service Delivery KPIs: Summary
External service delivery KPIs have not yet been finalized, but as of the publication of this document, specific service channel KPIs have been either recommended for standard adoption or proposed for discussion within the GoC's Performance Management Community of Practice. All KPIs are listed in the Treasury Board's Guidelines for Core Key Performance Indicators: Interim Report on Primary Service Channels, September 2004, and can be found on the Secretariat's Web site at /si-as/kpi-icr/interim/interim00-eng.asp.
Readers of this document should be familiar with the GoC's overarching performance management approach. The Management Accountability Framework, described at /maf-crg/index-eng.asp, lists expectations for senior federal managers in terms of the current elements of their managerial responsibilities. The recommended KPIs for service delivery focus primarily on the operationally oriented MAF elements, Citizen-Focussed Service and Stewardship.
Two levels of external service delivery KPIs are documented:
- Core KPIs (Table 1) are proposed as required indicators monitored by the Treasury Board. These seven KPIs, which represent status and activity grouped into five themes, are considered the minimum measures required for performance reporting, operational analysis, and Treasury Board proposals.
- Operational KPIs (Table 2) are recommended by the Treasury Board as important measures used by service operations management for effective tactical and strategic decision making. These 11 KPIs, grouped into eight themes, represent the minimum set of measures that provide overall management awareness of a service operation.
The specific measures that comprise these KPIs are listed in Table 3. Each channel has specific definitions for these KPIs. It should also be noted that some measures are not applicable to all channels. For example, while Average Speed to Answer for phone service and Average Wait Time for counter-based in-person services are equivalent measures, there is no exact equivalent for Internet service.
Some KPIs, e.g. the Access KPI for the Internet Channel, are composed of several measures. In this example, weighted averages of Access volumes are calculated through a variety of linking strategies such as organic search engines, paid search placements, and direct addressing.
In addition, the service model has a direct effect on the practical collection of service measures. For example, a significant number of Canada's in-person service locations provide services in what can be called a "retail" model. Visitors enter a location and can browse for periodicals, brochures, and other printed information. They may choose to use self-service Internet workstations to search on-line for government information or they may use on-location phones to call directly for information. In many of these service centres, GoC staff are available as information consultants and may approach visitors or wait for questions at an information desk. This model is significantly different than higher-volume, transactional queued models such as Passport Canada, where queue management software provides strong measurement support.
The initial focus of the KPI project is to provide a standard vocabulary and definition for all GoC service delivery organizations. The initial version of external service delivery KPIs proposes KPIs for the Citizen-Focussed Service and Stewardship MAF categories. A "strawman" proposal related to the People MAF category is included in the KPI document. As these KPIs have not been reviewed with departments and agencies, we have not included them in this version of the usage guide.
Table 1: Proposed Service Delivery Core KPIs
|
MAF Category |
Theme |
Core KPI |
|
Citizen-Focussed Service |
Access |
Service Access |
|
|
Quality |
Quality (e.g. Accuracy, Professionalism) |
|
|
Client Satisfaction |
Client Satisfaction Level (CMT) |
|
Stewardship |
Resource Utilization |
Cost per Contact |
|
|
Channel Take-up |
Total Contacts (visits) |
Note: High-level core KPIs may be composed of several related measures, depending on the channel.
Table 2: Recommended Service Delivery Operational KPIs
|
MAF Category |
Theme |
Recommended KPIs |
|
Citizen-Focussed Service |
Access |
Abandonment Rate |
|
|
Quality |
Average Speed to Answer |
|
|
Client Satisfaction |
(see Table 1) |
|
Stewardship |
Resource Utilization |
Agent Capacity |
|
|
Channel Take-up |
Unique Contacts/Visits |
|
People |
Experience |
Staff on Strength |
|
|
Turnover |
Turnover Ratio |
|
|
Development |
Training Days/Agent |
Note: All measures for the People MAF category are proposals at the time of publication.
Table 3: External Service Delivery KPIs by Category and Channel
* Indicates that KPI is proposed as a core KPI; other KPIs are recommended for operational management.
|
MAF Category and Theme |
Phone |
Internet Channel |
In-person Channel |
|
Citizen-Focussed Service |
|||
|
Service Access |
*Call Access |
*Search Engine Rank |
*Visitor Access |
|
Delay Measures |
*Average Speed to Answer |
Average Visit Duration |
*Average Wait Time |
|
Quality |
*Answer Accuracy |
*Site Error Messages |
Answer Accuracy |
|
Client Satisfaction |
*Client Satisfaction Level |
*Client Satisfaction Level |
*Client Satisfaction Level |
|
Stewardship |
|||
|
Agent (Resource) Utilization |
*Cost per Call |
*Cost per Visit |
*Cost per Visit |
|
Service Effectiveness |
*First Call Resolution |
First Visit Resolution |
Turnaround time |
|
Use of Technology |
*Call Avoidance |
|
Self-service Ratio |
|
Channel Take-up |
*Calls |
*Visits |
*Visitors |
|
People |
|||
|
Service Experience |
Total Months on Strength (MOS) |
Total MOS |
Total MOS |
|
Employee Satisfaction |
Turnover Ratio |
Turnover Ratio |
Turnover Ratio |
|
Skill Development |
Agent Coaching Ratio |
Agent Coaching Ratio |
Agent Coaching Ratio |
4. Implementing Service Delivery KPIs for Phone Services
Overview
There are currently over 130 GoC call centres answering over 300million calls per year from citizens, businesses, and visitors.[1] These points of service have implemented a wide variety of technologies, business processes, and staffing strategies. Historical factors such as departmental mergers and new or changed legislation have all contributed to this "silo" service delivery model.
From the earliest days of the call centre business, a management commitment to measurement has contributed to building call centre performance into a near science. The service channel is itself strongly serviced by professional associations, academic research, a strong and highly visible network of experienced consultants, and comprehensive Internet resources. Agent resourcing models such Erlang C and Hills B are well documented and enthusiastically debated.
Today, GoC telephony service managers usually manage their service centres with the support of automated call distribution (ACD) technologies. The ACD receives inbound calls; routes them to automated scripts for screening, self-service, and categorization; and then places remaining calls in carefully monitored queues for specific agents or agent groups. Advanced ACDs route calls to appropriately skilled agents at other networked call centres as call loads grow. With so many options available to telephony service managers, the primary challenge for the Government of Canada is to identify a small set of core KPIs that can be used consistently and provide effective comparability on an enterprise basis.
Selected Management Tools
Unlike the other primary service channels, the Phone Channel is supported by a significant number of highly competitive vendors. Products such as Nortel's Symposium and Cisco's ICM have been strategic acquisitions for GoC departments. Because of the wide disparity in GoC call centre size, many small business solutions are also in use. Readers should also be aware that products such as ICM and Symposium have many components that are designed to integrate with existing technologies. It is realistic that some GoC centres may in the future use a combination of commercial products, depending on their requirements and budget."
Performance Management Example: Managing Phone Service at Canada Revenue AgencyCRA is well recognized for its efforts and investments in managing service channels. With a critical business requirement to provide extensive phone services to the taxpayers of Canada, CRA has developed, over decades, a strong management discipline and intensive technical skills in the management of large-scale call centre operations. CRA uses a high-capacity network to instantly respond to queues and peak calling periods. In the past two years, a consistent effort has succeeded in consolidating technologies. This has resulted in lower operating costs and better capabilities. CRA has relied on a disciplined management reporting process to collect and analyze operational performance measures on a weekly basis. Individual call centre managers complete structured reports that are filed with the corporate performance measurement team. Operational statistics and call patterns are discussed at a weekly conference call. By Friday, senior managers have last week's performance statistics at their fingertips! |
For the purposes of this report, we have selected products in use by Canada Revenue Agency (CRA) call centres as a representative sample to support this guide. These products include:
- Northern PBX (MAX 6, MAX 7)
- Centrex MAX 100
- Centrex Perimeter
- Nortel Symposium
At the time of publication, information concerning Cisco's ICM product had not been received; it may be added in a future revision. As the Secretariat does not endorse commercial products, contact information for vendors is not provided.
MAF Category: Citizen-Focussed Service
Theme: Service Access
The working group has identified three primary KPIs for measuring the ability of citizens to access a specific GoC phone service. Call Access is a call centre industry standard measure that measures the percentage of calls that are accepted by the ACD. Caller Access measures the percentage of unique phone numbers accepted by the ACD. Both measures are primary indicators of customer satisfaction. Abandoned Calls measures callers who successfully accessed the phone service but chose to hang up either as a result of prolonged waiting for agent service or as a result of not finding a relevant answer through the interactive voice response (IVR) self-service feature.
There are some telephony management configurations that can directly affect these indicators. For example, some GoC call centres advise callers of expected wait times while queued for an agent. Many callers choose to terminate their call at that point—this is commonly measured as an IVR termination within the service threshold, i.e. a "successful" completion. Other GoC call centres advise callers requesting agent service that the wait period exceeds the service level threshold (i.e. 90% of calls answered within four minutes), provide advice to call later, or try an alternate channel and terminate the call. These calls should be considered as a service refusal and counted appropriately.
Call AccessPercentage of calls presented that get into the ACD (Calls Answered + Calls Abandoned) X 100 |
Caller AccessPercentage of unique callers who get into the system
Total Unique Telephone Numbers Completed X 100 |
Calls and Callers: Vendor Specifics
|
System |
Source |
|
Northern PBX (MAX 6/7)
|
Report Name: ACD-DN Route Performance |
|
Centrex MAX 100
|
Report Name: Summarized ACD-DN Call Analysis |
|
Centrex Perimeter |
Report Name: Demand and Resource |
|
Symposium |
Report Name: Taken from CDN statistics |
Abandoned CallsPercentage of clients who hang up before receiving service whether within IVR or waiting for agent service. (Queued Calls Abandoned + IVR Calls Abandoned Before
Service) X 100 |
Not all ACD technologies provide GoC managers with the ability to distinguish successful IVR hang-ups from unsuccessful call terminations. If possible, managers should include only unsuccessful call terminations within this metric. However, if impractical, managers can program their technology to identify all voluntary terminations or hang-ups.
Abandoned Calls: Vendor Specifics
|
System |
Source |
|
Northern PBX (MAX 6/7) |
Report Name: ACD-DN Route Performance |
|
Centrex MAX 100 |
Report Name: Summarized ACD-DN Call Analysis |
|
Centrex Perimeter |
Report Name: Demand and Resource |
|
Symposium |
Report Name: Taken from CDN statistics |
MAF Category: Citizen-Focussed Service
Theme: Delay Measures
Once a citizen or business has successfully accessed a GoC call centre service, the caller might successfully self-serve through IVR capabilities. If self-service is not an option, or if the caller prefers agent assistance, the caller will likely be placed in a call queue to await the availability of an appropriately skilled service agent. Callers may have low tolerance for waiting and research indicates that "delay awareness" occurs on average after 120 seconds. Depending on in-queue messaging, call complexity and service expectations, callers will develop negative opinions of service as the delay to service grows.
All managed call centres use the measure Average Speed to Answer (ASA) and compare it to the performance target Service Level in day-to-day management of telephone-based service. This measure is so directly linked to Client Satisfaction that some GoC call centres will temporarily restrict access to the ACD or to agents if service levels are not being maintained. Another way of managing Service Level is to increase the service capacity either through additional agents or by improving agent adherence to schedule.
Average Speed to Answer (ASA)Average length of time that callers who have reached the ACD wait in the queue before being answered by an agent |
Average Speed to Answer: Vendor Specifics
|
System |
Source |
|
Northern PBX (MAX 6/7) |
Report Name: Summarized ACD-DN Performnce |
|
Centrex MAX 100 |
Report Name: Summarized ACD-DN Call Analysis |
|
Centrex Perimeter |
Report Name: Incoming Traffic Analysis Report |
|
Symposium |
Report Name: Performance application |
Service LevelPercentage of calls that reach an agent or are abandoned within a specified time threshold (T); T represents a service threshold considered reasonable, e.g. 120 seconds.
(Calls Answered Within T + Calls Abandoned Within T) X 100 |
| Usage Tip: In plain language, calls answered or abandoned within the call centre's threshold have been served within a reasonable time frame. These calls have a positive impact on service levels. Calls answered after the threshold, although still servicing clients, have a negative impact on service levels. |
Service Level: Vendor Specifics
|
System |
Source |
||||||||
|
Northern PBX (Max 6/7) |
Report Name: Summarized ACD-DN Performance |
||||||||
|
Centrex MAX 100 |
Report Name: Summarized ACD Group Performance |
||||||||
|
Centrex Perimeter |
Note: Grade of Service calculated by Perimeter does not include abandoned calls. Three separate components will be required in order to determine the service level.
|
||||||||
|
Symposium |
Service Level field does not exist in standard reports. Customized reports using tools such as Excel, Access, Crystal, or Impromptu must be developed. |
MAF Category: Citizen-Focussed Service
Theme: Quality Measures
Once access to service has been gained and wait time has elapsed, the service agent will interact with the caller and deliver some type of service, whether it be a referral, information, or help with processing a specific transaction such as a filing or an address change. Quality measures are indicators that provide analytical evidence in response to questions such as the following: Did the caller get the result needed? Was the interaction delivered with efficiency, clarity, and sensitivity? This type of subjective assessment of a service call requires evaluation of the entire interaction by a third party (e.g. a coach, team leader, or supervisor) either monitoring the call in real time or listening to a recording of the call afterwards.
A secondary technique used to collect quality information is the survey. GoC departments and agencies are directed to assess client satisfaction annually. Most commonly, surveys are conducted on a regular schedule using external customer satisfaction measurement suppliers. The Common Measurements Tool or CMT (see http://www.iccs-isac.org/eng/cmt-about.htm) developed by the Institute for Citizen-Centred Service is the de facto standard for public-sector client satisfaction measurement.
In the private sector, large companies also employ automated voice surveying techniques. ACD scripts can be used to conduct a voluntary and short survey after call completion, which provides a "near-time" assessment of client satisfaction. Another innovative development is automated callbacks. Callers abandoning the agent queue are called back a few hours later by an automated calling program. This program invites the client to complete a short survey and then offers to transfer the client to an available agent immediately after the survey. The ACD directs clients choosing agent service to an appropriately skilled agent, based on the survey results.
The GoC KPI working group identified two measures for quality. Professionalism is one of the criteria assessed using the CMT. It includes highly valued factors such as vocabulary, courtesy, and sensitivity. The second is Answer Accuracy, which is a difficult measure to compile, as it requires either an exit survey to be completed by callers (possibly an imprecise technique) or call monitoring, an expensive and resource-intensive commitment.
These measures are collected independently of ACDs and have no vendor-specific usage information.
MAF Category: Citizen-Focussed Service
Theme: Client Satisfaction
Overall Client Satisfaction is an important strategic measure. Readers may remember one of the early themes describing government service transformation was "10 by 5"—a goal of improving overall citizen satisfaction by 10 percentage points by 2005. The emphasis on "ClientSat" is necessary and important—the caller's overall perception of satisfaction is a fundamental outcome of service delivery.
Two measures have been proposed for this theme. The overall Client Satisfaction rating as compiled by the CMT is the primary measure. As previously discussed, this measure is determined through periodic surveys of citizens and businesses. Complete details can be found at http://www.iccs-isac.org/eng/cmt-about.htm
The second measure, Service Complaints, has been clearly identified by the working group but is difficult to compile at this time. Effective recording and tracking of service complaints requires integration of client contact information across all channels. For example, in 2003, significant complaints were received via e-mail concerning the accessibility of phone service for a government service. Many complaints are sent to ministers' offices, where they are tracked by separately managed ministerial correspondence systems. Even within the phone channel, many programs do not systematically record a call result against a call record. Over the coming years, the performance measurement community will address this measure to determine its contribution, cost, and value to overall service measurement practices.
No vendor-specific implementation guidelines are required for either measure.
MAF Category: Stewardship
Theme: Agent (Resource) Utilization
Once a client has successfully accessed a GoC call centre service, the client experience depends on the ability and skill of the agent. Call centre managers primarily assess the overall agent performance by consistently monitoring several measures that collectively provide an accurate assessment of the use of agent skills. Executives tend to place high value on the measure Cost per Call, which provides a good overall indication of call complexity, agent utilization, and the value of self-service via the IVR scripts. The various measures of Agent Utilization—specifically Agent Capacity, Resource Allocation, Agent Adherence, and Agent Occupancy—provide a sound operational assessment of both short- and long-term use of labour within the call centre team.
It should be noted that these measures are closely related. While Capacity and Resource Allocation provide a relatively static assessment of the overall team capacity, the dynamic Adherence and Occupancy measures show how day-to-day agent behaviour directly influences client service. Agent Occupancy is the amount of time an agent spends in direct customer service, while Adherence measures the amount of scheduled time that an agent is available to provide service. As Occupancy increases and there are fewer and fewer seconds between calls, agents will naturally protect themselves by reducing schedule adherence through, e.g. longer breaks and earlier log-outs for meetings.
Skilled call centre managers establish the right balance between Occupancy and Adherence and carefully monitor Agent Utilization on an individual basis. Departments, agencies, and other stakeholders are primarily interested in the roll-up of the entire agent team—effectively calculating Occupancy and Adherence for the call centre.
This section reviews the definitions, implementation characteristics, and vendor specifics related to Agent Utilization measures.
Cost per CallTotal operational cost of the call centre divided by the number of calls accepted |
This measure taken for the reporting interval provides strong trend information on overall call centre efficiency. Measures for Call Access (ref: page 16) are used as the volume measure. The working group has noted that there is inconsistency in how total operational cost is calculated, specifically related to the inclusion of facilities costs.
Agent AdherencePercentage of a day that we can reasonably expect an agent to be logged onto the ACD Total Time Logged onto ACD (Talk, Wait, and Wrap-up) X 100 =
% Adherence |
Adherence is a key performance indicator for individual agent performance and the performance of a callcentre as a whole.
For example, a call centre operation might plan that agents should be logged on 80 per cent of their scheduled hours of work after excluding leave and formal training. While logged onto the ACD, agents should be speaking to a client, wrapping up the call, or waiting for the next call. Non‑telephone related activities should be accomplished within a 20 per cent allowance. Examples of non‑telephone activities include other assigned duties such as callbacks and counter service, meetings, coaching time, supervisor discussions, breaks, and reading or writing e-mails.
Agent OccupancyPercentage of time agents are logged onto the ACD system and are either speaking with a client or completing paperwork related to that specific call % of Talk Time + % of Wrap-up Time |
Agent Adherence and Occupancy: Vendor Specifics
|
System |
Source |
|
Northern PBX (MAX 6/7) |
Report Name: Agent by ACD-DN Performance (Shows performance for all
queues worked by an agent) ACD-DN by Agent Performance (provides statistics for agents' performance on a specific queue) |
|
Centrex MAX 100 |
Report Name: Agent Summary |
|
Centrex Perimeter |
Report Name: Agent Performance |
|
Symposium |
If agents work in more than one skill set for the period, it is not possible to accurately calculate Occupancy by application or by skill set using the standard reports supplied with Symposium. |
MAF Category: Stewardship
Theme: Service Effectiveness
The call centre industry places high value on First Call Resolution (FCR) as the most important indicator of overall service effectiveness. Many experts in the Phone Channel believe that this measure reflects the skills and training of agents, the structure and content of IVR scripts, answer accuracy, and the overall effectiveness of a specific phone service.
First Call Resolution is the ability of a call centre to completely satisfy the caller's service request on first contact. In its strictest interpretation, this typically involves either successful service for a specific phone number within the IVR script or a successful result while talking to the first agent (i.e. no escalation or call transfer). Other call centres measure FCR after a triage agent has assessed the caller's need and directed the caller to an appropriate agent. A caller can recognize when a specific call centre is measuring FCR by the agent's "wrap-up" talk. If the agent asks, "Have I answered your question completely?" or "Do you have any other questions at this time?" an FCR result is likely being recorded.
FCR in the public sector is more challenging. Many services are anonymous by design and intentionally do not record phone numbers. Other services do not record a call result against a client record as a matter of privacy practice. While some effort has been made to look at repeat callers within a threshold, e.g. the last 24 hours, this measure is not considered to be accurate.
The working group believes that consistent result recording is the basis for accurate FCR calculations. The working group will enhance the definition of Service Effectiveness measures within the Phone Channel, and emphasis will be placed on determining the utility of an FCR‑type measure.
MAF Category: Stewardship
Theme: Use of Technology
IVR technology is a flexible and comprehensive programmable tool. Once clients are able to access a GoC service by phone, they are most frequently greeted by an automated script that asks them to self-select on criteria presented in the IVR's voice script. GoC call centre managers implement IVRs to handle high volumes of simple inquiries (e.g. "Press 1 to hear our service hours"), to broadcast service status to callers ("We are currently experiencing a heavy load of callers and wait times are beyond our standard of three minutes"), or to react to external events that cause unusual peaks in call volumes (e.g. recent billing problems with a major telephone company). When used judiciously, technology can significantly improve service levels by deflecting these types of calls away from agent queues.
The working group defined two specific measures addressing Use of Technology. Call Avoidance counts the number of callers who hang up immediately after an early "broadcast" message. Hang-ups after the broadcast message are assumed to be successful calls in that the caller likely received the correct answer or has decided to access the service at a later and, potentially, off-peak time. Calls Answered by IVRmeasures the percentage of calls that were either a) terminated by the caller after a content message was delivered or b) terminated by the caller within the IVR script. While the first definition provides a more accurate measurement of successful service, not all ACDs have the feature to mark specific portions of the IVR script as a successful completion.
Call AvoidancePercentage of clients who are answered within the IVR within the time threshold (T)
Total Calls Completed in IVR Within T Seconds X 100 |
Calls Answered by IVRPercentage of clients who are answered within the IVR
Total Calls Completed in IVR X 100 |
MAF Category: Stewardship
Theme: Channel Take-up
During the service transformation period, senior GoC executives involved in service delivery place high value on channel take-up volumes. A modification to a Web site may have a dramatic positive or negative impact on call volumes, for example. Channel Take-up refers to the basic volume measures of the channel/call centre. Calls are counted by all ACD devices as a primary function. Callers,i.e. the number of unique phone numbers calling within a specific interval, are also reported by the network or trunk line vendors.
Calls and Callers: Vendor Specifics
|
System |
Source |
|
Northern PBX (MAX 6/7) |
Report Name: ACD-DN Route Performance and |
|
Centrex MAX 100 |
Report Name: Summarized ACD-DN Call Analysis |
|
Centrex Perimeter |
Report Name: Demand and Resource |
|
Symposium |
Report Name: Taken from CDN statistics |
5. Implementing Service Delivery KPIs for Internet Services
Overview
The measurement of on-line service delivery within the Canadian federal government is a complex and dynamic function. With over 800 federal Web sites built on diverse, incompatible technologies, it is a time-consuming challenge to develop effective multi-program measurement processes. Basic measures such as referral accuracy are difficult to acquire because of the nature of the Internet. The government's mandate to protect personal privacy and sensitivity toward recording personal transactions adds an additional cost in analyzing visitor and site performance.
Service Management Example:Consolidating Web sites at Social Development CanadaSocial Development Canada (SDC), with its colleagues in Human Resources and Skills Development Canada (HRSDC), completed a large consolidation of over 100 Web sites. By investing heavily in classification and organization of their content, the departments were able to eliminate over 75 per cent of their total Web pages. Common HELP, FAQ, and Contact Us services have simplified site visitor support. SDC and HRSDC have built on this success by launching several strategic on-line services. |
This section provides a guide to deriving the recommended key performance indicators for the Internet Channel using a commonly installed commercial product. Readers should note that no one product currently provides a complete site performance management framework. Other products, such as on-line satisfaction surveys, general report writers, and analytics software, round out the performance measurement tool box. For example, it is common to export site traffic logs to Excel spreadsheets for detailed analysis.
Selected Management Tool
WebTrends 7.1 is the current production version of the Web measurement tool set that is the most prevalently deployed tool within the federal government. WebTrends provides extensive reporting for a wide variety of Web traffic measurement needs.
MAF Category: Citizen-Focussed Service
Theme: Service Access
For service delivered through the Internet Channel, the access theme includes measures concerning the availability of the site to potential site visitors. There are two primary components to site availability:
- How easily can site visitors locate the site through search engines, links from other sites, or publication of the URL through other channels such as the telephone and mail?
- Is the site available for site visitors once it has been located?
Usage TipWeb site activity measurement is based on detailed understanding of Web technologies, tracking techniques and technologies, and various session management approaches such as persistent cookies. With the rapid development of anti-spam and anti spyware technologies, experienced Internet consumers now have the capabilities to routinely delete or manage cookies. This has weakened the utility of those measures that rely on session-tracking technologies. |
Other qualitative characteristics contributing to access include compliance with W3C accessibility standards to ensure the site is fully inclusive and available to persons with disabilities.
The overall KPI, Service Access, is composed of a combination of indicators reflecting site visitors' ability to a) locate the site, b) access the site supported by adequate and operational servers, and c) complete specific transactions or locate specific information without abandoning the visit. The following measures provide an initial assessment of these visit events.
Search Engine RankingRelevance ranking or position rank weighted from the distribution of site visits that entered the site through commercial search engines. If actual relevance rank (Relevance %) is available, this should be used. If it is not available, the position of GoC Web site in Search Results List (SRL) should be used (Position 1=100%, 2=90%, 3=80% and so on). Search Rank is calculated on the weighted average of search ranks for all visits accessing the site through search referrals. |
Direct Access RatingPercentage of visits that accessed the site directly without a referring site |
Planned Referral RatingPercentage of total site visits from planned referral sites Visits through links from related sites such as gateways and clusters should be weighted as high value in assessing site access. It is calculated as a percentage of total visits. |
Site Access Measures: Vendor Specifics (WebTrends)
|
Measure |
Source |
|
Search Engine Ranking |
Report Name: Most Recent Search Engines (Paid) This report would be used only when the GoC site uses a paid sponsor service, such as Yahoo or Google. Report Name: Most Recent Search Engines (Organic) WebTrends identifies all search engine referrals that are not paid or sponsored as "organic." Analysis by CRA indicates that these visits represent a significant percentage of all site traffic. See Figure 5-1. |
|
Planned Referrals Direct Access Ratio |
Report Name: Visits by Referring Sites This report shows both site referrals and direct access within any specified period. See Figure 5-2. |
Usage TipTo extract the actual search position on the search results page, a script must be developed to use phrases actually used by site visitors looking for the site. The Search Result Position can then be weighted by the percentage of visits using each search engine / search phrase combination. |
Figure
5-1: WebTrends Most Recent Search Engine Report
Figure 5-2: Visits by Referring Sites Report (WebTrends)
Usage TipSome proxy servers and security software tools strip out the referring URL. Many Web-metric tools, including Web Trends, categorize these separately as hidden or masked referrers. Some tools will include these visits as Direct Access. |
Server AvailabilityTotal available server hours over total planned server hours during the reporting period |
Usage TipMost large Web sites are configured with multiple servers, extensive redundancy, and strong load-balancing capabilities. Loss of a specific server typically results in slower visits (i.e. page serves) as opposed to non availability of the site. The primary value of using a server ratio to weight overall service access is to reflect any significant variances in service rather than specific complete shutdowns. |
Server Availability data are available from the specific server logs that host Web server software. Logging tools within the popular Web servers, such as Apache or Microsoft's IIS, can be used to provide specific outage information for integration with other access measures.
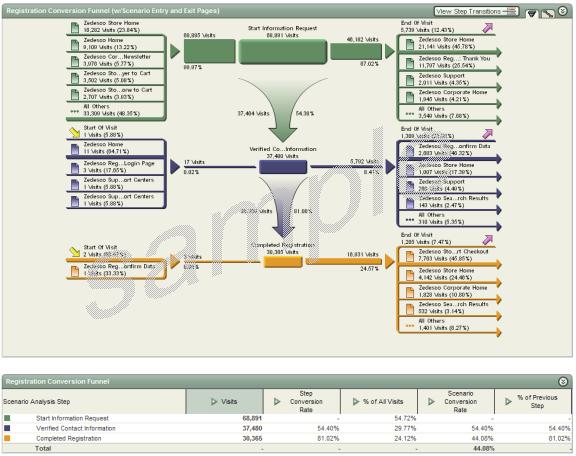
Conversion RateTotal visits reaching submit pages divided by total visits viewing transaction start pages This measure requires mapping specific Web site pages to a transaction model. When appropriate start and finish pages are defined, Web measurement tools automatically calculate the conversion rate (as well as exit and abandonment rates). Figure 5-3 provides a visual example of WebTrends using their scenario model. |
Figure 5-3: Scenario Modelling and Conversion Rate Analysis (WebTrends)
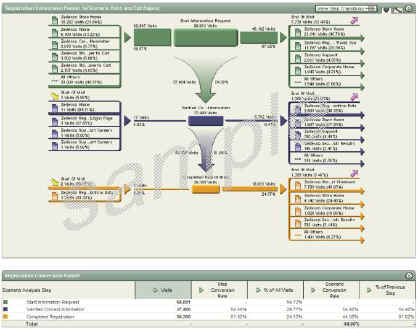
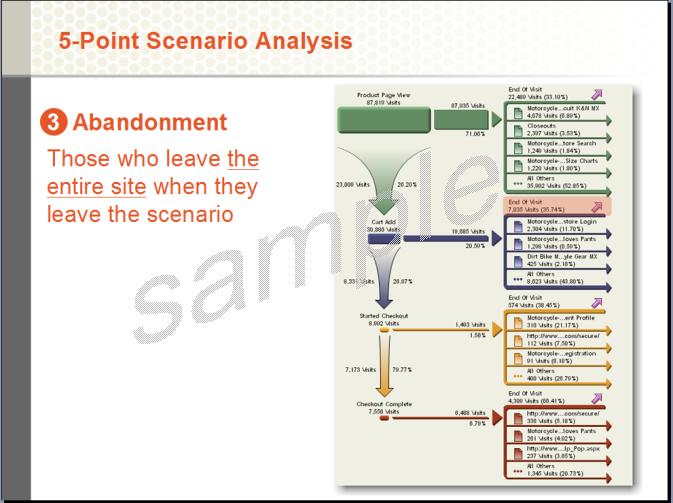
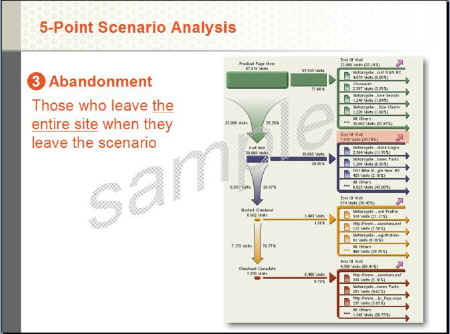
Abandonment RateRate at which visitors initiate transactions but do not reach the submit page plus visitors exiting the site from non-content pages This measure requires mapping specific Web site pages to a transaction model. When appropriate start and finish pages are defined, Web measurement tools automatically calculate the conversion rate (as well as exit and abandonment rates). Figure 5-4 provides a visual example of the use of WebTrends' scenario model to calculate abandonment. |
Figure 5-4: Calculation of Abandonment (WebTrends)
MAF Category: Citizen-Focussed Service
Theme: Delay Measures
The obvious impact of delay in a phone service queue or while standing in line waiting for counter service does not have a direct parallel within the Internet Channel. While computer users accessing government services will experience various delays, in many cases these delays are attributed to client machine configurations, Internet congestion, or Internet service provider service degradation. The industry has approached measurement of Internet delay through the use of client computer resident programs that monitor page views in real time.
Unfortunately, due to abuse of these capabilities and warranted concern about invasive "spyware" programs, these technologies are neither popular nor prevalently used. Only Comscore's MediaMetrix provides an assessment similar to a Neilson Rating through the use of volunteers to install proprietary software that tracks actual Internet usage. Specific reports and custom research is available, at a price, from the company.
Usage Tip: The Last Page and Visit DurationIn most cases, the total time on a site is not accurately measured. Only the time between first page request and last page request is recorded. |
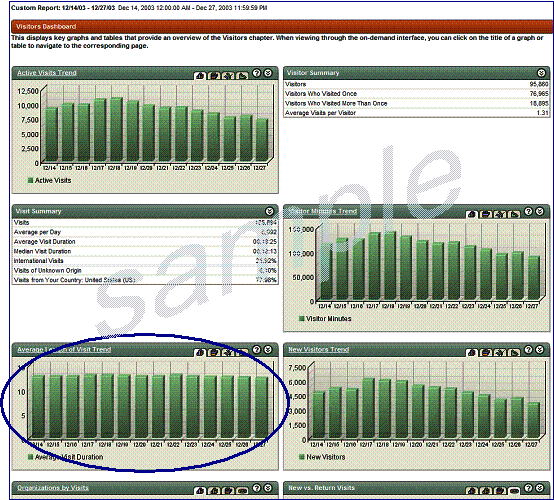
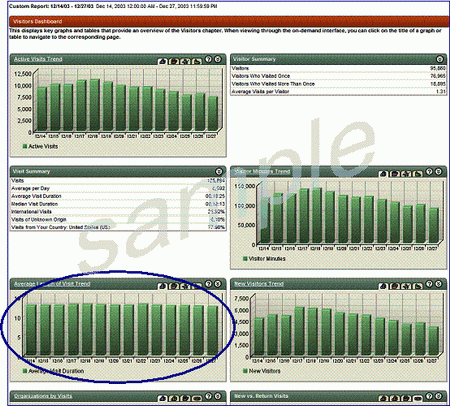
The working group has determined that Average Visit Duration might indicate a client's experience of delay. As take-up of more complex transactions continues to grow, this metric will reflect this shift from informational to transactional service.
Average Visit DurationDuration within measurement interval period Total Elapsed Seconds from Site Entry (any page) to Site
Exit |
A custom WebTrends report can be configured to provide information on visits, including visit duration. This can be organized by specific page, using any defined measurement interval. Figure 5-5 shows a sample report taken from WebTrends' product documentation.
Figure 5-5: Visit and Visit Duration Dashboard (WebTrends)
MAF Category: Citizen-Focussed Service
Theme: Quality
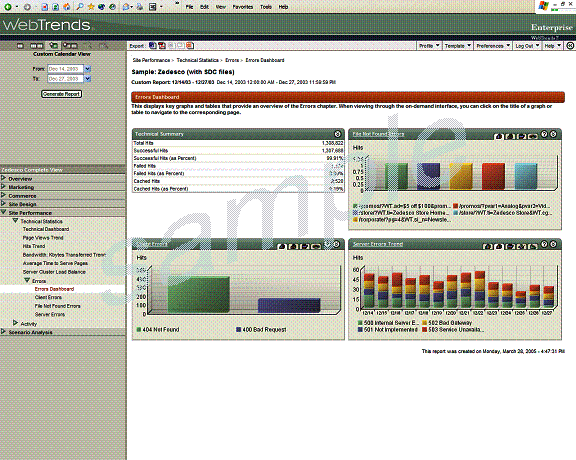
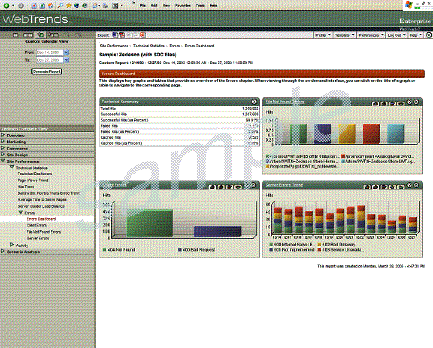
The working group has agreed that two measures are practical and feasible indicators of site quality. Monitoring and reporting on errors such as "page not found" that occur during visits are simple functions. Site Error Messages is the count of these error events over a specific measurement interval. The ratio of error events to site visits gives a straightforward indication of overall site quality.
Content errors, visitor suggestions and criticisms, and overall client satisfaction must be assessed in other ways. It is recommended that specific "contact us" features be designed for site visitors to easily categorize and report all Internet Channel feedback. While feedback on the Web site will be received through other channels, some working group members conjecture that the Internet will provide a disproportionate share of the overall citizen feedback. If a contact‑us feature is designed to collect feedback, Web-monitoring tools such as WebTrends can easily count the number of submissions.
The working group has also recommended limited use of Professionalism.While not directly applicable to the primary self-service capabilities of the Internet Channel, all organizations that respond to client e-mail have quality review processes in place. These reviews can be assessed as a percentage of total responses. This is not dependent on the Web-monitoring tools but is typically managed through specific e-mail features within the call centre tool set.
Site Error Message RateWithin Measurement Interval Period
Total Error Page Views X 100 |
Figure 5-6: Error Dashboard Report (WebTrends)
MAF Category: Citizen-Focussed Service
Theme: Client Satisfaction
The working group recommended use of CMT (http://www.iccs-isac.org/eng/cmt-about.htm) as the primary tool for collecting Client Satisfaction ratings for the Internet Channel. While the primary delivery mechanism of this instrument is through live or phone-based interviews, Canada Post has noted that they get good results from an automated survey within their site. This survey is programmed quarterly to invite a random sample of site visitors to participate in a short quality survey.
As with other service channels, a second measure, Service Complaints,has been identified by the working group. It is somewhat easier to collect within the Internet Channel but has not been systematically analyzed by departments and agencies at this time. Preparation of an effective contact‑us feature is a prerequisite. If GoC Common Look and Feel standards are followed, the contact‑us button on the top bar will direct site visitors to a feedback or inquiry page. This page can be structured to allow site visitors to categorize their feedback or complaint. Several members of the working group believe that the primary channel for Internet service feedback will be e-mail or the contact‑us message form.
No vendor-specific implementation guidelines are required for either measure.
MAF Category: Stewardship
Theme: Agent (Resource) Utilization
GoC executive management places high value on the comparability of cost per interaction across channels. While the various measures of Agent Utilization have less overall impact in the Internet Channel, the overall cost per visit remains an important but challenging measure to calculate.
When Internet Channel service is supported by dedicated agents, the normal call centre KPIs for Agent Utilization apply.[2] In these "agent-assisted" environments, the ACD or an integrated telephone/IP contact centre management tool typically manages Agent Utilization statistics. In either case, the specific guidelines listed in Section 4 provide value to the service manager.
This section reviews the definitions, implementation characteristics, and vendor specifics related to Resource Utilization measures.
Cost per VisitTotal operational cost of the Web site(s), divided by the number of visits within the reporting interval |
The Cost per Visit for the reporting interval provides strong trend information on overall Internet Channel efficiency. The working group has noted that there is inconsistency in how total operational cost is calculated. A standard definition for Internet operational cost will be developed in the future.
Web-monitoring tools provide export capability to load traffic data into popular tools such as Excel or Crystal reports. As a guideline, managers should export visit and visitor data and then apply itemized costs to determine a cost per visit. WebTrends provides specific features to support the integration of its monitoring data with external report writers.
Figure 5-7: SmartReports Integration (WebTrends)
Other Agent Utilization measures can be tracked for agent-assisted calls concerning the Internet Channel and for all messages and e-mails submitted through the Web site. The following are recommended as operational measures. Specific implementation details are discussed in Section 4.
Agent AdherencePercentage of a day that we can reasonably expect an agent to be logged onto the ACD
Total Time Logged onto ACD (Talk, Wait, and Wrap-up) X 100 =
% Adherence |
Agent OccupancyPercentage of time agents are logged onto the ACD system and are either speaking with a client or completing paperwork related to that specific call % of Talk Time + % of Wrap-up Time |
MAF Category: Stewardship
Theme: Service Effectiveness
The working group has proposed First Visit Resolution as an interim proposal, pending further discussion and investigation. This indicator parallels in-person and phone indicators.
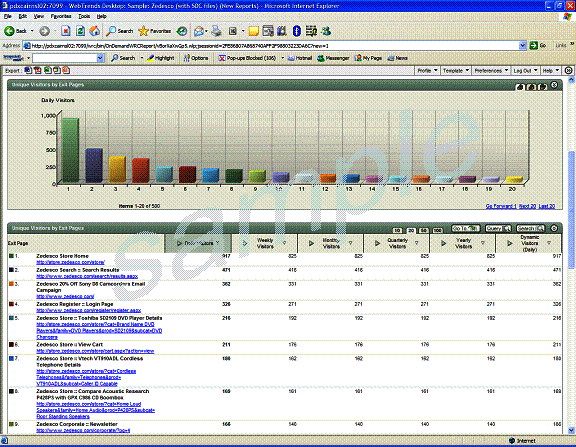
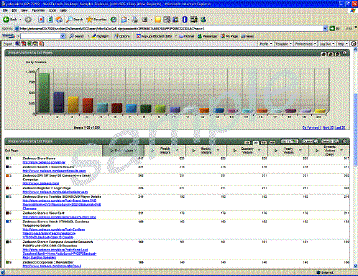
First Visit ResolutionUnique visitors over interval period (one day) who exited the site from content pages |
A customer report for daily, weekly, monthly, quarterly, or annual unique visitors can be combined with a filtered exit pages report to target the exit points by unique visitor. Unique visitor is not a cumulative measure in this report
Figure 5-8: Visitor/Exit Page Analysis (WebTrends)
MAF Category: Stewardship
Theme: Channel Take-up
Channel Take-up rates and volumes are a fundamental measure. For example, a modification to a Web site may have a dramatic positive or negative impact on call volumes. Visits and Visitors are tracked by all Web measurement tools. Readers are cautioned to read the usage tip concerning session tracking on page 39.
VisitsTotal site visits served during reporting period. |
Figure 5-9: Visitors Dashboard Report (WebTrends)
VisitorsUnique visitors counted either through registration/log-in processes or via cookies |
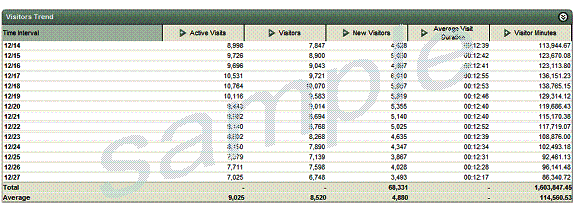
Figure 5-10: Visitors Trend Report (WebTrends)
6. Implementing Service Delivery KPIs for In-person Services
Overview
Performance Management Example: Managing In-person Service at Passport CanadaPassport Canada is a charter member of the working groups on performance measurements. In-person services is the primary service channel for Passport Canada, and its experience in the channel is reflected in its state of the art management practices. Among the first of GOC organizations to automate service locations, Passport Canada uses Q-MATIC software to handle all queues. While the service model will vary depending on the demand and location of a centre, Passport Canada has precise measurement data to support its configurations. In Passport Canada offices, a receptionist greets a visitor and ensures the person has the proper documents. If the visitor is prepared for counter service, a ticket is issued and the visitor enters the waiting room. The technology manages the queue, automatically assigning each visitor to an appropriate agent. In some cases, priority cases may be handled. Activity data are transmitted to a departmental database and integrated into a data warehouse. Performance reports are generated, reviewed by analysts, and quickly integrated into management reports for rapid circulation. |
With over 600 offices providing scheduled and walk-in services to citizens, businesses, and visitors, the In-person Channel is a complex and expensive enterprise.
In-person services are delivered using a wide variety of business models. Service Canada storefronts provide walk-in referrals. Industry Canada's Business Service centres are retail operations with stocked shelves and on-premise consultants. Scheduled appointments are the norm in other departments. Passport runs high-traffic queued counter services to verify and process passport applications. Many departments run outreach programs—scheduled seminars and courses that provide service in a classroom or instructional format. Queued service models are supported by automated tracking and queue management tools.
Selected Management Tool
One tool is in prevalent use for those in-person locations using the queued service model. Q‑MATIC software provides a comprehensive automation platform for queued service models. We have selected this product to provide examples for implementing KPIs for the In-person Channel.
MAF Category: Citizen-Focussed Service
Theme: Service Access
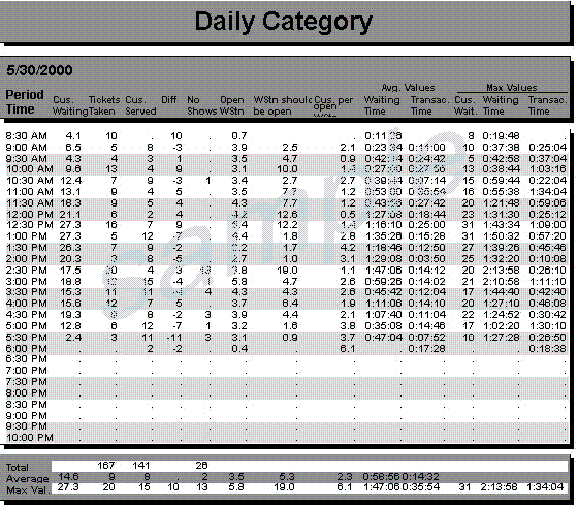
The working group has identified two primary KPIs for measuring the ability of citizens to access a specific GoC service in person at a GoC service office. Visitor Access is the fundamental measure for the number of visitors who request service at a GoC location. In queued service models, this will be the number of people who receive or take "tickets" and will not include people who arrive at the reception desk but do not enter because of the screening conversation with the receptionist. Visitors Serviced measures those visitors who received service from an agent after receiving a service ticket.
Other in-person service models may implement equivalent or near-equivalent measures. For example, "retail" models such as Industry Canada's Business Service centres, may count the number of visitors entering their storefront locations. Outreach programs should report on the number of registrants.
Visitor AccessNumber of visitors receiving or taking a service ticket |
Visitors ServicedPercentage of visitors who received a service ticket and were serviced by an agent |
Visitor Access and Visitors Serviced: Vendor Specifics (Q-MATIC)
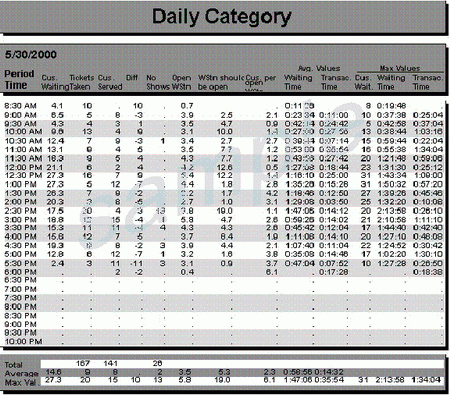
This information can be found in a number of standard Q-MATIC reports including the daily, weekly, and annual category reports and the daily, weekly, and annual workstationreports. Figure 6-1 shows an example of a Daily Category report.
Figure 6-1: Category Report (Q-MATIC)
MAF Category: Citizen-Focussed Service
Theme: Delay Measures
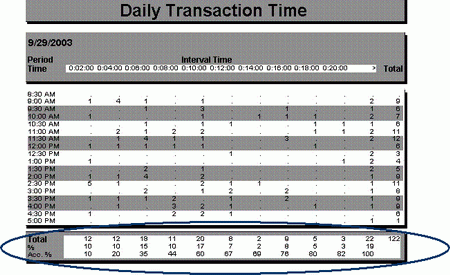
In most of the higher-volume programs that provide in-person services, visitors arrive at the service centre and are greeted by a receptionist. Most queue management systems are able to track the service experience from the time a visitor takes or is given a numbered ticket. All queued service models focus on Average Wait Time (AWT) as one of the most important indicators of customer satisfaction. AWT is the time from initial receipt of the service ticket to the time the client begins service with an agent at the counter. Transaction Time is the duration of the counter service experience. Total Visit Time therefore is the total of Wait Time and Transaction Time.
As with the queued phone service model, the performance target for many in-person service centres is called Service Level. It is expressed as a percentage within a threshold target, e.g. 85 per cent of all clients will be served within 15 minutes. Clearly, Service Level is a primary indicator of customer satisfaction and it is tracked continuously against the published target level.
Average Wait Time (AWT)Average length of time that visitors who have received a service ticket wait prior to receiving service from an agent |
Service LevelThe percentage of visitors who receive service from an agent within a specified time threshold (T); T represents a service threshold considered reasonable, e.g. 20 minutes. Visitors Serviced Within T X
100 |
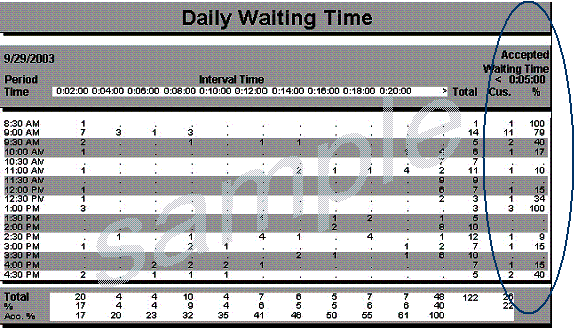
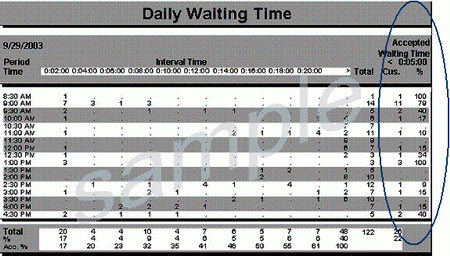
AWT and Service Level: Vendor Specifics (Q-MATIC)
The Waiting Time reports (daily, weekly, and annual) provide these data. Average Wait Time is found in the column Accepted Waiting Time < T, where T is the Service Level threshold. Figure 6-2 is an example of such a report.
Figure 6-2: Daily Waiting Time Report (Q-MATIC)
MAF Category: Citizen-Focussed Service
Theme: Quality Measures
Quality measures are indicators that provide analytical evidence in response to questions such as the following: Did the visitor complete the service transaction with the agent successfully? Was the interaction delivered with efficiency, clarity, and sensitivity? This type of subjective assessment of a service call requires evaluation by a supervisor by watching the interaction.
Another method used to collect quality information is the survey. GoC departments and agencies are directed to assess client satisfaction annually. Most commonly, surveys are conducted on a regular schedule using external customer satisfaction measurement suppliers. The Common Measurements Tool, or CMT (see http://www.iccs-isac.org/eng/cmt-about.htm), developed by the Institute for Citizen-Centred Service is the de facto standard for public-sector client satisfaction measurement. Employment Insurance offices have had some success with kiosk-style survey machines placed along exit paths in some in-person offices.
A third method that is not commonly used in the public sector but may prove valuable in the future is the "mystery shopper." A company is hired to place professional customer service analysts in specific in-person service programs. The service experience, conducted without the knowledge of the agent, is documented carefully and analyzed within the context of multiple evaluations. This particular type of measurement process is expensive and requires careful management of the employer‑employee relationship.
The GoC KPI working group proposed four measures for quality. Answer Accuracy requires either a post-visit survey to be completed by clients or supervisor assessment of the service interaction. Professionalism is one of the criteria assessed using the CMT. It includes highly valued factors such as vocabulary, courtesy, and sensitivity. Transaction Duration Variability has been proposed as a measure that correlates with quality. However, the working group has not analyzed this measure in detail. Finally, Critical Error Rate counts those transactions accepted at the counter that cannot be completed due to missing or erroneous information. This measure, primarily useful for those services that are high volume and transaction-based, can be tracked accurately within most of the "back-office" transaction processing systems. Readers should note that pending further analysis and definitional work, the working group has not yet recommended any of the above as a core measure.
Answer Accuracy and Professionalism as measures are not directly supported by the service management technologies. Transaction Duration Variability and Critical Error Rate are supported.
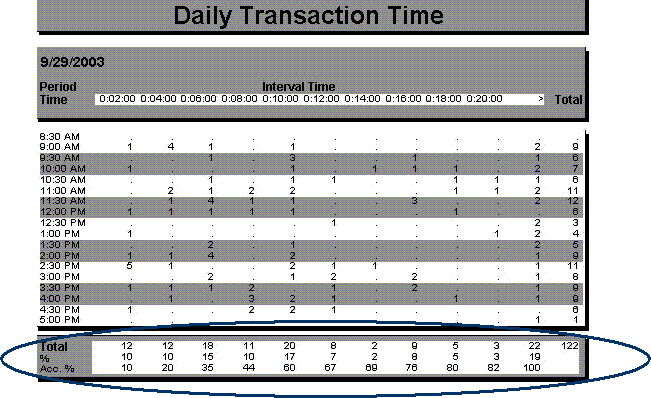
Transaction Duration VariabilityDuration of service at the service window categorized by transaction type |
Vendor Specifics (Q-MATIC)
Transaction Time reports are available for daily, weekly, and annual reporting periods. Figure 6‑3 shows an example of the Daily Transaction report with the distribution of Transaction Duration. For a statistical analysis of variance calculation, the duration row would be exported to an appropriate spreadsheet or analysis tool.
Figure 6-3: Transaction Duration Report (Q-MATIC)
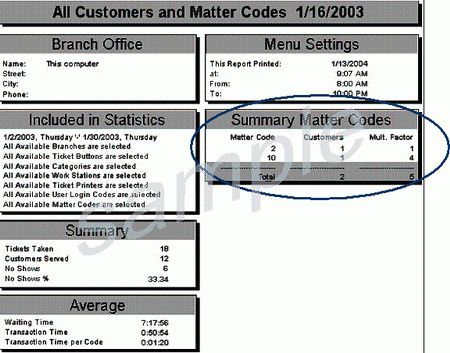
Critical Error RateCount of specific service outcomes where service could not be completed due to the incomplete or inaccurate provision of prerequisite information divided by the total number of applications processed in the reporting period |
Vendor Specifics (Q-MATIC)
Most service management products provide some capability to record a result of a service visit. Result codes can be used to categorize transactions, errors, callbacks, or any other output of the program requiring tracking. Q-MATIC provides this capability through a feature called "Matter Codes." Figure 6-4 shows a sample Matter Code report.
Figure 6-4: Matter Code Report (Daily) for
Tracking Error Rates (Q-MATIC)
MAF Category: Citizen-Focussed Service
Theme: Client Satisfaction
Two measures have been proposed for this theme. The overall Client Satisfaction rating as compiled by the CMT is the primary measure. As previously discussed, this measure is determined through periodic surveys of citizens and businesses. Complete details can be found at http://www.iccs-isac.org/eng/cmt-about.htm.
The second measure, Service Complaints, has been identified by the working group but is difficult to compile at this time. Effective recording and tracking of service complaints requires integration of client contact information across all channels. Many service complaints are sent to ministers' offices via regular or electronic mail where they are tracked by separately managed ministerial correspondence systems. The performance measurement community will investigate this measure to determine its contribution, cost, and value to overall service measurement practices.
No vendor-specific implementation guidelines are required for either measure.
MAF Category: Stewardship
Theme: Agent (Resource) Utilization
With in-person service delivery, the client experience is based primarily upon the ability and skill of the agent to understand and satisfy the client's service request. Service centre managers assess overall volume and agent performance by carefully monitoring several measures that provide an accurate assessment of the use of agent skills. Executives tend to place high value on the measure Cost per Visit, which provides a good overall indication of visit complexity and Agent Utilization. Other measures of Agent Utilization—specifically Agent Capacity, Resource Allocation, Agent Adherence, and Agent Occupancy—provide sound operational control of both short- and long-term use of labour within the service centre team.
These measures are almost identical to those used to support the Phone Channel. Capacity and Resource Allocation provide a static assessment of the overall team capacity. Agent Occupancy is the amount of time an agent spends in direct face-to-face customer service. Adherence measures the amount of scheduled time that an agent is available to provide service. As Occupancy increases, agents will naturally protect themselves by reducing schedule adherence through, for example, longer breaks, earlier log-outs for meetings and prolonged conversations with the clients.
Skilled service centre managers establish the right balance between Occupancy and Adherence and carefully monitor Agent Utilization on an individual basis. Departments, agencies, and other stakeholders are primarily interested in the roll-up of the entire agent team—effectively calculating Occupancy and Adherence for the in-person service centre.
Queue management tools are less sophisticated in calculating Agent Utilization measures, however. Q-MATIC provides basic information that can be aggregated to calculate the recommended core and operational KPIs.
Cost per VisitTotal operational cost of the service centre divided by the number of client visits |
This measure taken for the reporting interval provides strong trend information on overall call centre efficiency. The Visitor Access measure (see page 42) is used as the volume measure. The working group has noted that there is inconsistency in how total operational cost is calculated, specifically related to the inclusion of facilities costs. Further discussion and resolution of these differences will be undertaken by the working group to set a standard definition for operational cost.
This information can be derived by dividing the labour costs by the service requests found in the daily, weekly and annual category reports (Figure 6-1).
Agent AdherencePercentage of a day that we can reasonably expect an agent to be logged onto the service management tool.
Total Time Logged On (Visit, Wait, and Wrap-up) X 100 =
% Adherence |
Adherence is a key performance indicator for individual agent performance and the overall performance of the service centre.
A service centre might plan that agents should be "on station" for 80 per cent of their scheduled hours of work, excluding leave and formal training. While logged onto the service management software, agents should be speaking with a client, wrapping up the interaction (if necessary), or waiting for the next client in the queue. Non-telephone-related activities should be accomplished within a 20 per cent allowance. Examples of non-service activities include other assigned duties such as callbacks and e-mail response, meetings, coaching time, supervisor discussions, and breaks.
The log-in time component can be found in a report Graph by Time of Operation (not shown). The column labelled Interval shows the total log-in time for each workstation in the service centre.
Agent OccupancyPercentage of time agents are logged onto the service management system and are either servicing a client or completing file notes related to that specific client visit % of Transaction Time + % of Wrap-up Time |
This will require a customized report if the service centre is using Q-MATIC as its queue management software. Total transaction time available from the Daily Category report (Figure 6‑1) must be exported to a spreadsheet and divided by Total Log-on Time, as taken from the report Graph by Time of Operation.
MAF Category: Stewardship
Theme: Service Effectiveness
At the time of publication, the working group had discussed Turnaround Time as an indicator for overall service effectiveness in the In-person Channel. This indicator, applicable primarily to transactional services, would measure complete transaction time from the date of receipt at the service centre to the completion of the transaction by the responsible program. This measure raises several challenges and further discussion is required by the working group to develop representative KPIs for Service Effectiveness. Using the current definition of Turnaround Time, there is no associated vendor-specific information related to this KPI.
MAF Category: Stewardship
Theme: Use of Technology
Many in-person service centres provide self-service computers for visitors to access and use equivalent or related on-line services while visiting the centre. Many in-person service centres also provide telephones for clients wishing to use this channel while at the service centre. Both capabilities represent an effective use of technology to allow visitors to choose a possibly faster and more effective channel.
Self-service RatioRatio of visitors using either a computer or a telephone while in the service centre to the total number of visitors during the reporting period (Number of Visitors Using Computers + Number of Visitors
Using the Telephone) |
Vendor Specifics
Total Visitors is calculated by Q-MATIC in the Daily Category report (Figure 6-1). The Number of Visitors Using Computers will be retrieved using either a Web measurement tool such as WebTrends (see Figure 5‑10) or a specific computer-monitoring tool. The Number of Visitors Using the Telephone is taken from telephone usage logs for the phones installed within the service centre. Calls to specific GoC call centres would be counted.
MAF Category: Stewardship
Theme: Channel Take-up
GoC executives and managers involved in service delivery place high value on Channel Take‑up volumes. Channel Take‑up is the basic volume measure of the in-person service centre. Most GoC service centres count or estimate Visitors, i.e.the number of people who enter the service centre.High‑traffic locations employ queue management tools to provide service tickets to visitors. Lower‑volume service centres, such as the current Service Canada outlets, count manually.
Calls and Callers: Vendor Specifics
This information can be found in a number of standard Q-MATIC reports, including the daily, weekly, and annual category reports and the daily, weekly, and annual workstationreports. Figure 6‑1 shows an example of a Daily Category report.
Appendix A: References
Canada. Canada Revenue Agency. Telephone Management Reference Guide. Ottawa: 2004 (revised February 8, 2005).
Canada. Treasury Board of Canada Secretariat. Guidelines for Core Key Performance Indicators: Interim Report on Primary Service Channels. 2004. Retrieved from: /si-as/kpi-icr/interim/interim00-eng.asp.
Canada. Treasury Board of Canada Secretariat. Management Accountability Framework. 2003. Retrieved from /maf-crg/index-eng.asp.
Cleveland, B., and J. Mayben. Call Center Management On Fast Forward: Succeeding in Today's Dynamic Inbound Environment. Annapolis, MD: Call Centre Press, 1997.
Appendix B: Glossary of Terms
| ACD |
Automatic call distributor: A telephony device that distributes incoming calls
to a specific group of terminals used by agents. ACD systems are quite often
found in companies that handle a lot of incoming phone
calls and where the caller does not need to speak with a specific person but
wants to speak with an available person at the earliest opportunity. http://en.wikipedia.org/wiki/ACD |
| CMT |
Common Measurements Tool: A user-friendly client satisfaction survey instrument
that facilitates benchmarking across public-sector jurisdictions. Using the CMT,
public‑sector managers can understand client expectations, assess levels
of satisfaction, and identify priorities for improvement. http://www.iccs-isac.org/eng/cmt-about.htm |
| EMIS |
Expenditure Management Information System: An information platform that has been
created to improve decision making, accountability, and transparency in
government. It is a government-wide system that supports the Management
Resources and Results Structure (MRRS) and alignment of information on the
priorities, planned and actual expenditures, and results of program activities. /emis-sigd/General_FAQs_e.asp |
| Erlang C | A specific version of a
formula used to estimate the number of lines required in a network or to a
central office (PSTN exchange lines). The "C" version models queuing
situations where all blocked calls stay in the system until they can be handled.
This applies well to the design of call centre staffing arrangements where, if
calls cannot be immediately answered, they enter a queue. http://www.erlang.com/whatis.html#models |
| FCR |
First Call Resolution: Properly addressing the client's need on the first call,
thereby eliminating the need for the client follow-up with a second call. Talk
time (the average time an agent spends on each call) is a common call centre
performance metric. In general, fast talk time averages are desirable. However,
fast talk time averages accompanied by poor first call resolution rates are a
sign that customer calls are not being answered satisfactorily. http://searchcrm.techtarget.com/ ateQuestionNResponse/0,289625,sid11_gci815374,00.html |
| GoC |
Government of Canada http://www.canada.gc.ca/ |
| Hills B | A variation of the Erlang C queuing formula that accounts for several "real-life" factors such as call abandons and busy signals. |
| IVR |
Interactive voice response: A telephony technology in which a person uses a
touch-tone telephone to interact with a database to acquire information from or
enter data into a database. IVR technology does not require human interaction
over the telephone as the user's interaction with the database is predetermined
by what the IVR system will allow the user access to. |
| KPI |
Key performance indicator: A significant measure used on its own or in
combination with other indicators to monitor how well a business is achieving
its quantifiable objectives. http://uis.georgetown.edu/departments/eets/dw/GLOSSARY0816.html |
| MAF |
Management Accountability Framework: This identifies the goals and objectives,
governance, and strategic direction of the federal government. It was
developed to provide public service managers, particularly deputy heads, with a
clear list of management expectations for the programs and services they deliver
within an overall framework for high organizational performance. /si-as/maf-crg/maf-crg-eng.asp |
| MRRS | Management,
Resources, and Results Structure Policy: This Policy supports the
development of a common, government-wide approach to planning and managing the
relationship between resource expenditures and results, while serving as a
consistent and enduring foundation for collecting, managing, and reporting
financial and non-financial information to Parliament. /rma/mrrs-sgrr_e.asp |
| Secretariat |
Treasury Board of Canada Secretariat: The
Secretariat provides advice and support to Treasury
Board ministers in their role of ensuring value for money. It also provides
oversight of the financial management functions in departments and agencies. |
[1]. See "The Service Delivery Network Profile" at /si-as/initiative/sdnp-prps/infowww-eng.asp.
[2]. Agent Utilization, Phone Channel, p. 17.