Treasury Board of Canada Secretariat
www.tbs-sct.gc.ca
Common menu bar links
Breadcrumb Trail
ARCHIVED - Using External Service Delivery Key Performance Indicators
 This page has been archived.
Archived Content
Information identified as archived on the Web is for reference, research or recordkeeping purposes. It has not been altered or updated after the date of archiving. Web pages that are archived on the Web are not subject to the Government of Canada Web Standards. As per the Communications Policy of the Government of Canada, you can request alternate formats on the "Contact Us" page.
MAF Category: Citizen-Focussed Service
Theme: Service Access
For service delivered through the Internet Channel, the access theme includes measures concerning the availability of the site to potential site visitors. There are two primary components to site availability:
- How easily can site visitors locate the site through search engines, links from other sites, or publication of the URL through other channels such as the telephone and mail?
- Is the site available for site visitors once it has been located?
Usage TipWeb site activity measurement is based on detailed understanding of Web technologies, tracking techniques and technologies, and various session management approaches such as persistent cookies. With the rapid development of anti-spam and anti spyware technologies, experienced Internet consumers now have the capabilities to routinely delete or manage cookies. This has weakened the utility of those measures that rely on session-tracking technologies. |
Other qualitative characteristics contributing to access include compliance with W3C accessibility standards to ensure the site is fully inclusive and available to persons with disabilities.
The overall KPI, Service Access, is composed of a combination of indicators reflecting site visitors' ability to a) locate the site, b) access the site supported by adequate and operational servers, and c) complete specific transactions or locate specific information without abandoning the visit. The following measures provide an initial assessment of these visit events.
Search Engine RankingRelevance ranking or position rank weighted from the distribution of site visits that entered the site through commercial search engines. If actual relevance rank (Relevance %) is available, this should be used. If it is not available, the position of GoC Web site in Search Results List (SRL) should be used (Position 1=100%, 2=90%, 3=80% and so on). Search Rank is calculated on the weighted average of search ranks for all visits accessing the site through search referrals. |
Direct Access RatingPercentage of visits that accessed the site directly without a referring site |
Planned Referral RatingPercentage of total site visits from planned referral sites Visits through links from related sites such as gateways and clusters should be weighted as high value in assessing site access. It is calculated as a percentage of total visits. |
Site Access Measures: Vendor Specifics (WebTrends)
|
Measure |
Source |
|
Search Engine Ranking |
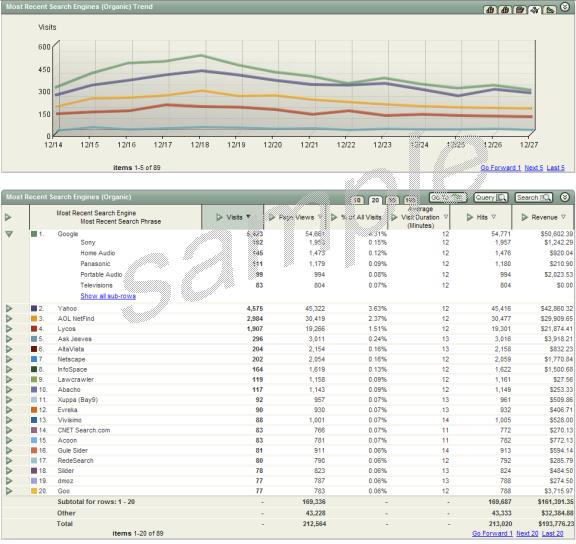
Report Name: Most Recent Search Engines (Paid) This report would be used only when the GoC site uses a paid sponsor service, such as Yahoo or Google. Report Name: Most Recent Search Engines (Organic) WebTrends identifies all search engine referrals that are not paid or sponsored as "organic." Analysis by CRA indicates that these visits represent a significant percentage of all site traffic. See Figure 5-1. |
|
Planned Referrals Direct Access Ratio |
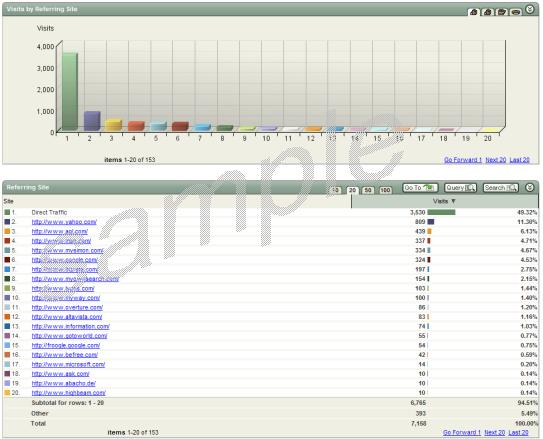
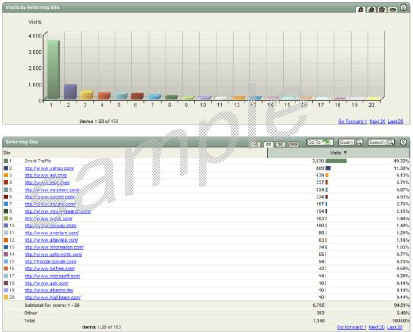
Report Name: Visits by Referring Sites This report shows both site referrals and direct access within any specified period. See Figure 5-2. |
Usage TipTo extract the actual search position on the search results page, a script must be developed to use phrases actually used by site visitors looking for the site. The Search Result Position can then be weighted by the percentage of visits using each search engine / search phrase combination. |
Figure
5-1: WebTrends Most Recent Search Engine Report
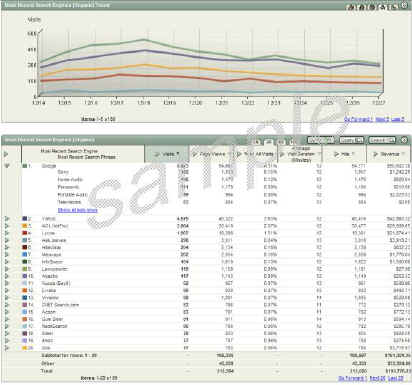
Figure 5-2: Visits by Referring Sites Report (WebTrends)
Usage TipSome proxy servers and security software tools strip out the referring URL. Many Web-metric tools, including Web Trends, categorize these separately as hidden or masked referrers. Some tools will include these visits as Direct Access. |
Server AvailabilityTotal available server hours over total planned server hours during the reporting period |
Usage TipMost large Web sites are configured with multiple servers, extensive redundancy, and strong load-balancing capabilities. Loss of a specific server typically results in slower visits (i.e. page serves) as opposed to non availability of the site. The primary value of using a server ratio to weight overall service access is to reflect any significant variances in service rather than specific complete shutdowns. |
Server Availability data are available from the specific server logs that host Web server software. Logging tools within the popular Web servers, such as Apache or Microsoft's IIS, can be used to provide specific outage information for integration with other access measures.
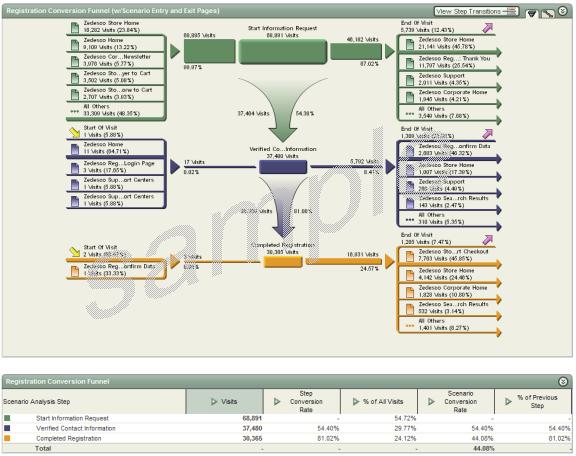
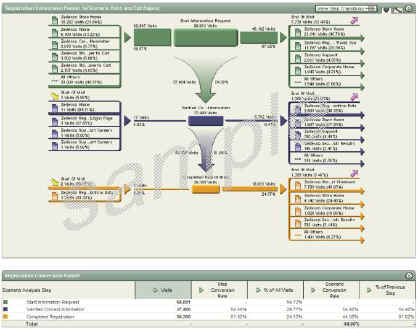
Conversion RateTotal visits reaching submit pages divided by total visits viewing transaction start pages This measure requires mapping specific Web site pages to a transaction model. When appropriate start and finish pages are defined, Web measurement tools automatically calculate the conversion rate (as well as exit and abandonment rates). Figure 5-3 provides a visual example of WebTrends using their scenario model. |
Figure 5-3: Scenario Modelling and Conversion Rate Analysis (WebTrends)
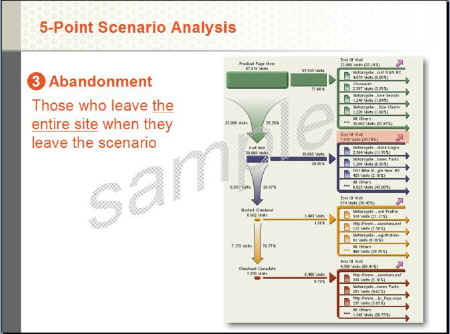
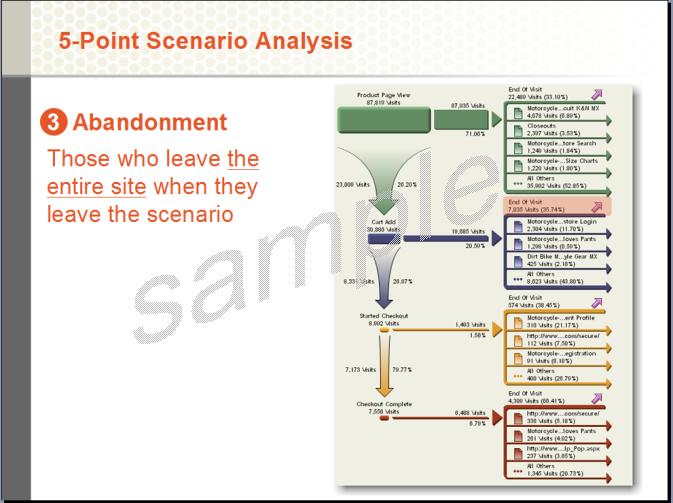
Abandonment RateRate at which visitors initiate transactions but do not reach the submit page plus visitors exiting the site from non-content pages This measure requires mapping specific Web site pages to a transaction model. When appropriate start and finish pages are defined, Web measurement tools automatically calculate the conversion rate (as well as exit and abandonment rates). Figure 5-4 provides a visual example of the use of WebTrends' scenario model to calculate abandonment. |
Figure 5-4: Calculation of Abandonment (WebTrends)