
Treasury Board of Canada Secretariat
www.tbs-sct.gc.ca
Common menu bar links
Breadcrumb Trail
ARCHIVED - Indian and Northern Affairs Canada and Canadian Polar Commission - Report
 This page has been archived.
Archived Content
Information identified as archived on the Web is for reference, research or recordkeeping purposes. It has not been altered or updated after the date of archiving. Web pages that are archived on the Web are not subject to the Government of Canada Web Standards. As per the Communications Policy of the Government of Canada, you can request alternate formats on the "Contact Us" page.
Minister’s Message
 On behalf of Aboriginal Affairs and Northern Development Canada (AANDC) and the Canadian Polar Commission, I am pleased to present the 2010-2011 Departmental Performance Report. The report outlines progress made in the
past year to make Canada a better place for Aboriginal peoples and northern communities. This could not be done without partnerships that have been built with First Nations, Mķtis, Inuit and Northerners. I am very pleased to also note the steadily increasing engagement of provincial and territorial governments, the private sector, voluntary organizations and educational institutions on
Aboriginal and Northern issues.
On behalf of Aboriginal Affairs and Northern Development Canada (AANDC) and the Canadian Polar Commission, I am pleased to present the 2010-2011 Departmental Performance Report. The report outlines progress made in the
past year to make Canada a better place for Aboriginal peoples and northern communities. This could not be done without partnerships that have been built with First Nations, Mķtis, Inuit and Northerners. I am very pleased to also note the steadily increasing engagement of provincial and territorial governments, the private sector, voluntary organizations and educational institutions on
Aboriginal and Northern issues.
In 2010-2011, the Government continued and finalized the implementation of Canada’s Economic Action Plan (CEAP). The Government invested a total of $1.4 billion over two years in Aboriginal-specific initiatives and $500 million was dedicated specifically to supporting the Northern Strategy. Continuing to invest in the future of Aboriginal peoples and northern communities will help to foster the long-term prosperity of all Canadians.
Improving education outcomes for First Nation students continues to be a top priority. In 2010-2011, AANDC signed two new tripartite education agreements; one with the Government of Prince Edward Island and the Mi’kmaq First Nations of Prince Edward Island, and one with the Government of Saskatchewan and the Saskatoon Tribal Council. These are just some of the concrete examples of AANDC’s commitment to working with willing partners to ensure the delivery of quality education to First Nation learners in reaching their full potential.
We have also made progress in the area of Aboriginal economic development programs. Cross-country engagement sessions with Aboriginal communities, including Aboriginal women, and stakeholders were conducted to renovate the existing suite of Aboriginal economic development programs so they will better meet the needs of Aboriginal Canadians. As a result, changes to program design and delivery are planned for implementation in 2011-2012.
AANDC also continued to move forward on the Northern Strategy. In December 2010, the Government announced the mandate of the Canadian High Arctic Research Station (CHARS). The CHARS will undertake solution-driven science and technology, build partnerships, and leverage Canada’s research base to address economic, environmental and social challenges in the North.
Building on the achievements presented in this report, the Government of Canada will continue to develop and strengthen its partnerships. By working together, we will secure a bright, healthy and prosperous future for Aboriginal peoples and Northerners, today and for generations to come.
The Honourable John Duncan
Minister of Aboriginal Affairs and Northern Development
Section I: Organizational Overview
Raison d’Ļtre
Aboriginal Affairs and Northern Development Canada (AANDC) supports Aboriginal peoples (First Nations, Inuit and Mķtis) and Northerners in their efforts to:
- Improve social well-being and economic prosperity;
- Develop healthier, more sustainable communities; and
- Participate more fully in Canada's political, social and economic development - to the benefit of all Canadians.
AANDC is one of the federal departments responsible for meeting the Government of Canada's obligations and commitments to First Nations, Inuit and Mķtis, and for fulfilling the federal government's constitutional responsibilities in the North. Most of the Department's programs, representing most of its spending, are delivered through partnerships with Aboriginal communities and federal-provincial or federal-territorial agreements. AANDC also works with urban Aboriginal persons, Mķtis and non-status Indians (many of whom live in rural areas) through the Office of the Federal Interlocutor.[1]
AANDC's mandate and wide-ranging responsibilities have been shaped by centuries of history and by unique demographic and geographic challenges.
Responsibilities
Indian and Inuit Affairs
AANDC’s responsibilities for Indian and Inuit Affairs include:
- Promoting improved education for Aboriginal people;
- Negotiating claims and self-government agreements with Aboriginal communities, and overseeing the implementation of settled claims on behalf of the federal government;
- Facilitating economic development opportunities for Aboriginal individuals, communities and businesses;
- Funding the delivery of provincial-type services such as education, housing, community infrastructure and social support to Status Indians on reserves;
- Addressing and resolving issues that arise from the legacy of Indian residential schools;
- Liaising effectively between the Government of Canada and Inuit governments and organizations in the implementation of policies and the delivery of services; and
- Fulfilling duties prescribed by the Indian Act, including managing Indian reserve lands and financial resources belonging to First Nation communities, and approving or rejecting bylaws in First Nation communities.
Office of the Federal Interlocutor
The mandate of the Office of the Federal Interlocutor (OFI) derives from an Order in Council providing authority to the Minister to act as the federal government’s primary interlocutor for Mķtis and non-status Indians, and to enter into contribution agreements with organizations representing Mķtis and off-reserve Aboriginal peoples.
The Office of the Federal Interlocutor is responsible for: maintaining and strengthening the Government of Canada’s relations with organizations representing Mķtis, non-status Indians and urban Aboriginal people; participating in negotiation processes; leading the Government of Canada response to the Supreme Court of Canada decisions in Powley; and, coordinating the government's Urban Aboriginal Strategy.
Northern Development
The Northern Development mandate derives from: the Department of Indian Affairs and Northern Development Act, 1970; legislation enacting modern treaties north of 60░, such as the Nunavut Land Claims Agreement Act; self-government agreements, such as the Yukon First Nations Self-Government Act; and, statutes dealing with environmental or resource management. Legislation that enacts the devolution of services and responsibilities from AANDC to territorial governments, such as the Canada-Yukon Oil and Gas Accord Implementation Act, also serves to frame the mandate.
This makes AANDC the lead federal department for two-fifths of Canada’s land mass, with a direct role in the political and economic development of the territories, and significant responsibilities for resource, land and environmental management. In the North, the territorial governments generally provide the majority of programs and services to all Northerners, including Aboriginal people.
AANDC’s responsibilities for Northern Development include:
- Promoting political and economic development in Yukon, the Northwest Territories and Nunavut;
- Negotiating the transfer of federal responsibilities for land and resource management to the territorial governments;
- Managing the resources, land and environment of the North in places where federal responsibilities have not been transferred to territorial governments;
- Co-ordinating initiatives, such as managing contaminated sites and subsidizing the cost of nutritious perishable food;
- Advancing circumpolar interests, such as Canada’s Arctic sovereignty, climate change adaptation and environmental protection, Canadian representation at circumpolar forums, and scientific research related to the North; and
- Implementing AANDC’s legal obligations arising from treaties and land claim agreements.
AANDC mandate also has an international dimension; the Department is actively engaged in international indigenous and circumpolar activities involving Aboriginal and northern organizations, states and international organizations.
The Canadian Polar Commission[2] is a relatively small separate agency that supports polar research through its broad mandate, which relates to the development, promotion and dissemination of knowledge of the polar regions. It carries out this mandate by co-operating with organizations, institutions and associations in Canada and elsewhere to undertake, support, and publish studies, to recognize achievements and to promote polar research and its application in Canada.
Strategic Outcome(s) and Program Activity Architecture (PAA)
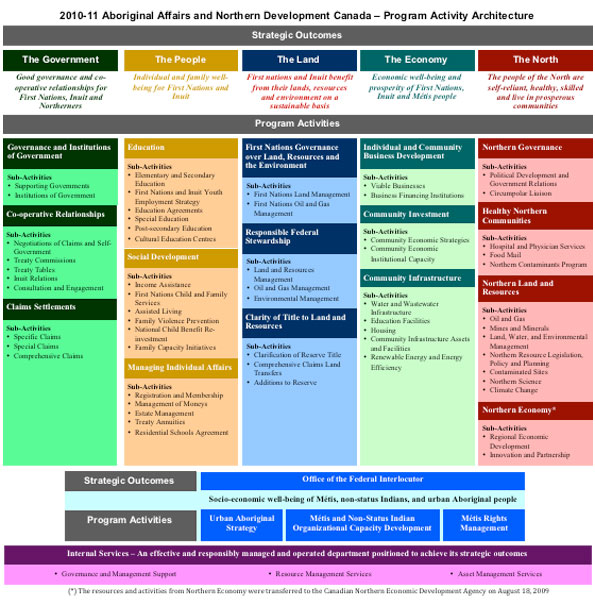
Organizational Priorities
In its 2010-2011 Report on Plans and Priorities,[3] AANDC identified five priority areas:
- Education: Advance the Reforming First Nation Education Initiative;
- Economic Development: Continue the implementation of the new Federal Framework for Aboriginal Economic Development;
- Empowering Citizens and Protecting the Most Vulnerable: Continue program and policy reforms to help create more secure and sustainable communities;
- Northern Strategy: Provide ongoing leadership of the Government's integrated Northern Strategy, which was formally announced in July 2009; and
- Management Priorities: Improve the Department's management processes and ensure full implementation of the Policy on Transfer Payments.
|
Priority Status Legend |
|---|
|
Exceeded: More than 100% of the expected performance level for the priority identified in the corresponding RPP was achieved during the fiscal year. Met All: 100% of the expected performance level for the priority identified in the corresponding RPP was achieved during the fiscal year. Mostly Met: 80 to 99% of the expected performance level for the priority identified in the corresponding RPP was achieved during the fiscal year. Somewhat Met: 60 to 79% of the expected performance level for the priority identified in the corresponding RPP was achieved during the fiscal year. Not Met: Less than 60% of the expected performance level for the priority identified in the corresponding RPP was achieved during the fiscal year. |
|
Priority – Education: Advance the Reforming First Nation Education Initiative |
Type:[4] Ongoing |
Strategic Outcome(s) and/or Program Activity(ies): The People – Education program activity |
|---|---|---|
|
Status: Mostly Met The Department has made progress in advancing its plans under the Reforming First Nation Education Initiative. The First Nation Student Success Program (FNSSP) and partnership under the Education Partnerships Program (EPP) have seen the roll-out of school improvement plans and activities that focus on literacy, numeracy and student retention. In 2010-2011, two calls for FNSSP proposals were held and 17 projects were chosen by the National Selection Committee for funding. The FNSSP participation rate, based on the percentage of band-operated schools represented in approved proposals, was 90% which exceeded the target by 38%. The FNSSP projects are aimed at improving student achievement. In 2010-2011, AANDC’s work to develop tripartite education partnerships resulted in the signing of a tripartite education memorandum of understanding (MOU) with Prince Edward Island in August 2010, and with the Saskatoon Tribal Council in October 2010. These MOUs are concrete examples of AANDC’s collaborative approach to strengthening partnerships with First Nations and the provinces to improve educational outcomes in band-operated and provincial schools. Additional work in support of AANDC’s commitment to promote collaboration between First Nations, provinces, AANDC, and other stakeholders included the selection of 30 projects for funding under the Education Partnership Program (EPP). Of these projects, 19 received funding in 2010-2011, while 11 projects will be funded in 2011-2012. These EPP initiatives will support the work of officials, educators in regional First Nation organizations and schools, and those in provincial systems to better coordinate education-related programs that fall under federal, provincial, or First Nation areas of responsibility. While First Nation and Inuit access to post-secondary education improved in 2009-2010, completion rates regressed. The number of First Nation and Inuit students enrolled in post-secondary education programs in 2009-2010 was 22,567, which represents an increase of 3.2% from 2008-2009. In this same period, the number of First Nation and Inuit students completing post-secondary education was 3,809 which represents a decrease of 1.6% from 2008-2009. Fluctuations in completion rates are impacted by the length of post-secondary education programs as well as other variables.[5] In December 2010, the Government of Canada announced with the Assembly of First Nations the creation of the National Panel on First Nation Elementary and Secondary Education to explore and advise on the development of options, including legislation, to improve elementary and secondary education outcomes for First Nation children who live on-reserve. The Panel’s work is scheduled to be completed by the end of 2011. |
||
|
Priority – Economic Development: Continue the implementation of the new Federal Framework for Aboriginal Economic Development |
Type:[6] New |
Strategic Outcome(s) and/or Program Activity(ies): The Economy and The Land |
|---|---|---|
|
Status: Mostly Met AANDC continued the implementation of the Federal Framework for Aboriginal Economic Development. From May to December 2010, AANDC completed eight cross-country engagement sessions (including targeted sessions on women, youth, and remote communities) with key stakeholder groups to seek input on how to align programs and policies in order to better support the needs of Aboriginal individuals, businesses, and communities. Coming out of those consultations, in 2011-2012 the Department will implement changes to improve administration and delivery of its economic development programs. As well, progress continues on the full renovation of the programs. In 2010-2011 the Strategic Partnerships Initiative (SPI) was launched and strategic and whole-of-government initiatives were funded, totalling $7.4 million in five key economic sectors (agriculture, energy, fisheries, forestry, and mining). |
||
|
Priority – Empowering Citizens and Protecting the Most Vulnerable: Continue program and policy reforms to help create more secure and sustainable communities |
Type:[7] Ongoing |
Strategic Outcome(s) and/or Program Activity(ies): The People – Social Development program activity |
|---|---|---|
|
Status: Mostly Met AANDC advanced partnership agreements with First Nations and the provinces of Saskatchewan and Quebec to enhance the implementation of the Active Measures[8] employment promotion program and to improve program management and delivery. These formal partnerships, as well as those in Ontario and Alberta, have helped to improve the adoption of Active Measures projects that support income assistance beneficiaries in moving into the labour force. For example, partnerships with First Nations, provincial governments, Human Resources and Skills Development Canada, Health Canada and other stakeholders in all jurisdictions have resulted in cost-shared initiatives for 43% of 99 Active Measures pilot projects. The Piikani “Introduction to the Trades” in Alberta enabled 19 out of 20 youth income assistance recipients to find employment. In 2010-2011, AANDC invested $12.5 million in Active Measures projects, an investment that was supplemented by an additional $9.5 million from partners. In July 2010, to increase safety for First Nation children and families, an additional investment of $177 million over five years was announced for the First Nations Child and Family Services (FNCFS) Program in Manitoba, bringing ongoing federal enhanced funding in six jurisdictions to $100 million annually. Progress has been made in implementing Jordan’s Principle[9] with the provinces and First Nations. Nationally, a network of federal and provincial contacts has been put in place to address cases brought to their attention; none has resulted in a jurisdictional dispute. |
||
|
Priority – Northern Strategy: Ongoing leadership of the Government's integrated Northern Strategy, which was formally announced in July 2009 |
Type:[10] Ongoing |
Strategic Outcome(s) and/or Program Activity(ies): The North |
|---|---|---|
|
Status: Met All During 2010-2011, AANDC continued to lead the Northern Strategy by coordinating federal efforts on Northern initiatives, including senior committees. AANDC advanced a number of key initiatives to support the development of sustainable Northern communities and to improve the business climate while taking necessary steps to protect its fragile ecosystems and provide Northerners with more control over their destinies. Key initiatives led by AANDC included: Promoting social and economic development
Protecting our environmental heritage
Improving and devolving governance
|
||
|
Priority: Improve the Department's management processes |
Type:[11] Ongoing |
Strategic Outcome(s) and/or Program Activity(ies): Internal Services Program Activity |
|---|---|---|
|
Status: Somewhat Met Improvements to the Department’s management processes are assessed by the Treasury Board Secretariat through the Management Accountability Framework (MAF) assessment. Progress against the commitments can be found in Section II under the Internal Services program activity. The People Management commitment was only somewhat met, as it received an overall rating of “acceptable.” A strong rating was received in elements related to leadership, employee learning and official languages, however, a need to improve was indicated in areas related to executive stability, employee performance management, and workforce representation. Note: Governance and Planning was not among the areas selected by the Treasury Board Secretariat to be assessed and rated under MAF VIII; therefore, this target element cannot be measured for 2010-2011. |
||
|
Priority: Full implementation of the Policy on Transfer Payments |
Type:[12] New |
Strategic Outcome(s) and/or Program Activity(ies): Internal Services Program Activity |
|---|---|---|
|
Status: Mostly Met The full implementation of the Policy was mostly met with an implementation level set at 90%. A risk management approach was established that included the appropriate tools and processes. A strong focus was placed on recipient engagement with the delivery of 150 national and regional engagement sessions. New administrative processes also support standardized funding agreements and new funding approaches. Opportunities for collaboration with other federal departments are being pursued via two pilot projects. The final 10% of the PTP implementation still outstanding includes grant and provincial/ territorial funding agreement models, the ongoing work of the Special Representative on Reduced Reporting to help balance the administrative burden of reporting with risk, the review of the Intervention Policy and an inventory of service standards for individual programs. |
||
Risk Analysis
Managing Our Corporate Risks
Each year AANDC undertakes an exercise to review and update its Corporate Risk Profile (CRP). The CRP is a point-in-time representation of the most significant risks posing a threat to fulfilling AANDC’s mandate and objectives. The CRP was developed through analysis of key planning, audit and evaluation documents, as well as a series of comprehensive interviews with senior AANDC managers from all sectors and regions. This exercise resulted in the identification and assessment of eight key risks, grouped under two themes (see below).
|
Management & Accountabilities |
|
|---|---|
|
1. HR capacity and capabilities risk |
|
|
2. Information for decision-making risk |
|
|
3. Implementation risk |
|
|
4. Resource alignment risk |
|
|
|
|
|
Relationships & Partnerships |
|
|
5. Government partnership risk |
|
|
6. Aboriginal relationship risk |
|
|
7. External partnership risk |
|
|
8. Legal risk |
Once completed, the CRP informed the Department’s business planning cycle and was a key input in the Department’s priority-setting exercise. The activities put forward in the Department’s plans not only addressed the operational needs of individual programs, but, in turn, contributed to the overall management of the Department’s corporate risks.
The following reflect some key examples of mitigating actions:
- The “human resources capacity and capabilities risk” continued to be one of the higher risk areas in the 2010-2011 CRP. The Department updated its Human Resources Management Strategy and Plan with initiatives designed to enhance recruitment and training to mitigate this risk.
- The Education Information System (EIS) was introduced to better enable the Department to collect and provide access to reliable, timely, and consistent data to support decision-making related to education programming, partially mitigating the risk related to “information for decision-making”.
- A number of initiatives arising from the implementation of the Policy on Transfer Payments were put in place aimed at ensuring that risk-based approaches were incorporated into the development, implementation and management of programs. This included the establishment of a Recipient General Risk Assessment Tool and a Program Risk Assessment Tool aimed at ensuring the administrative requirements of recipients are proportionate to risk, and that appropriate program monitoring is put in place. Both are intended to assist in mitigating the “implementation risk”.
- In order to address its “resource alignment risk”, the Department set priorities for the year through its Corporate Business Plan and tracked progress through quarterly reporting and monthly financial reports.
- AANDC participated in a number of interdepartmental initiatives to foster productive relations with its federal partners. AANDC is also the lead on the Federal Framework for Aboriginal Economic Development and chairs many interdepartmental committees on Northern issues. Together these help to mitigate “government partnership risk”.
- The “Aboriginal relationship risk” was addressed, in part, through the numerous comprehensive and specific land claims and self-government negotiations that took place throughout the year, as well as through the implementation of Canada’s Action Plan on Consultation and Accommodation, including updated guidelines for federal officials.
- The Department’s “external partnership risks” were addressed through a number of devolution negotiations and agreements with provinces and territories.
- The Department has advanced a number of initiatives to address “legal risk” including: the out-of-court settlement of 11 cases; and active participation in the Interdepartmental ADM Working Group on Legal Risk Management and Integrated Risk Management and the Joint Steering Committee on Litigation. In addition, work has progressed on the Federal Contaminated Sites Action Plan.
Performance Summary
Aboriginal Affairs and Northern Development Canada
|
|
Planned Spending |
Total Authorities |
Actual Spending |
|---|---|---|---|
|
Aboriginal Affairs and Northern Development Canada |
7,339.0 |
8,457.4 |
8,234.9 |
|
|
Planned |
Actual |
Difference |
|---|---|---|---|
|
Aboriginal Affairs and Northern Development Canada |
5,202 |
5,294.2 |
92.2 |
The net increase of 92.2 full-time equivalents (FTEs) from 5,202.0 Planned to 5,294.2 Actual FTEs, is primarily due to supplementary funding received for additional programs. Such funding included but was not limited to: (1) the McIvor decision which brought in the Gender Equity in Indian Registration Act (Bill C-3); (2) Funding for legislative and regulatory changes to improve the Northern Regulatory Systems and to implement Commutative Impact Monitoring Program in the Northwest Territories and Nunavut; and (3) Support for the implementation of the First Nation Water and Wastewater implementation plan.
In addition, following a review of the FTEs captured under the Program Activity Internal Services, a realignment of FTEs was made from Internal Services to the appropriate program area. Details of the realignment are presented in Section IV.
Explanation of Variances
Variances between Main Estimates, Planned Spending, Total Authorities and Actual Spending are largely attributable to the timing of key elements of the fiscal cycle. The Main Estimates as approved by Parliament in the initial appropriations are the first step in the fiscal cycle.
The Planned Spending figure for 2010-2011 includes Main Estimates of $7,301 million, plus an additional $38 million in funding for those initiatives known when the Report on Plans and Priorities was prepared in January and February of the preceding fiscal year. The $38 million was primarily for initiatives outlined in Budget 2008 (education, child and family services, and economic development), as well as for the renewal of financial provisions of the Nisga’a Nation Fiscal Financing Agreement.
The Total Authorities represent Main Estimates plus Supplementary Estimates, plus adjustments to authorities approved by Treasury Board, such as the operating budget carry-forward. The difference of $1,118 million between Total Authorities ($8,457 million) and Planned Spending ($7,339 million) is largely due to:
- Funding provided in Supplementary Estimates for:
- Claims negotiations and settlements;
- Obligations related to the implementation of the Indian Residential Schools Settlement Agreement;
- The continued implementation of the First Nations Water and Wastewater Action Plan;
- Emergency management assistance activities on reserve for emergencies including but not limited to fires and floods;
- Out-of-court settlements;
- The First Nations Child and Family Services Program in Manitoba;
- The Mķtis rights management program renewal and the transfer of Mķtis and non-status Indian litigation management from the Department of Justice to AANDC;
- Continued support of two Labrador Innu communities, Natuashish and Sheshatsiu;
- Subsidizing the shipment of food to isolated northern communities and promoting nutrition.
- The carry-forward from previous years of authorities for loans and loan guarantees; and
- Operating budget carry-forward.
Actual Spending reflects spending activity during the fiscal year as per the Public Accounts of Canada. A number of factors contributed to the difference of $223 million between Actual Spending ($8,235 million) and Total Authorities ($8,457 million), including:
- The deferral of certain initiatives to the following year where the funding will be used for the intended purposes (of particular note, payments related to the Indian Residential Schools Settlement Agreement, implementation of the Eeyou Marine Region Land Claim Agreement and treaty land entitlement in Manitoba and Saskatchewan, treaty-related measures, reform of child and family services in Manitoba, education funding for the Qalipu Mi’kmaq First Nation Band, as well as projects under the First Nation Infrastructure Fund and the Federal Contaminated Sites Action Plan);
- Carry-forward of resources (e.g., operating budget carry-forward) from fiscal year 2010-2011 to 2011-2012, as well as authorities for loans and loan guarantees that were not used in 2010-2011, but that will be available for use in subsequent years;
- Reduced loan requirements for First Nations involved in claim negotiations.
Canadian Polar Commission
|
|
Planned Spending |
Total Authorities |
Actual Spending |
|---|---|---|---|
|
Canadian Polar Commission |
1.0 |
1.1 |
1.0 |
|
|
Planned Spending |
Total Authorities |
Actual Spending |
|---|---|---|---|
|
Canadian Polar Commission |
5 |
5 |
0 |
Measuring AANDC Strategic Outcomes
AANDC strategic outcomes, taken collectively, reflect high level objectives for individual and community well-being for Aboriginal people and Northerners. Given the challenges around the measurement of well-being, including data collection, AANDC developed the Community Well-Being (CWB) Index.[13] Adapted from the Human Development Index (HDI) and drawing upon Statistics Canada’s Census of Population, this index is the primary indicator of AANDC results at the strategic outcome level.
The CWB is designed to measure quality of life over time for First Nation and Inuit communities in Canada in comparison to other Canadian communities. It focuses on four dimensions of quality of life – education, income, labour force participation and housing. As such, the CWB is considered a proxy measure; it does not define well-being as a concept or as an objective, but rather, contributes to the understanding of well-being and at a foundational level, to the understanding of AANDC results at the highest levels.
The following table summarizes the relationship of the index to these outcomes.
|
Strategic Outcomes |
CWB Components |
|---|---|
|
The Government |
Labour Force and Income |
|
The People |
Complete CWB Index and Education |
|
The Land |
Labour Force and Income |
|
The Economy |
Labour Force, Income and Housing |
|
The North |
Labour Force and Income |
|
Office of the Federal Interlocutor |
N/A |
The following graph highlights the CWB trend line over the past 25 years. From 1981 to 1996, there was significant progress in the CWB for First Nation and Inuit communities, which narrowed the well-being gap in relation to other Canadian communities. However, since 2001, there has been little or no progress in the CWB for First Nation and Inuit communities.
Average CWB Scores, 1981-2006
Source: Statistics Canada, 1981, 1991, 1996, 2001 and 2006 Census of Population.
CWB component highlights:
- Income has been increasing since 1981 in First Nations communities at a similar pace to other Canadian communities. Recent income increases in Inuit communities have occurred at a faster rate.
- Labour force activity has increased at relatively the same pace across all Canadian communities since 1981.
- Educational attainment has continued to increase since 1981, but since 2001, not at the same pace as other Canadian communities.
- While the housing score for Canadian communities has remained stable since 1981, the overall housing score for First Nation and Inuit communities declined between 2001 and 2006, particularly in relation to housing quality. The decline is particularly notable in Inuit communities. Housing quantity (crowding), however, has continued to improve significantly.
|
Performance Indicators |
Targets |
2010-2011 Performance |
|---|---|---|
|
Labour force and income components of the Community Well-Being (CWB) Index |
|
Refer to above description and/or detailed trend analysis of the CWB. http://www.ainc-inac.gc.ca/ai/rs/pubs/cwb/cwbdck-eng.asp.
AANDC has supported initiatives to strengthen First Nations governance in the areas of elections, by-law making, registration, membership and citizenship, and community planning. Through co-operative relationships, AANDC supported the consultation and engagement of stakeholders, the productivity of claims and self-government negotiations, and the achievement of settlements. |
|
($ millions) |
2009-2010 |
2010-2011[14] |
Alignment to |
|||
|---|---|---|---|---|---|---|
|
Main |
Planned |
Total |
Actual |
|||
|
Governance and Institutions of Government |
654.8 |
652.3 |
660.5 |
698.9 |
698.2 |
A diverse society that promotes linguistic duality and social inclusion |
|
Co-operative Relationships |
207.6 |
233.5 |
237.1 |
254.1 |
227.5 |
A diverse society that promotes linguistic duality and social inclusion |
|
Claims Settlements |
754.5 |
466.9 |
466.9 |
850.0 |
836.5 |
Strong economic growth |
|
Total |
1,617.0 |
1,352.7 |
1,364.5 |
1,803.0 |
1,762.2 |
|
Due to rounding, figures may not add up to total shown.
|
Performance Indicators |
Targets |
2010-2011 Performance |
|---|---|---|
|
Community Well-Being Index for First Nations and Inuit |
|
Refer to above description and/or detailed trend analysis of the CWB. http://www.ainc-inac.gc.ca/ai/rs/pubs/cwb/cwbdck-eng.asp.
AANDC focused on education and social program reform and the building of partnerships. In addition, significant work has been done on establishing and tracking service standards in relation to the managing individual affairs and residential schools resolution. |
|
($ millions) |
2009-2010 |
2010-2011[15] |
Alignment to |
|||
|---|---|---|---|---|---|---|
|
Main |
Planned |
Total |
Actual |
|||
|
Education |
1,738.5 |
1,763.4 |
1,769.3 |
1,789.5 |
1,785.2 |
A diverse society that promotes linguistic duality and social inclusion |
|
Social Development |
1,557.1 |
1,490.7 |
1,492.2 |
1,616.9 |
1,610.9 |
A diverse society that promotes linguistic duality and social inclusion |
|
Managing Individual Affairs |
27.7[16] |
261.3 |
261.3 |
603.3 |
557.4[17] |
A diverse society that promotes linguistic duality and social inclusion |
|
Total |
3,323.3 |
3,515.5 |
3,522.8 |
4,009.8 |
3,953.5 |
|
Due to rounding, figures may not add up to total shown.
|
Performance Indicators |
Targets |
2010-2011 Performance |
|---|---|---|
|
Labour force and income components of the Community Well-Being Index |
|
Refer to above description and/or detailed trend analysis of the CWB. http://www.ainc-inac.gc.ca/ai/rs/pubs/cwb/cwbdck-eng.asp.
The continued implementation of the Federal Framework on Aboriginal Economic Development has enabled the Department to strengthen the links between First Nation land management and economic development. This contributes to improving the economic well-being and prosperity of First Nations on reserve. |
|
($ millions) |
2009-2010 |
2010-2011[18] |
Alignment to |
|||
|---|---|---|---|---|---|---|
|
Main |
Planned |
Total |
Actual |
|||
|
First Nations Governance over Land, Resources and the Environment |
15.7 |
23.6 |
23.6 |
12.6 |
12.6 |
Strong economic growth |
|
Responsible Federal Stewardship |
126.9 |
112.7 |
112.7 |
169.0 |
164.6 |
A clean and healthy environment |
|
Clarity of Title to Land and Resources |
11.1 |
18.6 |
18.6 |
14.2 |
10.8 |
Strong economic growth |
|
Total |
153.7 |
155.0 |
155.0 |
195.9 |
188.0 |
|
Due to rounding, figures may not add up to total shown.
|
Performance Indicators |
Targets |
2010-2011 Performance |
|---|---|---|
|
Labour force, income and housing components of the Community Well-Being Index |
|
Refer to above description and/or detailed trend analysis of the CWB. http://www.ainc-inac.gc.ca/ai/rs/pubs/cwb/cwbdck-eng.asp.
The Department has undertaken a number of initiatives as part of the Federal Framework for Aboriginal Economic Development to support Aboriginal people in their efforts to improve social well-being and economic prosperity.
The Department continued to support projects that provide First Nation communities with a base of infrastructure that protects their health and safety and enables their engagement in the economy. |
|
($ millions) |
2009-2010 |
2010-2011[19] |
Alignment to |
|||
|---|---|---|---|---|---|---|
|
Main |
Planned |
Total |
Actual |
|||
|
Individual and Community Business Development |
58.4 |
56.1 |
56.1 |
55.3 |
55.3 |
Strong economic growth |
|
Community Investment |
88.9 |
117.5 |
133.5 |
189.7 |
109.5 |
Strong economic growth |
|
Community Infrastructure |
1,294.7 |
1,298.0 |
1,298.0 |
1,307.8 |
1,300.4 |
Strong economic growth |
|
Total |
1,442.0 |
1,471.6 |
1,487.6 |
1,552.8 |
1,465.2 |
|
Due to rounding, figures may not add up to total shown.
|
Performance Indicators |
Targets |
2010-2011 Performance |
|---|---|---|
|
Labour force and income components of the Community Well-Being Index for the North |
|
Refer to above description and/or detailed trend analysis of the CWB. http://www.ainc-inac.gc.ca/ai/rs/pubs/cwb/cwbdck-eng.asp.
As part of the Northern Strategy, AANDC moved forward a number of key initiatives to support the development of sustainable Northern communities and to improve the business climate while taking necessary steps to protect its fragile ecosystems and to provide Northerners with more control over their destinies. |
|
($ millions) |
2009-2010 |
2010-2011[20] |
Alignment to |
|||
|---|---|---|---|---|---|---|
|
Main |
Planned |
Total |
Actual |
|||
|
Northern Governance |
16.8 |
17.9 |
17.9 |
38.4 |
25.8 |
A diverse society that promotes linguistic duality and social inclusion |
|
Healthy Northern Communities |
121.0 |
101.4 |
101.4 |
117.0 |
115.0 |
Healthy Canadians |
|
Northern Land and Resources |
222.0 |
293.5 |
293.5 |
281.4 |
278.4 |
A clean and healthy environment |
|
Northern Economy[21] |
1.9 |
– |
– |
– |
– |
Strong economic growth |
|
Total |
361.7 |
412.7 |
412.7 |
436.8 |
419.2 |
|
Due to rounding, figures may not add up to total shown.
|
Performance Indicators |
Targets |
2010-2011 Performance |
|---|---|---|
|
Socio-economic conditions of Mķtis, non-status Indians and urban Aboriginal people[22] |
|
Based on analysis of Canada's Census data from 2001 to 2006, high school attainment, employment and average total income rates for Urban Aboriginal people in UAS designated cities increased by 1%.
The Office of the Federal Interlocutor for Mķtis and Non-Status Indians continued to partner with all levels of government, as well as with the private sector and Mķtis and non-status Indian organizations, to coordinate efforts and initiatives to contribute to improving socio-economic conditions. 2010-2011 initiatives focussed on increasing educational outcome, economic development and economic participation. |
|
($ millions) |
2009-2010 |
2010-2011[23] |
Alignment to |
|||
|---|---|---|---|---|---|---|
|
Main |
Planned |
Total |
Actual |
|||
|
Urban Aboriginal Strategy |
16.6 |
13.5 |
13.5 |
15.2 |
14.5 |
Income security and employment for Canadians |
|
Mķtis and Non-Status Indian Organizational Capacity Development |
16.2 |
14.7 |
14.7 |
16.5 |
15.9 |
A diverse society that promotes linguistic duality and social inclusion |
|
Mķtis Rights Management |
8.0 |
– |
– |
8.8 |
8.8 |
A diverse society that promotes linguistic duality and social inclusion |
|
Total |
40.8 |
28.2 |
28.2 |
40.5 |
39.2 |
|
Due to rounding, figures may not add up to total shown.
|
($ millions) Program Activity |
2009-2010 Actual Spending |
2010-2011 |
|||
|---|---|---|---|---|---|
|
Main |
Planned |
Total |
Actual |
||
|
Internal Services |
501.1 |
365.6 |
368.1 |
418.7 |
407.6 |
Canadian Polar Commission
|
Performance Indicators |
Targets |
2010-2011 Performance |
|---|---|---|
|
Performance indicator to be developed. |
|
Performance indicators under development. |
|
($ millions) |
2009-2010 |
2010-2011[24] |
Alignment to |
|||
|---|---|---|---|---|---|---|
|
Main |
Planned |
Total |
Actual |
|||
|
Research Facilitation and Communication |
0.7 |
0.8 |
0.8 |
0.8 |
0.8 |
A clean and healthy environment |
|
Total |
0.7 |
0.8 |
0.8 |
0.8 |
0.8 |
|
|
($ millions) |
2009-2010 |
2010-2011 |
|||
|---|---|---|---|---|---|
|
Main |
Planned |
Total |
Actual |
||
|
Internal Services |
0.3 |
0.2 |
0.2 |
0.2 |
0.2 |
Expenditure Profile
Departmental Spending Trend
Spending trend
AANDC’s Actual Spending for 2010-2011 was $8.2 billion. Overall, departmental spending has increased by about $1.2 billion or 18% since 2008-2009. This net increase is primarily due to the following major items:
- Incremental funding for the settlement of specific claims;
- An increase for obligations related to the implementation of the Indian Residential Schools Settlement Agreement;
- Incremental funding through Canada’s Economic Action Plan for First Nations housing; school construction; water and wastewater projects; child and family services; Arctic research infrastructure; and, remediation of contaminated sites both on reserves and in the North;
- Incremental funding to meet the demand for ongoing First Nation and Inuit programs and services (2% allowance for inflation and population growth);
- Funding provided under the Federal Contaminated Sites Action Plan related to the assessment, management and remediation of federal contaminated sites;
- Incremental funding provided in Budget 2008 for education, child and family services, and economic development.
These increases were partly offset by reduced requirements for out-of-court settlements.
2010-2011 Actual Spending by Strategic Outcome
The Department’s 2010-2011 actual spending of $8.2 billion is captured by six strategic outcomes ($7.8 billion covering 18 program activities), with the remaining $0.4 billion for the Internal Services program activity which supports all the strategic outcomes. The People strategic outcome makes up the largest portion of the funding ($4.0 billion or 48%) and includes the two largest program activities, Education and Social Development, with $1.8 billion and $1.6 billion in funding, respectively. The Government strategic outcome accounts for a further 21% (or $1.8 billion) while The Economy strategic outcome accounts for another 18% (or $1.5 billion). The remaining funding of $0.6 billion is allocated to The North, The Land, and the Office of the Federal Interlocutor strategic outcomes.
Explanation of Trend – Aboriginal Affairs and Northern Development Canada, 2009-2010 to 2010-2011

Due to rounding, figures may not add up to total shown.
The following graph depicts the 2010-2011 actual spending through another lens, reflecting key program elements of interest.
Due to rounding, figures may not add up to total shown.
The net increase of approximately $795 million in actual spending from 2009-2010 to 2010-2011 primarily reflects:
- Incremental funding for the settlement of specific claims;
- Incremental funding to meet the demand for ongoing First Nation and Inuit programs and services (2% allowance for inflation and population growth);
- An increase for obligations related to the implementation of the Indian Residential Schools Settlement Agreement;
- Incremental funding through Canada’s Economic Action Plan for First Nation housing; school construction; water and wastewater projects; child and family services; and Arctic research infrastructure;
- A reduction reflecting a one-time payment in 2009-2010 to the Quebec Cree to settle implementation issues for the James Bay and Northern Quebec Agreement.
Canada’s Economic Action Plan (CEAP) – Aboriginal Affairs and Northern Development Canada
|
($ millions) |
2010-2011 |
2010-2011 |
|---|---|---|
|
Water and Wastewater Systems |
86.0 |
119.1 |
|
Housing |
75.0 |
79.0 |
|
Schools |
128.2 |
91.5 |
|
Arctic Research Infrastructure (note 1) |
51.0 |
43.0 |
|
High Arctic Research Feasibility (note 2) |
0.8 |
0.7 |
|
First Nations Child and Family Services |
15.5 |
14.0 |
|
Accelerating Action on Contaminated Sites – South of 60th Parallel |
17.4 |
17.4 |
|
Accelerating Action on Contaminated Sites – North of 60th Parallel |
11.1 |
11.1 |
|
Promoting Energy Development in the North |
- |
- |
|
Total |
385.0 |
375.8 |
Notes: The difference between planned and actual spending is explained below:
- Additional non-CEAP funding from other sources (internal to the department) was added.
- The program did not get charged for the work completed by P3 Canada.
Canada’s Economic Action Plan was a $62 billion initiative to create and maintain jobs and stimulate the economy. The majority of the Plan’s investments were designated for 2009-2010 and 2010-2011, including $1.4 billion in investments for Aboriginal community initiatives and $500 million for the North. Infrastructure dedicated funds were managed as a single envelope over the Program duration, providing the necessary flexibility to readjust initial projections and timelines across all infrastructure initiatives (water and wastewater systems, housing, schools). These investments supported the Prime Minister’s commitment to promote greater economic participation of Aboriginal and Northern people, and to address the specific opportunities and challenges they face.
AANDC was responsible for a number of initiatives under the Canada Economic Action Plan, includŁing funding the construction and renovation of First Nations schools; water and wasteŁwater facilities on reserves; the remediation of contaminated sites both on reserves and across the North; and, the upgrade and develŁopment of research infrastructure through the Arctic Research Infrastructure Fund and the feasibility study for the Canadian High Arctic Research Station. The Department worked (and continues to work) alongside Canada Mortgage and Housing Corporation undertaking complementary housing activities such as lot servicing, creating new high-density developments, renovating existing housing units and assisting in the transition of band-owned units to market-based units.
Since March, 2010, in collaboration with several other departments, AANDC has produced three reports detailing the progress and community benefits resulting from the Aboriginal and Northern initiatives under Canada’s Economic Action Plan. These reports can be found on the departmental website at http://www.ainc-inac.gc.ca/ai/arp/bg09/index-eng.asp.
Estimates by Vote
For information on our organizational votes and/or statutory expenditures, please see the publication 2010-2011 Public Accounts of Canada (Volume II). An electronic version of the Public Accounts is available at http://www.tpsgc-pwgsc.gc.ca/recgen/txt/72-eng.html.