ARCHIVED - Indian and Northern Affairs Canada and Canadian Polar Commission - Report
 This page has been archived.
Archived Content
Information identified as archived on the Web is for reference, research or recordkeeping purposes. It has not been altered or updated after the date of archiving. Web pages that are archived on the Web are not subject to the Government of Canada Web Standards. As per the Communications Policy of the Government of Canada, you can request alternate formats on the "Contact Us" page.
2010-11
Departmental Performance Report
Aboriginal Affairs and Northern Development Canada and Canadian Polar Commission
The original version was signed by
The Honourable John Duncan
Minister of Aboriginal Affairs and Northern Development
Table of Contents
- Minister’s Message.
- Section I: Organizational Overview..
-
Section II: Analysis of Program Activities by Strategic Outcome.
- Strategic Outcome: The Government
- Strategic Outcome: The People.
- Strategic Outcome: The Land.
- Strategic Outcome: The Economy.
- Strategic Outcome: The North.
- Strategic Outcome: Office of the Federal Interlocutor
- Canada’s Economic Action Plan (CEAP)
- Canadian Polar Commission.
- Section III: Supplementary Information.
- Section IV: Other Items of Interest
Minister’s Message
 On behalf of Aboriginal Affairs and Northern Development Canada (AANDC) and the Canadian Polar Commission, I am pleased to present the 2010-2011 Departmental Performance Report. The report outlines progress made in the
past year to make Canada a better place for Aboriginal peoples and northern communities. This could not be done without partnerships that have been built with First Nations, Mťtis, Inuit and Northerners. I am very pleased to also note the steadily increasing engagement of provincial and territorial governments, the private sector, voluntary organizations and educational institutions on
Aboriginal and Northern issues.
On behalf of Aboriginal Affairs and Northern Development Canada (AANDC) and the Canadian Polar Commission, I am pleased to present the 2010-2011 Departmental Performance Report. The report outlines progress made in the
past year to make Canada a better place for Aboriginal peoples and northern communities. This could not be done without partnerships that have been built with First Nations, Mťtis, Inuit and Northerners. I am very pleased to also note the steadily increasing engagement of provincial and territorial governments, the private sector, voluntary organizations and educational institutions on
Aboriginal and Northern issues.
In 2010-2011, the Government continued and finalized the implementation of Canada’s Economic Action Plan (CEAP). The Government invested a total of $1.4 billion over two years in Aboriginal-specific initiatives and $500 million was dedicated specifically to supporting the Northern Strategy. Continuing to invest in the future of Aboriginal peoples and northern communities will help to foster the long-term prosperity of all Canadians.
Improving education outcomes for First Nation students continues to be a top priority. In 2010-2011, AANDC signed two new tripartite education agreements; one with the Government of Prince Edward Island and the Mi’kmaq First Nations of Prince Edward Island, and one with the Government of Saskatchewan and the Saskatoon Tribal Council. These are just some of the concrete examples of AANDC’s commitment to working with willing partners to ensure the delivery of quality education to First Nation learners in reaching their full potential.
We have also made progress in the area of Aboriginal economic development programs. Cross-country engagement sessions with Aboriginal communities, including Aboriginal women, and stakeholders were conducted to renovate the existing suite of Aboriginal economic development programs so they will better meet the needs of Aboriginal Canadians. As a result, changes to program design and delivery are planned for implementation in 2011-2012.
AANDC also continued to move forward on the Northern Strategy. In December 2010, the Government announced the mandate of the Canadian High Arctic Research Station (CHARS). The CHARS will undertake solution-driven science and technology, build partnerships, and leverage Canada’s research base to address economic, environmental and social challenges in the North.
Building on the achievements presented in this report, the Government of Canada will continue to develop and strengthen its partnerships. By working together, we will secure a bright, healthy and prosperous future for Aboriginal peoples and Northerners, today and for generations to come.
The Honourable John Duncan
Minister of Aboriginal Affairs and Northern Development
Section I: Organizational Overview
Raison d’Ítre
Aboriginal Affairs and Northern Development Canada (AANDC) supports Aboriginal peoples (First Nations, Inuit and Mťtis) and Northerners in their efforts to:
- Improve social well-being and economic prosperity;
- Develop healthier, more sustainable communities; and
- Participate more fully in Canada's political, social and economic development - to the benefit of all Canadians.
AANDC is one of the federal departments responsible for meeting the Government of Canada's obligations and commitments to First Nations, Inuit and Mťtis, and for fulfilling the federal government's constitutional responsibilities in the North. Most of the Department's programs, representing most of its spending, are delivered through partnerships with Aboriginal communities and federal-provincial or federal-territorial agreements. AANDC also works with urban Aboriginal persons, Mťtis and non-status Indians (many of whom live in rural areas) through the Office of the Federal Interlocutor.[1]
AANDC's mandate and wide-ranging responsibilities have been shaped by centuries of history and by unique demographic and geographic challenges.
Responsibilities
Indian and Inuit Affairs
AANDC’s responsibilities for Indian and Inuit Affairs include:
- Promoting improved education for Aboriginal people;
- Negotiating claims and self-government agreements with Aboriginal communities, and overseeing the implementation of settled claims on behalf of the federal government;
- Facilitating economic development opportunities for Aboriginal individuals, communities and businesses;
- Funding the delivery of provincial-type services such as education, housing, community infrastructure and social support to Status Indians on reserves;
- Addressing and resolving issues that arise from the legacy of Indian residential schools;
- Liaising effectively between the Government of Canada and Inuit governments and organizations in the implementation of policies and the delivery of services; and
- Fulfilling duties prescribed by the Indian Act, including managing Indian reserve lands and financial resources belonging to First Nation communities, and approving or rejecting bylaws in First Nation communities.
Office of the Federal Interlocutor
The mandate of the Office of the Federal Interlocutor (OFI) derives from an Order in Council providing authority to the Minister to act as the federal government’s primary interlocutor for Mťtis and non-status Indians, and to enter into contribution agreements with organizations representing Mťtis and off-reserve Aboriginal peoples.
The Office of the Federal Interlocutor is responsible for: maintaining and strengthening the Government of Canada’s relations with organizations representing Mťtis, non-status Indians and urban Aboriginal people; participating in negotiation processes; leading the Government of Canada response to the Supreme Court of Canada decisions in Powley; and, coordinating the government's Urban Aboriginal Strategy.
Northern Development
The Northern Development mandate derives from: the Department of Indian Affairs and Northern Development Act, 1970; legislation enacting modern treaties north of 60į, such as the Nunavut Land Claims Agreement Act; self-government agreements, such as the Yukon First Nations Self-Government Act; and, statutes dealing with environmental or resource management. Legislation that enacts the devolution of services and responsibilities from AANDC to territorial governments, such as the Canada-Yukon Oil and Gas Accord Implementation Act, also serves to frame the mandate.
This makes AANDC the lead federal department for two-fifths of Canada’s land mass, with a direct role in the political and economic development of the territories, and significant responsibilities for resource, land and environmental management. In the North, the territorial governments generally provide the majority of programs and services to all Northerners, including Aboriginal people.
AANDC’s responsibilities for Northern Development include:
- Promoting political and economic development in Yukon, the Northwest Territories and Nunavut;
- Negotiating the transfer of federal responsibilities for land and resource management to the territorial governments;
- Managing the resources, land and environment of the North in places where federal responsibilities have not been transferred to territorial governments;
- Co-ordinating initiatives, such as managing contaminated sites and subsidizing the cost of nutritious perishable food;
- Advancing circumpolar interests, such as Canada’s Arctic sovereignty, climate change adaptation and environmental protection, Canadian representation at circumpolar forums, and scientific research related to the North; and
- Implementing AANDC’s legal obligations arising from treaties and land claim agreements.
AANDC mandate also has an international dimension; the Department is actively engaged in international indigenous and circumpolar activities involving Aboriginal and northern organizations, states and international organizations.
The Canadian Polar Commission[2] is a relatively small separate agency that supports polar research through its broad mandate, which relates to the development, promotion and dissemination of knowledge of the polar regions. It carries out this mandate by co-operating with organizations, institutions and associations in Canada and elsewhere to undertake, support, and publish studies, to recognize achievements and to promote polar research and its application in Canada.
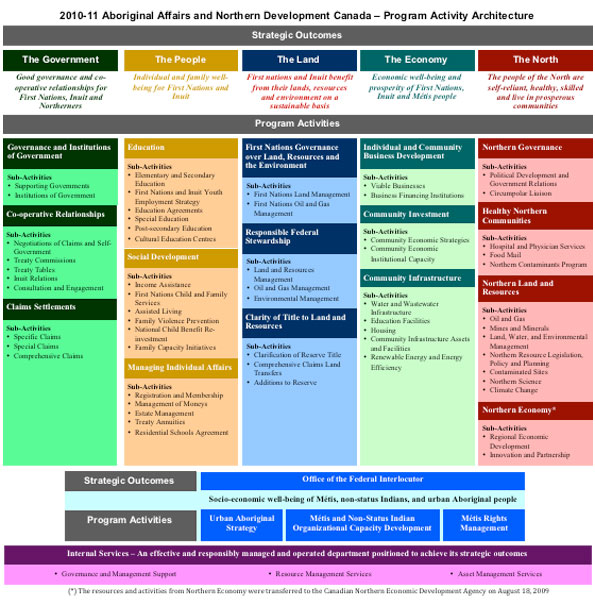
Strategic Outcome(s) and Program Activity Architecture (PAA)
Organizational Priorities
In its 2010-2011 Report on Plans and Priorities,[3] AANDC identified five priority areas:
- Education: Advance the Reforming First Nation Education Initiative;
- Economic Development: Continue the implementation of the new Federal Framework for Aboriginal Economic Development;
- Empowering Citizens and Protecting the Most Vulnerable: Continue program and policy reforms to help create more secure and sustainable communities;
- Northern Strategy: Provide ongoing leadership of the Government's integrated Northern Strategy, which was formally announced in July 2009; and
- Management Priorities: Improve the Department's management processes and ensure full implementation of the Policy on Transfer Payments.
|
Priority Status Legend |
|---|
|
Exceeded: More than 100% of the expected performance level for the priority identified in the corresponding RPP was achieved during the fiscal year. Met All: 100% of the expected performance level for the priority identified in the corresponding RPP was achieved during the fiscal year. Mostly Met: 80 to 99% of the expected performance level for the priority identified in the corresponding RPP was achieved during the fiscal year. Somewhat Met: 60 to 79% of the expected performance level for the priority identified in the corresponding RPP was achieved during the fiscal year. Not Met: Less than 60% of the expected performance level for the priority identified in the corresponding RPP was achieved during the fiscal year. |
|
Priority – Education: Advance the Reforming First Nation Education Initiative |
Type:[4] Ongoing |
Strategic Outcome(s) and/or Program Activity(ies): The People – Education program activity |
|---|---|---|
|
Status: Mostly Met The Department has made progress in advancing its plans under the Reforming First Nation Education Initiative. The First Nation Student Success Program (FNSSP) and partnership under the Education Partnerships Program (EPP) have seen the roll-out of school improvement plans and activities that focus on literacy, numeracy and student retention. In 2010-2011, two calls for FNSSP proposals were held and 17 projects were chosen by the National Selection Committee for funding. The FNSSP participation rate, based on the percentage of band-operated schools represented in approved proposals, was 90% which exceeded the target by 38%. The FNSSP projects are aimed at improving student achievement. In 2010-2011, AANDC’s work to develop tripartite education partnerships resulted in the signing of a tripartite education memorandum of understanding (MOU) with Prince Edward Island in August 2010, and with the Saskatoon Tribal Council in October 2010. These MOUs are concrete examples of AANDC’s collaborative approach to strengthening partnerships with First Nations and the provinces to improve educational outcomes in band-operated and provincial schools. Additional work in support of AANDC’s commitment to promote collaboration between First Nations, provinces, AANDC, and other stakeholders included the selection of 30 projects for funding under the Education Partnership Program (EPP). Of these projects, 19 received funding in 2010-2011, while 11 projects will be funded in 2011-2012. These EPP initiatives will support the work of officials, educators in regional First Nation organizations and schools, and those in provincial systems to better coordinate education-related programs that fall under federal, provincial, or First Nation areas of responsibility. While First Nation and Inuit access to post-secondary education improved in 2009-2010, completion rates regressed. The number of First Nation and Inuit students enrolled in post-secondary education programs in 2009-2010 was 22,567, which represents an increase of 3.2% from 2008-2009. In this same period, the number of First Nation and Inuit students completing post-secondary education was 3,809 which represents a decrease of 1.6% from 2008-2009. Fluctuations in completion rates are impacted by the length of post-secondary education programs as well as other variables.[5] In December 2010, the Government of Canada announced with the Assembly of First Nations the creation of the National Panel on First Nation Elementary and Secondary Education to explore and advise on the development of options, including legislation, to improve elementary and secondary education outcomes for First Nation children who live on-reserve. The Panel’s work is scheduled to be completed by the end of 2011. |
||
|
Priority – Economic Development: Continue the implementation of the new Federal Framework for Aboriginal Economic Development |
Type:[6] New |
Strategic Outcome(s) and/or Program Activity(ies): The Economy and The Land |
|---|---|---|
|
Status: Mostly Met AANDC continued the implementation of the Federal Framework for Aboriginal Economic Development. From May to December 2010, AANDC completed eight cross-country engagement sessions (including targeted sessions on women, youth, and remote communities) with key stakeholder groups to seek input on how to align programs and policies in order to better support the needs of Aboriginal individuals, businesses, and communities. Coming out of those consultations, in 2011-2012 the Department will implement changes to improve administration and delivery of its economic development programs. As well, progress continues on the full renovation of the programs. In 2010-2011 the Strategic Partnerships Initiative (SPI) was launched and strategic and whole-of-government initiatives were funded, totalling $7.4 million in five key economic sectors (agriculture, energy, fisheries, forestry, and mining). |
||
|
Priority – Empowering Citizens and Protecting the Most Vulnerable: Continue program and policy reforms to help create more secure and sustainable communities |
Type:[7] Ongoing |
Strategic Outcome(s) and/or Program Activity(ies): The People – Social Development program activity |
|---|---|---|
|
Status: Mostly Met AANDC advanced partnership agreements with First Nations and the provinces of Saskatchewan and Quebec to enhance the implementation of the Active Measures[8] employment promotion program and to improve program management and delivery. These formal partnerships, as well as those in Ontario and Alberta, have helped to improve the adoption of Active Measures projects that support income assistance beneficiaries in moving into the labour force. For example, partnerships with First Nations, provincial governments, Human Resources and Skills Development Canada, Health Canada and other stakeholders in all jurisdictions have resulted in cost-shared initiatives for 43% of 99 Active Measures pilot projects. The Piikani “Introduction to the Trades” in Alberta enabled 19 out of 20 youth income assistance recipients to find employment. In 2010-2011, AANDC invested $12.5 million in Active Measures projects, an investment that was supplemented by an additional $9.5 million from partners. In July 2010, to increase safety for First Nation children and families, an additional investment of $177 million over five years was announced for the First Nations Child and Family Services (FNCFS) Program in Manitoba, bringing ongoing federal enhanced funding in six jurisdictions to $100 million annually. Progress has been made in implementing Jordan’s Principle[9] with the provinces and First Nations. Nationally, a network of federal and provincial contacts has been put in place to address cases brought to their attention; none has resulted in a jurisdictional dispute. |
||
|
Priority – Northern Strategy: Ongoing leadership of the Government's integrated Northern Strategy, which was formally announced in July 2009 |
Type:[10] Ongoing |
Strategic Outcome(s) and/or Program Activity(ies): The North |
|---|---|---|
|
Status: Met All During 2010-2011, AANDC continued to lead the Northern Strategy by coordinating federal efforts on Northern initiatives, including senior committees. AANDC advanced a number of key initiatives to support the development of sustainable Northern communities and to improve the business climate while taking necessary steps to protect its fragile ecosystems and provide Northerners with more control over their destinies. Key initiatives led by AANDC included: Promoting social and economic development
Protecting our environmental heritage
Improving and devolving governance
|
||
|
Priority: Improve the Department's management processes |
Type:[11] Ongoing |
Strategic Outcome(s) and/or Program Activity(ies): Internal Services Program Activity |
|---|---|---|
|
Status: Somewhat Met Improvements to the Department’s management processes are assessed by the Treasury Board Secretariat through the Management Accountability Framework (MAF) assessment. Progress against the commitments can be found in Section II under the Internal Services program activity. The People Management commitment was only somewhat met, as it received an overall rating of “acceptable.” A strong rating was received in elements related to leadership, employee learning and official languages, however, a need to improve was indicated in areas related to executive stability, employee performance management, and workforce representation. Note: Governance and Planning was not among the areas selected by the Treasury Board Secretariat to be assessed and rated under MAF VIII; therefore, this target element cannot be measured for 2010-2011. |
||
|
Priority: Full implementation of the Policy on Transfer Payments |
Type:[12] New |
Strategic Outcome(s) and/or Program Activity(ies): Internal Services Program Activity |
|---|---|---|
|
Status: Mostly Met The full implementation of the Policy was mostly met with an implementation level set at 90%. A risk management approach was established that included the appropriate tools and processes. A strong focus was placed on recipient engagement with the delivery of 150 national and regional engagement sessions. New administrative processes also support standardized funding agreements and new funding approaches. Opportunities for collaboration with other federal departments are being pursued via two pilot projects. The final 10% of the PTP implementation still outstanding includes grant and provincial/ territorial funding agreement models, the ongoing work of the Special Representative on Reduced Reporting to help balance the administrative burden of reporting with risk, the review of the Intervention Policy and an inventory of service standards for individual programs. |
||
Risk Analysis
Managing Our Corporate Risks
Each year AANDC undertakes an exercise to review and update its Corporate Risk Profile (CRP). The CRP is a point-in-time representation of the most significant risks posing a threat to fulfilling AANDC’s mandate and objectives. The CRP was developed through analysis of key planning, audit and evaluation documents, as well as a series of comprehensive interviews with senior AANDC managers from all sectors and regions. This exercise resulted in the identification and assessment of eight key risks, grouped under two themes (see below).
|
Management & Accountabilities |
|
|---|---|
|
1. HR capacity and capabilities risk |
|
|
2. Information for decision-making risk |
|
|
3. Implementation risk |
|
|
4. Resource alignment risk |
|
|
|
|
|
Relationships & Partnerships |
|
|
5. Government partnership risk |
|
|
6. Aboriginal relationship risk |
|
|
7. External partnership risk |
|
|
8. Legal risk |
Once completed, the CRP informed the Department’s business planning cycle and was a key input in the Department’s priority-setting exercise. The activities put forward in the Department’s plans not only addressed the operational needs of individual programs, but, in turn, contributed to the overall management of the Department’s corporate risks.
The following reflect some key examples of mitigating actions:
- The “human resources capacity and capabilities risk” continued to be one of the higher risk areas in the 2010-2011 CRP. The Department updated its Human Resources Management Strategy and Plan with initiatives designed to enhance recruitment and training to mitigate this risk.
- The Education Information System (EIS) was introduced to better enable the Department to collect and provide access to reliable, timely, and consistent data to support decision-making related to education programming, partially mitigating the risk related to “information for decision-making”.
- A number of initiatives arising from the implementation of the Policy on Transfer Payments were put in place aimed at ensuring that risk-based approaches were incorporated into the development, implementation and management of programs. This included the establishment of a Recipient General Risk Assessment Tool and a Program Risk Assessment Tool aimed at ensuring the administrative requirements of recipients are proportionate to risk, and that appropriate program monitoring is put in place. Both are intended to assist in mitigating the “implementation risk”.
- In order to address its “resource alignment risk”, the Department set priorities for the year through its Corporate Business Plan and tracked progress through quarterly reporting and monthly financial reports.
- AANDC participated in a number of interdepartmental initiatives to foster productive relations with its federal partners. AANDC is also the lead on the Federal Framework for Aboriginal Economic Development and chairs many interdepartmental committees on Northern issues. Together these help to mitigate “government partnership risk”.
- The “Aboriginal relationship risk” was addressed, in part, through the numerous comprehensive and specific land claims and self-government negotiations that took place throughout the year, as well as through the implementation of Canada’s Action Plan on Consultation and Accommodation, including updated guidelines for federal officials.
- The Department’s “external partnership risks” were addressed through a number of devolution negotiations and agreements with provinces and territories.
- The Department has advanced a number of initiatives to address “legal risk” including: the out-of-court settlement of 11 cases; and active participation in the Interdepartmental ADM Working Group on Legal Risk Management and Integrated Risk Management and the Joint Steering Committee on Litigation. In addition, work has progressed on the Federal Contaminated Sites Action Plan.
Performance Summary
Aboriginal Affairs and Northern Development Canada
|
|
Planned Spending |
Total Authorities |
Actual Spending |
|---|---|---|---|
|
Aboriginal Affairs and Northern Development Canada |
7,339.0 |
8,457.4 |
8,234.9 |
|
|
Planned |
Actual |
Difference |
|---|---|---|---|
|
Aboriginal Affairs and Northern Development Canada |
5,202 |
5,294.2 |
92.2 |
The net increase of 92.2 full-time equivalents (FTEs) from 5,202.0 Planned to 5,294.2 Actual FTEs, is primarily due to supplementary funding received for additional programs. Such funding included but was not limited to: (1) the McIvor decision which brought in the Gender Equity in Indian Registration Act (Bill C-3); (2) Funding for legislative and regulatory changes to improve the Northern Regulatory Systems and to implement Commutative Impact Monitoring Program in the Northwest Territories and Nunavut; and (3) Support for the implementation of the First Nation Water and Wastewater implementation plan.
In addition, following a review of the FTEs captured under the Program Activity Internal Services, a realignment of FTEs was made from Internal Services to the appropriate program area. Details of the realignment are presented in Section IV.
Explanation of Variances
Variances between Main Estimates, Planned Spending, Total Authorities and Actual Spending are largely attributable to the timing of key elements of the fiscal cycle. The Main Estimates as approved by Parliament in the initial appropriations are the first step in the fiscal cycle.
The Planned Spending figure for 2010-2011 includes Main Estimates of $7,301 million, plus an additional $38 million in funding for those initiatives known when the Report on Plans and Priorities was prepared in January and February of the preceding fiscal year. The $38 million was primarily for initiatives outlined in Budget 2008 (education, child and family services, and economic development), as well as for the renewal of financial provisions of the Nisga’a Nation Fiscal Financing Agreement.
The Total Authorities represent Main Estimates plus Supplementary Estimates, plus adjustments to authorities approved by Treasury Board, such as the operating budget carry-forward. The difference of $1,118 million between Total Authorities ($8,457 million) and Planned Spending ($7,339 million) is largely due to:
- Funding provided in Supplementary Estimates for:
- Claims negotiations and settlements;
- Obligations related to the implementation of the Indian Residential Schools Settlement Agreement;
- The continued implementation of the First Nations Water and Wastewater Action Plan;
- Emergency management assistance activities on reserve for emergencies including but not limited to fires and floods;
- Out-of-court settlements;
- The First Nations Child and Family Services Program in Manitoba;
- The Mťtis rights management program renewal and the transfer of Mťtis and non-status Indian litigation management from the Department of Justice to AANDC;
- Continued support of two Labrador Innu communities, Natuashish and Sheshatsiu;
- Subsidizing the shipment of food to isolated northern communities and promoting nutrition.
- The carry-forward from previous years of authorities for loans and loan guarantees; and
- Operating budget carry-forward.
Actual Spending reflects spending activity during the fiscal year as per the Public Accounts of Canada. A number of factors contributed to the difference of $223 million between Actual Spending ($8,235 million) and Total Authorities ($8,457 million), including:
- The deferral of certain initiatives to the following year where the funding will be used for the intended purposes (of particular note, payments related to the Indian Residential Schools Settlement Agreement, implementation of the Eeyou Marine Region Land Claim Agreement and treaty land entitlement in Manitoba and Saskatchewan, treaty-related measures, reform of child and family services in Manitoba, education funding for the Qalipu Mi’kmaq First Nation Band, as well as projects under the First Nation Infrastructure Fund and the Federal Contaminated Sites Action Plan);
- Carry-forward of resources (e.g., operating budget carry-forward) from fiscal year 2010-2011 to 2011-2012, as well as authorities for loans and loan guarantees that were not used in 2010-2011, but that will be available for use in subsequent years;
- Reduced loan requirements for First Nations involved in claim negotiations.
Canadian Polar Commission
|
|
Planned Spending |
Total Authorities |
Actual Spending |
|---|---|---|---|
|
Canadian Polar Commission |
1.0 |
1.1 |
1.0 |
|
|
Planned Spending |
Total Authorities |
Actual Spending |
|---|---|---|---|
|
Canadian Polar Commission |
5 |
5 |
0 |
Measuring AANDC Strategic Outcomes
AANDC strategic outcomes, taken collectively, reflect high level objectives for individual and community well-being for Aboriginal people and Northerners. Given the challenges around the measurement of well-being, including data collection, AANDC developed the Community Well-Being (CWB) Index.[13] Adapted from the Human Development Index (HDI) and drawing upon Statistics Canada’s Census of Population, this index is the primary indicator of AANDC results at the strategic outcome level.
The CWB is designed to measure quality of life over time for First Nation and Inuit communities in Canada in comparison to other Canadian communities. It focuses on four dimensions of quality of life – education, income, labour force participation and housing. As such, the CWB is considered a proxy measure; it does not define well-being as a concept or as an objective, but rather, contributes to the understanding of well-being and at a foundational level, to the understanding of AANDC results at the highest levels.
The following table summarizes the relationship of the index to these outcomes.
|
Strategic Outcomes |
CWB Components |
|---|---|
|
The Government |
Labour Force and Income |
|
The People |
Complete CWB Index and Education |
|
The Land |
Labour Force and Income |
|
The Economy |
Labour Force, Income and Housing |
|
The North |
Labour Force and Income |
|
Office of the Federal Interlocutor |
N/A |
The following graph highlights the CWB trend line over the past 25 years. From 1981 to 1996, there was significant progress in the CWB for First Nation and Inuit communities, which narrowed the well-being gap in relation to other Canadian communities. However, since 2001, there has been little or no progress in the CWB for First Nation and Inuit communities.
Average CWB Scores, 1981-2006
Source: Statistics Canada, 1981, 1991, 1996, 2001 and 2006 Census of Population.
CWB component highlights:
- Income has been increasing since 1981 in First Nations communities at a similar pace to other Canadian communities. Recent income increases in Inuit communities have occurred at a faster rate.
- Labour force activity has increased at relatively the same pace across all Canadian communities since 1981.
- Educational attainment has continued to increase since 1981, but since 2001, not at the same pace as other Canadian communities.
- While the housing score for Canadian communities has remained stable since 1981, the overall housing score for First Nation and Inuit communities declined between 2001 and 2006, particularly in relation to housing quality. The decline is particularly notable in Inuit communities. Housing quantity (crowding), however, has continued to improve significantly.
|
Performance Indicators |
Targets |
2010-2011 Performance |
|---|---|---|
|
Labour force and income components of the Community Well-Being (CWB) Index |
|
Refer to above description and/or detailed trend analysis of the CWB. http://www.ainc-inac.gc.ca/ai/rs/pubs/cwb/cwbdck-eng.asp.
AANDC has supported initiatives to strengthen First Nations governance in the areas of elections, by-law making, registration, membership and citizenship, and community planning. Through co-operative relationships, AANDC supported the consultation and engagement of stakeholders, the productivity of claims and self-government negotiations, and the achievement of settlements. |
|
($ millions) |
2009-2010 |
2010-2011[14] |
Alignment to |
|||
|---|---|---|---|---|---|---|
|
Main |
Planned |
Total |
Actual |
|||
|
Governance and Institutions of Government |
654.8 |
652.3 |
660.5 |
698.9 |
698.2 |
A diverse society that promotes linguistic duality and social inclusion |
|
Co-operative Relationships |
207.6 |
233.5 |
237.1 |
254.1 |
227.5 |
A diverse society that promotes linguistic duality and social inclusion |
|
Claims Settlements |
754.5 |
466.9 |
466.9 |
850.0 |
836.5 |
Strong economic growth |
|
Total |
1,617.0 |
1,352.7 |
1,364.5 |
1,803.0 |
1,762.2 |
|
Due to rounding, figures may not add up to total shown.
|
Performance Indicators |
Targets |
2010-2011 Performance |
|---|---|---|
|
Community Well-Being Index for First Nations and Inuit |
|
Refer to above description and/or detailed trend analysis of the CWB. http://www.ainc-inac.gc.ca/ai/rs/pubs/cwb/cwbdck-eng.asp.
AANDC focused on education and social program reform and the building of partnerships. In addition, significant work has been done on establishing and tracking service standards in relation to the managing individual affairs and residential schools resolution. |
|
($ millions) |
2009-2010 |
2010-2011[15] |
Alignment to |
|||
|---|---|---|---|---|---|---|
|
Main |
Planned |
Total |
Actual |
|||
|
Education |
1,738.5 |
1,763.4 |
1,769.3 |
1,789.5 |
1,785.2 |
A diverse society that promotes linguistic duality and social inclusion |
|
Social Development |
1,557.1 |
1,490.7 |
1,492.2 |
1,616.9 |
1,610.9 |
A diverse society that promotes linguistic duality and social inclusion |
|
Managing Individual Affairs |
27.7[16] |
261.3 |
261.3 |
603.3 |
557.4[17] |
A diverse society that promotes linguistic duality and social inclusion |
|
Total |
3,323.3 |
3,515.5 |
3,522.8 |
4,009.8 |
3,953.5 |
|
Due to rounding, figures may not add up to total shown.
|
Performance Indicators |
Targets |
2010-2011 Performance |
|---|---|---|
|
Labour force and income components of the Community Well-Being Index |
|
Refer to above description and/or detailed trend analysis of the CWB. http://www.ainc-inac.gc.ca/ai/rs/pubs/cwb/cwbdck-eng.asp.
The continued implementation of the Federal Framework on Aboriginal Economic Development has enabled the Department to strengthen the links between First Nation land management and economic development. This contributes to improving the economic well-being and prosperity of First Nations on reserve. |
|
($ millions) |
2009-2010 |
2010-2011[18] |
Alignment to |
|||
|---|---|---|---|---|---|---|
|
Main |
Planned |
Total |
Actual |
|||
|
First Nations Governance over Land, Resources and the Environment |
15.7 |
23.6 |
23.6 |
12.6 |
12.6 |
Strong economic growth |
|
Responsible Federal Stewardship |
126.9 |
112.7 |
112.7 |
169.0 |
164.6 |
A clean and healthy environment |
|
Clarity of Title to Land and Resources |
11.1 |
18.6 |
18.6 |
14.2 |
10.8 |
Strong economic growth |
|
Total |
153.7 |
155.0 |
155.0 |
195.9 |
188.0 |
|
Due to rounding, figures may not add up to total shown.
|
Performance Indicators |
Targets |
2010-2011 Performance |
|---|---|---|
|
Labour force, income and housing components of the Community Well-Being Index |
|
Refer to above description and/or detailed trend analysis of the CWB. http://www.ainc-inac.gc.ca/ai/rs/pubs/cwb/cwbdck-eng.asp.
The Department has undertaken a number of initiatives as part of the Federal Framework for Aboriginal Economic Development to support Aboriginal people in their efforts to improve social well-being and economic prosperity.
The Department continued to support projects that provide First Nation communities with a base of infrastructure that protects their health and safety and enables their engagement in the economy. |
|
($ millions) |
2009-2010 |
2010-2011[19] |
Alignment to |
|||
|---|---|---|---|---|---|---|
|
Main |
Planned |
Total |
Actual |
|||
|
Individual and Community Business Development |
58.4 |
56.1 |
56.1 |
55.3 |
55.3 |
Strong economic growth |
|
Community Investment |
88.9 |
117.5 |
133.5 |
189.7 |
109.5 |
Strong economic growth |
|
Community Infrastructure |
1,294.7 |
1,298.0 |
1,298.0 |
1,307.8 |
1,300.4 |
Strong economic growth |
|
Total |
1,442.0 |
1,471.6 |
1,487.6 |
1,552.8 |
1,465.2 |
|
Due to rounding, figures may not add up to total shown.
|
Performance Indicators |
Targets |
2010-2011 Performance |
|---|---|---|
|
Labour force and income components of the Community Well-Being Index for the North |
|
Refer to above description and/or detailed trend analysis of the CWB. http://www.ainc-inac.gc.ca/ai/rs/pubs/cwb/cwbdck-eng.asp.
As part of the Northern Strategy, AANDC moved forward a number of key initiatives to support the development of sustainable Northern communities and to improve the business climate while taking necessary steps to protect its fragile ecosystems and to provide Northerners with more control over their destinies. |
|
($ millions) |
2009-2010 |
2010-2011[20] |
Alignment to |
|||
|---|---|---|---|---|---|---|
|
Main |
Planned |
Total |
Actual |
|||
|
Northern Governance |
16.8 |
17.9 |
17.9 |
38.4 |
25.8 |
A diverse society that promotes linguistic duality and social inclusion |
|
Healthy Northern Communities |
121.0 |
101.4 |
101.4 |
117.0 |
115.0 |
Healthy Canadians |
|
Northern Land and Resources |
222.0 |
293.5 |
293.5 |
281.4 |
278.4 |
A clean and healthy environment |
|
Northern Economy[21] |
1.9 |
– |
– |
– |
– |
Strong economic growth |
|
Total |
361.7 |
412.7 |
412.7 |
436.8 |
419.2 |
|
Due to rounding, figures may not add up to total shown.
|
Performance Indicators |
Targets |
2010-2011 Performance |
|---|---|---|
|
Socio-economic conditions of Mťtis, non-status Indians and urban Aboriginal people[22] |
|
Based on analysis of Canada's Census data from 2001 to 2006, high school attainment, employment and average total income rates for Urban Aboriginal people in UAS designated cities increased by 1%.
The Office of the Federal Interlocutor for Mťtis and Non-Status Indians continued to partner with all levels of government, as well as with the private sector and Mťtis and non-status Indian organizations, to coordinate efforts and initiatives to contribute to improving socio-economic conditions. 2010-2011 initiatives focussed on increasing educational outcome, economic development and economic participation. |
|
($ millions) |
2009-2010 |
2010-2011[23] |
Alignment to |
|||
|---|---|---|---|---|---|---|
|
Main |
Planned |
Total |
Actual |
|||
|
Urban Aboriginal Strategy |
16.6 |
13.5 |
13.5 |
15.2 |
14.5 |
Income security and employment for Canadians |
|
Mťtis and Non-Status Indian Organizational Capacity Development |
16.2 |
14.7 |
14.7 |
16.5 |
15.9 |
A diverse society that promotes linguistic duality and social inclusion |
|
Mťtis Rights Management |
8.0 |
– |
– |
8.8 |
8.8 |
A diverse society that promotes linguistic duality and social inclusion |
|
Total |
40.8 |
28.2 |
28.2 |
40.5 |
39.2 |
|
Due to rounding, figures may not add up to total shown.
|
($ millions) Program Activity |
2009-2010 Actual Spending |
2010-2011 |
|||
|---|---|---|---|---|---|
|
Main |
Planned |
Total |
Actual |
||
|
Internal Services |
501.1 |
365.6 |
368.1 |
418.7 |
407.6 |
Canadian Polar Commission
|
Performance Indicators |
Targets |
2010-2011 Performance |
|---|---|---|
|
Performance indicator to be developed. |
|
Performance indicators under development. |
|
($ millions) |
2009-2010 |
2010-2011[24] |
Alignment to |
|||
|---|---|---|---|---|---|---|
|
Main |
Planned |
Total |
Actual |
|||
|
Research Facilitation and Communication |
0.7 |
0.8 |
0.8 |
0.8 |
0.8 |
A clean and healthy environment |
|
Total |
0.7 |
0.8 |
0.8 |
0.8 |
0.8 |
|
|
($ millions) |
2009-2010 |
2010-2011 |
|||
|---|---|---|---|---|---|
|
Main |
Planned |
Total |
Actual |
||
|
Internal Services |
0.3 |
0.2 |
0.2 |
0.2 |
0.2 |
Expenditure Profile
Departmental Spending Trend
Spending trend
AANDC’s Actual Spending for 2010-2011 was $8.2 billion. Overall, departmental spending has increased by about $1.2 billion or 18% since 2008-2009. This net increase is primarily due to the following major items:
- Incremental funding for the settlement of specific claims;
- An increase for obligations related to the implementation of the Indian Residential Schools Settlement Agreement;
- Incremental funding through Canada’s Economic Action Plan for First Nations housing; school construction; water and wastewater projects; child and family services; Arctic research infrastructure; and, remediation of contaminated sites both on reserves and in the North;
- Incremental funding to meet the demand for ongoing First Nation and Inuit programs and services (2% allowance for inflation and population growth);
- Funding provided under the Federal Contaminated Sites Action Plan related to the assessment, management and remediation of federal contaminated sites;
- Incremental funding provided in Budget 2008 for education, child and family services, and economic development.
These increases were partly offset by reduced requirements for out-of-court settlements.
2010-2011 Actual Spending by Strategic Outcome
The Department’s 2010-2011 actual spending of $8.2 billion is captured by six strategic outcomes ($7.8 billion covering 18 program activities), with the remaining $0.4 billion for the Internal Services program activity which supports all the strategic outcomes. The People strategic outcome makes up the largest portion of the funding ($4.0 billion or 48%) and includes the two largest program activities, Education and Social Development, with $1.8 billion and $1.6 billion in funding, respectively. The Government strategic outcome accounts for a further 21% (or $1.8 billion) while The Economy strategic outcome accounts for another 18% (or $1.5 billion). The remaining funding of $0.6 billion is allocated to The North, The Land, and the Office of the Federal Interlocutor strategic outcomes.
Explanation of Trend – Aboriginal Affairs and Northern Development Canada, 2009-2010 to 2010-2011

Due to rounding, figures may not add up to total shown.
The following graph depicts the 2010-2011 actual spending through another lens, reflecting key program elements of interest.
Due to rounding, figures may not add up to total shown.
The net increase of approximately $795 million in actual spending from 2009-2010 to 2010-2011 primarily reflects:
- Incremental funding for the settlement of specific claims;
- Incremental funding to meet the demand for ongoing First Nation and Inuit programs and services (2% allowance for inflation and population growth);
- An increase for obligations related to the implementation of the Indian Residential Schools Settlement Agreement;
- Incremental funding through Canada’s Economic Action Plan for First Nation housing; school construction; water and wastewater projects; child and family services; and Arctic research infrastructure;
- A reduction reflecting a one-time payment in 2009-2010 to the Quebec Cree to settle implementation issues for the James Bay and Northern Quebec Agreement.
Canada’s Economic Action Plan (CEAP) – Aboriginal Affairs and Northern Development Canada
|
($ millions) |
2010-2011 |
2010-2011 |
|---|---|---|
|
Water and Wastewater Systems |
86.0 |
119.1 |
|
Housing |
75.0 |
79.0 |
|
Schools |
128.2 |
91.5 |
|
Arctic Research Infrastructure (note 1) |
51.0 |
43.0 |
|
High Arctic Research Feasibility (note 2) |
0.8 |
0.7 |
|
First Nations Child and Family Services |
15.5 |
14.0 |
|
Accelerating Action on Contaminated Sites – South of 60th Parallel |
17.4 |
17.4 |
|
Accelerating Action on Contaminated Sites – North of 60th Parallel |
11.1 |
11.1 |
|
Promoting Energy Development in the North |
- |
- |
|
Total |
385.0 |
375.8 |
Notes: The difference between planned and actual spending is explained below:
- Additional non-CEAP funding from other sources (internal to the department) was added.
- The program did not get charged for the work completed by P3 Canada.
Canada’s Economic Action Plan was a $62 billion initiative to create and maintain jobs and stimulate the economy. The majority of the Plan’s investments were designated for 2009-2010 and 2010-2011, including $1.4 billion in investments for Aboriginal community initiatives and $500 million for the North. Infrastructure dedicated funds were managed as a single envelope over the Program duration, providing the necessary flexibility to readjust initial projections and timelines across all infrastructure initiatives (water and wastewater systems, housing, schools). These investments supported the Prime Minister’s commitment to promote greater economic participation of Aboriginal and Northern people, and to address the specific opportunities and challenges they face.
AANDC was responsible for a number of initiatives under the Canada Economic Action Plan, includ≠ing funding the construction and renovation of First Nations schools; water and waste≠water facilities on reserves; the remediation of contaminated sites both on reserves and across the North; and, the upgrade and devel≠opment of research infrastructure through the Arctic Research Infrastructure Fund and the feasibility study for the Canadian High Arctic Research Station. The Department worked (and continues to work) alongside Canada Mortgage and Housing Corporation undertaking complementary housing activities such as lot servicing, creating new high-density developments, renovating existing housing units and assisting in the transition of band-owned units to market-based units.
Since March, 2010, in collaboration with several other departments, AANDC has produced three reports detailing the progress and community benefits resulting from the Aboriginal and Northern initiatives under Canada’s Economic Action Plan. These reports can be found on the departmental website at http://www.ainc-inac.gc.ca/ai/arp/bg09/index-eng.asp.
Estimates by Vote
For information on our organizational votes and/or statutory expenditures, please see the publication 2010-2011 Public Accounts of Canada (Volume II). An electronic version of the Public Accounts is available at http://www.tpsgc-pwgsc.gc.ca/recgen/txt/72-eng.html.
Section II: Analysis of Program Activities by Strategic Outcome
|
Performance Status Legend |
|---|
|
Exceeded: More than 100% of the expected performance level (as evidenced by the indicator and target or planned activities and outputs) for the result identified in the corresponding RPP was achieved during the fiscal year. Met All: 100% of the expected performance level (as evidenced by the indicator and target or planned activities and expected outputs) for the result identified in the corresponding RPP was achieved during the fiscal year. Mostly Met: 80 to 99% of the expected performance level (as evidenced by the indicator and target or planned activities and expected outputs) for the result identified in the corresponding RPP was achieved during the fiscal year. Somewhat Met: 60 to 79% of the expected performance level (as evidenced by the indicator and target or planned activities and outputs) for the result identified in the corresponding RPP was achieved during the fiscal year. Not Met: Less than 60% of the expected performance level (as evidenced by the indicator and target or planned activities and outputs) for the result identified in the corresponding RPP was achieved during the fiscal year. |
Strategic Outcome: The Government
Good governance and co-operative relationships for First Nations, Inuit and Northerners.
Program Activity: Governance and Institutions of Government
This program activity supports legislative initiatives, programs and policies, and administrative mechanisms that foster and support legitimate, stable, effective, efficient, publicly accountable and culturally relevant First Nation and Inuit governments.
|
Planned Spending |
Total Authorities |
Actual Spending |
|---|---|---|
|
660.5 |
698.9 |
698.2 |
The difference between Planned Spending and Total Authorities primarily reflects additional funding provided through Supplementary Estimates/Governor General Special Warrants for the First Nations Finance Authority and for the implementation of several Yukon self-government agreements, as well as the realignment of program-specific support funding from the Internal Services program activity.
|
Planned |
Actual |
Difference |
|---|---|---|
|
86 |
318.7 |
232.7 |
For an explanation of variance of FTEs, see Section IV: FTE Variance by Program Activity.
|
Expected Results |
Performance Indicators |
Targets |
Performance Status |
|---|---|---|---|
|
Governance capacity in First Nation communities and institutions
|
Percentage of Indian Act First Nations operating with a plan to develop governance capacity Percentage of First Nations free of financial management intervention as predefined by the departmental intervention policy[26] |
30% by March 31, 2011 More than 70% by March 31, 2011 |
Unable to Assess Met All |
|
Stable First Nations governments |
Percentage of Indian Act First Nations assessed for risk and governance capacity needs |
30% by March 31, 2011 |
Somewhat met |
Performance Summary and Analysis of Program Activity
In 2010-2011, AANDC continued to make progress on governance. For example, AANDC exceeded its target of more than 70% of First Nations being free of financial management intervention. Of the 586 First Nations measured, 76% were deemed free of financial management intervention as defined by the departmental intervention policy.
The Governance Capacity Planning Tool (GCPT) was created to serve as a mechanism to promote effective, capable and accountable government. Although 100% of First Nations were assessed under the general assessment, implementation of the GCPT was delayed until Q1 of 2011-2012, preventing AANDC from being able to assess the percentage of First Nations having a plan to develop governance capacity.
In addition, options were explored for a consolidated departmental approach to capacity. Together with consolidated Indian Government Support (IGS) programming, these initiatives support capable, accountable and effective First Nations governance by assisting communities in the identification of gaps, prioritizing governance, and developing capacity.
With respect to legislation and policy, the Department also continued to place emphasis on supporting conditions that empower citizens. Study continued on the impact of existing, pending and proposed legislative reform on the rights and freedoms of First Nations citizens. Several initiatives such as addressing the weaknesses of the Indian Act election system, a report on the readiness of First Nations to implement Bill C-21 (An Act to Amend the Canadian Human Rights Act), and the exploratory process on Indian registration, band membership and citizenship were launched during the year.
Finally, the Department continued to meet its obligations under the Indian Act concerning elections and law-making.
The evaluation of Indian Government Support Programs[27] in 2009 revealed that AANDC should seek ways to consolidate the delivery of Indian Government Support (IGS) to create administrative efficiencies both within the Department and for First Nation management. In 2009-2010, the Department proposed renewing the IGS program while maintaining focus on supporting First Nation governments. The Department found innovative ways to make progress by designing the Governance Capacity Planning Tool for community use, and by consolidating the multiple forms for four of the five programs into a single application form and a single report.
An evaluation of the Miawpukek First Nation (MFN) Grant Agreement[28] was completed in February 2011. Findings from the evaluation conclude that the Grant Agreement supports the MFN mission as well as the federal Treasury Board Policy on Transfer Payments by having a funding agreement in place that is flexible and sensitive to risk. The Grant Agreement is being implemented by MFN with a high degree of accountability to both Canada and band members. The evaluation recommended that AANDC explore the opportunity to make a grant funding arrangement similar to the MFN Grant Agreement available to other eligible First Nations.
Program Activity: Co-operative Relationships
Co-operative relationships are about mutual respect. They establish an atmosphere of trust, accountability and respectful partnerships among governments, First Nations and Inuit. Through this program activity, land claims and self-government agreements are negotiated and implemented, treaty relations between the Crown and First Nations are clarified, certainty is obtained over the ownership, use, and management of land and resources, and Inuit are effectively represented in federal policy decisions.
|
Planned Spending |
Total Authorities |
Actual Spending |
|---|---|---|
|
237.1 |
254.1 |
227.5 |
The difference between Planned Spending and Total Authorities primarily reflects incremental funding provided through Supplementary Estimates to continue to implement treaty-related measures with First Nations in British Columbia and to support the Nunavut Sivuniksavut in the purchase and renovation of a new school facility. The difference between Total Authorities and Actual Spending primarily reflects reduced loan requirements for First Nations involved in claims negotiations as well as the deferral of activities for treaty-related measures; the deferred funding has been reprofiled to 2011-2012.
|
Planned |
Actual |
Difference |
|---|---|---|
|
423 |
588.6 |
165.6 |
For an explanation of variance of FTEs, see Section IV: FTE Variance by Program Activity.
|
Expected |
Performance |
Targets |
Performance Status |
|---|---|---|---|
|
Relationships between parties based on trust, respect, understanding, shared responsibilities, accountability, rights and dialogue |
Percentage of active negotiation tables that are productive[29] |
90% of active tables by March 31, 2011 |
Exceeded |
|
Strengthened regional partnerships and improved information base
|
Number of multi-partner processes in support of Inuit priorities Number of outreach activities targeting various audiences to promote awareness of Inuit issues |
Baseline data on current activities to be established for 2010[30]
|
Met All Met All |
Performance Summary and Analysis of Program Activity
Canada sought to maintain productive relationships with Aboriginal claimant groups, leading to successful negotiations. In 2010-2011, of the 256 assessed active negotiations tables, 96% proved to be productive, thus exceeding the 90% target. This figure indicates improved relationships between parties, relationships based on trust, respect, understanding, shared responsibilities, accountability, rights and dialogue.
|
2010-2011 Negotiation Highlights:
|
For more information on agreements and land claims consult the ANNDC website on Acts, Agreements and Land Claims.[31]
Also in 2010-2011, the federal government made much progress on its commitment to advance the resolution of specific claims based on the Justice at Last initiative announced in June 2007.[32] A total of 133 specific claims were addressed. Out of that number, 18 claims were settled through negotiation for a total value of $665 million. In addition, a total of 31 claims have been accepted for negotiation.
Building on the 2007 Action Plan on Consultation and Accommodation and further direction, AANDC continued to develop tools to support federal officials in fulfilling the Crown’s duty to consult. This included releasing updated consultation guidelines, launching the Aboriginal and Treaty Rights Information System within the Department and establishing the Consultation Information Service to respond to information requests from stakeholders about the location and nature of Aboriginal and treaty rights. AANDC has also worked on strengthening partnerships. Discussions have been undertaken to conclude memoranda of understanding with provinces in relation to consultation and to develop consultation protocols with provinces/territories and Aboriginal groups.
Finally, in the context of the Department's relationship with Inuit communities, organizations and governments:
- The Nunavut Sivuniksavut grant was delivered in January 2011 to support the purchase of a new building that will enable the school to double student intake. The building formally opened on May 14, 2011. Significant progress has been made on the development of a new funding model for youth programming for the community of Pangnirtung, which will significantly reduce the administrative burden and improve the information base on the Community.
- AANDC worked with the Inuit Tapiriit Kanatami provincial and territorial partners who have jurisdiction for elementary and secondary education to propose a holistic approach to Inuit education which supports the development of an Inuit education strategy.
- The Department co-created a tri-partite partnership with the Government of Newfoundland and Labrador, the Nunatsiavut Government, Torngat Regional Housing Association and Statistics Canada to undertake a Nunatsiavut housing needs assessment.
|
DID YOU KNOW? The Government of Canada secured the establishment of a World Trade Organization (WTO) panel related to challenging the European Union seal product import ban. The request to establish a panel and the preparation for the WTO case was led by the Department of Foreign Affairs and International Trade in close cooperation with the Department of Fisheries and Oceans and the Inuit Relations Secretariat. |
In 2010-2011, AANDC also developed a number of successful initiatives to assist Canada in honouring its negotiated obligations. In April 2010, the Treaty Obligation Monitoring System was launched as a tool to monitor Canada’s obligations within comprehensive land claim and self-government agreements. Additionally, the Guide for Federal Implementers of Comprehensive Land Claims and Self-Government Agreements was approved by the federal caucus and issued by the Department.[33] It compiles the most up-to-date lessons and information available on the key principles, policies and processes that inform the implementation of agreements. Finally, in accordance with the terms of concluded agreements, the Department has tabled 11 annual reports on Comprehensive Land Claim Agreements.
Experience with closing negotiations at a number of final agreement and agreement-in-principle tables has highlighted for all parties the importance of building First Nations’ capacity to implement treaties and exercise self-governance. Furthermore, Canada has acquired valuable insight into the role that new media can play in improving voter participation once such agreements are put to ratification votes by signatory communities.
An evaluation of the Federal Government’s Implementation of Self-Government and Self-Government Agreements was completed in February 2011. Findings from the evaluation concluded that the 1995 Inherent Right Policy (IRP) has provided a flexible framework from which self-government has been, and continues to be, negotiated. Self-government under the IRP has remained relevant and positive impacts have been demonstrated within self-governing communities. However, the transition to self-government has proven to be a complex, incremental process and the delivery of effective programs and services remains a major challenge for all levels of government in Canada. A number of inefficiencies in both the negotiation and implementation processes have been identified, many of which are currently being addressed by AANDC.[34]
To date, Canada's approach to ongoing fiscal arrangements of self-governing Aboriginal groups has been to negotiate with individual self-governing groups for funding renewals, typically every five years. If this practice is continued, the resources required to renew fiscal financing agreements will grow exponentially as more treaty and self-government agreements are concluded. In addition to resource challenges by all parties, these are complex negotiations which often require extensions before new agreements are put in place. Over the past five years, all 18 fiscal financing agreements that have required renewal, have required some form of extension. Extensions are annual funding arrangements which create financial uncertainty for self-governing Aboriginal groups. A new formula-based approach to fiscal relations with self-governing Aboriginal groups that will be more transparent, predictable and efficient than the current approach of negotiating time-limited fiscal agreements is being developed. AANDC has initiated a broad-based national engagement with Aboriginal groups on the development of this new approach.
Program Activity: Claims Settlements
This program activity provides approved payments to Aboriginal groups for the settlement of special, specific and comprehensive claims that were successfully concluded through negotiations.
|
Planned Spending |
Total Authorities |
Actual Spending |
|---|---|---|
|
466.9 |
850.0 |
836.5 |
The difference between Planned Spending and Total Authorities primarily reflects incremental funding provided through Supplementary Estimates for specific claims settlements, the settlement of the Treaty Land Entitlement claims submitted by the Bigstone Cree, and to implement the Eeyou Marine Region Land Claim Agreement. The difference between Total Authorities and Actual Spending primarily reflects the deferral of funding for the implementation of the Eeyou Marine Region Land Claim Agreement; this deferred funding has been reprofiled to 2011-2012.
|
Planned |
Actual |
Difference |
|---|---|---|
|
- |
- |
- |
The Claims Settlement Program Activity is used for the identification of settlement payments only. There are no activities and consequently no FTEs reported against it.
|
Expected |
Performance |
Targets |
Performance |
|---|---|---|---|
|
Canada honours its negotiated obligations |
Percentage of planned claims settlement dollars transferred during the fiscal year in accordance with specific, special and comprehensive claim negotiations |
100% |
Met All |
Performance Summary and Analysis of Program Activity
In 2010-2011, AANDC settled 18 specific claims and transferred $616 million to First Nations under the terms of these settlement agreements. Of the claims settled in 2010-2011, $50 million from the Bigstone Cree settlement will be paid out in 2011-2012 as per the agreement. By transferring planned claims settlement dollars in accordance with specific claim negotiations, Canada has demonstrated its commitment to honouring its negotiated obligations.
Strategic Outcome: The People
Individual and family well-being for First Nations and Inuit.
Program Activity: Education
This program activity seeks to provide First Nations and Inuit with the tools to achieve educational outcomes comparable to those of other Canadians. Education programs will continue to support the provision of elementary and secondary education services. These services include continuing the reforms of First Nation education through a student success program and a partnership program. The Education Program will also provide special education services, financial supports for Status Indians and Inuit to participate in post-secondary education, and support to the culture and education centres.
|
Planned Spending |
Total Authorities |
Actual Spending |
|---|---|---|
|
1,769.3 |
1,789.5 |
1,785.2 |
The difference between Planned Spending and Total Authorities relates primarily to the reallocation of resources, mainly from Community Infrastructure, to meet increased demand for education programs and services. In addition, incremental funding was provided through Supplementary Estimates for continued support of the two Labrador Innu communities of Natuashish and Sheshatsiu, continued support of the Youth Employment Strategy, and for First Nations SchoolNet Youth Initiatives. The difference between Total Authorities and Actual Spending primarily reflects the deferral of funding for the Qalipu Mi’kmaq First Nation Band; the deferred funding has been reprofiled to 2011-2012.
|
Planned |
Actual |
Difference |
|---|---|---|
|
222 |
238.1 |
16.1 |
For an explanation of variance of FTEs, see Section IV: FTE Variance by Program Activity.
|
Expected |
Performance |
Targets |
Performance |
|---|---|---|---|
|
First Nation students achieve educational outcomes comparable to those achieved by students in the provincial system where the reserve is located
|
High school graduation rates Percentage of First Nation communities (nationally) that have undertaken tripartite education partnership activities |
Increase graduation rates of First Nation students by 2013 at a rate comparable to the increases in provincial graduation rates 75% of First Nation communities represented in Education partnerships program proposals by 2013 |
Unable to assess[35] Exceeded |
|
First Nation and Inuit learners have improved post-secondary educational attainment |
Number of First Nation and Inuit students enrolled in post-secondary institutions |
Increase the number of students enrolled in post-secondary institutions |
Met All |
Performance Summary and Analysis of Program Activity
From the most recently available data, the graduation rate for grade 12 students (grade 11 in Quebec) living on reserve decreased from 35.6 in 2008-2009 to 33.3 percent in 2009-2010, with only marginal variations between males and females.
In 2010-2011, AANDC moved forward with the implementation of school improvement plans and activities under the First Nation Student Success Program (FNSSP). Focussing on literacy, numeracy and student retention, the FNSSP had a participation rate of 90% based on the percentage of band-operated schools represented in approved proposals. AANDC has also worked in collaboration with the Assembly of First Nations on the development of an education information system (EIS). The EIS will provide First Nations with access to education data and will allow AANDC to better monitor performance and support continuous program improvement.
Initially, the change of approach represented by the implementation of the FNSSP and EPP programs proved challenging. However, First Nations are opting-in to this new approach as demonstrated by the high participation rates and the number of proposals received for these programs, which have far exceeded available resources. Moreover, the initial feedback has been positive regarding the improvements seen in schools, particularly in the case of literacy.
In 2010-2011, new tripartite partnerships were also established. In Prince Edward Island, the memorandum of understanding (MOU) signed in August 2010 provides a framework for collaboration on a joint education action plan (for early childhood, kindergarten to grade 12, and transition to post-secondary), student transitions, the development of new tuition agreements (including re-investments in provincial First Nation educational programming) and performance criteria. In Saskatchewan, the MOU with the Saskatoon Tribal Council and the Government of Saskatchewan, signed in October 2010, focuses on priority areas including student transition and retention, family and community involvement, and professional and resource development. It is expected that further partnership development will continue in Quebec, Ontario and Saskatchewan.
In the area of post-secondary education, AANDC continued to provide funding to First Nations to support post-secondary education. The most recent data in post-secondary education programs indicates a 3.2 % increase from 2008-2009.
Work to improve education for First Nation students living on reserve continued on a range of fronts. In December 2010, AANDC, in collaboration with the Assembly of First Nations, announced the creation of a National Panel to lead an engagement process on the development of options, including legislation, to improve elementary and secondary education outcomes for First Nation children who live on-reserve.
AANDC has learned that the systematic collection and analysis of evidence on program outcomes is essential in order to make better decisions about program relevance and performance, as well as exploring alternative program delivery methods. A comprehensive and reliable base of evaluation evidence is thus required to support policy and program improvement, expenditure management, decision making, and public reporting. In response to these lessons learned, AANDC developed the Education Performance Measurement Strategy, which will be implemented in fiscal 2011-2012, and is also developing an education information system to facilitate overall performance measurement and efficiency. As part of this work, potential new targets for high school graduation and retention rates will be developed that will take into account the policy recommendations of the National Panel and ongoing work with provincial and First Nation partners.
Program activity: Social Development
This program activity supports the safety and well-being of First Nation individuals and families through the delivery of social services on reserves. Social services include support for a wide range of basic and special needs for individuals, as well as services focused on families and the community as a whole.
|
Planned Spending |
Total Authorities |
Actual Spending |
|---|---|---|
|
1,492.2 |
1,616.9 |
1,610.9 |
The difference between Planned Spending and Total Authorities relates primarily to the reallocation of resources, mainly from Community Infrastructure, to meet increased demand for social development programs and services. In addition, incremental funding was provided through Supplementary Estimates for the First Nations Child and Family Services Program to implement a prevention-focused approach in Manitoba and for continued support of the two Labrador Innu communities of Natuashish and Sheshatsiu. The difference between Total Authorities and Actual Spending primarily reflects the deferral of funding for the prevention-focused approach for child and family services in Manitoba; this deferred funding has been reprofiled to 2011-2012.
|
Planned |
Actual |
Difference |
|---|---|---|
|
66 |
116.3 |
50.3 |
For an explanation of variance of FTEs, see Section IV: FTE Variance by Program Activity.
|
Expected |
Performance |
Targets |
Performance |
|---|---|---|---|
|
Reduced dependence on income assistance
|
Income assistance dependency rates in communities
|
Reduce national income assistance dependency rate for First Nations annually by an average of 1%; Achieve rate reductions in specific communities. |
Not Met
|
|
First Nation families and children have a safe environment |
Number of jurisdictions that have transitioned to the Enhanced Prevention Focused Approach (EPFA) to First Nation child and family services |
Implementation in all provinces and Yukon by 2013 |
Somewhat Met |
Performance Summary and Analysis of Program Activity
In 2010-2011, AANDC continued to work in key priority areas including: renewing policy authority and direction forward for the Income Assistance program; supporting First Nations communities to implement active measures; continuing to provide support through the National Child Benefit Reinvestment and the Assisted Living Program; expanding the Enhanced Prevention Focused Approach for First Nations Child and Family Services (FNCFS); and developing the Social Development Performance Measurement Strategy.
A total of $12.5 million was allocated to support 99 Active Measures projects for First Nations on reserve across Canada. These projects provided opportunities for eligible beneficiaries to participate in appropriate training and employment, improve their literacy and basic skills, as well as build case management and service delivery capacity of First Nations social development workers.
During this fiscal year, AANDC implemented two Active Measures tripartite agreements with Quebec and Saskatchewan which focused on voluntary and collaborative approaches to transition beneficiaries to employment in select communities.
The income assistance dependency rates in Aboriginal communities increased nationwide between 2009 and 2010 from 34% to 35%. The recent economic downturn, combined with a growing Aboriginal population on reserve, may explain the increase in the dependency rates on income assistance. The rise in dependency rates on reserve mirrors the increase observed in all provinces and territories during the past two years.
A total of 6 jurisdictions have transitioned to the Enhanced Prevention Focused Approach (EPFA) for Child and Family Services, covering 68% of all First Nations children normally residing on reserve. Work to transition the remaining jurisdictions is ongoing with a goal to transition most jurisdictions to the EPFA by 2014-2015.
Work continued on implementing Jordan’s Principle.[36] A draft tripartite joint statement was finalized with New Brunswick. British Columbia and the federal government developed a draft joint process document and engaged First Nations representatives. Saskatchewan continued to roll out commitments in their tripartite implementation plan. Manitoba and the federal government continued to work together on a process to resolve cases and engage First Nations. Nationally, a network of focal points worked to resolve cases brought to their attention with none advancing to a jurisdictional dispute.
AANDC completed the Implementation Evaluation of the EPFA in Alberta for the First Nations Child and Family Services Program.[37] The evaluation found that the prevention approach is more culturally appropriate, responsive to community needs and effective at addressing the root causes of high numbers of children in care, such as income levels and parental addictions, than traditional child welfare approaches. All the recommendations are currently being addressed. AANDC has learned through both the Alberta evaluation and on-the-ground delivery experience under the Enhanced Prevention Focused Approach (EPFA) that EPFA implementation is taking longer to roll out, and that greater capacity development is required in the first year before continuing with more funding and full implementation in the second year. AANDC will be looking to revise the approach accordingly.
Program Activity: Managing Individual Affairs
This program activity provides programs and services to First Nation governments, communities and individuals, including registration and band membership, certificates of Indian Status and the provision of treaty payments. Under this activity, the Department also administers First Nation estates, the creation of new bands, and individual and band moneys held in trust in the Consolidated Revenue Fund. It also includes responsibility for Canada’s role in the Indian Residential Schools Settlement Agreement. AANDC oversees the federal obligations outlined in the agreement and other federal initiatives related to the impact of residential schools on Aboriginal people in Canada.
|
Planned Spending |
Total Authorities |
Actual Spending |
|---|---|---|
|
261.3 |
603.3 |
557.4 |
The difference between Planned Spending and Total Authorities primarily reflects incremental funding provided through Supplementary Estimates for obligations related to the implementation of the Indian Residential Schools Settlement Agreement. The difference between Total Authorities and Actual Spending primarily reflects the deferral of payments related to the Indian Residential Schools Settlement Agreement; this deferred funding has been reprofiled to 2011-2012.
|
Planned |
Actual |
Difference |
|---|---|---|
|
646 |
604.1 |
-41.9 |
For an explanation of variance of FTEs, see Section IV: FTE Variance by Program Activity.
|
Expected |
Performance |
Targets |
Performance |
|---|---|---|---|
|
Well-managed affairs (registration, membership, moneys, estates, and treaty annuities) for First Nations individuals and families |
Service standards for each activity Registration and membership Management of moneys Estate management Treaty annuities |
Meet standards[38]
|
Met All / Exceeded Mostly Met Exceeded Met All |
|
Well-managed implementation of the Indian Residential Schools Settlement Agreement |
Conformity with obligations and service standards defined by the Indian Residential Schools Settlement Agreement Common Experience Payment (CEP) Independent Assessment Process (IAP) |
Meet the obligations and service standards[39]
|
Mostly Met Mostly Met |
Performance Summary and Analysis of Program Activity
AANDC has made significant progress in establishing and implementing service standards as well as in meeting performance targets based on those standards.
In taking action to fulfil the government’s responsibility relating to the McIvor decision, the Government of Canada brought the Gender Equity in Indian Registration Act into force on January 31, 2011. It effectively amended the Indian Act to grant eligibility for registration (Indian status) to grandchildren of women who had lost status for marrying non-Indian men. As a result of this legislation, 45,000 persons are now newly entitled to registration as an Indian under the Indian Act. A dedicated processing unit was put in place and service targets were established to ensure decision issuance within 6 months and thus improved service for applicants. In March 2011, several additional service standards were established for registration under the Indian Act. Performance will be assessed against those service standards in 2011-2012.
AANDC continued to fulfill Canada’s obligations under the Indian Residential Schools Settlement Agreement (IRSSA) to promote reconciliation with Aboriginal peoples, and between Aboriginal and non-Aboriginal peoples. The deadline to submit applications for the Common Experience Payment (CEP) is September 19, 2011. As of March 31, 2011, 96% of the estimated 80,000 former students eligible for CEP have received compensation. The average individual payment is $19,445 and a total of $1.578 billion has been paid out.
Efforts in 2010-2011 focussed on processing reconsideration requests, preparing appeals for consideration by the National Administration Committee, and finalizing files that required policy direction from senior management and from the court monitor. By January 2011, 95% of these files had been processed and completed. As well, a total of 73% (558 of 765) of CEP applications that did not require extensive research were completed within the 28-day service standard, while 98% (985 out of 1,001) of simple reconsideration requests were completed within the 150-day service standard. AANDC also cleared the backlog in processing requests to add schools to the IRSSA and established a 60-day service standard for processing new requests.
As of March 31, 2011, the volume of claims under the Independent Assessment Process (IAP) already exceeded, by 50%, the 2006 forecast of 12,500 and stood at 18,744 claims allowed.[40] To address this higher volume, in the final quarter of 2010-2011, the IRS Adjudication Secretariat increased the annual hearing capacity to 3,500 (1,000 more than required under the IRSSA). The IRS Adjudication Secretariat’s ability to hold 3,500 hearings in 2010-2011 was brought about by significant internal organizational changes as well as by adjustments by AANDC and the parties to the Settlement Agreement without diminished quality or fairness to claimants.
Of the 18,744 claims allowed, 8,955 (47.8%) have been settled. In 2010-2011, AANDC paid out $434.1 million (including $54.6 million in payments at year-end). This represents $112.9 million more than in 2009-2010, a cumulative total of $1.038 billion in compensation. Payments are made within 20 days 80% of the time. AANDC also cleared the research backlog of 765 files in November 2010 and reduced the average number of days for IAP research from 157 days on April 1 to 54 days by September 2010.
These improvements allowed a shortened time for document disclosure to the Adjudication Secretariat from 55% disclosed within 165 days in the first quarter (Q1) to 84% in the fourth (Q4). The fiscal year’s performance is at 72% (4,270 out of 5,895) of document packages disclosed within the 165-day service standard. As well, 100% (3,503 out of 3,503) scheduled hearings for 2010-2011 were attended by the federal government. Finally, AANDC has initiated a business process improvement project to improve its performance. Although it does not reflect drastically in the fiscal year performance (73%, i.e., 2,075 of 2,842), IAP represented claimants were paid within the 20-day service standard after the decision review period), the performance rose from 39% in Q1 to 94% in Q4.
In 2010-2011, AANDC continued to meet its obligations under the IRSSA with respect to the TRC by ensuring participation of high-level government officials at TRC national events and continuing to disclose all relevant documents to the TRC in an organized manner. AANDC has been designated the lead department to coordinate the federal government’s obligation to disclose relevant Indian residential school documents to the TRC .[41]
On June 11, 2008, the Prime Minister made a historic Statement of Apology in the House of Commons to former students of Indian residential schools on behalf of the Government of Canada and all Canadians,[42] that set a firm foundation for building a solid reconciliation framework. To build on this foundation, AANDC will continue to partner with other government departments to implement the Government of Canada’s obligations under the Settlement Agreement to help move from a divided past to a more united future.
Significant gains and achievements have been made through the various modernization initiatives, such as Indian registration, estates, Indian moneys and the IAP compensation business process improvement. The ongoing development and implementation of service standards has proven to be an excellent tool for improving program delivery and services to clients. Service standards, based on industry best practices, have greatly enhanced our ability to measure performance.
Strategic Outcome: The Land
First Nations and Inuit benefit from their lands, resources and environment on a sustainable basis.
Program Activity: First Nations Governance over Land, Resources and the Environment
This program activity includes the implementation of the First Nations Land Management (FNLM) regime and the First Nations Oil and Gas and Moneys Management Act (FNOGMMA).
|
Planned Spending |
Total Authorities |
Actual Spending |
|---|---|---|
|
23.6 |
12.6 |
12.6 |
|
Planned |
Actual |
Difference |
|---|---|---|
|
21 |
27.2 |
6.2 |
For an explanation of variance of FTEs, see Section IV: FTE Variance by Program Activity.
|
Expected |
Performance |
Targets |
Performance |
|---|---|---|---|
|
More First Nations assume full control over reserve land, resource and environmental management under the FNLM regime, or oil and gas management under FNOGMMA |
Number of new operational First Nations managing their own reserve land, resources, environment, or oil and gas
|
Four new operational First Nations under FNLM by March 31, 2011 One new operational First Nation under FNOGMMA by March 31, 2011 |
Mostly Met Not Met |
Performance Summary and Analysis of Program Activity
Under the FNLM regime, participating First Nations are able to gain control over their reserve lands and establish their own land, resource and environmental systems to support expanded economic development on reserves. Over the last fiscal year, 4 developmental[43] First Nations had a successful ratification vote, 3 of which became operational, and 1 of which will proceed to become operational during the summer of 2011 following the recent successful vote.
To meet the challenge of providing more First Nations with the opportunity to opt into the FNLM regime, the Department undertook a study of the costs and benefits to the Government of Canada and to First Nations of managing reserve lands under the Indian Act and the FNLM regime. Based on the results of this study and in partnership with the First Nations Land Advisory Board, the First Nations Land Management Resource Centre and participating First Nations, the Department has been working on new methodologies for re-opening the regime, with a particular emphasis on economic development and capacity.
The target of having 1 new operational First Nation under FNOGMMA was not met as the program has been on hold since June 2010 to consider and address a number of program delivery issues that were highlighted in a summative evaluation.
The summative evaluation of the FNOGMMA found First Nations face a number of barriers when opting into the Act. This includes the complexity of the oil and gas regulatory regime, limited community capacity, and concerns over the impact on the fiduciary relationship with the Crown. Other barriers have also been identified with respect to enforcement mechanisms, provincial requirements for indemnification, and some opt-in provisions. A key lesson learned is the need to integrate into the assessment process the specific capacity needs of individual First Nations as well as the risk factors that could affect completion of the FNOGMMA process. This would ensure that appropriate mitigation measures are identified and prepared before a First Nation community enters into the program. Work is ongoing to revise the program to better facilitate the mechanism for First Nation governance of oil and gas.
Program Activity: Responsible Federal Stewardship
Through this program activity, the Department discharges both the statutory obligations and the fiduciary duties of the federal Crown in the areas of land, resource and environmental management. This activity also supports the development of First Nation governance in all these areas.
|
Planned Spending |
Total Authorities |
Actual Spending |
|---|---|---|
|
112.7 |
169.0 |
164.6 |
The difference between Planned Spending and Total Authorities primarily reflects additional funding provided for contaminated sites and for emergency management activities on reserve. The difference between Total Authorities and Actual Spending primarily reflects funding for emergency management activities on reserve that was not required.
|
Planned |
Actual |
Difference |
|---|---|---|
|
285 |
344.2 |
59.2 |
For an explanation of variance of FTEs, see Section IV: FTE Variance by Program Activity.
|
Expected |
Performance |
Targets |
Performance |
|---|---|---|---|
|
Responsible federal stewardship of reserve lands, resources and environment
|
Number of new First Nations operating under the Reserve Land and Environment Management Program Amount of moneys collected per year by Indian Oil and Gas Canada on behalf of First Nation communities as a result of oil and gas operations conducted on reserve lands Percentage reduction of financial liability for high- and medium-risk contaminated sites on reserves known as of April 1, 2010 |
20 by March 31, 2011 $100 million by March 31, 2011 15% by March 31, 2011 |
Mostly Met Exceeded Exceeded |
Performance Summary and Analysis of Program Activity
Under the Reserve Land and Environment Management Program (RLEMP), First Nations develop the capacity to make their communities ready to capitalize on land-based economic development opportunities on reserves. Sixteen new First Nations were operating under RLEMP in 2010-2011. The target was mostly met as there was difficulty recruiting First Nations to participate in the RLEMP due to high travel costs and extended periods of absence from their communities for required training. Mitigating strategies to address the recruitment and retention issues related to RLEMP participation include online learning and the opportunity for First Nations to obtain core competencies through local post-secondary institutions. Since 2009, a total of 50 First Nations have entered into RLEMP training. Of these 50 First Nations, 27 have become certified land managers and an additional 14 are expected to complete their training in April 2012.
The First Nations Certainty of Land Title Act was passed in June 2010. It allows interested First Nations to develop commercial real estate on reserve land. The Act provides greater certainty of land title including title assurance, which makes the value of the property comparable to similar developments off reserve.
Indian Oil and Gas Canada exceeded the $100 million target by collecting $256.5 million on behalf of First Nations as a result of oil and gas operations conducted on reserve lands. This amount included $42 million collected under clause 5.08 of the Saskatchewan Treaty Land Entitlement Act and over $51.4 million in bonuses from two large agreements. Higher than anticipated oil prices and the economy’s growing strength contributed to these results.
Work also progressed on the development of a number of modules that will be used to amend and modernize the Indian Oil and Gas Regulations to ensure sound stewardship of oil and gas resources and an investment-ready regime. These were reviewed and discussed with the Indian Resources Council of Canada via a joint technical committee created for that purpose. The process to amend the regulations has been split into modules that are being developed at the same time to speed up completion.
Remediation of contaminated sites is a key component of both responsible federal stewardship and the AANDC response to Chapter 6 of the 2009 Fall Report of the Auditor General of Canada[44] on land management and environmental protection on reserves. The Department’s known liability for contaminated sites on April 1, 2010 was $312,385,096 and the corresponding closing liability on March 31, 2011 was $236,675,521, an overall reduction of 24% as of March 31, 2011. While continuing assessment work will adjust this figure during the 2011-2012 fiscal year, this result exceeded the projections of 15%.
The National Priority Ranking System for Contaminated Sites (NPRSCS) was developed to ensure limited funding was distributed to the highest priority sites nationwide. The NPRSCS was also developed to provide an evidence-based, neutral and nationally consistent approach to planning for contaminated site management on reserve. The NPRSCS was implemented in February 2011, and was applied to site selection for the next three years of funding (2011-2014). At the same time, work continued on the environmental regulatory gap and benefitted from the development of the NPRSCS. The maturation of complementary work on land management and regulatory barriers to land development, committed to in the Federal Framework for Aboriginal Economic Development, produced beneficial synergies between land management and environmental management activities conducted by AANDC on reserve. This has led to a more comprehensive strategy to be further developed in 2011-2012.
The NPRSCS tool, along with the renewed focus on remediation activities, has identified opportunities to address priority sites in a better controlled, more efficient manner. Moving forward, effort will continue to be invested in seizing these opportunities over the 2011-2012 fiscal year. Land management and environmental protection and regulation are not mutually exclusive but complementary. By strengthening land management and supporting First Nations in controlling development on reserve, the environmental regulatory gap can be narrowed through a comprehensive approach to the development of safe, healthy communities.
Program Activity: Clarity of Title to Land and Resources
This program activity includes clarification of title to reserve lands, adding land to reserves, and implementing land transfers under specific and comprehensive claims settlement agreements.
|
Planned Spending |
Total Authorities |
Actual Spending |
|---|---|---|
|
18.6 |
14.2 |
10.8 |
The difference between Planned Spending and Total Authorities primarily reflects the reduced funding requirements for the implementation of treaty land entitlement in Saskatchewan. The difference between Total Authorities and Actual Spending also primarily reflects the deferral of activities associated with the implementation of treaty land entitlement in Saskatchewan. Specifically, payments to the Saskatchewan Association of Rural Municipalities and to the Province of Saskatchewan for compensation for the loss of their tax base as a result of the settlement of treaty land are not required in 2010-2011 due to delays in the transfer of lands to reserve status; this deferred funding that was not required in 2010-2011 has been reprofiled to 2011-2012.
|
Planned |
Actual |
Difference |
|---|---|---|
|
52 |
49.4 |
-2.6 |
For an explanation of variance of FTEs, see Section IV: FTE Variance by Program Activity.
|
Expected |
Performance |
Targets |
Performance |
|---|---|---|---|
|
Land added to reserves to fulfil legal obligations |
Percentage of ministerial orders and orders in council for additions to reserves processed in accordance with published service standards |
90% by March 31, 201 |
Not met |
Performance Summary and Analysis of Program Activity
Delays in the approval process resulted in service standards for additions to reserves not being met for the 2010-2011 fiscal year. Despite these delays, 145,654 acres were added to reserves. By year end, 42% of orders in council and 48% of ministerial orders met the established service standards. The Department obtained approval for 16 submissions which supported related treaty land entitlement (TLE).
In order to improve results and to better support First Nations in the first phase of the Additions to Reserve process (land selection), an Additions to Reserve toolkit and training package was developed in partnership with the National Aboriginal Land Managers Association. The toolkit and training package are tailored to the needs of First Nations as purchasers of land to be added to reserves, informing them of their roles and responsibilities, those of AANDC, issues and best practices related to existing third-party interests, environmental issues, and other important components of this phase of the process.
The 2010-2011 Impact Evaluation of Contributions to Indian Bands for Land Management on Reserve[45] revealed that while land administration on reserve is becoming increasingly complex, AANDC’s activities are achieving success in some areas. However, it was recommended that improvements be made to the design and delivery of all activities under analysis. Accordingly, a thorough analysis addressing additions to the reserve and approval processes will be completed in 2011-2012 to achieve the goal of improving results without sacrificing commitments to due diligence.
Strategic Outcome: The Economy
Economic well-being and prosperity of First Nations, Inuit and Mťtis People.
Program Activity: Individual and Community Business Development
This program activity helps aspiring Aboriginal business people deal with the unique challenges and barriers to participating in Canada's economy and sharing in the national prosperity. AANDC's Aboriginal Business Development Program supports sustainable business development and a modern business climate. Program activities and funding help individuals and communities to access private sector business financing at competitive rates, and obtain business information and advice. The program also facilitates private sector partnerships in major business projects, and supports Aboriginal-owned or controlled financing institutions in providing developmental lending and advisory services to Aboriginal businesses.
|
Planned Spending |
Total Authorities |
Actual Spending |
|---|---|---|
|
56.1 |
55.3 |
55.3 |
|
Planned |
Actual |
Difference |
|---|---|---|
|
70 |
90.7 |
20.7 |
For an explanation of variance of FTEs, see Section IV: FTE Variance by Program Activity.
|
Expected |
Performance |
Targets |
Performance |
|---|---|---|---|
|
Increased business ownership by First Nations, Inuit and Mťtis individuals and communities |
Aboriginal self-employment rate |
8% by March 31, 2011 |
N/A (note) |
|
Viable businesses |
Survival rates of businesses 1 year after receiving financial contribution from Aboriginal Business Development Program |
90% by March 31, 2011 |
Exceeded |
Note: Aboriginal self-employment rate is being collected in the 2011 Census. It will become available for reporting in 2013-2014.
Performance Summary and Analysis of Program Activity
The Department met its targets by successfully delivering 99% of the initial allocation target. $16.4 million was delivered to support 266 small business establishment, acquisition and expansion initiatives. As a result, the annual survival rate target for businesses supported through the Aboriginal Business Development Program reached 96%.
A review of the overall health of Aboriginal financial institutions (AFIs) was also completed and, subsequent to the review, business improvement plans were implemented in over 75% of the AFI Network with the remaining 25% scheduled for completion in early 2011-2012. Additionally, Aboriginal financial institution recapitalization procedures were enhanced based on new financial management criteria, which included due diligence and good governance, allowing two AFIs to be recapitalized for a total of $2.9 million.
To address the limited range of financing provided by commercial lenders and markets to Aboriginal businesses, the Loan Loss Reserve Initiative continued to work with seven existing partners (who loaned a total of $3.7 million during 2010-2011) to improve performance. No new arrangements were created during 2010-2011 while a program review was implemented and the results assessed. The outcome of this review will provide useful data for the program renovation process scheduled for completion in 2011-2012.
The Major Resource and Energy Development Investment Initiatives funds support Aboriginal participation in major resource and energy projects by providing greater access to capital. During 2010-2011, this initiative approved $4.5 million in support of 17 business projects in the resource and energy sectors. Additionally, two investment funds, the Kwilmu’kw Maw-Kusuaqn Negotiation Office (KMKNO) and the Mťtis Economic Development Organization (MEDO), were created with combined disbursements of $6 million ($3 million each).
Current data and experience indicate that an increasing number of Aboriginal communities and business groups are involved or becoming involved in major projects. Program records show a large proportion of funding - $2.38 million approved - was for renewable energy projects (hydro, wind and solar) while demand for financial assistance for mining, forestry and other resource-related projects - $2.49 million - remained strong. Given that demand for major project funding far exceeds the current budgetary allocation, Major Resource and Energy Development funding assistance increasingly targets pre-development costs. Based on the lessons learned over the last two years, future programming will focus more on the funding of pre-development activities, such as pre-feasibility studies, feasibility studies and business plans, which create the opportunity to attract additional private or public financing, support the establishment of strategic partnerships, improve project credibility while enabling projects to move faster and better position themselves for success.
Program Activity: Community Investment
This program activity enhances the ability of communities to benefit from economic development opportunities. The programs supporting this goal include the Community Economic Opportunities Program, the Aboriginal Workforce Participation Initiative, the Procurement Strategy for Aboriginal Business, the Community Economic Development Program and the Community Support Services Program. Program activities and funding help communities to identify and activate economic potential resulting in more community employment, greater use of land and resources under community control, enhanced community economic infrastructure, more and larger community businesses, more business opportunities, and a better environment for community economic development.
|
Planned Spending |
Total Authorities |
Actual Spending |
|---|---|---|
|
133.5 |
189.7 |
109.5 |
The difference between Planned Spending and Total Authorities primarily reflects the carry-forward from previous years of funding for loans and loan guarantees through the Indian Economic Development Account offset by reduced requirements for the Strategic Partnerships Initiative. The difference between Total Authorities and Actual Spending primarily reflects the carry-forward to future years of funding for loans and loan guarantees through the Indian Economic Development Account.
|
Planned |
Actual |
Difference |
|---|---|---|
|
91 |
112.9 |
21.9 |
For an explanation of variance of FTEs, see Section IV: FTE Variance by Program Activity.
|
Expected |
Performance |
Targets |
Performance |
|---|---|---|---|
|
Increased First Nations, Inuit and Mťtis participation within the federal Procurement Strategy for Aboriginal Business |
Number of Aboriginal businesses newly certified under the Procurement Strategy for Aboriginal Business |
1,000 |
Somewhat Met |
|
Enhanced capacity of First Nations and Inuit communities to identify and assess community economic development opportunities |
Number of First Nation and Inuit communities submitting economic development plans with clearly identified investment opportunities and targets |
30 |
Met all |
Performance Summary and Analysis of Program Activity
The Procurement Strategy for Aboriginal Business (PSAB) is a low-cost high-impact initiative that is being strengthened through the Federal Framework for Aboriginal Economic Development investment. In 2010-2011, 37 procurement readiness training sessions were delivered to Aboriginal communities across the regions, thereby increasing their awareness of government procurement opportunities and procedures. Within government, AANDC reviewed 360 projects and made 36 requests to other departments to consider Aboriginal procurement, resulting in 12 projects being set aside for Aboriginal bidding.
The target of having 1000 PSAB-certified Aboriginal businesses was partially met with 599 Aboriginal businesses registered during 2010-2011. The target was not fully met due to a requirement to modify the process and registration form in order to meet the new PSAB criteria. To address the shortfall, the Department began using tools for PSAB delivery that create better links between government and the private sector and assist Aboriginal businesses in accessing procurement opportunities outside of the federal government. Finally, the development of negotiating, business and financial literacy tools that provide Aboriginal businesses with the capacity and expertise to explore and acquire procurement opportunities will further improve procurement opportunities for Aboriginal bidders.
The Community Economic Development Program provided core financial support of approximately $49 million to over 500 First Nations and Inuit communities for public services in economic development. This resulted in community economic development planning and capacity development initiatives, the leveraging of financial resources, partnership development and effective service delivery.
In addition, the Community Support Services Program provided approximately $5 million in funding for 30 one-time projects and ongoing initiatives that support capacity development for Economic Development Officers in First Nation and Inuit community economic development organizations. Lastly, the Community Economic Opportunities Program provided over $25 million in proposal-driven support for approximately 150 projects to 122 First Nations and Inuit communities that had identified economic development opportunities with demonstrated significant economic benefits for their respective communities.
The findings from audits,[46] evaluation and feedback from stakeholders revealed a consensus that existing programs needed to be overhauled to become more responsive to clients’ unique conditions, challenges, needs and opportunities. In particular, community economic development planning was undertaken by many communities to fulfill AANDC program requirements rather than as a strategic planning exercise. As a result, the majority of economic development plans were prepared in isolation from other community planning processes, and without long-term priorities. As a result, they were rarely fully implemented.
Program renovation is being considered as an opportunity to make improvements based on the lessons learned. The overhaul will consider funding predictability and stability in supporting the local delivery of economic development, and land and environmental management services. Moreover, support for strategic plans, technical assistance, training, and skills development will be considered as well as development of the skills that are required to effectively implement community economic plans.
Program Activity: Community Infrastructure
This program activity includes the Capital Facilities and Maintenance Program, which provides funding to First Nations to build and maintain community facilities such as water supply, wastewater treatment and community buildings. Additional support is provided through the application-based First Nation Infrastructure Fund.
|
Planned Spending |
Total Authorities |
Actual Spending |
|---|---|---|
|
1,298.0 |
1,307.8 |
1,300.4 |
The difference between Planned Spending and Total Authorities primarily reflects reallocations to address pressures in other program activities (notably Education and Social Development programs and services) offset by incremental funding provided through Supplementary Estimates to continue to support the implementation of the First Nations Water and Wastewater Action Plan. The difference between Total Authorities and Actual Spending primarily reflects the deferral of projects under the First Nation Infrastructure Fund; this deferred funding that was not required in 2010-2011 has been reprofiled to 2011-2012.
|
Planned |
Actual |
Difference |
|---|---|---|
|
225 |
261.5 |
36.5 |
For an explanation of variance of FTEs, see Section IV: FTE Variance by Program Activity.
|
Expected |
Performance |
Targets |
Performance |
|---|---|---|---|
|
Decrease in number of high-risk water systems |
Percentage of First Nation communities with systems with low or medium water and wastewater facility risk ratings |
85% by March 31, 2011 |
Not Met |
|
Education facilities are in good condition and meet health and safety standards |
Percentage of First Nations education facilities with a fair or greater condition rating (based on physical/ structural condition) |
80% by March 31, 2011 |
Not Met |
|
Housing infrastructure is in good condition |
Percentage of First Nation-reported “adequate” community houses per First Nation community (overall physical condition) |
5% increase annually |
Not Met |
Performance Summary and Analysis of Program Activity
In partnership with First Nations representatives, AANDC began a comprehensive review of the current approach to financing First Nation infrastructure. Regional engagement sessions on infrastructure financing were held as part of the Lands and Economic Development Program renewal commitment and targeted discussions were held with key organizations, including the National Aboriginal Economic Development Board. The review found that First Nations communities’ ability to use alternative financing varies greatly, and identified a need for enhanced capacity development on financing and infrastructure management. Those findings align with the recommendations of the 2010 Evaluation of the Capital Facilities Maintenance Program.[47] According to the evaluation, there is a need to improve training in project management and technical areas to augment the skill base within First Nation administration and to provide multi-year funding. Work to review the funding of on-reserve infrastructure and develop options is continuing. Legislation enabling the development of a regulatory regime for water and wastewater on reserve was introduced in the Senate, but further work was suspended by the federal election. In collaboration with First Nations, the Department is continuing to explore options to close the regulatory gap for water and wastewater in First Nations communities.
The two-year National Assessment of Water and Wastewater Systems in First Nations Communities was completed in Spring 2011. As a result, 61% of systems have been rated as either Medium (34%) or Low (27%) risk. The Capital Facilities and Maintenance Program has also been reviewing its overall program assessment criteria. This work has identified gaps between baseline data and the expected outcome targets set for programs, which have resulted in targets not being met.
The analysis of education facilities program data indicated that the previous baseline of 70% (and consequently, the target of 80%) in “fair” or better condition was incorrect. Data integrity has been restored and a new baseline of 50% has been established, with amended targets.
For 2010, 72% of community houses were reported as “adequate” for their overall physical condition by the recipient First Nations communities. This represents no change from the 2009 data reports. The 2010 evaluation of AANDC’s On-Reserve Housing Support Program[48] showed that while there have been absolute increases in the number of homes constructed on reserve, population growth and rapid deterioration of homes has meant that construction has not kept pace with need. The need was identified for greater capacity development, clearer articulation of policies and more collaborative work to ensure future improvement.
Internal reviews are being conducted to understand how housing program performance may be improved, and targets for housing are being reviewed and amended. To improve both program performance and performance measurement, the Department has worked to modernize information management and communication protocols, leading to substantive improvements in both the integrity and management of data.
Between 2007-2008 and 2010-2011, the ecoENERGY for Aboriginal and Northern Communities Program (EANC) was able to achieve its goal of supporting 124 clean energy projects, which are projected to reduce greenhouse gas emissions by an estimated 1.3 megatonnes over a 20-year period. An evaluation of the EANC found that under its main goal of reducing greenhouse gases and criteria air contaminants emissions, the EANC is a relevant federal and AANDC program. The Program has continued to work with Regional Operations and Lands and Economic Development to develop a coordinated and strategic departmental approach to addressing energy sustainability issues in Aboriginal and northern communities, including off-grid communities.
The National Assessment of First Nations Water and Wastewater Systems[49] was the most rigorous and comprehensive evaluation of water and wastewater systems on reserve ever undertaken by the federal government. The assessment provided a much more complete picture than had been previously available, and the outcomes strongly reinforce the need for regulations and enforceable standards. It also highlighted the critical importance of capacity building in protecting drinking water on reserve. Moving forward, these outcomes will support ongoing work with First Nations and other partners to ensure First Nations communities have access to clean drinking water. In collaboration with First Nations, the Department is continuing to explore options to close the regulatory gap for water and wastewater in First Nations communities. Work to review the financing of on-reserve infrastructure and develop options is continuing.
|
2010-2011 Success Story: Alberta Region Drinking Water Advisory Work Plan In November, 2010, AANDC Alberta Region partnered with Health Canada and the First Nations (Alberta) Technical Services Advisory Group (TSAG) to develop a plan to address long-standing drinking water advisories (DWAs) within their authorities. A collaborative approach was adopted to look at a subset of DWAs. Where appropriate, proven alternative water treatment technologies were used. In just a few short months and with only $60,000 in funding, four long-standing DWAs in the region were lifted. What was learned about the use of alternative water treatment technologies as a cost-effective alternative to addressing water quality issues is being shared throughout AANDC. |
Strategic Outcome: The North
The people of the North are self-reliant, healthy and skilled, and live in prosperous communities.
Program Activity: Northern Governance
This program activity strengthens northern governments for all Northerners through the devolution of province-like responsibilities for the land and natural resources; effective intergovernmental mechanisms; the management of strategic issues; and, the strengthening of intergovernmental co-operation, domestically and internationally, on circumpolar issues.
|
Planned Spending |
Total Authorities |
Actual Spending |
|---|---|---|
|
17.9 |
38.4 |
25.8 |
The difference between Planned Spending and Total Authorities primarily reflects the carry-forward from previous years of funding for loan authorities as well as the realignment of program-specific support funding from the Internal Services program activity. The difference between Total Authorities and Actual Spending primarily reflects the carry-forward to future years of funding for these loan authorities.
|
Planned |
Actual |
Difference |
|---|---|---|
|
31 |
125.1 |
94.1 |
For an explanation of variance of FTEs, see Section IV: FTE Variance by Program Activity.
|
Expected |
Performance |
Targets |
Performance Status |
|---|---|---|---|
|
Devolution of land and resource management to the Government of the Northwest Territories |
Completed phases of the five phases of devolution: protocol, agreement in principle, final agreement, legislation, and implementation |
Phase 2 completed by March 31, 2011 |
Met All |
|
Devolution of land and resource management to the Government of Nunavut |
Completed phases of the five phases of devolution |
Continue to work with the Government of Nunavut and Nunavut Tunngavik Incorporated toward initiation of formal negotiations for an agreement in principle |
Mostly Met |
|
Canadian interests are reflected in national and international circumpolar co-operation activities |
Canadian priorities advanced through activities under the Arctic Council and Canada-Russia co-operation |
Active participation in 2010-2011 |
Mostly Met |
Performance Summary and Analysis of Program Activity
AANDC continued to support negotiations toward the devolution of responsibilities to the Government of the Northwest Territories and the Government of Nunavut. Extensive bilateral discussions and multilateral main table preparation sessions were held involving the Government of Canada, the Government of the Northwest Territories and participating Aboriginal Groups. On January 26, 2011, the agreement in principle (Phase 2) was signed by the Government of Canada, the Government of the Northwest Territories and the Inuvialuit Regional Corporation. The Northwest Territory Mťtis Nation signed on February 9, 2011. The parties have commenced planning work towards Phase 3 of the devolution process, which is the negotiation of the final devolution agreement.
Engagement continued in Nunavut with devolution discussed in meetings between the Minister and the Premier of Nunavut on four occasions. The Department continues to work with the territorial government and Nunavut Tunngavik Incorporated with a view to developing options for moving forward.
In the lead up to the May 2011 Arctic Council Ministerial meeting, AANDC worked in consultation with other federal departments, territorial governments and Aboriginal partners to ensure that Canada’s northern priorities and interests were reflected in the Nuuk Ministerial Declaration and Senior Arctic Officials’ Report to Ministers. AANDC also pursued Canadian interests through its memorandum of understanding with the Russian Federation by sharing best practices in Aboriginal eco-tourism, corporate social responsibility and northern trade. However, the objective to facilitate Canadian input at a Russian seminar to promote exchanges in Aboriginal intellectual property and traditional knowledge could not be realized because the Canadian positions on the issue required further definition.
Following the devolution of land and resource management in Yukon, the Department undertook a lessons-learned exercise to guide future negotiations in the Northwest Territories and Nunavut. As such, a stronger management framework, including a risk assessment, has been established to guide the negotiation and implementation of devolution process in the Northwest Territories. In addition, the Department is undertaking a more extensive approach to internal and external communications. AANDC will continue to draw upon the Yukon experience in the context of land and resource management in the Northwest Territories.
Program Activity: Healthy Northern Communities
This program activity supports improvements to Northerners' health and well-being through grants for hospital and physician services for First Nations and Inuit residents in the Northwest Territories and Nunavut; the transport of nutritious foods and other essential items to isolated northern communities at reduced rates; and, research into the sources and effects of contaminants on the Arctic food chain.
|
Planned Spending |
Total Authorities |
Actual Spending |
|---|---|---|
|
101.4 |
117.0 |
115.0 |
The difference between Planned Spending and Total Authorities primarily reflects incremental funding provided through Supplementary Estimates to subsidize the shipment of food to isolated northern communities and to promote nutrition.
|
Planned |
Actual |
Difference |
|---|---|---|
|
14 |
31.2 |
17.2 |
For an explanation of variance of FTEs, see Section IV: FTE Variance by Program Activity.
|
Expected |
Performance |
Targets |
Performance |
|---|---|---|---|
|
Perishable and other nutritious foods and essential items are available in isolated northern communities at more affordable prices |
Average percentage difference in the weekly cost of the nutritious perishable food component of a healthy diet between isolated northern communities and southern cities |
Program under review, target to be determined[50] |
N/A[51 |
|
Reduced contaminant related risk to ecosystem and human health
|
Percentage decrease in concentrations of previously identified contaminants in northern wildlife Percentage decrease in concentrations of previously identified contaminants among Northern populations |
5% decrease in concentrations over 1990 levels by 2014 5% decrease in concentrations over 1990 levels by 2014 |
Met All[52] Exceeded (as of March 31, 2011) |
Performance Summary and Analysis of Program Activity
During 2010-2011, the Food Mail Program transitioned to the new food retail subsidy model, Nutrition North Canada, which was implemented on April 1, 2011. New performance measurements and targets for the new program are to be implemented and will be reported on in future years. The Food Mail Program review and evaluation informed the design and development of the new model. The new market-driven Nutrition North Canada Program model addresses significant weaknesses in the Food Mail Program such as limited accountability, the poor visibility of Government of Canada subsidization in the basic food cost for Northerners and local distortions that undermined opportunities for innovation and efficiencies. Northerners now have a direct voice in the program through the creation of an Advisory Board that provides advice to the Minister related to program management and effectiveness, ensuring greater efficiency and transparency.
The Northern Contaminants Program (NCP) supported northern scientific studies and outreach projects that provided new knowledge on ways to improve health in northern communities. Concentrations of contaminants known as persistent organic pollutants (POPs) in northern fish and wildlife have decreased by about 40% on average since 1990 as a result of global action on POPs (the Stockholm Convention). The decrease in these contaminant concentrations in fish and wildlife that are traditional/country foods for Northerners, together with dietary changes, has contributed to an approximately 60% decrease in contaminant exposure among northern populations. This significant decrease has led to reduced contaminant-related health risks for Northerners. On the other hand, concentrations of mercury, a heavy metal that is not covered by the Stockholm Convention, have not decreased in the environment and in some places are increasing, such as in fish in the Northwest Territories. Based on NCP monitoring results, new fish consumption advisories were issued in the Northwest Territories in the spring of 2010. Dietary advice provided to Northerners as well as a change in diets may partially explain why mercury levels in people have not increased.
Grant agreements to support hospital and physician services for Aboriginal people were successfully executed and implemented with the Government of the Northwest Territories and the Government of Nunavut.
In the spring of 2010, the Government of the Northwest Territories issued a fish consumption advisory based on the high levels of mercury that were reported though the NCP; this advisory led to an undue level of anxiety in the affected communities. As a result of lessons learned with respect to media and communicating sensitive health-related information, significant changes are being made to NCP organizational structures to better manage communications in the future. These changes include renewed and increased engagement of territorial health authorities on the regional contaminants committees and NCP Management Committee, and the establishment of a new risk communications subcommittee. The Risk Communications Subcommittee, which is just being formed this summer, will provide advice, working in partnership with regional health authorities, on the release of health-related information and health advisories to ensure that the messages are provided with the appropriate context and messaging so as not to cause undue alarm for communities.
Program Activity: Northern Land and Resources
This program activity supports the sustainable development and regulatory oversight of the North's natural resources, including mineral development and mining, as well as oil and gas development, both onshore and offshore. It emphasizes improved stewardship and environmental management of land and water resources on behalf of all Canadians, and Northerners in particular.
|
Planned Spending |
Total Authorities |
Actual Spending |
|---|---|---|
|
293.5 |
281.4 |
278.4 |
The difference between Planned Spending and Total Authorities primarily reflects the transfer of funding through Supplementary Estimates to Other Government Departments to support activities related to the Arctic Research Infrastructure Fund. The difference between Total Authorities and Actual spending primarily reflects the deferral of projects under Federal Contaminated Sites Action Plan; this deferred funding that was not required in 2010-2011 has been reprofiled to 2011-2012.
|
Planned |
Actual |
Difference |
|---|---|---|
|
315 |
503 |
188 |
For an explanation of variance of FTEs, see Section IV: FTE Variance by Program Activity.
|
Expected |
Performance |
Targets |
Performance Status |
|---|---|---|---|
|
An operating environment that supports mineral development and mining |
Percentage of total Canadian mineral exploration and deposit appraisal expenditures made in the Northwest Territories and Nunavut |
15% by March 31, 2011 |
Mostly Met |
|
Contaminated sites are managed to ensure the protection of human health and the safety of the environment while bringing economic benefit to the North |
Number of contaminated sites remediated |
4 by March 31, 2011 |
Exceeded |
|
Increased capacity of Aboriginal people and Northerners to adapt to climate change impacts |
Number of communities that are taking actions to integrate climate change risk management in planning, decision making and project implementation |
10 communities per year |
Exceeded |
Performance Summary and Analysis of Program Activity
Mineral exploration expenditures in the North, which are tightly linked to commodity prices, rebounded sharply, increasing from 11.1% of total Canadian exploration expenditures in 2009 to 13.3% in 2010. Most of the recovery took place in Nunavut with 10% of total Canadian expenditures, versus 3.3% in the Northwest Territories (NWT).
To support sustainable mineral resource development, the Department continued to effectively administer the royalty system for the NWT and Nunavut and successfully implemented an electronic map staking system. However, further progress on the electronic prospecting permits system awaits the necessary amendments to the Northwest Territories and Nunavut Mining Regulations.
As part of the action plan to improve Northern regulatory regimes, which was created in response to recommendations made in the 2008 Neil McCrank Report,[53] the Department developed the Nunavut Planning and Project Assessment Act and began consultations on a new NWT Surface Rights Act, an amended Mackenzie Valley Resource Management Act, and regulations on mining, land use, and water, all in order to improve the certainty and predictability of the resource management regime in the North.
At the end of 2010, the five-year rolling average of hectares under licence for oil and gas exploration was 5,207,700. Six new exploration licences, one of which is located in the deepwater of the Beaufort Sea, were issued following industry bids covering 577,000 hectares and totalling over $110 million in work commitments from private companies. Fourteen more parcels were put up for bids in the next rights issuance cycle. Industry expenditures for petroleum projects in the North in 2010-2011 totalled over $34 million of which $8.7 million went to northern Aboriginal and other northern businesses, training, and employment; $11.3 million benefited other Canadians.
AANDC played a significant role in the completion of the major regulatory requirements for the Mackenzie Gas Project (MGP) by leading Aboriginal consultations and securing the approval of the development plans for three natural gas fields included in the MGP.
The two-year feasibility study for the Canadian High Arctic Research Station (CHARS) was completed as of March 31, 2011. The study focused on benchmarking, consultation with stakeholders, including the three potential host communities, to inform the location analysis and the facility’s functional and operational requirements. In August 2010, Cambridge Bay, Nunavut was announced as the location for the CHARS. The mandate for CHARS, which will guide the Station's S&T program in achieving its national mandated priorities, was announced in December 2010. The 20 projects at 46 sites across Canada's North funded through the Arctic Research Infrastructure Fund (ARIF) under Canada's Economic Action Plan for the purpose of upgrading existing Arctic research facilities were all completed as of March 31, 2011. To reduce ongoing operation costs, many projects have incorporated green technologies into the facilities' designs.
The Northern Contaminated Sites Program has exceeded its target of remediating 4 sites in the North by March 31, 2011. A total of 5 sites were remediated in the NWT (Johnson, Frobisher, Hidden Lake, Victoria Island), while Colomac is substantially complete and 3 sites were completed in Nunavut (PIN-B, Cape Christian, and Roberts Bay). Progress also continued on the Giant and Faro mines, two of Canada’s largest contaminated sites. The Giant Mine Remediation Project is currently in the environmental assessment phase while the site remains in care and maintenance. The Faro Mine Remediation Project is in the preliminary design phase while care and maintenance activities continue.
The Climate Change Adaptation Program ended on March 31, 2011 with over 3 years of programming carried out with 85 communities across Canada to complete 93 climate change impact assessments and adaptation planning projects. This activity entailed the completion of 33 more projects than anticipated. An evaluation of the AANDC Climate Change Adaptation Program completed in 2011 indicated that the program contributed to the increased availability of climate change information and expertise. Almost half of the funded projects focused on the assessment of climate change risks and impacts and directly involved community members. Furthermore, the evaluation showed that the Climate Change Adaptation Program increased awareness of climate change in participating communities and increased the capacity of those communities to adapt. The Department also completed a climate change vulnerability assessment to identify climate change impacts on departmental programs, policies and operations.
|
DID YOU KNOW? The Department hosted, in partnership with federal departments in Canada and the US, the second Canada-United States Northern Oil and Gas Research Forum in Calgary, bringing together 240 participants from government, industry, universities, and Aboriginal groups. |
The April 2010 accident in the Gulf of Mexico demonstrated the risks and challenges of resource development in sensitive marine environments and underscored the need for evidence-based policy decisions when planning for oil and gas development, as well as adequate emergency preparedness and response planning. The Beaufort Regional Environmental Assessment (BREA) was initiated to assist in preparing all parties, including regulators, industry, and local communities, to respond to new investments in oil and gas in previously unexplored areas of the Beaufort Sea. AANDC partnered with other federal departments, territorial governments, international organizations – such as the Arctic Council – and potentially affected northern communities in leading and organizing emergency preparedness and response initiatives in northern environments. These initiatives have resulted in improved coordination of responsibilities and activities in areas such as regulatory oversight and prevention, mobilizing response for Arctic spills, and oil spill research.
|
2010-2011 Success Story Freeze Optimization Study at the Giant Mine (Northern Contaminated Sites Program). |
Strategic Outcome: Office of the Federal Interlocutor
Socio-economic well-being of Mťtis, non-status Indians, and urban Aboriginal people.
Program Activity: Urban Aboriginal Strategy
The Urban Aboriginal Strategy (UAS)[54]was developed in 1997 to help respond to the needs of Aboriginal people living in urban centres. It aims to promote their self-reliance and expand their life choices. Through the renewed UAS of 2007, the federal government partners with other governments, community organizations and Aboriginal people to support projects that respond to local priorities. The renovated UAS enhances the federal government's ability to align its expenditures directed toward urban Aboriginal people in key centres with provincial and municipal programming in a way that both advances federal objectives and responds effectively to local challenges and opportunities.
|
Planned Spending |
Total Authorities |
Actual Spending |
|---|---|---|
|
13.5 |
15.2 |
14.5 |
The difference between Planned Spending and Total Authorities primarily reflects additional funding provided through the operating budget as well as reallocations from within the Office of the Federal Interlocutor (OFI) to address priority issues.
|
Planned |
Actual |
Difference |
|---|---|---|
|
33 |
36.3 |
3.3 |
For an explanation of variance of FTEs, see Section IV: FTE Variance by Program Activity.
|
Expected |
Performance |
Targets |
Performance |
|---|---|---|---|
|
Self-reliant urban Aboriginal people who participate in the economy
|
High school attainment, employment and average total income for urban Aboriginal people in UAS-designated cities. Percentage of total project funding leveraged through relationships with provincial and municipal governments |
2% increase between 2001 and 2011 for high school attainment, employment and average total income for urban Aboriginal people in UAS-designated cities 50% leveraged over 5 years (2007-2008 to 2011-2012) by UAS-designated cities |
Mostly met Somewhat met |
Performance Summary and Analysis of Program Activity
Based on the preliminary analysis of Canada’s census data from 2001 to 2006, high school attainment, employment, and average total income rates for urban Aboriginal people in UAS-designated cities increased by 1%. This increase showed that the targeted 2% increase by 2011 is well within the reach of the program. However, a full assessment for the 2001-2011 period will only be possible once the 2011 National Household Survey data becomes available for analysis in 2012.
Through partnership work, AANDC helped strengthen community capacity, legitimacy and decision making and funded 144 community-based projects aimed at improving life skills, promoting job training, skills and entrepreneurship and supporting Aboriginal women, children and families.
AANDC also made progress in partnering with other federal departments, provincial and municipal governments and the private and philanthropic sectors. With the help of these partnerships, the Urban Aboriginal Strategy (UAS) has invested $9.3 million, coordinated $2.5 million from other federal departments, leveraged $5.8 million from municipalities and provinces, and $3.6 million from non-public sectors. Since the beginning of the mandate, 7 UAS-designated cities have achieved 50% leveraging from municipal and provincial governments, while 6 are still behind plan going into the final year, mainly due to the availability of program funds at the municipal and provincial levels.
|
DID YOU KNOW? Fostering Biimaadiziwin – A National Research Conference on Urban Aboriginal Peoples was held in February 2011.
The conference was a tremendous success with 380 participants (community members, scholars and government officials) and it will contribute to both research and policy development for urban Aboriginal people. |
In 2010-2011, an audit[55] of the UAS recommended the streamlining of administrative and reporting requirements for horizontal initiatives, and the establishment of more consistent expectations for community plans. In response, the Department has amended its horizontal terms and conditions for administrative and reporting efficiencies, and developed a common template to ensure consistency in the determination of elements required for community plans across all regions.
Program Activity: Mťtis and Non-Status Indian Organizational Capacity Development
Because the mandate of the Office of the Federal Interlocutor is to support the work of Mťtis and non-status Indian[56] (MNSI) organizations, the Office works to help find practical ways to reduce dependency and improve the self-reliance, and social and economic conditions of Mťtis, non-status Indians and off-reserve Aboriginal people. When they develop their organizational and professional capacity, Mťtis and non-status Indian organizations can build effective partnerships with federal and provincial governments and with the private sector.
|
Planned Spending |
Total Authorities |
Actual Spending |
|---|---|---|
|
14.7 |
16.5 |
15.9 |
In 2010-2011, resources from the Mťtis Rights management were transferred out to the MNSI organizational capacity development program activity for research and to address financial accountability. Given the cross-cutting nature of these activities, they are funded under the same authority.
|
Planned |
Actual |
Difference |
|---|---|---|
|
27 |
25.4 |
-1.6 |
For an explanation of variance of FTEs, see Section IV: FTE Variance by Program Activity.
|
Expected |
Performance |
Targets |
Performance |
|---|---|---|---|
|
MNSI organizations have the financial capacity to be accountable for public funds as well as to engage with the private sector |
Percentage of qualified financial personnel on staff |
70% in 2010-2011 |
Met All |
|
Stable and democratically accountable MNSI organizations represent their members' interests |
Percentage of MNSI organizations' elections held in keeping with their bylaws |
100% |
Met All |
Performance Summary and Analysis of Program Activity
Considerable progress was made in enhancing the capacity of Mťtis and non-status Indian organizations to ensure they are accountable through a number of activities, including: the implementation of elements (e.g. economic development, governance) of the Mťtis Nation Protocol[57] with the Mťtis National Council; and the development of a forward-looking agenda with the Congress of Aboriginal Peoples in keeping with the Political Accord.[58]
In addition, a second Mťtis Economic Development Symposium[59] was held, hosted by the Minister of Aboriginal Affairs and Northern Development Canada together with British Columbia’s Minister of Aboriginal Relations and Reconciliation. This event provided Aboriginal people the opportunity to influence the programs and policies affecting them. Building on its success and as a follow-up to the Symposium, a regional economic development forum was delivered by the Mťtis National Council in Prince Albert in March 2011.
AANDC continued to support bilateral and tripartite relationships through the Basic Organizational Capacity Program and the Federal Interlocutor’s Contribution Program. The Department supported 100 projects enhancing recipient organizations’ ability to represent their members, be accountable for public funds, and function as stable, democratic and transparent organizations representing their constituents’ interests. Planned elections were held in 2010-2011 by all five of the Mťtis and non-status Indian organizations, in keeping with their bylaws.[60]
As of March 2011, 70% of Mťtis and non-status Indian organizations had qualified financial personnel on staff, and 40% had professional certification as financial officers. During 2010-2011, AANDC, with the assistance of the Aboriginal Financial Officers Association, continued to work to build capacity and increase the accountability of Mťtis and non-status Indian organizations through workshops for financial staff on effective financial management and reporting.
|
DID YOU KNOW? The House of Commons unanimously declared 2010 Year of the Mťtis in recognition of the 125th anniversary of the historic events of 1885 in Saskatchewan.
In November 2010, the Minister and parliamentary secretary hosted a highly successful event to launch the Year of the Mťtis Medallion[61] in commemoration of the contribution made by the Mťtis to Canadian history, culture and the economy. |
In implementing the Mťtis Nation Protocol and continuing the relationship under the Political Accord, key Mťtis and non-status Indian organizations were still struggling with capacity and lack of financial expertise. AANDC has committed to continuing to invest in capacity-development funding, financial management and targeted audited procedures to ensure that Mťtis and non-status Indian organizations can effectively represent their members.
Program Activity: Mťtis Rights Management
This program activity is the federal response to the 2003 Supreme Court of Canada's Powley decision,[62] which affirmed that Mťtis people hold section 35 Aboriginal rights under the Canadian Constitution. The program works with non-profit, representative Aboriginal organizations that have substantial Mťtis memberships to develop objectively verifiable membership systems for Mťtis members and harvesters in accordance with the Supreme Court's direction.
|
Planned Spending |
Total Authorities |
Actual Spending |
|---|---|---|
|
- |
8.8 |
8.8 |
In 2010-2011, resources from Mťtis rights management were transferred to the MNSI organizational capacity-development program activity for research and to address financial accountability. There was no planned spending reported because the program was renewed after the 2010-2011 Reports on Plans and Priorities was published.
|
Planned |
Actual |
Difference |
|---|---|---|
|
- |
10.3 |
10.3 |
|
Expected |
Performance |
Targets |
Performance |
|---|---|---|---|
|
Respect for the Aboriginal rights of Mťtis under section 35
|
Identification of Mťtis harvesters Level of public awareness |
To have 5 province-wide objectively verifiable Mťtis identification systems in place by March 31, 2015 To set public awareness of Mťtis rights targets by March 31, 2011 |
Somewhat met Somewhat met |
Performance Summary and Analysis of Program Activity
Based on 2010-2011 year-end progress reports from partnering organizations, work towards the development of the five Mťtis identification systems[63] is currently in progress to meet its revised target date of 2017. Work continued with the Mťtis National Council and its affiliate organizations on the development of province-wide, objectively verifiable membership systems which provide a basis for membership representation, increased credibility and transparency for money spent, and reinforces federal and provincial partners’ confidence in Mťtis organizations.
To enhance the research and understanding of Mťtis communities, AANDC supported and participated in symposiums and pilot projects with the Mťtis Chair of the University of Ottawa for the purpose of identifying Mťtis historical communities, migration patterns, and the roles of various community structures.
Furthermore, a quantitative and qualitative assessment of media coverage pertaining to Mťtis rights was conducted for the 2010-2011 fiscal year. The findings of the research indicated that coverage of Mťtis rights was very limited in scope, both in the volume of coverage generated (98 hard news reports and commentaries), and in the breadth of that coverage (mostly regional). This research will serve as a baseline targets for public awareness.
Where appropriate, AANDC continued to serve as a resource on Mťtis and non-status Indian consultation and accommodation matters for all federal departments and industry. AANDC also continued to advocate within government on behalf of Mťtis organizations to ensure that their interests are reflected in consultation and accommodation matters.
The development of objectively verifiable Mťtis membership systems necessitates the employment of common standards and practices across organizations to ensure an overall consistency of approach to the identification of Mťtis harvesters. To enhance their capacity, AANDC staff participated in registry sessions with the Mťtis National Council and its affiliates on the standardization of Mťtis membership systems. The Department will continue to engage the Mťtis National Council and its affiliates to ensure objectively verifiable systems are in place.
Program Activity: Internal Services
Internal Services are groups of related activities and resources that are administered to support the needs of programs and other corporate obligations of an organization. These groups are: management and oversight services; communications services; legal services; human resources management services; financial management services; information management services; information technology services; real property services; materiel services; acquisition services; travel; and other administrative services. Internal Services include only those activities and resources that apply across an organization and not to those provided specifically to a program. For example, Internal Services provides strategic planning advice across the department, supports the management of Cabinet and Parliamentary business, assists in Aboriginal litigation management, and offers strategic leadership on policy issues by advancing Canada’s Aboriginal agenda, shaping AANDC policy development, and encouraging collaborative decision-making across the department and government.
|
Planned Spending |
Total Authorities |
Actual Spending |
|---|---|---|
|
368.1 |
418.7 |
407.6 |
The differences between Planned Spending and Total Authorities primarily reflect incremental funding for out-of-court settlements, the operating budget carry-forward, compensation/payroll adjustments and management of Mťtis and non-status Indian litigation, offset by the realignment of program-specific support funding to other program activities. The difference between Total Authorities and Actual Spending primarily reflects operating resources to be carried forward to 2011-2012.
|
Planned |
Actual |
Difference |
|---|---|---|
|
2,595 |
1,811.2 |
-783.8 |
For an explanation of variance of FTEs, see Section IV: FTE Variance by Program Activity.
|
Expected |
Performance |
Targets |
Performance Status |
|---|---|---|---|
|
Effective management of AANDC programs and services
|
Improved Management Accountability Framework (MAF) ratings for the following areas of management (AoM):
|
Achievement of the following scores by MAF Round VIII:
|
Unable to Assess[64] Somewhat Met |
|
Full implementation of the Policy on Transfer Payments |
Policy on Transfer Payments fully operational by April 1, 2011 |
Policy on Transfer Payments fully operational by April 1, 2011 |
Mostly Met |
Performance Summary and Analysis of Program Activity
In 2010-2011, AANDC completed specific initiatives to improve the management of programs and services. Particular focus was placed on two areas of the MAF as well as government-wide priorities. A departmental business plan was developed and used as a stepping stone to build a more integrated approach for 2011-2012 and beyond. A director-level integrated planning, reporting, management and analysis forum was created, which helped to enhance departmental management capacity.
Despite an unchanged MAF score of “acceptable” for Excellence in People Management, departmental improvements were noted in the areas of representation of persons with disabilities, employee learning, workload and workforce planning effectiveness, and organizational accountability for results. However, areas for improvement were also identified, including executive turnover and stability, rigour in employee performance management, and maintaining a representative workforce. AANDC developed an annual strategic HR management framework aimed at providing medium- and long-term approaches to HR challenges and improving the organization’s performance.
AANDC’s results from the 2008 Public Service Employee Survey were developed into an action plan which focused on: strengthening and empowering leadership; creating a healthy workplace; and investing in career development. The plan was implemented and progress monitored via the internal departmental reporting system.
The Department also worked towards completing implementation of the Policy on Transfer Payments (PTP), including:
- An outreach and engagement strategy to guide activities with First Nations, Inuit, Mťtis and other recipients. Over 150 national and regional engagement sessions were conducted and a website was created to support the initiative;
- Tools and procedures were developed and implemented, including a risk management approach to ensure that administrative requirements for recipients were proportionate to risk at both the program and the recipient levels. A total of 1,280 assessments were completed in 2010-2011;
- Development of a new suite of standardized funding agreement models and modification of 70 spending authorities to ensure PTP compatibility;
- Formalization of a process for public disclosure of ministerial exceptions;
- New departmental policies and directives including a Directive on Funding Approaches.
The final 10% of the PTP implementation still outstanding relates to grant and provincial/territorial funding agreement models, ongoing work of the Special Representative on Reduced Reporting to help balance the administrative reporting burden with risk, the review of the intervention policy and an inventory of service standards to be used by individual programs.
|
($ millions) |
||
|---|---|---|
|
|
2010-2011 |
2010-2011 |
|
Indian and Northern Affairs Canada |
||
|
Water and Wastewater (note 1) |
86.0 |
119.1 |
|
Housing (note 1) |
75.0 |
79.0 |
|
Schools (note 1) |
128.2 |
91.5 |
|
Arctic Research Infrastructure (note 2) |
51.0 |
43.0 |
|
High Arctic Research Station (HARS) feasibility (note 3) |
0.8 |
0.7 |
|
Child and Family Services |
15.5 |
14.0 |
|
Accelerating Action on Contaminated Sites – South of 60th Parallel |
17.4 |
17.4 |
|
Accelerating Action on Contaminated Sites – North of 60th Parallel |
11.1 |
11.1 |
|
Promoting Energy Development in the North |
- |
- |
|
Total |
385.0 |
375.8 |
Notes: The difference between planned and actual spending is explained below:
- Due to tight project time lines, construction/weather delays, and tendering issues, funding plans evolved over 2009-2010 and 2010-2011. In addition, funds were moved between school and water/wastewater categories consistent with the Treasury Board Terms and Conditions.
- Additional non-CEAP funding from other sources (internal to the Department) was added.
- The program did not get charged for the work completed by P3 Canada
Initiative: Water and Wastewater
Description: Two-year targeted funding will provide for the completion of drinking water and wastewater infrastructure projects to address health and safety priorities, and to protect and maintain the lifespan of existing and new assets in 18 First Nation communities across the country.
Alignment to Program Activity: The Economy strategic outcome – Community Infrastructure program activity
Expected Results: First Nations communities have a base of infrastructure that protects health and safety and enables engagement in the economy.
Performance Indicators and Target:
- Number of funding agreements signed
- Number of projects completed
- Number of employment hours created
- Target: 18 water and wastewater infrastructure projects completed by March 31, 2011
|
Performance Analysis |
|||
|---|---|---|---|
|
Target Exceeded Target updated to 23 water and wastewater projects. By March 2011, construction had been completed on 20 out of the 23 water and wastewater projects. The Department is continuing to work with First Nations communities to complete all outstanding work (note). All 2010-2011 water and wastewater funding agreements were signed. According to First Nations reports, approximately 573,652 total employment-hours were created; of those approximately 241,802 hours of work were completed by First Nation members. |
Note: Completion will be done using A-Base and FNWWAP dollars which have been set aside for this purpose from the Capital Facilities and Maintenance Program. The Department maximized the use of CEAP funding by actively managing each of the water and wastewater projects with First Nations. One project was removed from the CEAP program due to cost and timing issues; new projects were added to take its place.
Initiative: Housing
Description: This two-year program will support on-reserve housing; it is dedicated to new social housing stock and to complementary activities. This will assist in the transition to market-based housing on reserves and address immediate housing needs, such as overcrowding and health issues, while serving as an economic stimulus for many First Nation and rural areas by generating employment and the development of skilled trades.
Alignment to Program Activity: The Economy strategic outcome – Community Infrastructure program activity
Expected Results: First Nations communities have a base of infrastructure that protects health and safety and enables engagement in the economy.
Performance Indicators and Target:
- Number of units constructed, renovated and converted to private ownership
- Number of lots serviced
- Target: In 2009-2010: over 2,100 units constructed, renovated or converted from band-owned to private ownership, and nearly 600 lots serviced
- In 2010-2011, approximately 1,200 units constructed, renovated or converted from band-owned to private ownership, and over 300 lots serviced
|
Performance Analysis |
|||
|---|---|---|---|
|
Target Exceeded The target for units constructed, renovated or converted was substantially exceeded (2,214 units instead of 1,200 units). The work consisted of 191 units constructed, 1,667 units renovated, and 356 units converted to market-based housing. The target for lot servicing was also exceeded. 585 lots were serviced instead of 300. |
Initiative: Schools
Description: This initiative will provide economic stimulus to communities, generate short-term employment and business opportunities, and help to ensure that educational facilities meet existing and future educational requirements, as well as to improve on-reserve student retention and graduation rates.
Alignment to Program Activity: The Economy strategic outcome – Community Infrastructure program activity
Expected Results: First Nations communities have a base of infrastructure that protects health and safety and enables engagement in the economy.
Performance Indicators and Target:
- Number of funding agreements signed
- Number of projects completed
- Number of employment-hours created
- Target: 10 new school projects will be constructed and three major renovation projects will be completed by March 31, 2011
|
Performance Analysis |
|||
|---|---|---|---|
|
Target Mostly Met The original target was revised to 9 new schools and 3 major renovation projects. Nine of the 12 school projects were substantially completed by March 31, 2011; substantially completed projects include 3 major renovations and 6 new schools (note). All 2010-2011 school funding agreements were signed. According to First Nations reports, approximately 733,795 total employment-hours were created; of those, approximately 279,982 hours of work were completed by First Nations members. |
Note: The Department is continuing to work with First Nations communities to complete all outstanding work using A-Base dollars which have been set aside for this purpose from the Capital Facilities and Maintenance Program.
Initiative: Arctic Research Infrastructure
Description: This investment will support maintaining or upgrading key existing Arctic research facilities through the Arctic Research Infrastructure Fund.
Alignment to Program Activity: The North strategic outcome – Northern Lands and Resources program activity, Northern Science sub-activity
Expected Results: Improved infrastructure for research on the Canadian North.
Performance Indicators and Target:
- Number of improved research facilities completed (both upgraded and new construction)
- Target: 37
|
Performance Analysis |
|---|
|
Target Met Under CEAP, the Arctic Research Infrastructure Fund (ARIF) supported 20 projects, originally distributed across 37 sites in Canada's North. Over the course of the 2 CEAP years, the 20 ARIF projects were expanded to cover 46 sites. All 20 projects completed their agreement deliverables as of March 31, 2011 (note). A number of projects have incorporated green technologies into their facility designs, which over time will reduce ongoing maintenance and operations costs. Through the 20 projects, almost 140,000 sq. ft. of new space was created and approximately 111,000 sq. ft. of existing space was renovated or upgraded at 46 sites. A network of research station operators was established to share lessons learned and increase efficiencies. |
Note: The full funding allocation of $85M over two fiscal years has been disbursed to the recipient organizations.
Initiative: High Arctic Research Station (HARS) feasibility
Description: A feasibility study for the proposed High Arctic Research Station will be undertaken which will leverage existing research infrastructure by serving as the hub for scientific activity in Canada's vast and diverse Arctic region.
Alignment to Program Activity: The North strategic outcome – Northern Lands and Resources program activity, Northern Science sub-activity
Expected Results: Improved infrastructure for research on the Canadian North.
Performance Indicators and Target:
- % completion of planned steps for the feasibility study for the High Arctic Research Station
- Target: 100%
|
Performance Analysis |
|---|
|
Target Met Feasibility study 100% completed – Final Report dated March 31, 2011. Defined mandate, mission, scope and scale of station. Undertook detailed analysis of the station’s potential location, including consultations with the three potential host communities and other stakeholders. |
Initiative: Child and Family Services
Description: The federal government continues to invest in new partnerships with willing provinces and First Nations in implementing a new prevention-focused approach for First Nation child and family services on reserves.
Alignment to Program Activity: The People strategic outcome – Social Development program activity
Expected Results: This will assist in achieving better outcomes for First Nations children and families.
Performance Indicators and Target: Target: Quebec and Prince Edward Island are the next jurisdictions to the new approach by March 31, 2010
|
Performance Analysis |
|---|
|
Target Mostly Met Completed Prince Edward Island transition to the enhanced prevention-focused approach. Quebec transition to the enhanced prevention-focused approach mostly complete with 15 of the 18 First Nations Child and Family Service (FNCFS) agencies operating under the new approach. |
Initiative: Accelerating Action on Contaminated Sites – South of 60th Parallel
Description: Site assessment and remediation/risk management activities will be conducted on federal contaminated sites under the CEAP’s Federal Contaminated Sites Accelerated Action Plan.
Alignment to Program Activity: The Land strategic outcome – Responsible Federal Stewardship program activity, Environmental Management sub-activity
Expected Results: The Government of Canada demonstrates responsible federal stewardship of the environment on reserve lands.
Performance Indicators and Target:
- Reduction in the number of contaminated sites south of 60į
- Target: 45 assessment projects and 20 remediation projects in 2009-2010
- 7 assessment projects and 24 remediation projects in 2010-2011
|
Performance Analysis |
|---|
|
Target Mostly Met (i.e. Assessment projects – Target exceeded; Remediation projects – Target somewhat met) The updated number of projects planned in 2010-2011 was 82 assessment projects and 18 remediation projects. 72 of the 82 planned assessment projects in Alberta, British Columbia, Manitoba and Ontario were completed. This target was not met as regions changed some of their priorities (due to project delays, etc.) and reallocated the CEAP funds to other CEAP projects. This reallocation ensured that all CEAP funds were spent by the end of the fiscal year. All 18 remediation projects in Alberta, British Columbia, Manitoba and Ontario were completed. |
Initiative: Accelerating Action on Contaminated Sites – North of 60th Parallel
Description: Site assessment and remediation/risk management activities will be conducted on federal contaminated sites under CEAP's Federal Contaminated Sites Accelerated Action Plan. Over 2 fiscal years, site assessments will be completed at 355 sites and some remediation activities will take place at the Giant Mine site.
Alignment to Program Activity: The North strategic outcome – Northern Land and Resources program activity, Contaminated Sites sub-activity
Expected Results: Contaminated sites are managed to ensure the protection of human health and the safety of the environment while bringing economic benefits to the North.
Performance Indicators and Target:
- Target: 106 assessment projects and 1 remediation project in 2009-2010
- 249 assessment projects and 1 remediation project in 2010-2011
|
Performance Analysis |
|---|
|
Target Met Over 2 fiscal years, the goal was to have site assessments completed at 355 sites. A total of 410 sites (221sites in 2009-2010 and 189 sites in 2010-2011) were assessed. The plan to assess 249 sites in 2010-2011 was revised to 189 sites as the Northern Contaminated Sites Program (NCSP) had previously completed 221 site assessments in 2009-2010. In 2010-2011, the Program completed 189 site assessments in Nunavut and the NWT with CEAP funds (note). The NCSP has also continued work to complete progressive remediation activities at the Giant Mine site, including: developing detailed engineering plans and designs in preparation for the Freeze Optimization Study, dismantling the pit crusher, soil removal and drilling of more than 60 surface freeze test holes for the study. To date, the Giant Mine project has supported 59 positions with 15 of these dedicated to completing accelerated work. |
Note: All CEAP funds were spent on the 189 site assessments.
Canadian Polar Commission
Strategic Outcome: Increased Canadian Polar Knowledge
Program Activity: Research Facilitation and Communication.
The strategic outcome of the Canadian Polar Commission is increased Canadian polar knowledge, which is intended to help Canada acquire the wide range of information needed for effective policy and research program development in the polar regions, and to maintain Canada's position as a leading polar nation. The Commission ensures that adequate polar science infrastructure and logistics are available to Canadian researchers and that a polar science policy is developed with participation of all stakeholders to support and co-ordinate Canadian polar research. The Canadian polar research community is diverse and dispersed, with small research institutes supporting a broad range of research activities. The Commission co-ordinates research activities to increase efficiency and generate greater exchange of information. The Commission fosters and encourages activities and events to attract the next generation of polar researchers.
|
Planned Spending |
Total Authorities |
Actual Spending |
|---|---|---|
|
0.8 |
0.8 |
0.8 |
|
Planned |
Actual |
Difference |
|---|---|---|
|
5 |
5 |
0 |
|
Expected |
Performance |
Targets |
Performance |
|---|---|---|---|
|
Awareness by government and public of the progress and effectiveness in Canada of International Polar Year (IPY)
|
Planning by government to ensure that IPY leaves a legacy in Canada in terms of:
|
Improvements to polar research infrastructure Increase in monitoring activity Young scientists actively pursuing polar research |
Met All |
|
Canada represented on international polar science bodies, with Canadian interests and concerns taken into consideration and information from these bodies brought back to Canada
|
Canada maintains or increases its international influence in polar science Canada's priorities are integrated into international polar science policies Increased co-operation with Canada by polar research nations |
Promotion of Canadian polar research interests and concerns, and information gathering at events and meetings with international bodies |
Met All |
|
Increased federal government support for establishing a Canadian Antarctic Research Program as part of an overall national polar science policy |
Progress toward implementation of a Canadian Antarctic Research Program |
Champions identified within the federal government to promote the Canadian Antarctic Research Program |
Not Met |
Performance Summary and Analysis of Program Activity
The process of improving polar research infrastructure advanced through the work of the Commission to facilitate the network of operators and managers of northern research stations and hosting its annual meeting (February 2011). Through this network research station, operators and managers bring greater coordination and efficiency to northern research infrastructure operations, reducing costs and improving access for northern researchers. The Commission contributed expertise to the advisory committee for the planned Canadian High Arctic Research Station. This is part of the Commission’s support and promotion of the International Polar Year legacy.
In terms of increased monitoring, the Commission supported Canadian participation in the Sustaining Arctic Observing Networks (SAON), which coordinates and improves circumpolar Arctic monitoring activities. The Commission began including observing sites on its online interactive map of research infrastructure in Canada’s Arctic and subarctic regions
Regarding young scientists actively pursuing polar research, the Commission facilitated the participation of the Association of Early Career Polar Scientists (APECS) at the International Polar Year (IPY) Oslo Conference (June 2010). The Commission awarded the 2010 Canadian Polar Commission Scholarship to a PhD student. The Commission sponsored awards to young researchers at the ArcticNet Science Meeting, and contributed its expertise to the Committees of the Canadian Northern Studies Trust and the Northern Science Training Program. The Commission included articles by young researchers in its regular publications, Meridian and the Newsletter of the Canadian Antarctic Research Network.
The Commission promoted Canadian polar research interests and concerns, and gathered information from a wide variety of international events and meetings. Examples include such major events as: International Arctic Science Committee (IASC) Workshops in Potsdam, Germany (January 2011) as contributors; the meeting of IASC at the Arctic Science Summit Week in Nuuk, Greenland (April 2010), and Seoul, South Korea (March 2011), as a session chair and sessions and presenters; the International Polar Year Oslo Science Conference, as panellist and sponsor; and the Scientific Committee on Antarctic Research (SCAR) Open Science Conference in Buenos Aires (August 2010), and sponsoring Canadian representatives on working groups. The Commission maintained a booth to present the CPC and its work at the IPY Oslo Conference (June 2010) and at the annual ArcticNet Science Meeting (Ottawa, December 2010).
Through its support of meetings and presentations, the Commission continued to promote the Canadian Antarctic Research Program (CARP) within those federal government departments and agencies involved with Antarctic matters. The Commission has worked closely with officials at Environment Canada to further the case for supporting our researchers in the Antarctic. Building the support that will lead to the implementation of CARP is an ongoing process. Complete success can only be declared once it has been implemented. The Commission signed a letter of agreement with its counterpart organization in Argentina to provide reciprocal access to their research territory and facilities.
|
DID YOU KNOW? At the SCAR conference in Buenos Aires the Canadian Polar Commission and Argentina's Direcciůn nacional del AntŠrctico signed an agreement to facilitate cooperation and exchange between Canadian and Argentine polar scientists.
Canada and Argentina have many areas of mutual interest in the complementary areas of Arctic and Antarctic science. Canada has a long and distinguished history of Antarctic research, but has no Antarctic facilities of its own. This agreement, concluded at the request of scientists from the Canadian Committee for Antarctic Research and the Instituto AntŠrctico Argentino, will assist Canadian scientists in obtaining access to Argentine science infrastructure in Antarctica, and in return, will help Argentine scientists wishing to work in the Canadian Arctic. |
This year’s achievements were due in large part to strong partnerships with federal departments and non-governmental organizations, as well as the significant support of individuals volunteering their time and energy to help the Commission advance knowledge of the Polar Regions. This demonstrated clearly that building and maintaining effective relationships is fundamental to the Commission’s work.
Section III: Supplementary Information
Financial Highlights
|
Condensed Statement of Financial Position As at March 31, 2011 ($ million) |
|||
|---|---|---|---|
|
|
% Change |
2010-2011 |
2009-2010 |
|
Total assets |
(3.7%) |
3,025 |
3,141 |
|
|
|
|
|
|
Total liabilities |
(2.0%) |
16,518 |
16,857 |
|
Equity of Canada |
(1.6%) |
(13,493) |
(13,716) |
|
|
(3.7%) |
3,025 |
3,141 |
Assets by Type
Total assets were $3,025 million at the end of 2010-2011, which was a decrease of $116 million (-3.7 percent) from the previous year’s total assets of $3,141 million. The Due[66] from the Consolidated Revenue Fund (CRF) accounted for 68.6 percent of total assets at $2,076 million, loans receivable accounted for 25.6 percent at $774 million, other financial assets accounted for 3.1 percent at $94 million and non-financial assets accounted for the remaining 2.7 percent of total assets at $80 million.
Liabilities by Type
Total liabilities were $16,518 million at the end of 2010-2011, which was a decrease of $339 million (-2.0 percent) from the previous year’s total liabilities of $16,857 million. The provision for claims and litigation represents the largest portion of liabilities at $11,664 million or 70.6 percent of total liabilities. Other significant liabilities include environmental liabilities of $2,015 million (12.2 percent), trust accounts of $1,148 million (7.0 percent), accounts payable of $898 million (5.4 percent), and the liability for settled claims in the amount of $624 million (3.8 percent).
Significant changes
During the year, AANDC adopted the revised Treasury Board accounting policy TBAS 1.2: Departmental and Agency Financial Statements, which was effective for the Department for the 2010-2011 fiscal year. The major change in the accounting policies of the Department required by the adoption of the revised TBAS 1.2 is the recording of amounts due from the Consolidated Revenue Fund (CRF) as an asset on the Statement of Financial Position.
The change in total assets can be attributed mainly to the decrease in the Due from CRF, as a result of the settlement of many previously outstanding accrued liabilities (payables-at-year-end) and the receipt of oil and gas royalties credited to trust account liabilities.
The change in total liabilities can be attributed mainly to a decrease in the provision for claims and litigation due to the settlement of a number of specific claims and a decrease in accrued liabilities due to the settlement of many previously outstanding payables-at-year-end (PAYE). These decreases were partially offset by an increase in the amount accrued for environmental liabilities due to the availability of more robust estimates for the cost of remediating contaminated sites.
|
Condensed Statement of Operations For the year ended March 31, 2011 ($ million) |
|||
|---|---|---|---|
|
|
% Change |
2010-2011 |
2009-2010 |
|
Total expenses |
(13.6%) |
8,009 |
9,265 |
|
Total revenues |
19.9% |
247 |
206 |
|
Net cost of operations |
(14.3%) |
7,762 |
9,059 |
Expenses
Total expenses were $8,009 million in 2010-2011, representing a 13.6 percent decrease from the previous year’s expenses of $9,265 million. Transfer payments, the majority to Aboriginal people and Aboriginal organizations, amounted to $6,697 million or 83.6 percent of total expenses. Other significant expenses included salaries and employee benefits totalling $527 million (6.6 percent), court awards and other settlements totalling $459 million (5.7 percent).
Revenues
Total revenues amounted to $247 million for 2010-2011, representing a 19.9 percent increase over the previous year’s revenue of $206 million. Resource royalties, earned pursuant to contracts or regulations such as the Northwest Territories and Nunavut Mining Regulations, the Frontier Lands Petroleum Royalty Regulations and the Norman Wells Project represent the most significant source of revenue, accounting for $226 million or 91.5 percent of total revenues. Other revenues accounted for the remaining $21 million (8.5 percent).
Significant changes
The change in total expenses can be attributed mainly to a decrease in the provision for claims and litigation, resulting in a significantly lower year-end adjustment to expenses than in the prior year.
Financial Statements
http://www.ainc-inac.gc.ca/ai/arp/pubs/fnst11/fnst11-eng.asp.
List of Supplementary Information Tables
All electronic supplementary information tables found in the 2010-2011 Departmental Performance Report can be found on the Treasury Board of Canada Secretariat website.[67]
- Sources of Respendable and Non-Respendable Revenue
- User Fees Reporting
- Details on Transfer Payment Programs (TPPs)
- Horizontal Initiatives
- Green Procurement
- Response to Parliamentary Committees and External Audits
- Internal Audits and Evaluations
Section IV: Other Items of Interest
2010-2011 Full-Time Equivalent (FTE) Variances by Program Activity
|
2010 - 2011 (FTEs) |
|||
|---|---|---|---|
|
Program Activity |
Planned |
Actual |
Variances |
| (a) | (b) | (b-a) | |
|
Governance and Institutions of Government |
86.0 |
318.7 |
232.7 |
|
Co-operative Relationships |
423.0 |
588.6 |
165.6 |
| Claims Settlements | 0.0 | 0.0 | 0.0 |
|
Education |
222.0 |
238.1 |
16.1 |
| Social Development | 66.0 | 116.3 | 50.3 |
| Managing Individual Affairs | 646.0 | 604.1 | -41.9 |
| First Nation Governance over Land, Resources and the Environment | 21.0 | 27.2 | 6.2 |
| Responsible Federal Stewardship | 285.0 | 344.2 | 59.2 |
| Clarity of Title to Land and Resources | 52.0 | 49.4 | -2.6 |
| Individual and Community Business Development | 70.0 | 90.7 | 20.7 |
| Community Investment | 91.0 | 112.9 | 21.9 |
| Community Infrastructure | 225.0 | 261.5 | 36.5 |
| Northern Governance | 31.0 | 125.1 | 94.1 |
| Healthy Northern Communities | 14.0 | 31.2 | 17.2 |
| Northern Land and Resources | 315.0 | 503.0 | 188.0 |
| Urban Aboriginal Strategy | 33.0 | 36.3 | 3.3 |
| Mťtis and Non-Status Indian Organizational Capacity Development | 27.0 | 25.4 | -1.6 |
| Mťtis Rights Management | 0.0 | 10.3 | 10.3 |
| Internal Services | 2,595.0 | 1,811.2 | -783.8 |
| Total | 5,202.0 | 5,294.2 | 92.2 |
As depicted in the above chart, the total variance of planned to actual FTEs is 92.2 (1.8%). However, the chart also demonstrates significant adjustments within departmental program activity areas. This is primarily in response to an internal review which revealed the need for the realignment of FTEs in a manner consistent with other federal organizations and in accordance with Treasury Board Secretariat guidance. Most significant among these adjustments, was the realignment of Internal Services FTEs to the appropriate program activity area. This is reflected most significantly for:
- Governance and Institutions of Government;
- Co-operative Relationships;
- Social Development;
- Responsible Federal Stewardship;
- Northern Governance;
- Northern Land and Resources.
- The net increase of 92.2 full-time equivalents (FTEs) from 5,202.0 Planned to 5,294.2 Actual FTEs, is primarily due to supplementary funding received for programming. Such funding included but was not limited to:
- The McIvor decision which brought in the Gender Equity in Indian Registration Act (Bill C-3) (Managing Individual Affairs);
- Support for the implementation of the First Nation Water and Wastewater implementation plan (Community Infrastructure);
- Funding for legislative and regulatory changes to improve the Northern Regulatory Systems and to implement Commutative Impact Monitoring Program in the Northwest Territories and Nunavut (Northern Land and Resources); and
- Renewal of the Managing Mťtis Rights program.
For Managing Individual Affairs, planned FTEs are higher than actual FTEs due to the Indian Residential Schools Agreement funding being received as salary for Department of Justice legal services. As Operating and Maintenance (O&M) funds are required to cover legal services, a portion of the salary funding was transferred to O&M.
Organizational Contact Information
Aboriginal Affairs and Northern Development
Les Terrasses de la ChaudiŤre
10 Wellington Street, North Tower
Gatineau, Quťbec
Mailing Address: Ottawa, Ontario K1A 0H4
Internet: http://www.ainc-inac.gc.ca
E–mail: webmaster@ainc-inac.gc.ca
General and statistical inquiries, and publication distribution
Tel. (toll–free): 1-800-567-9604
TTY (toll–free): 1-866-553-0554
E–mail: InfoPubs@ainc-inac.gc.ca
Departmental Library
Tel.: 819-997-0811
E–mail: Reference@ainc-inac.gc.ca
Media Inquiries – Communications
Tel.: 819-953-1160
Canadian Polar Commission
Constitution Square
360 Albert Street, Suite 1710
Ottawa, Ontario K1R 7X7
Tel.: 613-943-8605 or (toll–free) 1888–POLAR01 (1-888-765-2701)
Internet: http://www.polarcom.gc.ca
E–mail: mail@polarcom.gc.ca
[1] For information about the Office of the Federal Interlocutor, please see http://www.ainc-inac.gc.ca/ai/ofi/index-eng.asp.
[2] For information on the Canadian Polar Commission, please see www.polarcom.gc.ca.
[3] For the 2010-2011 Report on Plans and Priorities, please see www.tbs-sct.gc.ca/rpp/2010-2011/inst/ian/ian00-eng.asp.
[4] Type is defined as follows: Previously committed to – committed to in the first or second fiscal year before the subject year of the report; Ongoing – committed to at least three fiscal years before the subject year of the report; and New – newly committed to in the reporting year of the DPR.
[5] Methodology: All students, all genders, all ages who received funding for their post-secondary education in the previous fiscal year. Students funded are the sum of all students funded for their post-secondary education. These data are collected at the beginning of the following academic year.
[6] Ibid., p. 8.
[7] Ibid., p. 8.
[8] Active Measures is designed to help individuals join the labour market by providing greater access to career planning, skills development, employment counselling services, literacy, adult basic education, workplace essential skills training and providing support such as training allowances, transportation and child care. Under Active Measures, employers and industry may be engaged to ensure that client skills are aligned with the demands of the labour market and economy.
[9] Jordan's Principle is being implemented within the context of existing health and social programs to ensure the continuation of services to First Nations children ordinarily-resident-on-reserve with multiple disabilities and in need of multiple services, even in cases of a dispute between federal and provincial governments concerning the responsibility for, and payment of, services.
[10] Ibid., p. 8.
[11] Ibid., p. 8.
[12] Ibid., p. 8.
[13] For more information on the CWB, see http://www.ainc-inac.gc.ca/ai/rs/pubs/cwb/cwbdck-eng.asp.
[14] Commencing in the 2009-2010 Estimates cycle, the resources for Program Activity: Internal Service is displayed separately from other program activities; they are no longer distributed among the remaining program activities as was the case in previous Main Estimates. This has affected the comparability of spending and FTE information by Program Activity between fiscal years.
[15] Ibid., p. 22.
[16] Actual spending for 2009-2010, as reported in the Public Accounts of Canada for 2009-2010, reflects spending for the Individual Affairs Branch only. Residential Schools Resolution actual spending 2009-2010 was reported under the Claims Settlement Strategic Outcome.
[17] As reported in the 2010-2011 Report on Plans and Priorities, the Program Activity Architecture was revised and the Strategic Outcome “The People” included the authorities and actual spending for both the Individual Affairs Branch and the Residential Schools Resolution Strategic Outcome pursuant to the Indian Residential Schools Settlement Agreement.
[18] Ibid., p. 22.
[19] Ibid., p. 22.
[20] Ibid., p. 22.
[21] Reflects the transfer of funding in 2009 to the Canadian Northern Economic Development Agency.
[22] For the purposes of the CWB Index, communities are defined in terms of Census subdivisions (CSDs). CSDs are municipalities or their equivalent (e.g., Indian reserves). At the current time, the CWB does not assess urban Aboriginal well-being, although similar indicators are used.
[23] Ibid., p. 22.
[24] Ibid., p. 22.
[25] Reflects planned spending in the Department’s 2010-2011 Report on Plans and Priorities.
[26] “Free of financial intervention as predefined by the departmental Intervention Policy” means First Nations who are not subject to any of the measures identified in the AANDC Default Prevention and Management Policy (formerly known as the Intervention Policy).
[27] For more information please see IGS Evaluation 2009 http://www.ainc-inac.gc.ca/ai/arp/aev/pubs/ev/igsp/igsp-eng.asp, and IGS Evaluation Follow-up Status Update 2010: http://www.ainc-inac.gc.ca/ai/arp/aev/pubs/ev/igsp/igspfm10-eng.asp.
[28] For more information please see Miawpukek First Nation Grant Agreement Evaluation: http://www.ainc-inac.gc.ca/ai/arp/aev/pubs/ev/mwp/mwp-eng.asp.
[29] The wording of this indicator has been changed from “percentage of productive negotiation tables” for accuracy. Productive negotiation tables refer to instances where the Parties have concluded a major component and/or have met or surpassed Departmental negotiation objectives and where the negotiations continue to make steady progress to move in the direction of a successful conclusion.
[30] A baseline was set at 6 and 40 respectively, for the performance indicator “number of multi-partner processes in support of Inuit priorities and for the performance indicator “number of outreach activities targeting various audiences to promote awareness of Inuit issues.”
[31] Please consult http://www.ainc-inac.gc.ca/al/index-eng.asp.
[32] For more information please see http://www.pm.gc.ca/eng/media.asp?category=1&id=1695.
[33] For more information, please see http://www.ainc-inac.gc.ca/eng/1100100031843.
[34] For more information on the Federal Government’s Implementation of Self-Government and Self-Government Agreements evaluation please see http://www.ainc-inac.gc.ca/ai/arp/aev/pubs/ev/sga/sga-eng.asp.
[35] The methodology used by provinces to measure graduation is not comparable to that used for First Nations. A revised performance indicator is currently being identified and will be introduced in 2012-2013.
[36] Ibid, p. 13.
[37] Implementation Evaluation of the Enhanced Prevention Focused Approach in Alberta for the First Nations Child and Family Services Program was part of a multi-year strategic evaluation of the implementation of the EPFA that examined individual jurisdictions two to three years after the EPFA implementation. For more information please see http://www.ainc-inac.gc.ca/ai/arp/aev/pubs/ev/fcf/fcf-eng.asp.
[38] For the detailed services standards and performance for each activity, please consult http://www.ainc-inac.gc.ca/eng/1315594360990
[39] Ibid.
[40] As no precedent existed for this type of forecasting, the original forecast used 1997 projections, based on the assessment of 13 residential institutions which housed children, on where/when sexual abuse existed. 15% of the residents would likely have suffered abuse. With the IAP in place since September 2007, projections have been updated, based on recent data and trend analysis.
[41] For more information about the TRC performance, please see the Indian Residential Schools Truth and Reconciliation Commission Secretariat Departmental Performance Report http://www.tbs-sct.gc.ca/dpr-rmr/index-eng.asp.
[42] For the complete Statement of Apology to Former Students of Indian Residential Schools, please see http://www.ainc-inac.gc.ca/ai/rqpi/apo/index-eng.asp.
[43] A developmental First Nation is one that has opted into the First Nations Land Management regime and is in the development of its Land Code prior to a ratification vote towards becoming operational under the Regime.
[44] For more information please see http://www.oag-bvg.gc.ca/internet/English/parl_oag_200911_06_e_33207.html.
[45] For more information please see http://www.ainc-inac.gc.ca/ai/arp/aev/pubs/ev/iblmo/iblmo-eng.asp.
[46] For more information please see http://www.ainc-inac.gc.ca/ai/arp/aev/pubs/au/cedf/cedf-eng.asp.
[47] For more information please see http://www.ainc-inac.gc.ca/ai/arp/aev/pubs/ev/cfm/cfm-eng.asp.
[48] For more information please see http://www.ainc-inac.gc.ca/ai/arp/aev/pubs/ev/orhs/orhs-eng.asp.
[49] For The National Assessment of First Nations Water and Wastewater Systems, please see http://www.ainc-inac.gc.ca/eng/1100100034982
[50] Replaced by Nutrition North Canada on April 1, 2011.
[51] Ibid.
[52] The status rating is based on average, i.e. exceeded target for certain contaminants and target not met for mercury, as of March 31, 2011.
[53] For Neil McCrank’s report, please see http://www.ainc-inac.gc.ca/aiarch/mr/nr/m-a2008/2-3070-eng.asp.
[54] For more information, please see http://www.ainc-inac.gc.ca/ai/ofi/uas/index-eng.asp.
[55] For more information please see http://www.ainc-inac.gc.ca/ai/arp/aev/pubs/au/ofi/uas/uas-eng.asp.
[56] For more information please see http://www.ainc-inac.gc.ca/ai/ofi/mns/index-eng.asp.
[57] For more information please see http://www.ainc-inac.gc.ca/ai/ofi/mns/bil/index-eng.asp.
[58] The Mťtis Nation Protocol and the Political Accord establish the basis of the bilateral relationship of the Mťtis Nation Council and the Congress for Aboriginal Peoples. For more information please see http://www.ainc-inac.gc.ca/ai/ofi/mns/bil/index-eng.asp.
[59] For more information please see http://www.ainc-inac.gc.ca/eng/1100100015942.
[60] Elections were held for the following organizations: United Native Nation in May 2010; Manitoba Mťtis Federation in June 2010; Mťtis Nation BC in August 2010; Congress of Aboriginal Peoples in October 2010; and Mťtis National Council in December 2010.
[61] For more information please see http://www.ainc-inac.gc.ca/eng/1307369952684.
[62] For more information, please see http://www.ainc-inac.gc.ca/ai/ofi/mrm/index-eng.asp.
[63] Objectively verifiable Mťtis identification systems are in development in the regions of British Columbia, Alberta, Saskatchewan, Manitoba and Ontario.
[64] Governance and Planning was not among the areas selected by the Treasury Board Secretariat to be assessed and rated under MAF VIII.
[65] Reflects planned spending in the department’s 2010-2011 Report on Plans and Priorities.
[66] These amounts are the result of timing differences at year-end between when a transaction affects authorities and when it is processed through the CRF. Amounts due from the CRF represent the net amount of cash that AANDC is entitled to draw from the CRF without further appropriations to discharge its liabilities.
[67] See 2010-2011 Part III – Departmental Performance Reports (DPR): Supplementary Information (Tables), http://www.tbs-sct.gc.ca/dpr-rmr/2010-2011/index-eng.asp.