
Treasury Board of Canada Secretariat
www.tbs-sct.gc.ca
Common menu bar links
Breadcrumb Trail
ARCHIVED - Health Canada - Report
 This page has been archived.
Archived Content
Information identified as archived on the Web is for reference, research or recordkeeping purposes. It has not been altered or updated after the date of archiving. Web pages that are archived on the Web are not subject to the Government of Canada Web Standards. As per the Communications Policy of the Government of Canada, you can request alternate formats on the "Contact Us" page.
Section III - Supplementary Information
Financial Highlights
| Condensed Statement of Financial Position At end of Fiscal Year (March 31, 2010) |
% Change |
2008-09 | 2009-10 |
|---|---|---|---|
| Assets | -17% | 636,410 | 530,507 |
| Total Assets | -17% | 636,410 | 530,507 |
| Total | -17% | $636,410 | $530,507 |
| Liabilities | 33% | 969,750 | 1,256,282 |
| Total Liabilities | 33% | 969,750 | 1,256,282 |
| Equity | 127% | -333,340 | -725,775 |
| Total Equity | 127% | -333,340 | -725,775 |
| Total | -17% | $636,410 | $530,507 |
| Condensed Statement of Operations At end of Fiscal Year (March 31, 2010) |
% Change |
2008-09 | 2009-10 |
|---|---|---|---|
| Expenses | 20% | 3,607,649 | 4,306,900 |
| Total Expenses | 20% | 3,607,649 | 4,306,900 |
| Revenues | 0% | 84,839 | 84,969 |
| Total Revenues | 0% | 84,839 | 84,969 |
| Net Cost of Operations | 20% | $3,522,810 | $4,221,931 |
Refer to the full Statement of Management Responsibility for further details
http://www.hc-sc.gc.ca/ahc-asc/performance/estim-previs/dpr-rmr/2009-2010-smr-drd-eng.php
Assets by Type
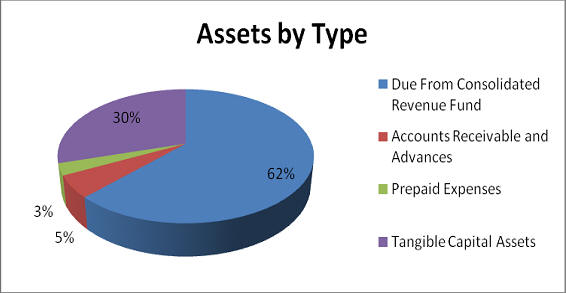
Total assets were $530.5M at the end of 2009-10, a decrease of $105.9M over the previous year. The majority of the change was due to a decrease in Due From the Consolidated Revenue Fund account of $132.8M, offset by increases in Capital Assets $17.8M, Accounts Receivable and Advances $5.3M and Prepaid Expenses $3.8M
Liabilities by Type
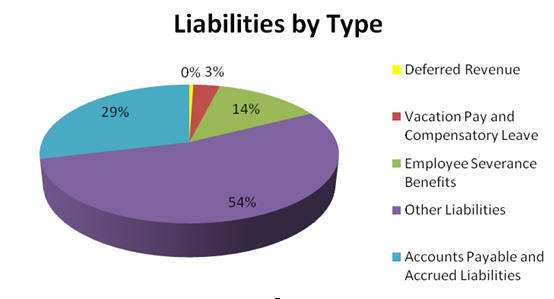
Total liabilities were $1,256.3M at the end of 2009-10, an increase of $286.5M over the previous year. $432.8M of the net increase in liability is a result of $500.0M provided for Canada Health Infoway Inc. from Budget 2009 less a payment of $67.2M from the liability to the same organization for Budget 2007. This increase was partially offset by net reductions to employee severance benefits and accounts payable and accrued liabilities.
Expenses by Strategic Outcome
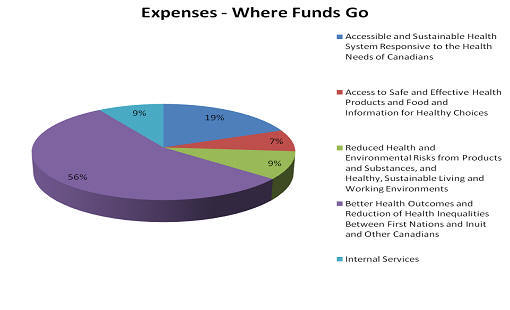
The department's total expenses were $4.3B in 2009-10, an increase of $699.3M over 2008-09. This was due mainly to increases in Transfer Payments ($653.2M), Salaries and Wages ($21.5M) and travel for non-insured health patients ($15.5M).
Revenues by Strategic Outcome
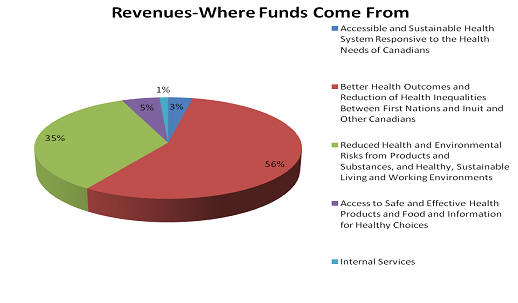
Health Canada receives most of its funding through annual Parliamentary appropriations. The department uses the Consolidated Revenue Fund (CRF) which is administered by the Receiver General for Canada. All cash received is deposited to the CRF and all cash disbursements are paid from the CRF. Health Canada does however generate revenue from program activities that support the above-noted Strategic Outcomes. The department's total revenue was $85.0M in 2009-10, an increase of $130.0K over 2008-09.
Financial Statements
2009-2010 Statement of Management Responsibility
Supplementary Information Tables
All electronic supplementary information tables for the 2009-2010 Departmental Performance Report can be found on the Treasury Board of Canada Secretariat's website at: http://tbs-sct.gc.ca/dpr-rmr/st-ts-eng.asp.
- Details on Transfer Payment Programs (TPPs)
- Green Procurement
- Horizontal Initiatives
- Internal Audits and Evaluations
- Response to Parliamentary Committees and External Audits
- Sources of Respendable and Non-Respendable Revenue
- Status Report on Major Crown/Transformational Projects
- Up-Front Multi-Year Funding
- User Fees Reporting
Web Links
- Aboriginal Health Human Resources Initiative
http://www.hc-sc.gc.ca/ahc-asc/activit/strateg/ahhri-irrhs-eng.php - Aboriginal Health Needs
http://www.afmc.ca/social-aboriginal-health-e.php - Aboriginal Health Transition Fund
http://www.hc-sc.gc.ca/fniah-spnia/services/acces/adapt-env-eng.php - Air Quality
http://www.ec.gc.ca/Air/default.asp?lang=En&n=04104DB7-1 - Air Quality Health Index
http://www.ec.gc.ca/cas-aqhi/default.asp?Lang=En - Airport Full Body Scanners
http://www.hc-sc.gc.ca/hl-vs/iyh-vsv/life-vie/airport-scanners-aeroports-eng.php - Asia-Pacific Economic Cooperation
http://www.apec.org - Assisted Human Reproduction Act
http://laws.justice.gc.ca/en/A-13.4/ - Assisted Human Reproduction Canada
http://www.ahrc-pac.gc.ca/ - Canada Consumer Product Safety Act
http://www.hc-sc.gc.ca/cps-spc/legislation/acts-lois/ccpsa-lcspc/index-eng.php - Canada's Economic Action Plan
http://www.actionplan.gc.ca/eng/index.asp - Canada's Food Guide
http://www.hc-sc.gc.ca/fn-an/food-guide-aliment/index-eng.php - Canada Health Act
http://www.hc-sc.gc.ca/hcs-sss/medi-assur/cha-lcs/index-eng.php - Canada Health Infoway
http://www.infoway-inforoute.ca/ - Canadian Community Health Survey
http://www.statcan.gc.ca/cgi-bin/imdb/p2SV.pl?Function=getSurvey&SDDS=3226&lang=en&db=imdb&adm=8&dis=2 - Canadian Environmental Protection Act
http://laws.justice.gc.ca/en/C-15.31/ - Canadian Environmental Sustainability Indicators
http://www.statcan.gc.ca/pub/16-251-x/16-251-x2005000-eng.htm - Canadian Food Inspection Agency
http://www.inspection.gc.ca/english/toce.shtml - Canadian Food Inspection Agency Act
http://laws.justice.gc.ca/en/C-16.5/ - Canadian Institute for Health Information
http://secure.cihi.ca/cihiweb/dispPage.jsp?cw_page=home_e - Canadian Radiological Monitoring Network
http://www.hc-sc.gc.ca/ewh-semt/contaminants/radiation/crmn-rcsr/index-eng.php - Canadian Tobacco Use Monitoring Survey
http://www.statcan.gc.ca/dli-ild/data-donnees/ftp/survey-tobacco-enquete-tabac-eng.htm - Chemicals Management Plan
http://www.chemicalsubstanceschimiques.gc.ca/plan/index_e.html - Chemical Substances
http://www.chemicalsubstanceschimiques.gc.ca/index-eng.php - Clean Air Agenda
http://www.sct.gc.ca/hidb-bdih/initiative-eng.aspx?Org=0&Hi=12 - Clean Air Regulatory Agenda
http://www.hc-sc.gc.ca/ewh-semt/air/regulatory-reglementation-eng.php - Community Noise Annoyance
http://www.hc-sc.gc.ca/hl-vs/iyh-vsv/life-vie/community-urbain-eng.php - Consumer Product Recalls
http://cpsr-rspc.hc-sc.gc.ca/PR-RP/home-accueil-eng.jsp - Consumer Product Safety
http://www.hc-sc.gc.ca/cps-spc/index-eng.php - Consumer Product Safety Commission
http://www.cpsc.gov/ - Consumer Safety Portal
http://www.hc-sc.gc.ca/cips-icsp/index-eng.php - Controlled Drugs and Substances Act
http://laws.justice.gc.ca/en/C-38.8/ - Controlled Substances
http://www.hc-sc.gc.ca/hc-ps/substancontrol/substan/index-eng.php - Cracking Down on Tobacco Marketing Aimed at Youth Act
http://www2.parl.gc.ca/Sites/LOP/LegislativeSummaries/Bills_ls.asp?lang=E&ls=c32&source=library_prb&Parl=40&Ses=2 - Department of Health Act
http://laws.justice.gc.ca/en/H-3.2/index.html - Drinking Water and Wastewater
http://www.hc-sc.gc.ca/fniah-spnia/promotion/public-publique/water-eau-eng.php - Drug Analysis Service
http://www.hc-sc.gc.ca/hc-ps/substancontrol/analys-drugs-drogues/index-eng.php - Drug Product Database
http://www.hc-sc.gc.ca/dhp-mps/prodpharma/databasdon/index-eng.php - Drug Safety and Effectiveness Network (DSEN)
http://www.cihr-irsc.gc.ca/e/40269.html - Drug Strategy Community Initiatives Fund
http://www.hc-sc.gc.ca/hc-ps/drugs-drogues/dscif-ficsa/index-eng.php - Drug Treatment Funding Program
http://www.hc-sc.gc.ca/ahc-asc/media/nr-cp/_2008/2008_64bk-eng.php - Emergency Preparedness
http://www.hc-sc.gc.ca/hc-ps/ed-ud/prepar/index-eng.php - Federal Indian Health Policy
http://www.hc-sc.gc.ca/ahc-asc/branch-dirgen/fnihb-dgspni/poli_1979-eng.php - Federal Tobacco Control Strategy
http://www.hc-sc.gc.ca/hc-ps/tobac-tabac/about-apropos/role/federal/strateg-eng.php - First Nations Health Managers Competency Framework (PDF version)
http://www.fnhealthmanagers.ca/docs/e/FNHM_Comp_Framework-English.pdf - Food and Consumer Safety Action Plan
http://www.tbs-sct.gc.ca/hidb-bdih/initiative-eng.aspx?Hi=85 - Food and Drugs Act
http://laws.justice.gc.ca/en/F-27/ - Food and Nutrition
http://www.hc-sc.gc.ca/fn-an/index-eng.php - Hazardous Products Act
http://laws.justice.gc.ca/en/H-3/ - Health Canada Food Fortification Policy
http://www.hc-sc.gc.ca/fn-an/nutrition/vitamin/fortification_factsheet2-fiche2-eng.php - Health Canada Science Forum
http://www.hc-sc.gc.ca/sr-sr/about-apropos/promotion/index-eng.php - Health Canada Science Plan
http://www.consultations.hc-sc.gc.ca/public-consult/consultations/calendar-calendrier/consultation_e.php?id=299 - Health Care System
http://www.hc-sc.gc.ca/hcs-sss/index-eng.php - Health Concerns
http://www.hc-sc.gc.ca/hc-ps/tobac-tabac/index-eng.php - Health Human Resource Strategy
http://www.hc-sc.gc.ca/hcs-sss/hhr-rhs/strateg/index-eng.php - Health Policy Research Bulletin
http://www.hc-sc.gc.ca/sr-sr/pubs/index-eng.php - Healthy Canada: A federal report on comparable health indicators, 2008 (PDF version)
http://www.hc-sc.gc.ca/hcs-sss/alt_formats/hpb-dgps/pdf/pubs/system-regime/2008-fed-comp-indicat/index-eng.pdf - Internationally Educated Health Professionals Initiative
http://www.hc-sc.gc.ca/hcs-sss/finance/hcpcp-pcpss/iehpi-ipsfe-eng.php - It's Your Health
http://www.hc-sc.gc.ca/hl-vs/iyh-vsv/index-eng.php - Listeria
http://www.hc-sc.gc.ca/fn-an/consultation/init/_listeria/draft-ebauche-eng.php - Marihuana Medical Access Regulations
http://www.hc-sc.gc.ca/dhp-mps/marihuana/index-eng.php - MedEffect Canada
http://hc-sc.gc.ca/dhp-mps/medeff/index-eng.php - Medical Devices
http://www.hc-sc.gc.ca/dhp-mps/md-im/index-eng.php - National Aboriginal Achievement Foundation
http://www.naaf.ca - National Anti-Drug Strategy
http://www.nationalantidrugstrategy.gc.ca/ - National Calibration Reference Centre
http://www.hc-sc.gc.ca/ewh-semt/occup-travail/radiation/invivo/index-eng.php - National Dose Registry
http://www.hc-sc.gc.ca/ewh-semt/occup-travail/radiation/regist/index-eng.php - National Dosimetry Services
http://hc-sc.gc.ca/ewh-semt/occup-travail/radiation/dosim/index-eng.php - Natural Health Product
http://www.hc-sc.gc.ca/dhp-mps/prodnatur/index-eng.php - Natural Health Product Interface
http://www.hc-sc.gc.ca/dhp-mps/prodnatur/legislation/docs/food-nhp-aliments-psn-guide-eng.php - Non-Insured Health Benefits
http://www.hc-sc.gc.ca/fniah-spnia/nihb-ssna/index-eng.php - Official Language Health Contribution Program
http://www.hc-sc.gc.ca/ahc-asc/branch-dirgen/rapb-dgrp/pd-dp/olcdb-baclo-eng.php - Official Language Minority Communities
http://www.hc-sc.gc.ca/ahc-asc/branch-dirgen/rapb-dgrp/pd-dp/olcdb-baclo-eng.php - Pan American Health Organization
http://new.paho.org/hq/ - Patient Wait Time Guarantee
http://www.hc-sc.gc.ca/hcs-sss/finance/hcpcp-pcpss/pwgt-gtap-eng.php - Permit the use of caffeine and caffeine citrate
http://gazette.gc.ca/rp-pr/p1/2010/2010-03-20/html/notice-avis-eng.html#d106 - Permit the use of carrageenan and tocopherols
http://gazette.gc.ca/rp-pr/p1/2009/2009-07-11/html/notice-avis-eng.html#d111 - Permit the use of lecithin
http://gazette.gc.ca/rp-pr/p1/2009/2009-07-18/html/notice-avis-eng.html#d101 - Permit the use of sodium copper chlorophyllin
http://gazette.gc.ca/rp-pr/p1/2009/2009-08-08/html/notice-avis-eng.html#d109 - Permit the use of sodium tripolyphosphate
http://gazette.gc.ca/rp-pr/p1/2009/2009-11-07/html/notice-avis-eng.html#d118 - Permit the use of sucralose
http://gazette.gc.ca/rp-pr/p1/2009/2009-06-13/html/notice-avis-eng.html#d117 - Permit the use of the enzyme amylase
http://gazette.gc.ca/rp-pr/p1/2010/2010-03-06/html/notice-avis-eng.html#d108 - Permit the use of the phospholipase A 2 enzyme
http://gazette.gc.ca/rp-pr/p1/2009/2009-2010-10/html/notice-avis-eng.html#d117 - Permit the use of the xylanase enzyme
http://gazette.gc.ca/rp-pr/p1/2009/2009-08-08/html/notice-avis-eng.html#d108 - Pest Control Products Act
http://laws.justice.gc.ca/en/P-9/index.html - Pest Management Regulatory Agency
http://www.hc-sc.gc.ca/ahc-asc/branch-dirgen/pmra-arla/index-eng.php - Powdered Infant Formula
http://www.hc-sc.gc.ca/fn-an/nutrition/child-enfant/infant-nourisson/pif-ppn-recommandations-eng.php - Precautionary Labelling of Food Allergens
http://www.hc-sc.gc.ca/fn-an/consultation/_allergen2009/index-eng.php - Preparing a Submission for Food Health Claims
http://www.hc-sc.gc.ca/fn-an/legislation/guide-ld/health-claims_guidance-orientation_allegations-sante-eng.php - Produce Safety
http://www.hc-sc.gc.ca/fn-an/securit/kitchen-cuisine/safety-salubrite/index-eng.php - Public Health Agency of Canada
http://www.phac-aspc.gc.ca/index-eng.php - Quarantine Act
http://laws.justice.gc.ca/en/Q-1/ - Radiation
http://www.hc-sc.gc.ca/ewh-semt/radiation/index-eng.php - Radiation Emitting Devices Act
http://laws.justice.gc.ca/en/R-1/index.html - Radiofrequency Exposure Guidelines
http://www.hc-sc.gc.ca/ewh-semt/pubs/radiation/radio_guide-lignes_direct-eng.php - Radiological Impact
http://www.hc-sc.gc.ca/ewh-semt/contaminants/radiation/impact/index-eng.php - Radon
http://www.hc-sc.gc.ca/ewh-semt/radiation/radon/index-eng.php - Safety of Compact Fluorescent Lamps
http://www.hc-sc.gc.ca/hl-vs/iyh-vsv/prod/cfl-afc-eng.php - Safety Procedures for the Installation, Use and Control of X-ray Equipment in Large Medical Radiological Facilities
http://www.hc-sc.gc.ca/ewh-semt/pubs/radiation/safety-code_35-securite/index-eng.php - Strengthening Aboriginal Health Human Resources
http://casn.ca/en/Making_it_Happen_:_Strengthening_Aboriginal_Health_Human_Resources_118/items/Links_6.html - Tobacco Act
http://laws.justice.gc.ca/en/T-11.5/ - Tripartite First Nations Health Plan
http://www.hc-sc.gc.ca/fniah-spnia/pubs/services/2007-06_tripartite_plan/index-eng.php - Use of Probiotic Microorganisms in Food
http://www.hc-sc.gc.ca/fn-an/legislation/guide-ld/probiotics_guidance-orientation_probiotiques-eng.php - Water Quality
http://www.hc-sc.gc.ca/ewh-semt/water-eau/index-eng.php - World Health Organization
http://www.who.int/en/