
Treasury Board of Canada Secretariat
www.tbs-sct.gc.ca
Common menu bar links
Breadcrumb Trail
ARCHIVED - Office of the Auditor General of Canada - Report
 This page has been archived.
Archived Content
Information identified as archived on the Web is for reference, research or recordkeeping purposes. It has not been altered or updated after the date of archiving. Web pages that are archived on the Web are not subject to the Government of Canada Web Standards. As per the Communications Policy of the Government of Canada, you can request alternate formats on the "Contact Us" page.
Section II—Reporting on Results
Our priorities for 2009–10
The Office identified three strategic priorities for the 2009–10 fiscal year: sustaining our capacity, integrating changes to professional standards, and improving resource allocation and project management.
Sustaining our capacity
Our people are central to our ability to fulfill our responsibilities and achieve our strategic outcome. Since 2006, we have identified various human resource issues as priorities for the Office. In 2009–10, sustaining our capacity continued to be a major challenge and priority. To address this priority, during the year we completed most of the planned activities, including
- adopting the Strategic Methodology Plan to focus on the most important development needs of our auditors,
- completing virtually all of the planned expansion of our methodology teams to enhance their capacity to support our auditors, and
- increasing the number of financial accounting students we recruit.
We also approved and partially completed the Human Resource Integration Project—a vehicle to promote retention and engagement of staff.
Integrating changes to professional standards
In 2007–08, we began to increase our efforts to integrate upcoming changes to professional standards into our policies, methodology, training, and practices. This past year, we delivered on two main initiatives that were identified in our Strategic Methodology Plan: We are revising our guidance material, templates, and electronic working paper files to reflect the new Canadian Auditing Standards; and we delivered baseline training to all of our financial auditors. We continued to roll out necessary training in keeping with a multi-year plan we developed for adopting new accounting standards known as International Financial Reporting Standards (IFRS). We also continued to deliver new audit tools to support our financial auditors.
During the year, we identified a need to update and strengthen the design and implementation of our Quality Management System. This has become one of our strategic priorities for 2010–11. To address this new priority and to continue to integrate the changes to professional standards, we developed a comprehensive strategic plan for the Renewal of Audit Methodology (RAM) for all of our audit products. This two-year plan outlines the scope, timelines, estimated effort and financial resource requirements, and it formalizes the management of this large initiative. We have begun implementing this plan, which involves a major update of our audit methodology and manuals. As well, we are reviewing and updating our professional development curriculum.
Improving resource allocation and project management
We have been working to improve our ability to complete our audits on budget since 2008. In 2009–10, we
- completed a study of the practices for establishing and monitoring audit budgets throughout the office to identify best practices and challenges;
- approved our Budget Management of Individual Audit Products Action Plan, which provides support for managing budgets and encourages best practices; and
- explicitly considered on-budget performance in our 2009 performance appraisals.
Later in this performance report, we present the details of the year’s results for on-budget performance. We are pleased that we have improved our results and met all of our targets for this measure. We have raised our targets for on-budget performance to 80 percent, beginning in 2010–11.
We also continued to facilitate staff allocation to projects through our Audit Resource Planning and Career Management Team.
Funding new Office work
In our 2009–10 Report on Plans and Priorities, we noted that, in light of the fiscal climate, the Office would not be seeking additional funding to carry out new audit responsibilities we were given. Rather, we identified a number of ways in which we would redirect our existing resources. We planned 25 performance audits—a reduction from 30 in recent years—and tabled two rather than three reports. We reduced our use of externally contracted resources for our audits and, as a result, reduced these expenditures by about $1,750,000.
Performance highlights by main activity
Indicators of impact
We measure our impact and performance for our three main activities:
- financial audits of Crown corporations, territorial governments, and other organizations;
- performance audits and studies of departments and agencies; and
- special examinations of Crown corporations.
The following sections summarize the results for 2009–10 for each of these activities.
Financial audits of Crown corporations, territorial governments, and other organizations
Financial audits answer the following questions:
- Are the annual financial statements of Crown corporations, the federal and territorial governments, and other organizations presented fairly?
- Are these entities complying with their legislative authorities?
Exhibit 2 summarizes our results for financial audits for 2009–10.
Exhibit 2—Results for financial audits
|
Expected results
|
Actual results We completed 111 financial audit reports that provided the recipients, and ultimately Parliament, with an independent opinion that they can rely on the financial information we examined. |
||
|
Objectives |
Indicators and targets |
Performance summary |
Performance status |
|
Our work adds value for the key users of our reports. |
90 percent of audit committee chairs find our financial audits add value. |
95 percent of audit committee chairs who responded to our survey found our financial audits add value. |
Exceeded |
|
Our work adds value for the organizations we audit. |
80 percent of Crown corporation and large-department senior managers find our financial audits add value. |
85 percent of Crown corporation and large-department senior managers who responded to our survey found our financial audits add value. |
Exceeded |
|
Key users of our reports and the organizations we audit respond to our findings. |
100 percent of the reservations in our audit opinions are addressed from one financial audit to the next. |
41 percent of the reservations in our 2008–09 audit opinions were addressed from one financial audit to the next. |
Not met |
|
Financial resources 2009–10: $40.0 million |
|||
Our work adds value for key users of our reports and the organizations we audit. To understand the value of our financial audits, we conduct surveys of the chairs of audit committees and other bodies with responsibility for oversight of financial reporting, and of senior managers in the organizations we audit. The surveys are available on our website.
Our target is for 90 percent of audit committee chairs to find that our audits add value. In 2009–10 an average of 95 percent of respondents indicated that they “agree” or “strongly agree” in response to all five statements used to measure value added.
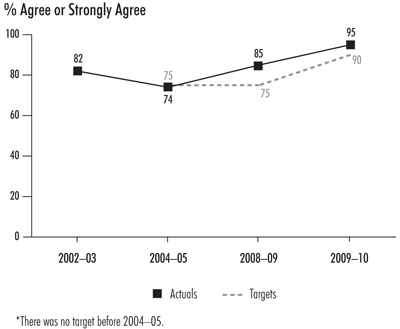
Exhibit 3 shows the trend for audit committee chair responses. We conducted biennial surveys in 2002–03 and 2004–05, and began annual surveys in 2008–09. The assessment of audit committee chairs in 2009–10 was the best of the four surveys conducted to date.
Exhibit 3—Financial audits add value for audit committee chairs
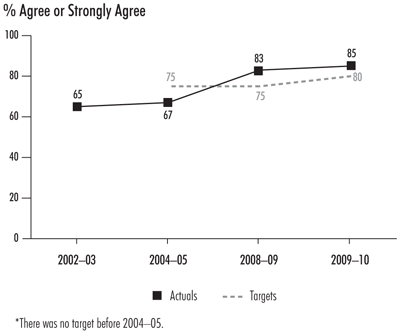
For the percentage of senior managers of Crown corporations and large departments who “agree” or “strongly agree” that our financial audits add value, our target is 80 percent. Exhibit 4 shows the trend for senior manager responses. The result in 2009–10 was an average of 85 percent, the highest obtained in the surveys to date (Exhibit 4).
Exhibit 4—Financial audits add value for senior managers
Key users of our reports and the organizations we audit respond to our findings. For our financial audits, we monitor the corrective action taken by the organizations we audit in response to reservations of opinion contained in our reports. Our indicator is the percentage of reservations that are addressed by the organizations we audit from one report to the next. While we do not control whether organizations respond to reservations in our reports, our target is 100 percent.
There are two types of reservations that are presented in our financial audit reports: reservations related to financial accounting and auditing issues, and reservations related to compliance-with-authorities issues. Financial accounting reservations report material departures from the requirements of the applicable financial reporting framework. Auditing reservations report situations where the auditor is unable to obtain sufficient appropriate audit evidence. Our reports can also contain other matters—for example, these might include comments concerning an organization’s financial sustainability or ability to fulfill its mandate. Beginning in 2008–09, we have included compliance-with-authorities reservations and “other matters,” as well as financial accounting and auditing reservations, in the calculation of this performance indicator.
In completing our financial audits in 2009–10, we found that nine of the 22 reservations contained in our 2008–09 financial audit opinions had been addressed by the organizations we audit. Of the 13 reservations that had not been addressed, three were auditing reservations, one was an accounting reservation, and nine were compliance-with-authorities issues. Five of those nine, all in territorial corporations, were for the corporations’ failure to table their annual report on time. All of the accounting and auditing reservations were in territorial corporations. Many territorial organizations continue to face a challenge in having the financial management capacity they require. Only one of the 13 reservations was in an audit report on a federal organization.
Performance audits and studies of departments and agencies
Performance audits and studies answer the following questions:
- Are federal government programs well managed?
- Have they been run with due regard to economy, efficiency, and their environmental effects?
- Does the government have the means to measure their effectiveness where it is reasonable and appropriate to do so?
In 2009–10, we completed 25 performance audits and one study. A list of these is in Section III—Supplementary Information.
Exhibit 5 summarizes our results for performance audits and studies for 2009–10.
Exhibit 5—Results for performance audits and studies
|
Expected results
|
Actual results We completed 25 performance audits and one study, a number reduced from recent years as planned. |
||
|
Objectives |
Indicators and targets |
Performance summary |
Performance status |
|
Key users of our reports are engaged in the audit process. |
Maintain percentage of performance audits that are reviewed by parliamentary committees. Maintain number of parliamentary hearings and briefings we participate in. |
Parliamentary committees reviewed 68 percent of our performance audit reports—a slight increase from the previous year. We participated in 39 committee hearings and briefings over the 113 parliamentary sitting days. This is higher than last year and is consistent with the average in previous years. |
Exceeded |
|
Our work adds value for the key users of our reports. |
90 percent of selected parliamentary committee members find our performance audits add value. |
93 percent of parliamentarians surveyed agreed that our audit reports add value. |
Exceeded |
|
Our work adds value for the organizations we audit. |
70 percent of departmental senior managers find our performance audits add value. |
56 percent of departmental senior managers who responded to our survey found our performance audits add value. |
Not met. Result is only slightly below the five-year average. We will continue to monitor this indicator. |
|
Key users of our reports and the organizations we audit respond to our findings. |
75 percent of performance audit recommendations are substantially or fully implemented four years after their publication. |
Departments reported that they had substantially or fully implemented 90 percent of the performance audit recommendations made in the reports we tabled four years ago. |
Exceeded |
|
Financial resources 2009–10: $42.9 million |
|||
Key users of our reports are engaged in the audit process. While many parliamentary committees draw on our work, the Office’s main relationship is with the Standing Committee on Public Accounts. The Commissioner of the Environment and Sustainable Development usually appears before the House of Commons Standing Committee on Environment and Sustainable Development.
We monitor the level of involvement of parliamentary committees by tracking the number of audits reviewed by committees. We also assess the committees’ level of interest in our reported findings by looking at how frequently they ask us to appear before them to further elaborate on our findings. Our appearances before committees assist parliamentarians in fulfilling their oversight role and give us the opportunity to increase awareness and understanding of the issues in our reports.
Our work adds value for the key users of our reports. We periodically carry out surveys of the members of four key parliamentary committees that review our reports: the House of Commons Standing Committee on Public Accounts; the House of Commons Standing Committee on Environment and Sustainable Development; the Senate Standing Committee on National Finance; and the Senate Standing Committee on Energy, the Environment and Natural Resources. In June 2010, we conducted a survey requesting feedback on performance audits reported in the past year. We received 21 responses this year (42 percent of members surveyed), a slight decrease from previous years.
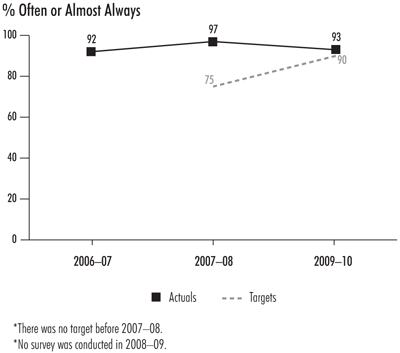
Our target is to have 90 percent reply “often” or “almost always” in response to five statements that are used as an indication that our audits add value. In 2009–10 the result was an average of 93 percent. Exhibit 6 shows the trend for responses to the parliamentary survey. We exceeded the target of 75 percent in the 2007–08 survey. In 2009–10 we increased the target to 90 percent, and exceeded that target in our most recent survey.
Exhibit 6—Performance audits add value for parliamentary committee members
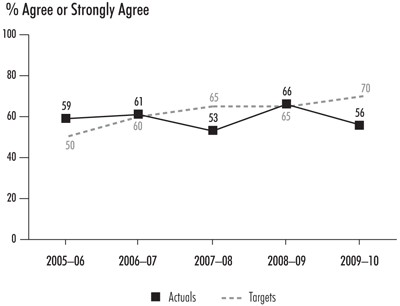
Our work adds value for the organizations we audit. Since 2003–04, we have surveyed senior management of organizations subject to our performance audits after tabling the audit report in Parliament.
Our target is to have 70 percent of senior management respondents indicate that they “agree” or “strongly agree” that our performance audits add value for them. The percentage of responses of “agree” or “strongly agree” averaged 56 percent for audits in 2009–10. While this result is below our target, it is only slightly below our five-year average (Exhibit 7). Therefore, we believe that this trend does not warrant any specific action on our part at this time.
Exhibit 7—Performance audits add value for senior management
Key users of our reports and the organizations we audit respond to our findings. Departments and agencies are responsible for taking corrective action and improving their management practices in response to our audit findings. Annually, we request an update from these organizations on their progress in implementing our recommendations. Beginning in 2007–08, we also asked them to assess their level of implementation. The information we receive is self-reported by the departments and agencies. While we do not subject it to any detailed review or audit, we do consider it for consistency with our current knowledge of the organization. Department chief audit executives are responsible for routinely reporting to their departmental audit committee on whether management's action plans have been implemented and whether there is reason to question the effectiveness of the actions taken. Departmental audit committees are to advise the deputy head of the organization on the effectiveness of arrangements in place for monitoring and following up on management action plans that respond to recommendations from our Office.
Exhibit 8 shows the implementation rate for recommendations made in the performance audits we tabled in 2005–06, after one, two, three, and four years. As the exhibit indicates, departments and agencies need time to act on recommendations. Therefore, we have established that four years is a reasonable period of time to assess the extent to which our recommendations have been implemented. We expect that 75 percent of recommendations will be substantially or fully implemented after four years. In 2009–10, departments reported that they had substantially or fully implemented 90 percent of recommendations made in the performance audit reports we tabled in 2005–06.
Exhibit 8—Cumulative percentage of implemented recommendations from reports tabled in 2005–06
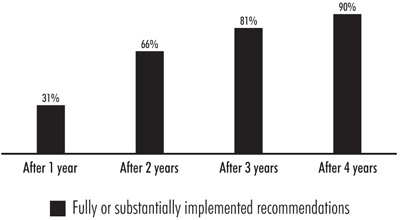
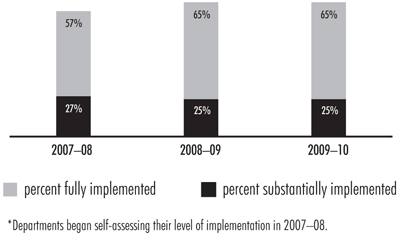
Exhibit 9 shows the trend for implementing recommendations over the past three years. The overall percentage of recommendations implemented four years after the performance audit report was tabled was the same in 2008–09 and 2009–10.
Exhibit 9—Percentage of performance audit recommendations implemented after four years*
Periodically, we prepare a status report that follows up on the government’s progress in responding to recommendations contained in previous performance audits. We audit selected recommendations and findings from prior reports to determine if progress in addressing them has been satisfactory. When we make that determination, we consider the time elapsed since our original report and the complexity and degree of difficulty of remedial action required of the government. These status reports are a way for us to determine—and for parliamentarians to understand—whether government organizations are meeting commitments they made in response to our previous recommendations. We tabled our most recent status report in March 2009 and concluded that for the seven topics we examined, there was satisfactory progress in five.
Special examinations of Crown corporations
A special examination of a Crown corporation answers the following question:
- Do the systems and practices used by Crown corporations provide reasonable assurance that assets are safeguarded and controlled, that resources are managed economically and efficiently, and that operations are carried out effectively?
In 2009–10, we reported on the special examinations of the 10 corporations listed in Section III—Supplementary Information.
We began publishing a chapter presenting the main points of special examinations in 2008 and will continue to present this information annually in our Report to Parliament. Chapter 6 of our 2010 Spring Report, Special Examinations of Crown Corporations—2009, presents the main points of 11 special examination reports. These reports were issued to the Crown corporations’ boards of directors between 1 January 2009 and 31 December 2009 and have subsequently been made public. Of these 11 reports, eight identified no significant deficiencies. Three identified one or more significant deficiencies:
- Canada Post Corporation had a significant deficiency related to a strategic risk due to lack of funding for the postal transformation initiative.
- Canada Science and Technology Museum Corporation had a significant deficiency related to its human resource management systems and practices.
- Marine Atlantic Inc. had two significant deficiencies: one related to unresolved strategic challenges, and the other relating to systems and practices in operational planning and capital asset management.
Legislation states that we should bring the information in our reports to the attention of the appropriate ministers and Parliament, when we deem it necessary. For example, we do this when we find certain types of significant deficiencies, such as those related to mandate or governance issues that only the federal government can address, or problems that have previously been reported but continue to occur. We also report issues to the appropriate minister involving specific risks that, in our opinion, the minister needs to be aware of. For the three corporations noted here, we chose to bring the reports to the attention of the appropriate minister.
Exhibit 10 summarizes our performance results for special examinations of Crown corporations for 2009–10.
Exhibit 10—Results for special examinations
|
Expected results
|
Actual results We delivered 10 special examination reports on federal Crown corporations in 2009–10. In three of these reports, we idenified significant deficiencies, and in one case—Marine Atlantic Inc.—these deficiencies continued from the previous special examination. |
||
|
Objectives |
Indicators and targets |
Performance summary |
Performance status |
|
Our work adds value for the key users of our reports. |
90 percent of board chairs find our special examinations add value. |
80 percent of board chairs who responded to our survey found our special examinations add value. |
Not met |
|
Our work adds value for the organizations we audit. |
80 percent of Crown corporation chief executive officers find our special examinations add value. |
90 percent of Crown corporation chief executive officers who responded to our survey found our special examinations add value. |
Exceeded |
|
Key users of our reports and the organizations we audit respond to our findings. |
100 percent of significant deficiencies are addressed from one special examination to the next. |
50 percent of significant deficiencies were addressed from one special examination to the next. |
Not met |
|
Financial resources 2009–10: $4.1 million |
|||
Our work adds value for the key users of our reports and the organizations we audit. To understand the value of our special examinations to the users of these reports and the organizations we audit, we survey board chairs and chief executive officers, respectively. The number of survey respondents is small, corresponding with the number of special examinations we complete each year. We received responses from five of the ten board chairs and five of the ten chief executive officers surveyed in 2009–10. Due to the small number of respondents, detailed results are not presented. We follow up if issues are raised or where opportunities arise to improve our performance. Over the past five years, the feedback we have received has been positive and continues to improve.
Key users of our reports and the organizations we audit respond to our findings. We monitor the corrective action taken in response to significant deficiencies reported in our special examinations. Our indicator is the percentage of significant deficiencies that are addressed by the organizations we audit from one examination to the next. Our target is 100 percent.
For the 10 special examinations completed in 2009–10, two had significant deficiencies in the previous special examination, and in one case the deficiencies continued in 2009–10 (Marine Atlantic Inc.). Due to these significant deficiencies, we concluded that Marine Atlantic Inc. did not have the reasonable assurance required by section 131 of the Financial Administration Act that its assets were safeguarded and controlled, its resources were managed economically and efficiently, and its operations were carried out effectively.
Sustainable development and environmental petitions activities
Sustainable development activities. Under the Kyoto Protocol Implementation Act (KPIA), the Commissioner of the Environment and Sustainable Development is required to provide Parliament with a biennial report that includes an analysis of Canada’s progress in implementing its climate change plans and an analysis of Canada’s progress in meeting its obligations under Article 3, paragraph 1, of the Kyoto Protocol.
Chapter 2 of the 2009 Spring Report of the Commissioner of the Environment and Sustainable Development was our first report under the KPIA. We found that the government is unable to monitor actual emissions reductions resulting from a number of the initiatives in its plans. We also found problems in how the government explained its projected reduction targets.
In June 2010, the Commissioner provided the Minister of Environment with his comments on the government’s draft sustainable development strategy, as required under the 2008 Federal Sustainable Development Act. The Act required Environment Canada to prepare a federal sustainable development strategy that included goals and targets by June 2010 and to produce a progress report at least once every three years after the day on which the Act came into force. The Commissioner commented on various aspects of the draft strategy, including whether the targets and implementation strategies can be assessed. He concluded that the draft strategy relies on existing mechanisms and government processes to promote more transparency and accountability. He also found that the strategy’s lack of specific measurable targets and performance indicators will make it difficult for Environment Canada to provide Parliament with a comprehensive and objective assessment of the government’s progress as it is required to do under the Act.
To build awareness of good management practices for sustainable development, in 2009–10, the Commissioner released a discussion paper entitled Managing Sustainable Development. The paper was intended to encourage dialogue among senior federal officials and others about putting sustainable development goals into practice. It highlights a number of analytic techniques and approaches to managing and measuring sustainability.
Environmental petitions. The 1995 amendments to the Auditor General Act require that we monitor and report annually to Parliament on environmental petitions received from Canadians. The Commissioner reports on the quantity, nature, and status of petitions received and on the timeliness of ministers’ responses. The annual report on environmental petitions was included in the Commissioner’s 2009 Fall Report, tabled in Parliament in November 2009.
In 2009–10, the Office received 29 environmental petitions. Ministers delivered 91 percent of responses to petitions on environmental matters within the 120-day time limit, compared with 83 percent last year.
Organizational performance
We measure and manage our performance as an organization in a number of ways. The following section describes our key performance objectives, indicators, and targets and how we performed in 2009–10.
Delivering work on time and on budget
On time. The majority of financial audits of federal Crown corporations (98 percent) were completed on time, but we did not meet our target of 100 percent. All financial audits of other federal organizations with a statutory deadline were completed on time, and we met the target of 100 percent. Completing audits of federal organizations without a statutory deadline on time can be more challenging as these entities are not always ready to be audited within our self-determined deadline of 150 days after the end of the reporting period. Nonetheless, in 2009–10, 86 percent of these audits were completed on time, exceeding our target of 80 percent. Territorial financial audits present some unique challenges, including client readiness; however, we have improved our performance by completing 64 percent of these audits on time in 2009–10, up from 48 percent in 2008–09, and exceeded our target of 60 percent.
For performance audits, the Office determines when individual audit reports will be tabled in the House of Commons; thus, there are no statutory deadlines for these reports. However, we communicate to the House of Commons Standing Committee on Public Accounts our planned tabling schedule for performance audits for the coming fiscal year. In our 2009–10 Report on Plans and Priorities (RPP), 24 performance audits and one study were listed as planned for tabling during that fiscal year. All of the audits were completed as planned, but the study, Managing Sustainable Development—A Discussion Paper by the Commissioner of the Environment and Sustainable Development, was not. It was planned for the fall of 2009 but was completed in the spring of 2010. The target for 2009–10 was 90 percent on time, and our performance was 96 percent.
We also issued our report on the design and implementation of Export Development Canada’s Environmental Review Directive, which was not listed in the RPP. This report was completed in June 2009, within the time period required by the Export Development Act.
Details of the audits tabled are in Section III—Supplementary Information.
In our 2009–10 RPP, we listed 15 special examinations that we planned to complete in 2009–10. Due to the change in legislation that extended the frequency of special examinations from five to ten years, the statutory deadlines changed, and our plan was revised accordingly. The 10 special examinations that were completed in 2009–10 were all delivered on or before the statutory deadline (see List of completed special examinations).
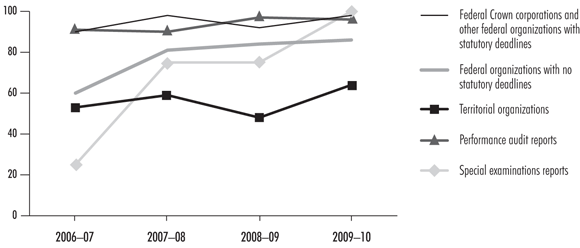
Exhibit 11 shows the trends in our performance for producing our products on time.
Exhibit 11—Percentage of audits completed on time
On budget. For all of our audits, being on budget is defined as completing the audit in no more than 115 percent of the budgeted hours for the audit. This figure recognizes that factors outside the control of the audit team, such as client readiness and the number and complexity of audit issues identified, can affect time spent on an audit. It also reflects the balance we want to establish between assuring we do quality work and meeting our budgets.
In 2009–10, our results improved significantly for performing audits on budget, including financial audits of federal Crown corporations and other federal organizations, performance audits, and special examinations. All results are above our target of 70 percent. Our result for performing financial audits of territorial organizations on budget decreased slightly to 60 percent, but met the target of 60 percent.
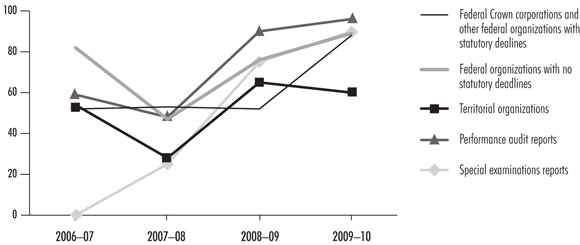
Exhibit 12 shows the trend in our performance for completing audits on budget. We have raised our targets for our on-budget indicator to 80 percent, beginning in 2010–11.
Exhibit 12—Percentage of audits completed on budget
Ensuring our audit reports are reliable
Our audit work is guided by a rigorous methodology and quality management system. Annual internal reviews and periodic external peer reviews provide the Auditor General with opinions on whether our audits are conducted in accordance with professional standards, and whether our Quality Management System (QMS) is appropriately designed and effectively implemented. We report publicly on the results of these reviews in order to provide assurance to members of Parliament and the public that they can rely on the opinions and conclusions contained in our audit reports. Our Quality Management System is based on professional standards and Office policies. It guides auditors through a set of steps they must follow during their audits and ensures that these audits are conducted according to professional standards and Office policies. Annual internal reviews also conclude on whether the opinions and conclusions contained in our audit reports are appropriate. External reviews conducted by the provincial institutes of chartered accountants conclude on whether we are following professional standards and meeting their requirements for training chartered accounting students.
Internal practice reviews. Each year, we conduct practice reviews of our financial audits, special examinations, and performance audits by assessing their compliance with our QMS.
In 2008–2009, the practice reviews identified a number of instances where improvements should be made to our QMS and where it was not applied consistently and completely. As a result, we made updating and strengthening the design and implementation of the QMS a strategic priority in 2009–10. We have been addressing this strategic priority, as well as integrating changes to professional standards, through the following initiatives: a major update of our audit manuals and associated methodology, and a review and update of our professional development curriculum. These initiatives will continue through 2011.
In 2009–10, we completed 18 practice reviews—eight of financial audits, eight of performance audits, and two of special examinations. In all cases, the practice reviews found that the opinions and conclusions expressed in our reports were appropriate and supported by the evidence. The reviews found that two audits were in full compliance with our QMS and that five audits had two or fewer areas that needed improvement. In the remaining files, we identified a number of areas where our QMS could have been implemented more rigorously.
While these results are an improvement over last year, the Office is still not satisfied with them. We have again developed action plans for each of our main activities, approved by the Office’s Executive Committee, to address the areas for improvement and to support continuous learning by all of our staff.
External reviews. Through peer reviews of the Office, conducted by other national legislative audit offices, we periodically seek independent assurance that our QMS is suitably designed and is operating effectively to produce independent, objective, and supportable information that Parliament can rely on to examine the government’s performance and hold it to account. A peer review was conducted in 2009–10 that encompassed all three of our main audit practices, as well as key services that directly support audit operations.
The peer review team found that, for the period under review, the QMS for performance audits, special examinations, and financial audits was suitably designed to provide reasonable assurance that the work of the OAG complied with relevant legislative authorities and professional standards. Also, the QMS was operating effectively for the performance audit and special examination practices. For the annual audit practice, the QMS was generally operating effectively, but it needs to be better implemented to address issues in the following areas:
- The risk assessment procedures that inform the nature and extent of further audit procedures need to be more complete.
- The audit documentation is not always sufficient in recording the results of the audit work performed.
We have prepared an action plan in response to the peer review. The peer review report and the action plan are available on our website.
A second type of external review is conducted by the provincial institutes of chartered accountants, who review our compliance with professional standards and our training of chartered accounting students. No reviews were conducted in 2009–10. However, the most recent reviews by the institutes of five provinces concluded that we were following professional standards and met their training requirements.
Internal audits. We also audit our management and administrative practices. These audits assure the Auditor General that the Office is complying with government and Office policies. They also provide managers with assessments and recommendations. The web location of the list of internal audits and reviews is in Section III—Supplementary Information.
In 2009–10, after the implementation of a new financial system in April 2008, we finalized an internal audit on the controls over the Office’s financial transactions and financial reporting system. The findings indicated that the overall controls were designed effectively to prevent or detect a material misstatement in the OAG’s financial statements. We also began an audit of compliance with the office’s hospitality policy. The findings of this audit will be reported in our 2010–11 Performance Report. As our internal audits are completed, we publish the results on our website.
The Office’s Audit Committee provides the Auditor General with independent advice on matters relating to management controls in the Office and to reporting on its plans and performance. In its 2009–10 report to the Auditor General, it concluded that “the Office has a rational and systematic approach to addressing its mandate, to monitoring its results, and reporting to Parliament and the public.”
Providing a respectful workplace
Our values for creating a respectful workplace are trust, integrity, and leading by example. These values define how we conduct ourselves and carry out our work. In addition, the Office strongly supports the values of competency, representativeness, non-partisanship, fairness, employment equity, transparency, flexibility, affordability, and efficiency. The Office includes these values in all of its human resource activities. In addition, since 2005, 50 percent of managers’ performance pay has been tied to their people management skills.
The Office has set four objectives for providing a respectful workplace, each with its own indicators and targets:
- Provide a workplace environment where employees are satisfied and engaged
- Promote a bilingual workplace
- Assemble a workforce that represents the Canadian workforce
- Ensure that qualified, capable employees are available to carry out our mandate
Satisfied and engaged employees. We achieved a 91 percent response rate for the 2010 employee satisfaction survey. This result is in the range of levels attained in 2008 (93 percent) and 2006 (85 percent). A survey is conducted every two years.
We obtained an overall satisfaction rating of 78 percent, which falls just short of our target of 80 percent and is lower than levels attained in 2006 (82 percent) and 2008 (88 percent). Employee engagement remains high with 89 percent of staff proud to work for the Office, 85 percent inspired to give their very best, and 80 percent motivated to go beyond their formal job duties. The survey highlighted key strengths, including a perception that the OAG
- is effectively managed and well run,
- has management that is seen to be leading by example, and
- has supervisors who provide recognition and fair performance appraisals.
Staff indicate that their jobs make good use of their skills and abilities and that they have the authority required to do their work. The survey results also showed positive response to actions taken by the Executive Committee since 2008 in the areas of managerial and supervisory effectiveness.
Among the issues noted in the survey is a perceived decline in certain aspects of the Office climate. Employees expressed growing uncertainty about their personal prospects with the Office and continue to raise concerns around the availability of tools and resources to do their jobs effectively. The Employee Committee will review the current results and make recommendations to the Executive Committee on ways of responding to issues raised in the survey.
A bilingual workforce. The Office has continued to improve its bilingual capacity in the management group. On 31 March 2010, 85 percent of our senior management group (assistant auditors general and principals) met the language requirements of their positions. As for the directors, 84 percent met the language requirements of their positions, a significant increase from last year. The Office marked the 40th anniversary of the Official Languages Act by renewing its commitment to promoting bilingualism across the Office. Our 2009–2012 Official Languages Strategy focuses on training and building a supportive culture.
A representative workforce. Even with a slight decrease in its workforce from the previous year, the Office has been able to exceed 100 percent representation of workforce availability for three out of four designated groups and to increase its representation of visible minorities to close to 90 percent of workforce availability.
Retention rate. The retention rate of 89 percent has increased slightly in the past year and remains slightly below our target of 90 percent. The Office is focusing its attention on specific target groups, especially in the accounting field, in order to increase retention.
Financial performance
Our net allowable spending for 2009–10 was $105.3 million. This amount consisted of $92.2 million in current year appropriations, plus $14.0 million in services provided by other government organizations without charge, less non-respendable revenue of $0.9 million.
Parliamentary appropriations
In 2009–10, the Office used $87.8 million of the $92.2 million in parliamentary appropriations approved (Exhibit 13). The $92.2 million comprised $82.2 million in Main Estimates and a further $10.0 million in Supplementary Estimates and adjustments and transfers. The $10.0 million was routine in nature, including the carry-forward funding ($3.5 million), various salary-related entitlements such as retroactive pay from 2007 and economic increases ($3.4 million), parental leave/severance payments ($2.1 million) recovered from the Treasury Board of Canada Secretariat (through the contingency vote) and employment benefit plan adjustments ($1.0 million).
Exhibit 13—Voted and statutory items
|
|
2009–10 ($ millions) |
||||
|---|---|---|---|---|---|
|
Vote # or statutory item (S) |
Vote or statutory wording |
Main Estimates |
Planned spending |
Total authorities |
Total actual expenditures |
|
15 |
Program expenditures |
72.6 |
72.6 |
81.7 |
77.3 |
|
(S) |
Contributions to employee benefit plans |
9.6 |
9.6 |
10.5 |
10.5 |
|
Total |
82.2 |
82.2 |
92.2 |
87.8 |
|
The Office lapsed $4.4 million in 2009–10 ($3.5 million in 2008–09). Like government departments and agencies, subject to parliamentary approval, the Office may carry forward lapsed amounts and adjustments of up to five percent of its operating budget (based on Main Estimates program expenditures) into the next fiscal year.
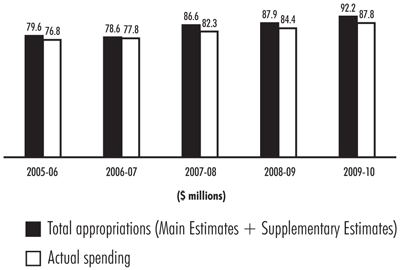
Exhibit 14 shows our spending trend from 2005–06 to 2009–10.
Exhibit 14—Spending trend
Cost of operations
In 2009–10, the net cost of operations for the Office was $99.3 million, as reported in our audited financial statements, compared with $100.1 million in 2008-09. The difference between 2009-10 net cost of operations ($99.3 million) and current year appropriations used ($87.8 million) is due primarily to the cost of services received without charge from other government departments ($14.0 million), offset by other amounts that do not affect the current year use of appropriations, including prepaid expenses, vacation pay, and severance benefits.
|
FTEs |
2009–10 |
2008–09 |
|---|---|---|
|
Planned |
620 |
627 |
|
Actual |
632 |
628 |
Analysis by legislative auditing activity
We reported an original budget of $93.6 million for 2009–10 in our 2009–10 Report on Plans and Priorities, and a revised 2009–10 budget of $100.8 million in our 2010–11 Report on Plans and Priorities. The 2009–10 revised budget (forecast spending) and actual spending (net cost of operations) are presented in Exhibit 1—Performance summary.
We manage costs for the Office as a whole and also for individual audits. Audit budgets are established for planned hours and planned costs of work. All direct salary, professional service, travel, and other costs associated with the delivery of individual audits and professional practice projects are charged directly to these audits and projects. All other Office expenses, including employee leave, corporate services, and services provided without charge, are treated as overhead and allocated to audits and professional practice projects based on the salary costs charged to them.
During the year, we reviewed our costing methodology and made changes to simplify the calculation and allocation of overhead to audit products. Consequently, the costs for the year ending 31 March 2009 have been restated to reflect the revised methodology.
Financial audits of Crown corporations, territorial governments, and other organizations
|
($ millions) |
2008–09 |
2009–10 |
|
|---|---|---|---|
|
|
Actual costs1 |
Budget |
Actual costs |
|
Financial audits—Crown corporations, territorial governments, and other organizations, and the summary financial statements of the Government of Canada |
36.3 |
41.3 |
40.0 |
|
1 2008–09 actual costs have been restated to reflect the reclassification of products in our revised product costing methodology. |
|||
The costs of this activity in 2009–10 were higher than last year as a result of additional work on the audits of departmental financial statements and the International Labour Organization as well as preliminary work on audit entities adopting International Financial Reporting Standards and significant audit issues in a number of entities. The 2009–10 costs were less than budgeted mainly due to the deferral of our audit of the design and implementation of internal control over financial reporting related to income tax programs at the Canada Revenue Agency.
Performance audits and studies
|
($ millions) |
2008–09 |
2009–10 |
|
|---|---|---|---|
|
|
Actual costs1 |
Budget |
Actual costs |
|
Performance audits and studies |
44.6 |
41.5 |
42.9 |
|
1 2008–09 actual costs have been restated to reflect the reclassification of products in our revised product costing methodology. |
|||
Our decision to reduce the number of performance audits we would conduct resulted in a lower number of audits tabled or in progress in 2009–10, resulting in a decrease in costs from 2008–09. This year’s actual costs were over budget due primarily to changes in the timing of some audits, which are typically done over two fiscal years, an increase in other investigative work, and risk assessments through the Office’s multi-year audit planning process.
Special examinations of Crown corporations
|
($ millions) |
2008–09 |
2009–10 |
|
|---|---|---|---|
|
|
Actual costs1 |
Budget |
Actual costs |
|
Special examinations of Crown corporations |
8.2 |
4.5 |
4.1 |
|
1 2008–09 actual costs have been restated to reflect the reclassification of products in our revised product costing methodology. |
|||
The total cost of conducting special examinations of Crown corporations varies depending on the number of examinations under way each year; their nature, size, and complexity; and the risk levels of the corporations being examined. Based on an amendment to the Financial Administration Act in 2009, we performed less work on special examinations in 2009–10 because the frequency of special examinations has been changed from a five-year cycle to a ten-year cycle.
Sustainable development monitoring activities and environmental petitions
|
($ millions) |
2008–09 |
2009–10 |
|
|---|---|---|---|
|
|
Actual costs1 |
Budget |
Actual costs |
|
Sustainable development monitoring activities and environmental petitions |
1.8 |
2.3 |
1.2 |
|
1 2008–09 actual costs have been restated to reflect the reclassification of products in our revised product costing methodology. |
|||
The costs of this activity in 2009–10 were lower than planned due to a decrease in petitions received, as well as changes in the Federal Sustainable Development Act (June 2008), which did not require an audit of sustainable development strategies in 2009 or 2010. Actual costs were also lower than in 2008–09 for the same reasons.
Professional Practices
|
($ millions) |
2008–09 |
2009–10 |
|
|---|---|---|---|
|
|
Actual costs1 |
Budget |
Actual costs |
|
Professional practices |
9.6 |
11.8 |
11.6 |
|
1 2008–09 actual costs have been restated to reflect the reclassification of products in our revised product costing methodology. |
|||
The 2009–10 actual costs for this activity were higher than last year’s costs mainly due to the beginning of our project to renew our audit methodology. The costs were slightly lower than what was planned for this year, primarily due to reduced costs for international activities.
Our international contribution
Our international strategy guides our international activities and positions the Office to meet future opportunities and challenges. The strategy has four goals:
- contributing to the development and adoption of appropriate and effective professional standards,
- sharing knowledge among audit offices,
- building capabilities and professional capacities of audit offices, and
- promoting better managed and accountable international institutions.
Contributing to the development and adoption of appropriate and effective professional standards
International accounting and auditing standards are influencing Canada’s public and private sector standards and will soon be implemented in Canada. The Office plays an active role in shaping these standards, particularly as they relate to the public sector. To that end, employees in the Office participate in various task forces of the International Auditing and Assurance Standards Board to revise and develop International Standards on Auditing. In January 2008, the Auditor General became a member of the International Public Sector Accounting Standards Board of the International Federation of Accountants.
The Office is also a member of the Professional Standards Committee’s Subcommittee on Financial Audit Guidelines of the International Organization of Supreme Audit Institutions (INTOSAI). This subcommittee supports and contributes to the development of high-quality guidelines that are globally accepted for auditing financial statements in the public sector.
Sharing knowledge among audit offices
Office employees participate in various committees of INTOSAI, including the Subcommittee on Performance Audit, the Ad hoc Group on Transparency and Accountability, the Working Group on Information Technology Audit, the Working Group on Environmental Auditing, the Working Group on Value and Benefits of Supreme Audit Institutions, the Subcommittee to Promote Increased Capacity Building Activities Among INTOSAI Members, the Working Group on Public Debt, and the Task Force on the Global Financial Crisis. The Auditor General assumed the chair of the Professional Standards Committee’s Subcommittee on Accounting and Reporting of INTOSAI in November 2007.
Building capabilities and professional capacities of audit offices
The Office is helping to build capacity in audit institutions located in French sub-Saharan Africa, in partnership with the Canadian International Development Agency (CIDA) and two executing agencies. We provide training to auditors from other national audit offices through the International Legislative Audit Assistance Program for Improved Governance and Accountability of the Canadian Comprehensive Auditing Foundation. This CIDA-funded program, which was established in 1980, brings auditors from other national audit offices to Canada for 10 months of training in performance auditing, accountability, and governance.
Promoting better managed and accountable international institutions
Working with the Department of Foreign Affairs and International Trade, the Office successfully bid to become the external auditor of the International Labour Organization for a four-year term, effective 2008. The Office is funded through our appropriation for this work. Fees charged to recover the direct costs for this audit are deposited to the Consolidated Revenue Fund. In past years, the Office was also the external auditor of a number of United Nations organizations.
OAG Sustainable Development Commitment
|
Selected sustainable development commitments and targets |
||
|---|---|---|
|
Commitment |
Indicators and targets |
2009–10 Actual |
|
Prepare long-term audit plans and individual performance audits using the Office’s environmental risk assessment guide (4th E Practice Guide). |
100 percent of audit teams use the Guide’s screening tool and consult with environmental specialists to identify and assess environmental risks when they are preparing long-term audit plans. |
100 |
|
100 percent of performance audit teams use the Guide’s screening tool and consult with internal environmental specialists to determine if there are any important environmental issues related to their audit topic. |
100 |
|
|
Provide enhanced support and advice to audit teams conducting special examinations where important environmental risks for Crown corporations have been identified. |
100 percent of these cases receive enhanced support and advice starting in 2007. |
100 |