
Treasury Board of Canada Secretariat
www.tbs-sct.gc.ca
Common menu bar links
Breadcrumb Trail
ARCHIVED - Agriculture and Agri-Food Canada - Report
 This page has been archived.
Archived Content
Information identified as archived on the Web is for reference, research or recordkeeping purposes. It has not been altered or updated after the date of archiving. Web pages that are archived on the Web are not subject to the Government of Canada Web Standards. As per the Communications Policy of the Government of Canada, you can request alternate formats on the "Contact Us" page.
Section III: Supplementary information
Financial Highlights
The financial highlights presented within this Departmental Performance Report are intended to serve as a general overview of AAFC's financial position and operations. More detailed information is provided in the Department's financial statements.
| Condensed Statement of Financial Position At End of Year (March 31, 2010) |
% Change | 2010 | 2009* |
|---|---|---|---|
| Assets | |||
| Total Assets | -2% | 2,991,615 | 3,048,320 |
| Total | -2% | 2,991,615 | 3,048,320 |
| Liabilities | |||
| Total Liabilities | 1% | 2,830,882 | 2,795,844 |
| Equity OF CANADA | |||
| Total Equity | -36% | 160,733 | 252,476 |
| Total | -2% | 2,991,615 | 3,048,320 |
| Condensed Statement of Financial Operations At End of Year (March 31, 2010) |
% Change | 2010 | 2009 |
|---|---|---|---|
| Expenses | |||
| Total Expenses | -11% | 2,424,027 | 2,733,858 |
| Revenues | |||
| Total Revenues | -55% | 141,255 | 311,150 |
| Net Cost of Operations | -6% | 2,282,772 | 2,422,708 |
* Balances for 2009 have been adjusted from those presented in the 2008-09 DPR to conform to the revised Treasury Board accounting standard for departmental financial statements.
Departmental assets include accounts receivable for repayable contributions and capital assets supporting primarily the research activities of the Department that contributed to the strengthening of innovation capacity within the sector in 2009-10. Liabilities consist primarily of accounts payable and accrued liabilities at year end, the majority of which are related to accruals in support of programs such as the AgriInvest and AgriStability programs that were delivered in 2009-10.
Expenses incurred and revenues earned, which supported AAFC's programs and services that benefited Canadians during 2009-10, are detailed in the following chart:
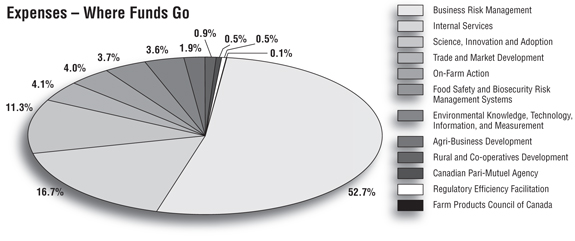
Total expenses for the Department were $2,424 million in 2009-10. The majority of funds, $1,278 million or 52.7%, were spent in the Business Risk Management Program Activities. Science, Innovation and Adoption and Internal services represented another $678 million or 28%. The Program Activities are discussed in Section II of this report.
List of Supplementary Information Tables
All electronic supplementary information tables listed below can be found on the Treasury Board of Canada Secretariat's website.
- Sources of Respendable and Non-Respendable Revenue
- User Fees Reporting
- Status Report on Projects Operating with Specific Treasury Board Approval
- Status Report on Major Crown/Transformational Projects
- Details on Transfer Payment Programs
- Up-Front Multi-Year Funding
- Horizontal Initiatives
- Green Procurement
- Response to Parliamentary Committees and External Audits
- Internal Audits and Evaluations