
Treasury Board of Canada Secretariat
www.tbs-sct.gc.ca
Common menu bar links
Breadcrumb Trail
ARCHIVED - Agriculture and Agri-Food Canada - Report
 This page has been archived.
Archived Content
Information identified as archived on the Web is for reference, research or recordkeeping purposes. It has not been altered or updated after the date of archiving. Web pages that are archived on the Web are not subject to the Government of Canada Web Standards. As per the Communications Policy of the Government of Canada, you can request alternate formats on the "Contact Us" page.
Minister's Message

Canada's hardworking farm families are the backbone of our country, our economy and our health and wellbeing as Canadians. The Canadian agriculture and food sector is a major driver of our Gross Domestic Product, and provides and creates jobs. In 2009, it contributed almost $40 billion to our trade and $8.5 billion to our trade surplus. In the wake of the global economic downturn, agriculture continues to be a strong force for economic recovery right across Canada.
2009-10 was a challenging year for our farmers, and I'm proud of the hard work accomplished for the sector by our Government, by Agriculture and Agri-Food Canada (AAFC) and by the portfolio organizations, working closely with industry and provincial and territorial governments.
We rolled out proactive, flexible programs under the Growing Forward framework, helping our farmers capture new markets, manage business risk, take action on the environment and food safety, and increase innovation through collaborative science clusters.
We helped farmers and processors weather the economic storm through investments under Canada's Economic Action Plan (EAP) to secure a competitive livestock and processing sector, build a national livestock traceability system, brand Canadian food internationally, and give all farmers, including beginning farmers, access to an estimated $1 billion in credit over five years. We also worked with Canada's pork producers to help their industry rebuild for the future. And, to keep Canadian agriculture on the leading edge of innovation, we are investing almost $26 million under the EAP on upgrades to eight laboratories across the country.
Our farmers and food processors export about half their production, so we worked hard with industry to attract more buyers to bid on their products in key markets around the world, including Latin America, the Middle East, Asia, and Russia. We backstopped those efforts with the new Market Access Secretariat, to ensure a coordinated approach with provinces, territories and industry to deal quickly with market access urgencies such as our canola and pork trade with China.
Canada continued to seek out enhanced market access opportunities for our agricultural producers, processors and exporters by advancing an active regional and bilateral trade agenda, which included the launch of a major negotiation with one of our key trading partners, the European Union. At the multilateral level, Canada also remained committed to efforts to achieve a more level international playing field and improved opportunities through the World Trade Organization agriculture negotiations. In pursuing this international agenda, the Government continued to deliver on its strong support for supply management. We also continued to stand up for our export-oriented sectors, making sure that our trading partners respect science-based approaches to trade.
To help the agriculture sector grow and compete, AAFC has launched the Science and Innovation Strategy, focusing on seven key goals and strengthening collaboration with industry and academia.
As Minister, I am grateful the partner organizations of the Agriculture and Agri-Food Portfolio share my steadfast commitment to ensuring the industry's success. By working together, they allow me to meet the sector's needs effectively and efficiently. I know I can rely on their continued support in tackling the sector's challenges, while helping it achieve growth and profitability.
The Honourable Gerry Ritz, P.C., M.P.,
Minister of Agriculture and Agri-Food
Minister for the Canadian Wheat Board
Section I: Departmental Overview
Raison d'être
Agriculture and Agri-Food Canada (AAFC) was created in 1868 - one year after Confederation - because of the importance of agriculture to the economic, social and cultural development of Canada. Today, the Department helps ensure the agriculture, agri-food and agri-based products industries can compete in domestic and international markets, deriving economic returns to the sector and the Canadian economy as a whole. Through its work, the Department strives to help the sector maximize its long-term profitability and competitiveness, while respecting the environment and the safety and security of Canada's food supply.
Responsibilities
AAFC provides information, research and technology, and policies and programs to help Canada's agriculture, agri-food and agri-based products sector increase its environmental sustainability, compete in markets at home and abroad, manage risk, and embrace innovation. The activities of the Department extend from the farmer to the consumer, from the farm to global markets, through all phases of producing, processing and marketing of agriculture and agri-food products.
AAFC's mandate is based upon the Department of Agriculture and Agri-Food Act. The Minister is also responsible for the administration of several other Acts, such as the Canadian Agricultural Loans Act.
The Department is responsible for ensuring collaboration among the organizations within the Agriculture and Agri-Food Portfolio; this means coherent policy and program development and effective cooperation in meeting challenges on cross-portfolio issues. The other portfolio organizations include: the Canadian Dairy Commission; the Canadian Food Inspection Agency; the Canadian Grain Commission; Farm Credit Canada; Canada Agricultural Review Tribunal; and the Farm Products Council of Canada. AAFC also includes the Canadian Pari-Mutuel Agency, a special operating agency that regulates and supervises pari-mutuel betting on horse racing at racetracks across Canada.
AAFC provides the overall leadership and coordination on federal rural policies and programs through Canada's Rural Partnership, and supports co-operatives to promote economic growth and social development of Canadian society. Through the Rural and Co-operatives Development program activity, AAFC coordinates the Government's policies towards the goal of economic and social development and renewal of rural Canada. This program activity also facilitates the development of co-operatives which help Canadians and communities capture economic opportunities.
The Department also supports the Minister in his role as Minister for the Canadian Wheat Board.Strategic Outcomes and Program Activity Architecture (PAA)
Strategic Outcomes
To effectively pursue its mandate and make a difference to Canadians, AAFC's policies and programs are designed to achieve the following three Strategic Outcomes (SO):
SO 1 An environmentally sustainable agriculture, agri-food and agri-based products sector
AAFC supports an economically and environmentally sustainable agriculture, agri-food and agri-based products sector that ensures proper management of available natural resources and adaptability to changing environmental conditions. Addressing key environmental challenges in Canada, including agriculture's impact on water quality and water use, adaptation to the impact of climate change, mitigation of agriculture's greenhouse gas emissions and the exploration of new economic opportunities, will contribute to a cleaner environment and healthier living conditions for the Canadian public, while enabling the sector to become more profitable.
SO 2 A competitive agriculture, agri-food and agri-based products sector that proactively manages risk
Canada's capacity to produce, process and distribute safe, healthy, high-quality, and viable agriculture, agri-food and agri-based products is dependent on its ability to proactively manage and minimize risks and to expand domestic and global markets for the sector by meeting and exceeding consumer demands and expectations. Proactive risk management to ensure food safety, market development and responsiveness, and an improved regulatory environment contribute directly to the economic stability and prosperity of Canadian farmers and provide greater security for the Canadian public regarding the sector.
SO 3 An innovative agriculture, agri-food and agri-based products sector
Sector innovation includes the development and commercialization of value-added agricultural-based products, knowledge-based production systems, processes and technologies, and equipping the sector with improved business and management skills and strategies to capture opportunities and to manage change. Such innovation is vital for ongoing growth and improvement in the productivity, profitability, competitiveness, and sustainability of Canada's agriculture, agri-food and agri-based products sector and its rural communities.
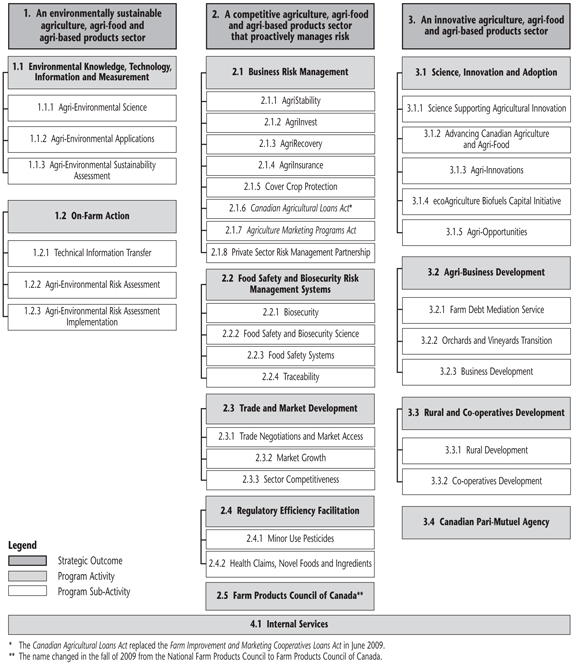
Program Activity Architecture
The graphic below displays AAFC's Program Activities and Program Sub-Activities that comprise its Program Activity Architecture (PAA). This PAA reflects how the Department allocates and manages its resources and makes progress toward its Strategic Outcomes.
Summary of Performance
| Planned Spending | Total Authorities | Actual Spending |
|---|---|---|
| 3,223.4 | 2,883.6 | 2,605.2 |
There is an overall reduction between planned spending and total authorities primarily as a result of a reduction in the requirement for Business Risk Management program funding due to a strong rise in crop receipts, mainly in the grains and oilseeds sector. Variances between total authorities and actual spending result from impacts of the global economic
downturn, the annual demand for multi-year program funding as well as timing of new program implementation. The majority of the unspent funding is expected to be carried forward for use in future years.
| Planned | Actual 1 | Difference 2 |
|---|---|---|
| 6,403 | 6,280 | (123) |
*Full-time Equivalents
1Full-Time Equivalents - reflect only those FTEs funded through the Department's appropriated resources. In addition to the actual FTEs of 6,280 there were 53 FTEs employed by AAFC for research funded through collaborative agreements with industry partners and 21 FTEs funded from other government departments. Also, 438 FTEs were employed as students.
2The overall departmental reduction of 123 FTEs is primarily a result of attrition and the transfer of the delivery of the AgriStability program from the federal government to British Columbia and Saskatchewan, which is an initiative under Canada's Economic Action Plan discussed in Section II.
| Performance against this Strategic Outcome is measured by a set of agri-environmental indices. These indices listed below measure agri-environmental performance progress in each of the four key areas of soil, water, air, and biodiversity. The scale for these indices is: 0-20 = Unacceptable; 21-40 = Poor; 41-60 = Average; 61-80 = Good; and 81-100 = Desired. A target of 81-100, with a stable (index value change +/- 2 or less) or improving trend, represents the desired value for the sector's performance. Indices are calculated on 5 year intervals coinciding with the Census of Agriculture and current results are based on 2006 data published in 2010 in Environmental Sustainability of Canadian Agriculture: Agri-Environmental Indicator Series, Report #3 (www.agr.gc.ca/NAHARP). Long term trends represent change in indices between 1981 and 2006; short term trend represents change between 2001 and 2006. | ||
| Performance Indicators | Targets | 2009-10 Performance |
|---|---|---|
| Soil Quality Agri-Environmental Performance Index | 81 by Mar 31, 2030 | The Soil Quality index was 77 (within the Good range) and showed an improving trend in both the long term (+11) and short term (+3). This is attributed to increased adoption of conservation and no-till practices, increased forage and permanent cover crops, and reduced use of summerfallow. |
| Water Quality Agri-Environmental Performance Index | 81 by Mar 31, 2030 | The Water Quality index was 78 (within the Good range) and showed a deteriorating trend in both the long term (-16) and short term (-7). This is due to an overall increase in supplemental nutrients as there was an increase in farmland under cultivation. Note: climatic conditions experienced during 2001 resulted in an improvement of performance in that year relative to 1996. Performance in 2006 was stable in relation to 1996. |
| Air Quality Agri-Environmental Performance Index | 81 by Mar 31, 2030 | The Air Quality index was 63 (within the Good range) and showed an improving trend in both the long term (+8) and short terms (+2). This is attributed to increased adoption of conservation and no-till practices, increased forage and permanent cover crops, and reduced use of summerfallow. |
|
Biodiversity Quality Agri-Environmental Index Note: Biodiversity Quality Agri-Environmental Index based on a single Agri-Environmental Indicator (Wildlife Habitat Capacity Change on Farmland) |
81 by Mar 31, 2030 | The Biodiversity index was 49 (within the Average range) on the Agri-Environmental Index, showing a stable trend (+1). (Trend in this case is between 1996 and 2006, the only years currently covered by this index.) |
| Program Activity | 2008-09 Actual Spending1 |
2009-10 | Alignment to Government of Canada Outcomes | |||
|---|---|---|---|---|---|---|
| Main Estimates2 |
Planned Spending3 |
Total Authorities4 |
Actual Spending5 |
|||
| Environmental Knowledge, Technology, Information and Measurement | 58.3 | 58.8 | 66.4 | 92.9 | A Clean and Healthy Environment | |
| On-Farm Action | 120.9 | 121.7 | 146.8 | 85.0 | ||
| Total for SO1 | 179.2 | 180.6 | 213.2 | 178.0 | ||
| Performance Indicators | Targets | 2009-10 Performance |
|---|---|---|
| Increase in agriculture and agri-food Gross Domestic Product (GDP)*, in constant dollars (2002 dollars)** | 10% by Mar 31, 2013 from 2009 baseline | This portion of the Agriculture and Agri-Food GDP* increased in 2009 to $43.8 billion from $42.5 billion. The food processing industry remained fairly stable at $23.7 billion. Primary agriculture’s contribution rose 6% to $20.1 billion or 1.7% of GDP in 2009. |
| *Consisting of Primary Agriculture and Food, Beverage and Tobacco Processing, including seafood processing, which are relevant to this Strategic Outcome. **When the indicator and target were developed in 2008, 1997 was the base year for deflating GDP and other indicators, which is reflected in the 2009-10 RPP. Since then, the base year was updated to 2002 as the baseline for deflating GDP. |
||
| Program Activity | 2008-09 Actual Spending1 |
2009-10 | Alignment to Government of Canada Outcomes | |||
|---|---|---|---|---|---|---|
| Main Estimates2 |
Planned Spending3 |
Total Authorities4 |
Actual Spending5 |
|||
| Business Risk Management | 1,534.6 | 2,088.3 | 1,558.6 | 1,508.2 | Strong Economic Growth | |
| Food Safety and Biosecurity Risk Management Systems | 140.5 | 140.6 | 126.2 | 98.1 | ||
| Trade and Market Development | 96.8 | 97.5 | 127.6 | 100.5 | ||
| Regulatory Efficiency Facilitation | 37.9 | 37.9 | 26.1 | 12.5 | ||
| Farm Products Council of Canada | 2.7 | 2.7 | 3.2 | 3.0 | ||
| Total for SO2 | 1,812.5 | 2,367.0 | 1,841.8 | 1,722.2 | ||
| Performance Indicators | Targets | 2009-10 Performance |
|---|---|---|
| Increase in agriculture Net Value-Added (Value-Added is a Statistics Canada measure of Canadian value-added GDP) |
7% by |
In making progress toward the four-year goal for this Program Activity, AAFC is meeting or exceeding its targets at the Program Sub Activity (PSA) and the Program Sub Sub Activity (PSSA) levels. Please see the Performance Analysis in Section II of this report for a description of progress at these lower levels. |
| Percentage increase in the development of food and other agriculture-derived products and services as measured by 1) revenues from bioproducts and private industry's Research and Development (R&D) expenditures in the agri-food sector as measured by the food processing and bioproducts sectors and 2) percentage increase in private industry's R&D expenditures in the agri-food sector as measured by the food processing and bioproducts sectors (Percentage reflects a real increase, after adjustments for inflation) |
10% by |
In making progress toward the four-year goal for this Program Activity, AAFC is meeting or exceeding its targets at the PSA and PSSA levels. Please see the Performance Analysis in Section II of this report for a description of progress at these lower levels. |
| Program Activity | 2008-09 Actual Spending1 |
2009-10 | Alignment to Government of Canada Outcomes | |||
|---|---|---|---|---|---|---|
| Main Estimates2 |
Planned Spending3 |
Total Authorities4 |
Actual Spending5 |
|||
| Science, Innovation and Adoption | 316.1 | 322.3 | 354.9 | 275.7 | An Innovative and Knowledge-Based Economy | |
| Agri-Business Development | 38.8 | 45.0 | 81.4 | 48.6 | ||
| Rural and Co-operatives Development | 20.8 | 21.0 | 24.9 | 22.0 | ||
| Canadian Pari-Mutuel Agency | (0.0) | (0.0) | 4.9 | 0.7 | A Fair and Secure Marketplace | |
| Total for SO3 | 375.7 | 388.3 | 466.2 | 347.0 | ||
($ millions - net)
| Program Activity | 2008-09 Actual Spending1 |
2009-10 | |||
|---|---|---|---|---|---|
| Main Estimates2 |
Planned Spending3 |
Total Authorities4 |
Actual Spending5 |
||
| Internal Services | 282.1 | 287.6 | 362.4 | 357.9 | |
| Total for PA 4.1 | 282.1 | 287.6 | 362.4 | 357.9 | |
($ millions - net)
| 2008-09 Actual Spending1 |
2009-10 | ||||
|---|---|---|---|---|---|
| Main Estimates2 |
Planned Spending3 |
Total Authorities4 |
Actual Spending5 |
||
| Sub-total Planned Spending (net) | 2,585.7 | 2,649.6 | 3,223.4 | 2,883.6 | 2,605.2 |
| Less: Non-respendable revenue | 58.4 | N/A | 34.4 | N/A | 53.6 |
| Plus: Cost of services received without charge 6 | 57.7 | N/A | 54.9 | N/A | 65.2 |
| Total for Departmental Spending | 2,585.0 | N/A | 3,243.9 | N/A | 2,616.9 |
1 Refer to AAFC's previous DPRs for detailed financial information for 2008-09. Historical comparison by Program Activity is not possible as AAFC's 2008-09 actual expenditures
are not available by the current Program Activity structure since the financial coding for that year does not allow a crosswalk of the data between the former and current Program Activities. Further affecting the comparability of actual expenditures with previous years, by Program Activity, is the treatment of the Internal Services Program Activity. Commencing in the 2009-10 Estimates
cycle, resources for Internal Services are displayed separately from other Program Activities, and no longer distributed among the remaining Program Activities, as was the case in previous years' Estimates. For an explanation of the variances for total departmental spending, please refer to the Expenditure Profile subsection of this report.
2 Main Estimates figures are as reported in the 2009-10 Main Estimates.
3 Planned spending figures are as reported in the 2009-10 Report on Plans and Priorities, however, the table identifies the Non-Respendable revenue portion of planned spending separately as opposed to including it within each Program Activity amount. Planned spending reflects funds already brought into the Department's reference levels as well as amounts to
be authorized through the Estimates process as presented in the Annual Reference Level Update. It also includes adjustments totalling $573.8 million for funding approved in the government fiscal plan, but not yet to be brought into the Department's reference levels.
4 Total authorities are 2009-10 Main Estimates plus a net total of $234.0 million in adjustments comprised of: Supplementary Estimates and Allotment transfers received during the 2009-10 fiscal year, as well as adjustments to statutory amounts to equal actual spending, internal adjustments and transfers, as reported in the 2009-10 Public Accounts.
5 Actual spending figures represent the actual expenditures incurred during the 2009-10 fiscal year, as reported in the 2009-10 Public Accounts. In certain cases, where authorized amounts are unspent, they can be reprofiled for use in future years.
6 Cost of services received without charge includes accommodation provided by Public Works and Government Services Canada, the employer's share of employees' insurance premiums and expenditures paid by Treasury Board Secretariat (excluding revolving funds), Workers' Compensation coverage provided by Human Resources and Skills Development Canada, and
services provided by Justice Canada.
The figures in the above tables have been rounded. Due to rounding, figures may not add to the totals shown.
Contribution of Priorities to Strategic Outcomes
Competitiveness, innovation and adaptation are key elements to ensuring the agriculture, agri-food and agri-based products sector's long-term profitability. These elements were reflected in AAFC's priorities in 2009-10 that focused on enabling producers and enterprises to achieve a sustainable competitive advantage.
AAFC helped the sector identify and respond to emerging trends ahead of Canada's competitors, and provided the tools necessary to enable the sector to achieve lower costs and penetrate higher-value markets. The Department also provided investments in: food safety systems, biosecurity and traceability to protect Canadians from food safety-related incidents and ensure that trading partners have confidence in Canadian products; business and skills development to ensure that agri-businesses have the tools they need to compete; and scientific research to support better government-industry cooperation in developing new and leading edge products and processes.
In 2009-10, AAFC worked with provincial and territorial governments to implement fully the Growing Forward policy framework. This includes a comprehensive suite of Business Risk Management (BRM) programs and non-BRM programs that support sector competitiveness through innovation, business development, environmental performance, regulatory reform, international market development, and systems for food safety, biosecurity, and traceability. While the BRM program suite was launched April 1, 2008, other Growing Forward programs began rolling out April 1, 2009. Non-BRM programs are either delivered and funded federally, or are based on a cost-shared arrangement and predominantly delivered by provinces and territories.
In addition to the Growing Forward work under way, AAFC implemented in 2009-10 important initiatives under Canada's Economic Action Plan (EAP) to help the sector and Canada's economy recover from the global economic downturn. Further information on EAP initiatives is provided in Section II of this report.
Additional information on the Department's operational priorities is provided in the following table.
| Operational Priorities | Type | Status | Linkages to Strategic Outcomes |
|---|---|---|---|
|
Delivering on Growing Forward Growing Forward is the key framework agreement governing federal, provincial and territorial agriculture programs in Canada. It is designed to help ensure a competitive and innovative agriculture and agri-food sector that responds to society's priorities while proactively managing risks. By implementing programming in a range of areas, the five-year Growing Forward agreement allows federal, provincial and territorial governments to work in partnership towards common objectives. |
Ongoing |
Met: Growing Forward includes a suite of BRM and non-BRM programs to improve sector competitiveness with a focus on innovation, business development, the environment, regulatory improvements, international markets and food safety, biosecurity and traceability. Negotiations on bilateral agreements were completed in each province and territory, and the majority of federal and cost-shared non-BRM programs were launched. |
Directly supports all of AAFC's Strategic Outcomes: Growing Forward innovation programs fall primarily under Program Activity (PA) 3.1, Science, Innovation and Adoption. They accelerate the pace of innovation in the sector by providing support all along the innovation continuum - from discovery through marketplace. Progress towards a competitive sector was achieved through the work done under PA 2.3, Trade Market and Development. |
|
Delivering on other A competitive agriculture and agri-food sector is important to the federal government. As such a number of key initiatives will complement Growing Forward in improving the competitiveness of the sector. |
Ongoing |
Met: Over 2009-10, AAFC supported sector competitiveness through ongoing investments in science and research to ensure that the sector has greater capacity to bring innovative products to market. AAFC will continue to put farmers first by exploring new and innovative ways to promote Canadian agricultural and agri-food products at home and abroad. AAFC supported the renewable fuels sector in Canada through the growth of ethanol and biodiesel use, and supporting farmer participation in the evolution of this sector. |
Directly supports all of AAFC's Strategic Outcomes: For investments in science, AAFC continues to focus on the seven priorities identified in its Science and Innovation Strategy, which support each of its strategic outcomes. With significantly increased competitiveness in the international marketplace, efforts to diversify and to expand markets through initiatives and programs, such as bilateral and regional free-trade agreements, market access, research capacity, advocacy, resolution of trade disputes, and export promotion, are vital. The ecoAgriculture Biofuels Capital Initiative (ecoABC) program directly supports PA 3.1, Science, Innovation and Adoption. It is increasing farmer participation in the biofuels industry and contributing to the government's biofuels content target in transportation fuels. ecoABC works in coordination with Natural Resources Canada's ecoEnergy program. |
AAFC's management priority of delivering on management excellence supported achieving its strategic outcomes. During 2009-10, the Department continued to support government-wide priorities for public service renewal. It also applied a flexible, client-focussed approach to service delivery. In addition, it strengthened management and accountability and took steps to improve management practices. Additional information on the Department's Management Priorities is provided in the following table.
| Management Priorities | Type | Status | Linkages to Strategic Outcomes |
|---|---|---|---|
|
Delivering on management excellence AAFC was committed to delivering on management excellence to implement Growing Forward and other programs efficiently and effectively to best achieve results for Canadians. |
Ongoing |
Met: People Management Integrated planning helped AAFC set people management priorities and strategies to support business objectives. Its efforts to advance the Public Service renewal agenda were rated strong by Treasury Board Secretariat (TBS) in the 2009-10 Management Accountability Framework (MAF) assessment. Service Delivery Experience in co-ordinating Growing Forward programs and cost-shared activities was used to ensure efficient delivery of new policy and programs, including cost-shared components of the Agricultural Flexibility Fund (AgriFlexibility). |
Supports all of AAFC's Strategic Outcomes: Sound management practices, processes and systems, particularly in the areas of human resources and service delivery, were essential to AAFC's ability to deliver its programs and services and achieve its Strategic Outcomes efficiently and effectively. |
With regard to the MAF assessment for 2009-10, observations by TBS related to AAFC's management capacity were very positive. In total, for the 12 Areas of Management against which AAFC was assessed, the Department received five Strong ratings and seven Acceptable ratings. TBS also observed that, during the 2009-10 MAF period, AAFC continued to deliver a high level of policy and program activity, specifically, the implementation of new Growing Forward non-BRM programs and Budget 2009 (Canada's Economic Action Plan) initiatives, including the five-year, $500 million Agricultural Flexibility Fund (AgriFlexibility). TBS noted that, "overall, the Department has been performing under a heavy workload, while maintaining focus on its management priorities."
Risk Analysis
Canada has a diverse and innovative agriculture, agri-food and agri-based product sector that continually adapts to an uncertain economic environment, business risks, and evolving consumer demands. Over 2009-10, AAFC delivered Growing Forward initiatives to help manage risks facing Canadian producers. These included environmental programs to safeguard and enhance the resource base, as well as to help farmers better manage environmental risks on individual operations. The current suite of BRM programs provided farmers with the stability required to effectively manage their operations. Growing Forward investments in support of innovation helped to build longer-term approaches to mitigating risks.
While significant progress was made in 2009-10 to provide stability for the sector, several risk factors remain that could affect Canada's competitive position over the coming years. These challenges include: volatility in the value of the Canadian dollar; upward cost pressures for inputs including feed, fertilizer, fuel and energy; continued international competition from lower-cost producers of bulk commodities; evolving consumer demands for healthy and environmentally sustainable food; emergence of global retailers with private certification standards; and regulatory barriers to accessing some export markets.
To provide relevant and effective support to the sector in light of these challenges, AAFC adapted its tools and services through 2009-10 as needed. This included responding to extraordinary challenges, such as those facing Canada's hog sector (a strong Canadian currency, record-high feed prices, circo-virus disease, rising energy costs and low pork prices around the world, along with the outbreak of the H1N1 influenza in the spring of 2009 resulted in continuing depressed hog prices), as well as working to ensure access to existing markets and to gain access to new ones for Canadian producers, processors and retailers. AAFC worked with its portfolio partners, other federal departments, and provincial and territorial governments to address broader challenges that impact the competitiveness and prosperity of the sector.
AAFC identifies key internal and external risks and opportunities to inform priority-setting and integrated business planning. As a result, risk-based resource allocation and risk mitigation strategies are implemented to decrease risks and foster the pursuit of opportunities in support of the achievement of the departmental strategic outcomes.
AAFC updates its Corporate Risk Profile and monitors mitigation activities regularly to address the highest-level risks that could impede achievement of departmental strategic outcomes. The following chart provides descriptions of significant risks identified in the 2008-10 Corporate Risk Profile, and summarizes the status of those risks and progress on corresponding mitigation strategies. In 2009-10, key risks were sufficiently mitigated to avoid impacts on the achievement of results.
| Risk* | Status of Risk and Mitigation Strategies |
|---|---|
|
Catastrophic Crisis A large-scale event could present a severe risk to the sector and/or Canadians at large. |
Mitigation activities advanced effectively. H1N1 influenza was a catalyst to accelerate provincial engagement and industry pandemic planning activities. AAFC met regularly with its federal partners, industry stakeholders, and provincial counterparts; activities are co-ordinated across the agri-food portfolio to ensure that all agencies are involved in emergency management for the sector. |
|
Information Management Compromised information, information management, or information systems could hinder the Department's ability to make effective policy and program decisions, and subsequently affect reporting. |
Mitigation activities advanced satisfactorily. Accomplishments included:
|
|
Program Delivery Managing complex programs in a shared jurisdiction such as agriculture, with a multiplicity of service delivery points and multiple responsibility centres, presents challenges to AAFC in maintaining consistent service standards and uniform access to programming. |
Significant progress in this area was made. Key mitigation work undertaken included:
|
|
Infrastructure Aging infrastructure and assets could impair AAFC's significant moveable assets and physical infrastructure holdings, impeding achievement of strategic outcomes. |
Mitigation activities have progressed effectively. AAFC is a large custodian of buildings; 2,360 buildings, 972,879 hectares of land and equipment. It has 19 major research centres, 37 research stations and 33 dams. The challenge of managing aging assets while investing in new infrastructure within available resources continues. To address this, infrastructure investments focus on safety, security and operational and regulatory compliance deficiencies in existing major capital assets, and meeting essential information management and technology requirements, while investing in new facilities or major upgrades that help achieve its goals. In this regard, under Canada's Economic Action Plan, AAFC received $25.9 million in funding to implement eight modernization projects in laboratories across the country in 2009-10 and 2010-11. One project was completed in the reporting period, and the remainder are on time and budget. |
|
People Work Environment AAFC's capacity to maintain a talented, principled and representative workforce in an environment that is fair, ethical, supportive, and safe could impact on strategic outcomes. |
AAFC's integrated business-human resource planning process is well-established. AAFC continued to advance its continuous learning policy and integrate the principles of diversity. The Department also invested in data management tools, service and systems to simplify HR processes. |
|
Systems/Technology Sufficiency Evolving business priorities and processes may not be adequately supported if applications investments are not made in a strategic manner. |
Mitigation activities have progressed effectively. The integrated business-information technology (IT) planning process supported strategic business outcomes. Successes include the Service Excellence initiative that will be used as an enterprise standard for Information Management and IT project delivery. Substantial progress has also been made with the consolidation of IT infrastructure in the National Capital Region. |
*Shown in order of priority from highest to lowest.
Work in 2009-10 set the stage for further progress in 2010-11 on a risk-smart management culture, including risk training to support organization-wide approaches to managing risks and opportunities.
Expenditure Profile
AAFC departmental spending varies from year to year in response to the circumstances in the agriculture, agri-food and agri-based products sector in any given period. Programming within AAFC is in direct response to industry and economic factors which necessitate support to this vital part of the economy. Much of AAFC's programming is statutory (i.e. for programs approved by Parliament through enabling legislation) and the associated payments fluctuate according to the demands and requirements of the sector.
Canada's Economic Action Plan
AAFC's spending plans were augmented through initiatives under Canada's Economic Action Plan (EAP) that recognize the industry as a significant contributor to the Canadian economy. Almost $94 million in EAP funding was provided to AAFC in 2009-10 to support the capture of new market opportunities, to enhance processing of food domestically, to help farmers manage costs, to improve program delivery to farmers, and to support infrastructure.
Progress has been achieved on the EAP initiatives in support of Canada's farm and agricultural businesses. In implementing these investments, AAFC has ensured that they are complementary to Growing Forward programs. Detailed information regarding EAP initiatives can be found in Section II.
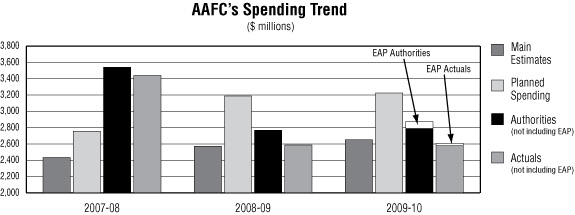
Departmental Spending Trend
The figure below illustrates AAFC's trend in Main Estimates, planned spending, authorities and actual spending from 2007-08 to 2009-10.
Notes:
1 Main Estimates figures are as reported in the Main Estimates for each respective year.
2Planned spending reflects funds already brought into the Department's reference levels as well as funding approved in the government fiscal plan, but yet to be brought into the Department's reference levels, at the time of the respective Report on Plans and Priorities. Planned spending did not reflect Budget 2007, 2008 or 2009 information (such as
Strategic Review efficiency savings as well as new funding for AgriFlexibility and the Slaughter Improvement Program in Budget 2009). These adjustments were subsequently made and reflected in total authorities.
3 Total authorities reflect Main Estimates plus adjustments comprised of: Supplementary Estimates and allotment transfers, adjustments to statutory amounts to equal actual spending, and internal adjustments and transfers, as reported in Public Accounts.
4 Actual spending represents the actual expenditures incurred during each respective fiscal year, as reported in Public Accounts. In certain cases where authorized amounts are unspent, they can be reprofiled for use in future years.
5 Main Estimates, planned spending, total authorities and total actuals all exclude services received without charge.
Over the three-year period 2007-08 to 2009-10, actual, planned and authorized spending varied from a low of $2.6 billion in 2008-09 to a high of $3.5 billion in 2007-08.
AAFC's total authorities and total actuals in 2007-08 were relatively higher than other years primarily as a result of the Budget 2007 funding of $1 billion for the Cost of Production and AgriInvest Kickstart programs (one-year programs).
Following the delivery of these one-year programs in 2007-08, authorities and actual spending for 2008-09 and 2009-10 returned to levels generally required to support the industry. In addition, they reflect a reduction in the requirement for Business Risk Management program funding as a result of a strong rise in crop receipts, mainly in the grains and oilseeds sector, over 2007.
The authorities in 2009-10 included funding provided to the pork industry to support an orderly transition of this sector in view of new market challenges, as well as investments under Canada's Economic Action Plan to assist in the recovery from the global economic recession. They also reflect reductions due to Strategic Review efficiency savings.
Actual spending for 2009-10 is lower than authorities as the result of several factors including the timing of the start-up of some programs. However, the majority of the unspent funding is expected to be carried forward for use in future years.
| Vote # or Statutory Item (S) | Truncated Vote or Statutory Wording | 2007-08 Actual Spending |
2008-09 Actual Spending |
2009-10 Main Estimates1 |
2009-10 Actual Spending2 |
|---|---|---|---|---|---|
| 1 | Operating Expenditures | 683.8 | 694.5 | 657.9 | 715.3 |
| 5 | Capital Expenditures | 32.5 | 30.3 | 34.0 | 56.6 |
| 10 | Grants and Contributions | 614.0 | 590.4 | 417.0 | 292.7 |
| 15 | Pursuant to Section 29 of the Financial Administration Act, to authorize the Minister of Agriculture and Agri-Food, on behalf of Her Majesty in right of Canada, in accordance with terms and conditions approved by the Minister of Finance, to guarantee payments of an amount not exceeding, at any one time, in aggregate, the sum of $1,500,000,000 payable in respect of cash advances provided by producer organizations, the Canadian Wheat Board and other lenders under the Spring Credit Advance Program and $1,500,000,000 payable in respect of cash advances provided by producer organizations, the Canadian Wheat Board and other lenders under the Enhanced Spring Credit Advance Program. | - | - | 0.0 | - |
| 20 | Pursuant to Section 29 of the Financial Administration Act, to authorize the Minister of Agriculture and Agri-Food, on behalf of Her Majesty in Right of Canada, in accordance with terms and conditions approved by the Minister of Finance, to guarantee payments of amounts not exceeding, at any time, in aggregate, the sum of $140,000,000 payable in respect of Line of Credit Agreements to be entered into by the Farm Credit Canada for the purpose of the renewed (2003) National Biomass Ethanol Program. | - | - | 0.0 | - |
| 22 | Canadian Pari-Mutuel Agency - program expenditures | - | - | - | 0.5 |
| (S) | Contributions payments for the AgriInsurance Program | - | 548.3 | 440.6 | 502.9 |
| (S) | Contribution payments for the AgriStability Program | - | 340.5 | 369.2 | 419.5 |
| (S) | Contributions in support of the Assistance to the Pork Industry Initiative | - | - | - | 285.8 |
| (S) | Grant payments for the AgriInvest Program | 165.6 | 175.7 | 139.4 | 113.6 |
| (S) | Grant payments for the AgriStability Program | - | - | 225.1 | 105.2 |
| (S) | Contributions to employee benefit plans | 74.7 | 74.9 | 63.7 | 82.5 |
| (S) | Payments in connection with the Agricultural Marketing Programs Act | 44.1 | 37.0 | 165.0 | 28.5 |
| (S) | Contribution payments for the AgriInvest Program | 1.7 | 17.7 | 20.1 | 26.7 |
| (S) | Canadian Cattlemen's Association Legacy Fund | 7.0 | 7.0 | 5.0 | 10.0 |
| (S) | Spending of proceeds from the disposal of surplus Crown assets | 3.5 | 4.0 | - | 3.6 |
| (S) | Grant payments for the Agricultural Disaster Relief Program - AgriRecovery | 0.1 | 1.0 | 54.2 | 3.2 |
| (S) | Loan guarantees under the Canadian Agriculture Loans Act - CALA (formerly called Farm Improvement and Marketing Cooperatives Loans Act - FIMCLA) | 0.7 | 0.0 | 4.0 | 2.0 |
| (S) | Canadian Pari-Mutuel Agency revolving fund | (0.9) | (0.8) | (0.0) | 0.2 |
| (S) | Minister of Agriculture and Agri-Food - salary and motor car allowance | 0.1 | 0.1 | 0.1 | 0.1 |
| (S) | Refunds of amounts credited to revenues in previous years | 0.0 | 0.0 | - | 0.0 |
| (S) | Collection agency fees | 0.0 | 0.0 | - | 0.0 |
| (S) | Class grant payments for the Farm Income Payment | (1.0) | (0.3) | - | (0.0) |
| (S) | Class grant payments for the Transitional Industry Support Program | (0.2) | (0.3) | - | (0.0) |
| (S) | Contributions in support of the Grain and Oilseed Payment Program | - | - | - | (0.1) |
| (S) | Grant payments for the Canadian Agricultural Income Stabilization Program Inventory Transition Initiative | (0.7) | 8.4 | - | (0.1) |
| (S) | Grants in support of the Grain and Oilseed Payment Program | (0.0) | (2.1) | - | (0.3) |
| (S) | Contributions in support of Business Risk Management Programs under the Agricultural Policy Framework province-based programs | (0.0) | (6.9) | - | (0.3) |
| (S) | Grants in support of the Cost of Production Benefit | 353.5 | 8.7 | - | (1.3) |
| (S) | Contributions for agricultural risk management Spring Credit Advance Program Business Risk Management | 8.9 | (1.9) | - | (2.1) |
| (S) | Contribution payments for the Agricultural Disaster Relief Program / AgriRecovery | - | 55.4 | 54.2 | (9.1) |
| (S) | Grant payments for the AgriInvest Kickstart Program | 484.4 | (9.1) | - | (12.5) |
| (S) | Grants in support of the Cull Breeding Swine Program | 38.0 | 12.0 | - | (17.9) |
| (S) | Contributions payments for the Canadian Agricultural Income Stabilization Program Inventory Transition Initiative | - | 3.7 | - | - |
| (S) | Contributions in Support of Business Risk Management Programs under the Agricultural Policy Framework - Agriculture Policy Initiatives | 4.7 | 0.0 | - | - |
| (S) | Grants to agencies established under the Farm Products Agencies Act | - | - | 0.2 | - |
| (S) | Contributions in support of Business Risk Management Programs under the Agricultural Policy Framework - Production Insurance | 416.4 | - | - | - |
| (S) | Contributions in support of Business Risk Management Programs under the Agricultural Policy Framework - Canadian Agricultural Income Stabilization Program | 377.3 | - | - | - |
| (S) | Contribution payments for the AgriInvest Kickstart Program | 95.8 | - | - | - |
| (S) | Grant payments for the drought assistance package for livestock producers | 4.4 | - | - | - |
| (S) | Grant payments for the Golden Nematode Disaster Program | 0.5 | - | - | - |
| (S) | Contributions in support of the Cost of Production Benefit | 44.7 | (0.0) | - | - |
| (S) | Contributions to a transition to future risk management programming | (0.3) | (0.0) | - | - |
| (S) | Class contribution payments for repositioning of the Canadian beef and cattle industry | (8.9) | (0.0) | - | - |
| (S) | Class contribution payments for the Transitional Industry Support Program | (0.1) | (0.1) | - | - |
| (S) | Class contribution payments for the Farm Income Payment | (4.7) | (0.2) | - | - |
| (S) | Bovine Spongiform Encephalopathy Recovery Program | (1.0) | (2.1) | - | - |
| Total Department | 3,438.8 | 2,585.7 | 2,649.6 | 2,605.2 | |
1 Main Estimates figures are as reported in the 2009-10 Main Estimates.
2 Actual figures represent the actual expenditures incurred during the 2009-10 fiscal year, as reported in the 2009-10 Public Accounts. In certain cases, where authorized amounts are unspent, they can be reprofiled for use in future years.
The figures have been rounded. Figures that cannot be listed in millions of dollars are shown as 0.0. Due to rounding, figures may not add to the totals shown.