
Treasury Board of Canada Secretariat
www.tbs-sct.gc.ca
Common menu bar links
Breadcrumb Trail
ARCHIVED - Human Resources and Social Development Canada
 This page has been archived.
Archived Content
Information identified as archived on the Web is for reference, research or recordkeeping purposes. It has not been altered or updated after the date of archiving. Web pages that are archived on the Web are not subject to the Government of Canada Web Standards. As per the Communications Policy of the Government of Canada, you can request alternate formats on the "Contact Us" page.
Erratum
The following table indicates where the revisions should be noted in the initial print version of the 2008-2009 HRSDC Departmental Performance Report.
| Location: Page 3 - Table of contents, title for Section 1.4. Revision: "Corporate Risk Analysis" replaces "Corporate Risk Profile" Rationale for revision: The table of contents did not reflect the proper title for section 1.4. |
| Location: Page 15 - Section 1.4, Corporate Risk Analysis, second paragraph, last sentence. Revision: "Furthermore, HRSDC launched a risk management intranet site…" replaces "Furthermore, HRSDC launched a risk management website…" Rationale for revision: The Department needed to clarify that the risk management homepage is not an external site. |
| Location: Page 20 - Section 1.5, Workplace Skills Performance Indicator, third indicator, the data source. Revision: "Survey of Labour and Income Dynamics" replaces "Survey of Labour and Income" Rationale for revision: The data source was incorrectly cited. |
| Location: Page 56 - Section 2.2.3, Strategic Outcome 2, Learning Program, Performance Analysis, second paragraph. Revision: "In 2008-2009, the Department invested $2.0 billion in loans and $143.2 million in 86,000 Canada Study Grants and Canada Access Grants, compared to investments of 1.9 billion in loans and 127.9 million in 75,300 grants in the year 2005-2006." replaces "In 2008-2009, the Department invested $2.0 billion in loans and $143.2 million in 86,000 Canada Study Grants and Canada Access Grants, compared to investments of 1.6 billion in loans and 64.5 million in 53,404 grants in the year 2005-2006" Rationale for revision: The initial figures cited were from the year 2004-2005 instead of 2005-2006. |
| Location: Page 59 - Strategic Outcome 3, Program Activity Description, last sentence. Revision: "Operating Expenditures for this program activity are funded from the Departmental Reference Levels" replaces "Operating Expenditures for this program activity are funded from the Departmental Reference" Rationale for revision: The funding source was incorrectly cited. |
| Location: Page 63 - Labour Performance Summary, first paragraph of the performance summary, last sentence. Revision: "However, the domestic contribution stream for social dialogue projects in Canada has had a lower take-up than expected" replaces "However, the domestic contribution stream for social dialogue projects in Canada has had a lower than expected" Rationale for revision: The addition of the word "take-up" clarifies the sentence. |
Message from the Minister of Human Resources and Skills Development

I am pleased to present the 2008-2009 Departmental Performance Report for Human Resources and Skills Development Canada. This year's Report underlines the impact of the global economic downturn on the Canadian economy and provides details on the measures put in place to help Canadian workers and their families.
Our Government is commited to helping Canadians who are out of work get back on their feet and find good jobs. That is why, through Canada's Economic Action Plan, we increased our investment in skills development to assist Canadians, in all regions of the country. We are providing an additional $1.5 billion to provinces and territories through existing agreements to ensure an estimated 150,000 Canadians receive training that will help them develop the skills to find jobs in the new economy. Through, Career Transition Assistance, we will help some 40,000 laid-off long tenured workers upgrade their skills to get a new job.
We're investing in Canadians of all ages and work experiences. That's why we increased our support to older workers by providing an additional $60 million over three years for the Targeted Initiative for Older Workers. We also made a $75 million investment to help newcomers get their credentials recognized faster and improve their integration into the labour market; and invested an additional $100 million over three years in the Aboriginal Skills and Employment Partnership to help Aboriginal Canadians find long-term employment.
We want to help students gain valuable experience and earn money for school. That's why we're helping out Canadian youth by increased funding of $20 million for the Canada Summer Jobs Program and a $15 million grant to the YMCA and YWCA for student work experience. We're also encouraging incentives for workers to complete their apprenticeship training in a Red Seal trade.
What's more is that we made post-secondary education more accessible by making important enhancements to the Canada Student Loans Program which will provide more upfront, non-repayable money to students and repayment assistance measures that are more responsive and fair. The grants alone will benefit over 245,000 students - that's 100,000 student's more than the previous program.
During the past year, we continued to support children, families and vulnerable Canadians seeking to improve their lives. For the third year in a row, we continue to help parents and families through the Universal Child Care Benefit. We are helping eligible people with severe disabilities, their families and others save for their long-term financial security by implementing the Registered Disability Savings Plan. In addition to supporting seniors through programs such as the Canadian Pension Plan, Old Age Security, and the Guaranteed Income Supplement, we helped promote the prevention of elder abuse through the New Horizons for Seniors Program. We also extended funding for the Homelessness Partnership Strategy to help homeless Canadians address their housing needs.
Service Canada plays an important role across the country in helping Canadians access the full range of government programs, services and benefits faster and easier. That's why we made significant efforts and investments to process increasing EI claims in a timely manner. This included improved automation of claim processing, hiring more staff, and increasing our hours of operations, where needed most.
Together, our Department's policies, programs and services are helping Canadians access the tools and supports they need to build a better, more secure and prosperous future for themselves and their families.
_______________________________________________
The Honourable Diane Finley, P.C., M.P.
Minister of Human Resources and Skills Development
Message from the Minister of Labour

Through the Labour Program, our government promotes safe, fair and productive workplaces and cooperative work relations across Canada by developing and implementing policies, programs and services in all sectors of the federal jurisdiction. By providing Canadian employers, workers and unions with the tools and resources they need, we are building a stronger and more competitive country.
The 2008-2009 Departmental Performance Report summarizes our recent efforts, put forth through the Labour Program, and highlights major accomplishments from the past year.
One such accomplishment was the resolution of 96.3% of all collective bargaining disputes without a work stoppage, thanks in large part to our mediation and conciliation services. In addition, our government launched the modernisation of Part III of the Canada Labour Code. The consultation process will allow us to gather the views of businesses, unions and employees regarding existing labour standards. The collected input will inform options for improving and updating the Code.
The design and implementation of the Wage Earner Protection Program (WEPP), which is a national program that reimburses eligible Canadian workers when their employer declares bankruptcy or becomes subject to receivership, was completed in 2008-2009. Through Canada�s Economic Action Plan, our government expanded the original legislation, which covered unpaid wages and vacation pay, to include termination and severance pay. The first payments to Canadians were processed in September 2008.
Promoting and protecting the success of Canadian businesses, the safety of Canadian workplaces and the well-being of Canadian employees are top priorities for our government, especially at this time of global economic difficulty. Through the Labour Program, we will continue to support Canada�s employers and workers and to foster safe workplaces and productive work relations to ensure the success of our economy now and in the future.
___________________________________________________
The Honourable Rona Ambrose, P.C., M.P.
Minister of Labour
Section I
Departmental Overview
1.1 Introduction: Raison d'�tre and Responsibilities
This document provides an account of the performance of Human Resources and Skills Development Canada (HRSDC) for the period from April 1, 2008 to March 31, 2009. It reports on the Department's achievements related to the commitments set out in the 2008-2009 Report on Plans and Priorities.
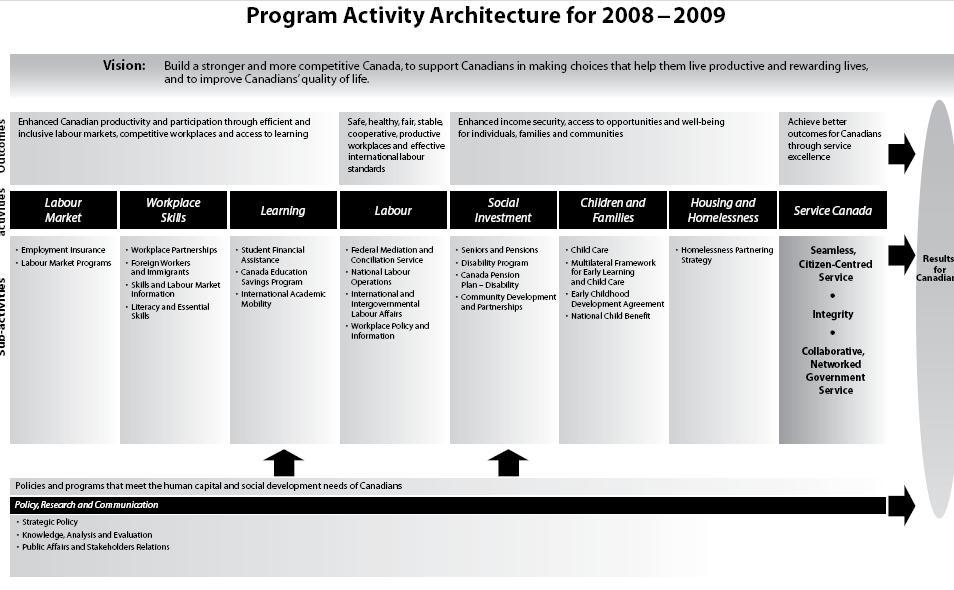
Section I is an overview designed to provide high-level information on the Department including the HRSDC, Service Canada and Labour Program missions. It includes the Program Activity Architecture; a description of the socio-economic environment; the corporate risk profile; a performance summary table; an outline of the contribution of priorities to strategic outcomes, including the Department's human resources and official languages indicators; the Department's expenditure profile; and its voted and statutory items. Section II includes detailed performance results by strategic outcome. Section III provides financial tables, a financial performance overview, information concerning specified purpose accounts, and consolidated financial statements for the Department. Section IV includes organizational information and website references.
Raison d'�tre
HRSDC's mission is to build a stronger and more competitive Canada, to support Canadians in making choices that help them live productive and rewarding lives, and to improve Canadians' quality of life.
To do this, HRSDC:
- develops policies that make Canada a society in which all Canadians can use their talents, skills and resources to participate in learning, work and their communities;
- creates programs and supports initiatives that help Canadians move through life's transitions � from families with children to seniors, from school to work, from one job to another, from unemployment to employment, from the workforce to retirement; and
- creates better outcomes for Canadians by providing service excellence through Service Canada and other partners.
The mission of the federal Labour Program is to ensure safe, fair, and productive workplaces and cooperative workplace relations, as well as effective international labour and employment standard.
To do this, the Labour Program:
- administers and enforces workplace legislation and regulations, such as health and safety standards; employment standards; and industrial relations under the Canada Labour Code; the Employment Equity Act, which promotes workplace equality by removing the barriers that women, Aboriginal peoples, people with disabilities and visible minorities face on the job and provided fire protection services in federal buildings and on reserves; administers the Government Employees' Compensation Act; and provides oversight of the Wage Earner Protection Program;
- develops innovative policy and program responses to changes in workplaces and employer-employee relations and carries out research and disseminates information and analysis on workplace, industrial relations, and labour law trends; and
- works closely with provincial and territorial governments, unions, employers, and international partners to enhance working conditions and ensure healthy and fair workplaces for all Canadians.
Human Resources and Skills Development Canada's programs and services are designed to achieve results across a broad range of social and labour market outcomes. Five strategic outcomes form the structure for reporting plans, priorities and resources in this report:
"Policies and programs that meet the human capital and social development needs of Canadians."
"Enhanced Canadian productivity and participation through efficient and inclusive labour markets, competitive workplaces, and access to learning."
"Safe, healthy, fair, stable, cooperative, productive workplaces and effective international labour standards."
"Enhanced income security, access to opportunities, and well-being for individuals, families and communities."
"Achieve better outcomes for Canadians through service excellence."
Responsibilities
Human Resources and Skills Development Canada is responsible for administering several Government of Canada laws under the following mandates:
- Improve the standard of living and quality of life of all Canadians by promoting a highly skilled and mobile labour force, and an efficient and inclusive labour market. The Minister of Human Resources and Skills Development has overall responsibility for the employment insurance program and the Employment Insurance Act, while the administration of that Act is the responsibility of the Canada Employment Insurance Commission.
- Promote social well-being and security. This includes the administration of the Canada Pension Plan, the Old Age Security Act, the Disability Savings Program and the Universal Child Care Benefit Act.
Furthermore, the Department of Human Resources and Skills Development Act provides for the appointment of a Minister of Labour who is responsible for the Canada Labour Code, the Employment Equity Act and the Government Employees Compensation Act, as well as other legislation on wages and working conditions. The mandate of the Minister of Labour is to promote safe, healthy, fair, stable, cooperative and productive workplaces.
The mandate of Service Canada is to work with federal departments, other orders of government and community service providers to bring services and benefits together in a single service delivery network to better serve Canadians.
The Human Resources and Skills Development Canada portfolio also includes the Policy Research Initiative, which leads horizontal research projects in support of the Government of Canada's medium-term policy agenda and identifies needs and priorities for future policy development
1.3 Socio-Economic Year in Review
The year 2008-2009 marked a significant shift in the economic conditions that characterized the Canadian economy and labour market. At the beginning of the year, the Canadian economy and labour market were defined by strong job creation, fiscal government surpluses largely due to high commodity prices, and strong domestic demand led by business investment and consumer spending on goods and services. In the summer of 2008, the Canadian economy hit the peak of 16 consecutive years of expanding economic growth. The economic fundamentals were considered strong, the unemployment rate was at its lowest level in 33 years, business and household finances were deemed robust by historical and international standards, and federal, provincial and territorial governments remained in strong fiscal positions.
The economic situation changed in the fall of 2008, with many of Canada's most important sectors shaken by the deep recession that began in the United States and has since spread to the global economy. The collapse of the U.S. housing market devastated exports of lumber and other construction materials, and U.S. household spending on Canadian exports of manufactured goods (most notably automobiles) stagnated. Housing and private investment also fell in 2008-2009 coupled with the decline in exports, spending and consumer goods.
The following gives a brief explanation of the socio-economic context as it pertains to each of the Department's Strategic Outcomes.
Enhanced Canadian productivity and participation through efficient and inclusive labour markets, competitive workplaces, and access to learning
The issues involved in ensuring an efficient labour market in early 2008 were related to slowing productivity and shortages of skilled labour in certain sectors. While productivity and skills shortages continue to remain long-term challenges, they have been overtaken by short-term growing unemployment rates, increased reliance on income support provided through the Employment Insurance (EI) program, and increased vulnerability of at-risk populations.
A huge decline in corporate profits has frozen Canadian business investment and hiring intentions and has resulted in the shedding of hundreds of thousands of jobs, particularly in the wholesale, retail trade, manufacturing and construction sectors. In turn, weak employment prospects have led households to curtail spending. In addition to a sharp drop in capital investment intensions, Canadian businesses cut back on payrolls. Employment dropped sharply at the start of 2009, largely in the construction and manufacturing sectors, and more prudent hiring results in a growing share of part-time employment at the expense of full-time jobs.
The reality of job losses and weak employment prospects has materialized, leading consumers to cut back sharply on spending in late 2008 and early 2009. After reaching a historical low of 5.8% in January 2008, Canada's unemployment rate rose rapidly to reach 8.0% in March 2009.
Canadians who are most at risk under normal economic conditions�such as Aboriginal people, workers without post-secondary education, people with disabilities, youth, students, low-income workers and older workers�can become further marginalized in the current economic climate. For instance, older workers are choosing to delay retirement and remain in the labour market longer, while employers are using early retirement as a tool to save money by reducing current workforce levels. For low-income workers and their families, reduced employment income is making it an even greater challenge to make ends meet. In other cases, workers with long employment histories are finding themselves permanently laid off and in need of transitional assistance or re-training opportunities to pursue alternative careers. Aboriginal people, who have traditionally had higher unemployment rates, are also finding it difficult to enter or remain in the labour market.
In the last quarter of 2008-2009, the Department implemented a broad-based strategy and operational measures to support workload requirements associated with the delivery of Canada's Economic Action Plan (Budget 2009) initiatives (e.g., EI measures, work-sharing arrangements, extension of the Wage Earner Protection Program, and enhanced funding support to provinces and territories for training and skills upgrading programs) while maintaining key performance indicators and service standards for HRSDC, Labour Program and Service Canada core programs during the economic downturn.
As a result of these three factors�rising unemployment rates, increased reliance on income support and vulnerability of at-risk populations�the Department's priorities shifted to a short-term focus that is immediately responsive to the economic downturn so that Canadian workers are able to re-enter the labour market as soon as possible.
Safe, healthy, fair, stable, cooperative, productive workplaces and effective international labour standards
Economic downturns�especially when they are as sudden and deep as the recession that began in October 2008�create significant tensions and uncertainties in the workplace. Employers begin to search for ways to support the survival of their businesses, often turning to layoffs, cost reduction measures and steps to boost efficiency. For their part, employees grow more concerned about the security of their jobs and incomes, as well as with preserving, as much as possible, the benefits provided to them and their families. These responses have the potential to generate heightened tensions between employers and employees, both at the bargaining table and in the workplace. If these tensions are not managed well, there is a significant risk that workplace relations will deteriorate, thereby diminishing the economy's capacity to recover and be well positioned for economic growth and strong work force relations when the recession ends.
The Labour Program rapidly shifted gears as the economic situation began to deteriorate in the fall of 2008. In an effort to avoid work stoppages that might make economic recovery more difficult, emphasis was placed on providing timely and proactive mediation and conciliation services to employers and unions entering into collective bargaining against the backdrop of declining profitability and slackening demand for labour. Resources were directed towards strengthening front line services in view of the fact that economic difficulties typically increase frictions, thereby heightening demand for timely inspections, investigations and adjudications with respect to workplace health and safety, dismissals and terminations. As a result of the Budget Implementation Act 2009 enhancements were made to the Wage Earner Protection Program, which provides support to workers whose employer declares bankruptcy or goes into receivership, to include termination and severance pay, along with the original coverage for unpaid wages and vacation pay. Finally, in view of the global nature of the downturn and the importance of free trade for a prosperous economic future, labour cooperation agreements with new free trade partners were made stronger.
Enhanced income security, access to opportunities, and well-being for individuals, families and communities
Faced with the pressures of global competition, employers have shifted risk to employees. More work is temporary, part-time or contracted out than in the past, and the demands on many regular employees have intensified. More work is in smaller firms and in the service sector, where unionization rates and wages have tended to be lower. In addition, projected demographic trends point to an aging society, which has placed unique pressures on the Income Security System, as well as on families assuming caregiving responsibilities.
Circumstances such as these bring unique pressures for communities, employers and workers. These pressures lead employers to adjust their workforce and task orientation in response to shifting conditions and cause workers to exercise all available options to obtain financial security, including re-training, EI and labour mobility. This is particularly relevant in communities that rely almost exclusively on one or two employers, such as the auto industry.
During this time of economic challenge and uncertainty, both consumers and business have cut spending and are investing less. Going forward, households are likely to remain cautious in their purchase and investment decisions. Reliance on Canada's public pension system has become ever more relevant for Canada's seniors. Ensuring that investments in Canada's pension system are secure is vital to the financial stability of Canada's seniors.
The difference in after-tax income (adjusted for family size and composition) between the top and bottom 20 percent of families in Canada widened during the past decade. While already a cause for concern, the income gap between the richest and poorest segments of society is at risk of growing substantially larger as many middle-income Canadians fall to the lower-income tax brackets as a result of current socio-economic pressures. Income tends to become more polarised in economic downturns. We can therefore expect income to become less evenly distributed as individuals in low-paying or more cyclically sensitive sectors lose their jobs while others remain employed. The recent increases in hourly wage rates suggest that the current recession may already be driving a wedge between employed and unemployed Canadians. The Department recognizes these trends and has ensured that financial assistance and services were provided to low-income families through the National Child Benefit and Canada Social Transfer in an effort to support early childhood development.
Achieve better outcomes for Canadians through service excellence
Through its Service Canada initiative, the Department has always been committed to delivering Government of Canada services with integrity, fairness and respect for personal privacy.
Over the past year, the number of unemployed workers and other people who require access to government services increased substantially, resulting in a growing workload in applications and processing. The global economic downturn increased the number of Canadians at risk of losing employment and facing a reduced standard of living. The result has been unprecedented volumes of EI claims and increased benefit processing workloads. Service Canada received a total of 3.1 million EI claims in 2008-2009, compared to 2.6 million in 2007-2008, a year-over-year increase of 19.3%.
The increase in demand for services was characterized by additional requests for Employment Insurance and labour market information. Consequently, Service Canada engaged in measures to ensure the Department was well-positioned to maintain service excellence to Canadians. Stronger partnerships with the regions, resulted in more effective management of workload and resources for benefit processing and payment. As well, extended hours of service to Call Centres and Service Canada Centers increased access and presence of the Department in rural communities. Human resource strategies, such as hiring additional staff, extended agreements with other federal departments and improved internet services through the citizen-centred service initiative were also implemented.
Demographic trends continue to present unique challenges as they continuously alter Service Canada's client base and demand for its services. In Canada's aging society, an older demographic means a greater number of clients and increased demand for Old Age Security and Canada Pension Plan services.
In keeping with the Department's commitment to sound stewardship of public funds, efforts were made to ensure overall service quality and integrity, which includes emphasizing core service delivery values such as personalization, open communication, security and privacy of personal information.
1.4 Corporate Risk Analysis
Over the past year, the Department continued to strengthen its risk management practices to manage its corporate risks effectively and support the implementation of integrated risk management across the organization. A risk management internal audit was conducted in 2008 and tabled at the Departmental Audit Committee along with the departmental management action plan to respond to the audit recommendations.
The Department has also established a process that requires periodic senior management discussions to review and assess corporate risks and the overall adequacy of the way these identified risks are managed. The new Portfolio Corporate Services Committee includes risk management roles and responsibilities in its terms of reference. Risk management arrangements were presented and discussed at the Departmental Audit Committee. Furthermore, HRSDC launched a risk management intranet site and published a handbook on integrated risk management to facilitate a more standard and consistent approach to risk management across the Department.
The Department identified four corporate risks with respect to achieving its objectives and commitments for 2008-2009. A summary of the key risks and the progress achieved in implementing their respective mitigation strategies is outlined below. The four areas identified by the Department as being susceptible to risks are:
- enhancing delivery of responsive policies, programs and services;
- managing existing information technology infrastructure;
- exercising appropriate governance and oversight; and
- recruiting and retaining a skilled and knowledgeable workforce.
Enhancing Delivery of Responsive Policies, Programs and Services
The growing and diverse range of funding instruments and service delivery partners poses a risk to the Department's ability to enhance delivery of responsive policies, programs and services to Canadians.
In 2008, the Department streamlined its governance structure to better reflect the relationships within the organization and thereby support its focus on excellence in policy development, program policy and design, service delivery, enabling services, and management. It also streamlined its management of grants and contributions and continued to implement the departmental action plan created in response to the Blue Ribbon Panel on Grants and Contributions. Further, the Department has focused its efforts on improving the overall quality of the Departmental Performance Measurement Framework by ensuring that it is both comprehensive in breadth and depth, and of high quality and relevance. In this respect, each branch has developed its own performance measurement framework, including logic model, performance indicators and data collection strategies. A department-wide Performance Measurement Roundtable has been established to improve the overall coordination and management of performance measurement and reporting activities throughout the Department. Finally, improvements have been made to multi-lateral and bi-lateral management structures, in the implementation of Labour Market Development Agreements (LMDAs) and Labour Market Agreements (LMAs), by way of regular bilateral discussions with provinces and territories.
Managing Existing Information Technology Infrastructure
Given the important role that information technology plays in supporting departmental priorities, the Department must manage the risk that the existing information technology infrastructure and recovery capability might not be adequate to ensure continued quality front-line service delivery to all Canadians.
Work continued on the Department's Information Technology Strategy to ensure that its information technology (IT) is fully aligned with departmental strategies and priorities, to provide additional insight into the current state of IT services, and to explore opportunities to innovate by leveraging knowledge and using technology more effectively across the organization. The Department developed a renewal road map to facilitate modernization of its technology infrastructure and associated software applications.
Exercising Appropriate Governance and Oversight
At risk is the Department's capacity to exercise appropriate governance and oversight of financial resources within an environment of transformation.
The Department completed its long-term capital plan and implemented a more thorough investment process; this included the establishment of an Investment Review Board. The Board has been operating since October 2008 and is responsible for overseeing the development of the investment plan, monitoring its implementation and providing executive oversight of the investment management process. The plan allows the organization to meet its obligations and responsibilities with respect to effective asset management responsibilities. The Department also adopted a Stage-Gate process for investment review. This process guides investment decisions, particularly in the area of information technology. Furthermore, the implementation of a more collaborative approach to planning�one that integrates business priorities, human resources plans and budgets�provides the foundation for assessing and understanding departmental financial needs.
Recruiting and Retaining a Skilled and Knowledgeable Workforce
There is a risk that the Department may not be able to ensure sustainable leadership and a skilled and knowledgeable workforce that would enable it to deliver on its mandate successfully and meet Canadians' expectations for accountable and responsive programs and services.
In line with the Clerk of the Privy Council's call to action to strive for excellence through public service renewal, the Department created the Renewal Secretariat in 2008-2009. The mandate of the Secretariat is to ensure that public service renewal is prevalent throughout the organization by engaging employees across the country. To address labour and skills shortages, the Department continues to use staffing flexibilities and strategies to align human resources with the current and future needs of the Department; this includes increased use of collective staffing and targeted recruitment, as well as efforts focused on attracting new talent. Senior management undertook a series of executive talent management reviews during 2008-2009, with follow-up actions and corresponding strategies to be presented at the 2009-2010 mid-year review.
The Department has continued to implement its Service Management Structural Model, a set of standardized organizational structures and work descriptions applied to the service management arm of Service Canada. On completion, the model reduced the number of work descriptions in the regions from approximately 3,500 to fewer than 30. The model sets a foundation on which increasingly transparent and efficient human resource management practices will be built. Such practices include standardized performance expectations, the delineation of career paths and competency certification. As a result, employees will know what is expected of them today, what opportunities will be available tomorrow, and which competencies they must develop to prepare for those opportunities.
The Department is also continuing to develop a more integrated corporate approach to risk management in order to manage ongoing strategic and operational risks effectively in delivering programs and services.
1.5 Performance Summary Tables
Total financial and human resources
Human Resources and Skills Development Canada's vision is to build a stronger and more competitive Canada, to support Canadians in making choices that help them live productive and rewarding lives, and to improve Canadians' quality of life. The tables below provide the organization's total financial and human resources.
| 2008-2009 | ||
|---|---|---|
| Planned Spending | Total Authorities | Actual Spending |
| 87,125.7 | 88,520.2 | 88,264.2 |
| 2008-2009 | ||
|---|---|---|
| Planned | Actual | Difference |
| 24,215 | 23,778 | 437 |
Financial information associated with strategic outcomes, performance indicators and 2008-2009 performance
The tables below provide information related to strategic outcomes, along with associated performance indicators and 2008-2009 performance. Financial information related to the implementation of these strategic outcomes is included.
| (millions of dollars) | 2007-2008 Actual Spending |
2008-2009 | ||||
|---|---|---|---|---|---|---|
| Main Estimates |
Planned Spending |
Total Authorities |
Actual Spending |
Alignment to Government of Canada Outcomes | ||
| Please note that no performance measurement targets for this strategic outcome were included in the 2008-2009 Report on Plans and Priorities. This strategic outcome was re-profiled as an internal service with Policy, Research and Communications. For performance results, please refer to Section II, pages 40 to 42. | ||||||
| Financial Resources (Gross) | ||||||
| Policy, Research and Communications | 199.3 | 185.0 | 185.2 | 193.4 | 192.3 | Income Security and employment for Canadians |
| (millions of dollars) | 2007-2008 Actual Spending |
2008-2009 | ||||
|---|---|---|---|---|---|---|
| Main Estimates* |
Planned Spending |
Total Authorities |
Actual Spending |
Alignment to Government of Canada Outcomes | ||
| * Employment Insurance Benefits (EI Part I and EI Part II) are excluded from Main Estimates number. | ||||||
| Financial Resources (Gross) | ||||||
| Labour Market | 14,908.3 | 1,327.1 | 16,375.7 | 17,704.9 | 17,629.8 | Income Security and employment for Canadians |
| Workplace Skills | 139.4 | 273.9 | 273.8 | 275.2 | 199.0 | An innovative and knowledge based economy |
| Learning | 2,283.8 | 2,096.6 | 2,096.6 | 2,136.2 | 2,134.4 | An innovative and knowledge based economy |
| Total Financial Resources (Gross) | 17,331.5 | 3,697.6 | 18,746.1 | 20,116.3 | 19,963.2 | |
| Performance Indicators | 2008-2009 Performance and Historical Results | |||||||||||||||||||||||||||||||||||||||||||||||
|---|---|---|---|---|---|---|---|---|---|---|---|---|---|---|---|---|---|---|---|---|---|---|---|---|---|---|---|---|---|---|---|---|---|---|---|---|---|---|---|---|---|---|---|---|---|---|---|---|
| 1 Please note
SLID data is for the 25-64
age group and participation ratios are computed based on annual employment levels. 2 Please note SLID data is for the 25-64 age group and participation ratios are computed based on annual employment levels. |
||||||||||||||||||||||||||||||||||||||||||||||||
| LABOUR MARKET | ||||||||||||||||||||||||||||||||||||||||||||||||
| Participation rate- [Data Source: Labour Force Survey] |
|
|||||||||||||||||||||||||||||||||||||||||||||||
| Percentage of unemployed looking for work for one year or more (52 weeks and over) [Data Source: Labour Force Survey ] |
|
|||||||||||||||||||||||||||||||||||||||||||||||
| Percentage of youth (aged 15-24) not in the labour force nor in school - [Data Source: Labour Force Survey] |
|
|||||||||||||||||||||||||||||||||||||||||||||||
| Unemployment Rates by Designated Group [ Data Source: Labour Force Survey ] * Labour Force Survey April 2009 ** Participation and Activity Limitation Survey - PALS 2006 (latest available) |
|
|||||||||||||||||||||||||||||||||||||||||||||||
| WORKPLACE SKILLS | ||||||||||||||||||||||||||||||||||||||||||||||||
| Labour productivity growth, for business sector- based on annual averages [ Data Source: Centre for the Study of Living Standards] |
|
|||||||||||||||||||||||||||||||||||||||||||||||
| Canada's productivity level as a percentage of the United States productivity level [Data Source: Centre for the Study of Living Standards] |
|
|||||||||||||||||||||||||||||||||||||||||||||||
| Percentage of working-age Canadians who score below the literacy level which is considered the minimum to cope in today's economy and society - [Data Source: Adult Literacy and Life Skills Survey] | The performance data is collected every ten years by Statistics Canada. The most recent data, from 2003, indicated that 42% of working-age Canadians score below the literacy level which is considered the minimum to cope in today's economy and society. Updated results will be available in 2013. | |||||||||||||||||||||||||||||||||||||||||||||||
| Percentage of adult workforce who participated in job-related formal training [Data Source: Survey of Labour and Income Dynamics]1 |
|
|||||||||||||||||||||||||||||||||||||||||||||||
| Percentage of adult workforce who participated in employer-supported job-related training [Data Source: Survey of Labour and Income Dynamics - Note that in future years, the ASETS survey will be used]2 |
|
|||||||||||||||||||||||||||||||||||||||||||||||
| LEARNING | ||||||||||||||||||||||||||||||||||||||||||||||||
| Percentage of the Canadian labour force (age 15 and older)) who have attained a post-secondary education certificate, diploma or degree (64.3% in 2008 for 25-64 year olds) - (For Canadians in the labour market) |
Historical data: Over the past five years, the percentage of the Canadian labour force (age 25-64) that has attained a post-secondary education has increased steadily, rising from 60.4% in 2004 to 64.3% in 2008 (44.2% in 1990). |
|||||||||||||||||||||||||||||||||||||||||||||||
| Proportion of Canadians (15-64) who were attending university or college, by age group (For school months: January to April and September to December) |
Historical data:Over the past five years, the proportion of Canadians, aged 17-21, who were attending university or college has steadily increased from 37.6% in 2004 to 38.1% in 2008 (30.4% in 1990). |
|||||||||||||||||||||||||||||||||||||||||||||||
| Percentage of Canadians (15 years and older) who have attained a post-secondary education certificate, diploma or degree by age group (results for 25 to 64 year olds can be compared to all other OECD countries) (For all Canadians) |
Historical data: Over the past five years, the percentage of Canadians age 25-64 who have attained a post-secondary education has increased steadily, rising from 56.9% in 2004 to 60.8% in 2008 (39.6% in 1990). |
|||||||||||||||||||||||||||||||||||||||||||||||
| (millions of dollars) | 2007-2008 Actual Spending |
2008-2009 | ||||
|---|---|---|---|---|---|---|
| Main Estimates |
Planned Spending |
Total Authorities |
Actual Spending |
Alignment to Government of Canada Outcomes | ||
| Financial Resources (Gross) | ||||||
| Labour | 239.3 | 237.9 | 271.4 | 262.7 | 261.2 | A Fair and Secure Marketplace |
| Performance Indicators | 2008-2009 Performance and Historical Results | |||||||||||||||||||||
|---|---|---|---|---|---|---|---|---|---|---|---|---|---|---|---|---|---|---|---|---|---|---|
| LABOUR | ||||||||||||||||||||||
| Percentage of total working days lost due to work stoppages. [Data source: Labour Program Records and files] |
|
|||||||||||||||||||||
| Representation of designated groups in all occupations and workforce availability,
employers covered under the Legislated Employment Equity Program [Data Sources: Representation of Designated Groups - derived from annual reports submitted by federally regulated employers to the Labour Program on June 1st covering the previous calendar year. The federal public sector submits directly to Parliament.] [Workforce availability - Census of Canada and the Physical demands limitation survey 2001 and 2006]. |
|
|||||||||||||||||||||
|
||||||||||||||||||||||
| (millions of dollars) | 2007-2008 Actual Spending |
2008-2009 | ||||
|---|---|---|---|---|---|---|
| Main Estimates* |
Planned Spending |
Total Authorities |
Actual Spending |
Alignment to Government of Canada Outcomes | ||
| *Canada Pension Plan Benefits are excluded from Main Estimates number. | ||||||
| Financial Resources (Gross) | ||||||
| Social Investment | 59,902.7 | 33,783.7 | 63,028.0 | 62,593.8 | 62,565.7 | Income Security and employment for Canadians |
| Children and Families | 2,482.1 | 2,488.3 | 2,488.2 | 2,554.1 | 2,553.9 | Income Security and employment for Canadians |
| Housing and Homelessness | 116.6 | 165.6 | 165.6 | 183.7 | 150.7 | Strong Economic Growth |
| Total Financial Resources (Gross) | 62,501.4 | 36,437.6 | 65,681.8 | 65,331.6 | 65,270.3 | |
| Performance Indicators | 2008-2009 Performance and Historical Results | |||||||||||||||||||||
|---|---|---|---|---|---|---|---|---|---|---|---|---|---|---|---|---|---|---|---|---|---|---|
| SOCIAL INVESTMENT | ||||||||||||||||||||||
| Number of and proportion of individual aged 65 years + who had low family income *[Statistics Canada, Survey on Labour and Income Dynamics (SLID)] |
|
|||||||||||||||||||||
| Number and proportion of individuals aged 65 years+ who would have had low income without public pension support [Statistics Canada, Survey on Labour and Income Dynamics (SLID)] |
|
|||||||||||||||||||||
| Percentage of recipient's individual income provided by the CPP-Disability benefit [Produced by Statistic Canada with T1 Tax File from Canada Revenue Agency (CRA)] |
|
|||||||||||||||||||||
| CHILDREN AND FAMILIES | ||||||||||||||||||||||
| Primary child care arrangements for children aged 1 to 5 years [Data source: Statistics Canada, 2001 and 2006 Census] * Census of Canada and the Physical demands limitation survey 2001. ** Census Census of Canada and the Physical demands limitation survey 2006. |
|
|||||||||||||||||||||
| Percentage of young children with average to advanced levels of verbal development [Data source: National Longitudinal Survey of Children and Youth (NLSCY) 2006-2007] |
|
|||||||||||||||||||||
| Percentage of young children living in families exhibiting positive family functioning [Survey of Children and Youth (NLSCY) 2006-2007] |
|
|||||||||||||||||||||
| Incidence of Low Income - Change in the number and percentage of families and children that fall below the post-tax low income cut-offs (post-tax LICOs), due to the National Child Benefit, in one year. | The National Child Benefit (NCB) initiative was responsible for preventing an estimated 59,000 families with 125,000 children from living in low income in 2004. This is a 12.1% reduction in the number of families with children living in low income that year. | |||||||||||||||||||||
| Depth of Low Income - Change in the aggregate amount of income that low-income families would need to reach the post-tax low income cut-offs (post-tax LICOs), due to the National Child Benefit, in one year. | The NCB reduced the depth of low income, or low-income gap, for families with children who received the NCB Supplement in 2004. NCB income benefits closed the low-income gap by a total of $740 million, or 18.5%, in 2004. They decreased the low-income gap by $310 million for single parents living in low income (a reduction of 17.7%) and by $430 million for two-parent families (a reduction of 19.0%). | |||||||||||||||||||||
| HOUSING AND HOMELESSNESS | ||||||||||||||||||||||
| Core Housing Need [Working availability - Census of Canada and the Physical demands limitation survey 2001 and 2006]. |
|
|||||||||||||||||||||
| (millions of dollars) | 2007-2008 Actual Spending |
2008-2009 | ||||
|---|---|---|---|---|---|---|
| Main Estimates |
Planned Spending |
Total Authorities |
Actual Spending |
Alignment to Government of Canada Outcomes | ||
| Financial Resources (Gross) | ||||||
| Seamless, Citizen-Centered Service | 2,581.6 | 594.1 | 602.2 | 860.5 | 836.9 | Government Affairs |
| Integrity | 903.9 | 880.2 | 880.2 | 973.9 | 971.1 | Government Affairs |
| Collaborative, Networked Government Service | 228.4 | 232.4 | 232.4 | 249.7 | 245.7 | Government Affairs |
| Total Financial Resources (Gross) | 3,713.9 | 1,706.7 | 1,714.8 | 2,084.1 | 2,053.7 | |
| Note: The same performance indicators are used at the strategic outcome and program activity levels. To avoid repetition, these indicators are included once in Section II (pages 77-78, 80-81 and 84). | |
| Service Indicators | 2008-2009 Performance and Historical Results |
|---|---|
1.6 Contribution of Priorities to Strategic Outcomes
| Operational Priorities | Type | Status | Links to Strategic Outcome(s) |
|---|---|---|---|
| PRIORITY: BUILDING THE KNOWLEDGE ADVANTAGE | |||
| Implement a new labour market training architecture. | Ongoing | MET ALL A new labour market training architecture was implemented, as demonstrated by the conclusion of three devolution Labour Market Development Agreements with Nova Scotia, Prince Edward Island and Newfoundland and Labrador to assist EI eligible clients, as well as by the conclusion of new bilateral Labour Market Agreements with six provinces and territories to assist people who are not eligible for EI. |
Enhanced Canadian productivity and participation through efficient and inclusive labour markets, competitive workplaces and access to learning. |
| Improve governance and management of the Employment Insurance Account. | Ongoing | MET ALL The Department provided policy, legislative and operational leadership in response to the Budget 2008 commitment to establish the Canada EI Financing Board (June 20, 2008). This included supporting the work of the nominating committee (July 2008) for the Board of Directors. |
Enhanced Canadian productivity and participation through efficient and inclusive labour markets, competitive workplaces and access to learning. |
| Address labour market challenges and opportunities faced by traditional industries. | Ongoing | MET ALL The Department supported sectoral initiatives by developing new approaches to improve workplace partnerships. A new Forestry Sector Council was launched in the summer of 2008 to work on critical human resources issues for the Canadian forest products sector. Among other responsibilities, this new council is engaged in sector-wide human resources strategic planning and the production of best practice guides and other tools that can be used readily by business and labour. |
Enhanced Canadian productivity and participation through efficient and inclusive labour markets, competitive workplaces and access to learning. |
| Support labour market integration of foreign-trained workers and facilitate entry of temporary foreign workers. | Ongoing | MET ALL The Foreign Credential Recognition (FCR) program engaged all provinces in discussions about strengthening their FCR capacity and launched work on a new Foreign Qualification Recognition Framework for presentation to First Ministers. In collaboration with Citizenship and Immigration Canada, the Temporary Foreign Worker Program (TFWP) negotiated Temporary Foreign Worker Annexes (Ontario and Alberta), which are enabling mechanisms to facilitate the entry of foreign nationals. The TFWP increased protection for foreign nationals through the development of letters of understanding (Alberta and Manitoba) to share information related to provincial legislation on labour standards. The TFWP also engaged with several provinces on region-specific entry and protection issues that temporary foreign workers face. The Expedited Labour Market Opinion Pilot Project was successfully implemented in British Columbia and Alberta. |
Enhanced Canadian productivity and participation through efficient and inclusive labour markets, competitive workplaces and access to learning. |
| Reduce barriers to mobility. | Ongoing | MET ALL The Department collaborated with provinces and territories to amend Chapter 7 (Labour Mobility) of the Agreement on Internal Trade to achieve full mobility across Canada. |
Enhanced Canadian productivity and participation through efficient and inclusive labour markets, competitive workplaces and access to learning. |
| Help Aboriginal peoples to obtain skills and training. | Ongoing | MET ALL Sixteen Aboriginal Skills and Employment Partnership (ASEP) projects were approved for the expansion and extension of the program to March 31, 2012. Work was also undertaken in support of Budget 2009 initiatives pertaining to further expansion of ASEP for up to 25 new projects and to the new Aboriginal Skills and Training Strategic Investment Fund. |
Enhanced Canadian productivity and participation through efficient and inclusive labour markets, competitive workplaces and access to learning. |
| Negotiate and implement labour cooperation agreements. | Ongoing | MET ALL The Department supported key governmental free trade and international human rights priorities and addressed key labour issues in the negotiation and implementation of labour cooperation agreements (LCAs). Three LCAs were concluded, and two of them-the Canada�Peru LCA and the Canada�Columbia LCA were signed during 2008-2009. |
Safe, healthy, fair, stable, cooperative workplaces and effective international labour standards. |
| Modernize Federal Financial Assistance to students as announced in the Advantage Canada Plan. | Ongoing | MET ALL Budget 2008 announced $123 million over four years to streamline and modernize the Canada Student Loans Program (CSLP) through measures such as a new Service Delivery Vision and a consolidated Repayment Assistance Program and a new Canada Student Grant Program. In addition, the Department reviewed Registered Education Savings Plan (RESP) industry practices and completed the transition to a single service provider for CSLP borrowers. |
Enhanced Canadian productivity and participation through efficient and inclusive labour markets, competitive workplaces and access to learning. |
| Develop policy options and instrument choices related to financial and non-financial barriers to learning. | Ongoing | MET ALL The Department finalized details of the new Canada Student Grants Program and Repayment Assistance Plan announced in Budget 2008. It also analyzed policy options to improve support for under-represented groups, renewed the International Academic Mobility initiative and implemented an outreach strategy targeted at low- and middle-income families. |
Enhanced Canadian productivity and participation through efficient and inclusive labour markets, competitive workplaces and access to learning. |
| PRIORITY: SUPPORTING CHILDREN, FAMILIES AND VULNERABLE CANADIANS | |||
| Develop policies to invest in families and those seeking to break free from poverty. | Previous commitment | MET ALL The Universal Child Care Plan gives parents the flexibility to balance work and family as they see fit. Through the Universal Child Care Benefit, parents receive $100 per month (up to $1,200 per year) for each child under the age of six. |
Enhanced income security, access to opportunities and well-being for individuals, families and communities. |
| Address issues facing people with disabilities through the development and implementation of initiatives such as the Canada Disability Savings Grant, Canada Disability Saving Bonds and Enabling Accessibility Fund. | Previous commitment | MET ALL The Grant and Bond were made available to Canadians beginning December 1, 2008. More than 12,500 Registered Disability Savings Plans were applied for or opened in 2008-2009. The first call for proposals for the Enabling Accessibility Fund was completed. A total of 816 proposals were reviewed, 166 small projects and 2 major projects were approved. All projects must meet EAF eligibility requirements and those of other applicable federal programs. |
Enhanced income security, access to opportunities and well-being for individuals, families and communities. |
| Develop transitional and supportive housing and improve programs that increase self-sufficiency. | Ongoing | MET ALL The percentage of all Homelessness Partnering Strategy investments in regionally delivered projects targeted to longer-term transitional and supportive housing and services increased to 78%, exceeding the 65% target. In 2008-2009, a total of nine housing units were created under the Surplus Federal Real Property for Homelessness Initiative. Of these, 78% were supportive housing and 22% were longer-term. |
Enhanced income security, access to opportunities and well-being for individuals, families and communities. |
| Address issues with a special emphasis on the issue of elder abuse and the implementation of the capital expansion component of the New Horizons for Seniors Program. | Previous commitment | MET ALL Sixteen contribution agreements were implemented under the Elder Abuse Awareness component of the New Horizons for Seniors Program. A call for proposals was completed for the two New Horizons for Seniors Program grant funding streams: Capital Assistance, and Community Participation and Leadership. As a result, the program supported a total of 1,714 grants for total funding of $26.3M. |
Enhanced income security, access to opportunities and well-being for individuals, families and communities |
| Protect Reservists' employment. | Ongoing | MET ALL On April 16, 2008, new legislation was passed to provide job protection for federally regulated reservists. |
Safe, healthy, fair, stable, cooperative workplaces and effective international labour standards. |
| Implement the Wage Earner Protection Program. | Ongoing | MET ALL The Wage Earner Protection Program and the legislative amendments announced in Budget 2009 to expand coverage of the Wage Earner Protection Program Act were successfully implemented. |
Safe, healthy, fair, stable, cooperative workplaces and effective international labour standards. |
| PRIORITY: PROVIDING THE HIGHEST LEVEL OF SERVICES TO CANADIANS | |||
| Focus on citizen centred service in the official language of choice. | Ongoing | MET ALL The Department implemented an action plan and a directive on active offer to ensure a consistent national approach in serving Canadians. Complaints regarding "Communication with and services to the public" received through the Commissioner of Official Languages have dropped by 60%. Several Service Canada College courses now include modules on official languages. Telephone services are consistently offered in both official languages. |
Achieve Better Outcomes for Canadians through Service Excellence. |
| Better cost management while enhancing quality of service. | Previous commitment | MET ALL Continued effort was dedicated to guide the location of points of service across Canada. This includes Service Canada Centres, Service Canada Community Offices and Scheduled Outreach Services. Work was also completed to improve the presentation and accessibility of information on the Service Canada Web site. Furthermore, the National Quality Assurance program was introduced in all call centres. |
Achieve Better Outcomes for Canadians through Service Excellence. |
| Simplify, standardize and automate processes to transform service delivery. | Previous commitment | MET ALL The progress made on Canada Pension Plan and EI automation and electronic services, along with the standardization of claims processing, has resulted in an effective response to increased volumes. There was an increase of 12 556 applications for the CPP and an increase of 508 260 applications for EI. |
Achieve Better Outcomes for Canadians through Service Excellence. |
| Invest in risk management and secure information sharing. | Ongoing | MET ALL Risk management has expanded services to assist clients in assessing and mitigating risk to service delivery at the front end and throughout the various stages of the service delivery life cycle. The Department has enhanced "My Service Canada Account" by combining multiple online services (EI, CPP/OAS) into a single security framework. It has also developed integrity risk management strategies to address operational risk in perspective to ensure that the right person receives the right service or benefit at the right time, and for the intended purpose. Information Sharing Agreements governing the exchange of information to and from the Social Insurance Register are being updated to ensure compliance with current legal, privacy and security requirements. |
Achieve Better Outcomes for Canadians through Service Excellence. |
| PRIORITY: STEWARDSHIP AND ACCOUNTABILITY | |||
| Demonstrate results and outcomes through new performance measurement strategies to address requirements of the Expenditure Management System. | Ongoing | MET ALL Progress is being made towards developing a robust and comprehensive performance measurement framework that emphasizes reporting on outcomes and trends over time. |
Policies and programs that meet the human capital and social development needs of Canadians. |
| Streamline management of grants and contributions and respond to the Blue Ribbon Panel on Grants and Contributions. | Previous commitment | MET ALL In 2008-2009, a 10% reduction was achieved in the total number of audits in 150 projects. This generated savings of approximately $2.25M and 3,000 work days for our partners and for HRSDC staff, as well as a reduction of 7,500 audit pages. This addresses the recommendations of the Blue Ribbon Panel on Grants and Contributions by reducing the administrative and paper burden and beginning to break through the web of rules. |
Policies and programs that meet the human capital and social development needs of Canadians. |
| Support the Deputy Minister in role as Accounting Officer. | Previous commitment | MET ALL A number of departmental financial management policies�including policies on membership fees, hospitality, commitment control, account verification and payment requisitioning, departmental bank accounts, and international travel�were developed or revised. Financial delegation instruments were reviewed, and a number of improvements for both streamlining and strengthening financial authorities across the Department were recommended. The Department will invest in the Departmental Action Plan to Modernize the Administration of HRSDC's Grants and Contributions Program. Deliverables for 2008-2009 include a more than 10% reduction in the paper and administrative burden within select programs. The Department has established an external Departmental Audit Committee (DAC), chaired by the Deputy Minister. The DAC is a key element of the Department's governance regime and plays a strategic advisory role to the Deputy Minister. |
Internal Services - Supports all Strategic Outcomes. |
| Decrease the paper burden on employers and ease administrative burden on taxpayers. | Previous commitment | EXCEEDED Significant changes were made to EI regulations in March 2009 which reduced the administrative and paper burden and support claims processing efficiency. This included two significant changes to the EI regulations for employers who submit Records of Employment online and changes that will improve the speed of payment to work-sharing claimants and reduce the administrative and paper burden on them and their employers. |
Achieve Better Outcomes for Canadians through Service Excellence. |
| Improve IT investment and planning processes. | New | MET ALL IT investment and planning processes have improved; this is substantiated by the creation of the Long-Term Capital Plan and the establishment of the IT Investment Management Process and the governance to oversee large information management and IT investments. |
Internal Services - Supports all Strategic Outcomes. |
| PRIORITY: HUMAN RESOURCE MANAGEMENT | |||
| Integrate HR considerations in business planning through a collaborative and partnering process that recognizes the current and future HR needs of the Department. | Ongoing | MET ALL Human resources planning framework has been improved to enhance support for integrated planning as well as for the development of collaborative networks. Developed an integrated planning process that links human resources planning to business objectives to enable the Department to assess the current business situation, anticipate changes, and identify corresponding current and future human resources needs and solutions. |
Internal Services - Supports all Strategic Outcomes |
| Use post-secondary recruitment to address skills shortages as well as recruitment of middle and senior managers. | Previous commitment | MET ALL The 2008-2009 commitment was met by hiring 615 post-secondary recruits. Furthermore, all executives have commitments in their Performance Management Agreements to focus on recruitment development. |
Internal Services - Supports all Strategic Outcomes. |
| Implement employee development activities as part of a retention strategy to maintain a skilled and knowledgeable workforce. | Previous commitment | MET ALL Programs for developing leadership capacities and promoting knowledge transfer and talent management were implemented in the Department. Developed an integrated EX Talent Management Framework entitled "Lead with Confidence, Deliver with Pride: The Cycle of Excellence" to provide governance on talent management for all executives. |
Internal Services - Supports all Strategic Outcomes. |
| Develop an organizational learning policy, to guide the required investments in learning and development of the workforce and deliver on commitment to service excellence. | Previous commitment | MET ALL A harmonized portfolio learning policy was developed to create one vision and mandate for the Department, across all business lines. |
Internal Services - Supports all Strategic Outcomes. |
| Expand the use of technology infrastructure and process transformation to support the modern and effective management of human resources. | Previous commitment | MET ALL Implementation of the Service Management Structural Model is on track, and the Regional Structural Model is also being implemented. The Enterprise Resource Planning project office, team and governance model were established along with an executive steering committee in order to replace the current human resources management information system. Innovative methodology and an innovative toolset were applied to manage short-term solutions such as Express Lane Staffing, the Integrated Staffing Log, and compensation and benefits process improvement. |
Internal Services - Supports all Strategic Outcomes. |
| Meet employment equity and official language requirements. | Ongoing | EXCEEDED The Department exceeded the expected representation targets; all of them were overachieved. Corporate second language training was delivered to help employees attain the language proficiency they need for their position and career progression. Official languages awareness sessions on parts V and VI and section 91 of the Official Languages Act were delivered to managers and employees |
Internal Services - Supports all Strategic Outcomes. |
| EMPLOYMENT EQUITY | |||
|---|---|---|---|
| Rating | Performance Indicators | 2008 - 2009 Target (Workforce Availability)a | Results |
| a WFA% is the external workforce availability estimate and is based on information collected in the 2001 Census. A comparison between the internal representation of designated group members in an employer's workforce and the external labour pool of designated group members from which the employer can reasonably be expected to recruit. This external labour pool takes into consideration occupational qualifications, eligibility and geographic recruitment area. | |||
| Exceeded expectations | Representation of visible minority persons | 9.4% | 9.6% |
| Exceeded expectations | Representation of Aboriginal persons | 3.1% | 3.9% |
| Exceeded expectations | Representation of people with disabilities | 3.4% | 6.8% |
| Exceeded expectations | Representation of women | 59.2% | 70.4% |
| OFFICIAL LANGUAGES COMPLAINTS | |||
|---|---|---|---|
| Rating | Performance Indicators | 2008 - 2009 Target | Results |
| Historical Data: Official languages complaints with regards to "Communication with and services to the public" and "Language of work" have decreased by over 50% compared with results reported in 2007-2008 DPR. In 2007-2008, the number of official complaints reported for "Communication with and services to the public" was 34 complaints and the number of complaints reported for "Language of work" was 15. | |||
| n/a | Communications with and services to the public | Actual results to be reported | 14 |
| n/a | Language of work | Actual results to be reported | 7 |
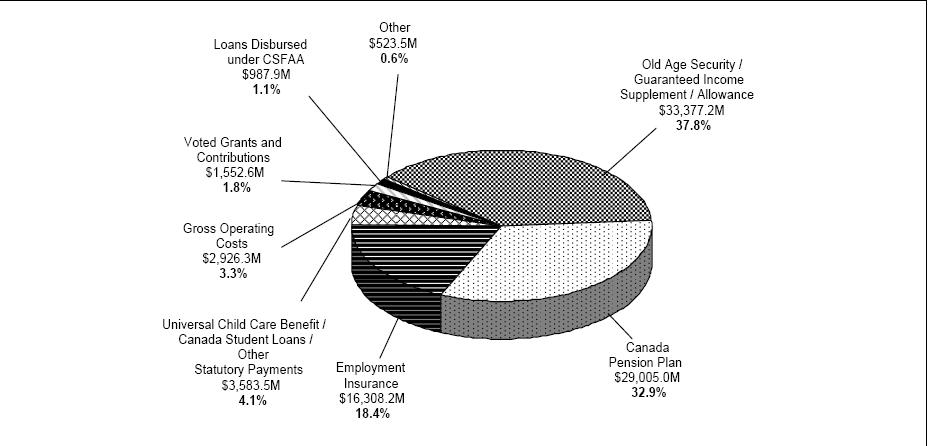
1.7 2008-2009 Expenditure Profile
Human Resources and Skills Development Canada (HRSDC) expenditures on programs and services total more than $88 billion, of which $83 billion, or 94%, directly benefits Canadians through Employment Insurance (EI), the Canada Pension Plan (CPP), Old Age Security (OAS), Universal Child Care Benefit, loans disbursed under the Canada Student Financial Assistance Act and other statutory transfer payment programs. Departmental expenditures were $1.6 billion in voted grants and contributions; $36.9 billion in statutory grants and contributions; and $2.1 billion for Employment Insurance Part II.
Consolidated Total: $88,264.2M
| Human Resources and Skills Development Canada - Gross Expenditures (in millions of dollars) |
Statutory Transfer Payments (in millions of dollars) |
||||
|---|---|---|---|---|---|
| a This amount ncludes payments related to Government Annuities Account and the Civil Service Insurance Fund. | |||||
| Budgetary | Grants and Contributions: | ||||
| Net Operating Costs | 1,093.5 | Old Age Security | 25,334.5 | ||
| Add Recoveries in relation to: | Guaranteed Income Supplement | 7,511.5 | |||
| Canada Pension Plan | 291.1 | Allowances | 531.2 | ||
| Employment Insurance Account | 1,427.1 | Other Statutory Payments: | |||
| Workers' Compensation | 106.1 | Universal Child Care Benefit | 2,547.8 | ||
| Other | 8.5 | 1,832.8 | Canada Education Savings Grant | 580.7 | |
| Gross Operating Costs | 2,926.3 | Canada Student Loans | 361.1 | ||
| Voted Grants and Contributions | 1,552.6 | Canada Learning Bond | 47.8 | ||
| Total Gross Expenditures | 4,478.9 | Wage Earner Protection Program | 3.7 | ||
| Canada Disability Savings Grant | 0.1 | 3,541.2 | |||
| Sub-Total | 36,918.4 | ||||
| Other � Workers' Compensation and | Canada Pension Plan Benefits | 29,005.0 | |||
| EI/CPP Charges and Recoveries | 523.5 | Employment Insurance Benefits | |||
| Non-Budgetary | Part I | 14,196.2 | |||
| Loans disbursed Canada Student | Part II | 2,112.0 | 16,308.2 | ||
| Financial Assistance Act(CSFAA) | 987.9 | Other Specified Purpose Accounts | 42.3a | ||
| Total Statutory Transfer Payments | 82,273.9 | ||||
Spending Trend
The figure below illustrates Human Resources and Skills Development Canada trend from 2006-2007 to 2008-2009. For the 2008-2009 fiscal year, Human Resources and Skills Development Canada spent $88.3 billion to meet the expected results of its program activities.
The 2006-2007 to 2008-2009 total authorized spending includes all Parliamentary appropriation and revenue sources, Main Estimates, Supplementary Estimates. The 2006-2007 to 2008-2009 planned spending corresponds to the forecasted planned spending presented in Report on Plans and Priorities from each respective year.

| Total Consolidated Expenditures (in millions of dollars) | |||
|---|---|---|---|
| 2006-2007 | 2007-2008 | 2008-2009 | |
| Planned | 79,713.2 | 84,700.4 | 87,125.7 |
| Authorized | 80,136.2 | 84,867.4 | 88,520.2 |
| Actual | 79,225.1 | 84,504.4 | 88,264.2 |
From 2006-2007 to 2007-2008, the increase in the actual and authorized spending is mainly attributable to a one time payment of $1.9 billion for the implementation of the Indian Residential Schools Settlement Agreement for 2007-2008 as well as an increase in statutory payments such as Old Age Security benefit payments of $1.7 billion and Canada Pension Plan costs of $1.4 billion.
From 2007-2008 to 2008-2009, the increase in the actual and authorized spending is mainly due to an increase of $2.0 billion in Employment Insurance costs, $1.6 billion for Canada Pension Plan costs and $1.4 billion for Old Age Security benefit payments.
For the planned spending, the increase from one year to the other is mostly explained by changes in forecasted statutory expenditures such as Canada Pension Plan benefits and Old Age Security benefit payments.
1.8 Voted and Statutory Items
| Vote # or Statutory Item (S) | Truncated Vote or Statutory Wording | 2006-2007 Actual Spending |
2007-2008 Actual Spending |
2008-2009 Main Estimatesa |
2008-2009 Actual Spending |
|---|---|---|---|---|---|
| 1 | Operating expenditures | 613.2 | 2,500.9 | 606.1 | 709.5 |
| 5 | Grants and contributions | 1,031.7 | 1,027.3 | 1,675.3 | 1,552.6 |
| 7 | Write-off of Debts | - | 0.4 | - | - |
| (S) | Minister of Human Resources and Social Development - Salary and motor car allowance | 0.1 | 0.1 | 0.1 | 0.1 |
| (S) | Minister of Labour and Minister of the Economic Development Agency of Canada for the Regions of Quebec - Salary and motor car allowance | 0.1 | 0.1 | 0.1 | 0.1 |
| (S) | Old Age Security Payments | 22,878.8 | 24,029.8 | 25,321.0 | 25,334.5 |
| (S) | Guaranteed Income Supplement Payments | 6,901.1 | 7,406.7 | 7,696.0 | 7,511.5 |
| (S) | Allowance Payments | 504.1 | 518.2 | 573.0 | 531.2 |
| (S) | Payments related to the direct financing arrangement under the Canada Student Financial Assistance Act | 246.4 | 292.3 | 328.0 | 298.2 |
| (S) | The provision of funds for interest payments to lending institutions under the Canada Student Loans Act | 0.1 | 0.1 | - | 0.1 |
| (S) | The provision of funds for liabilities including liabilities in the form of guaranteed loans under the Canada Student Loans Act | (17.8) | (19.1) | 6.8 | (14.5) |
| (S) | The provision of funds for interest and other payments to lending institutions and liabilities under the Canada Student Financial Assistance Act | 53.8 | 36.3 | 24.1 | 22.9 |
| (S) | Canada Study Grants to qualifying full and part-time students pursuant to the Canada Student Financial Assistance Act | 146.4 | 161.5 | 142.9 | 143.2 |
| (S) | Supplementary Retirement Benefits - Annuities agents' pensions | - | - | - | - |
| (S) | Universal Child Care Benefit Payments | 1,784.4 | 2,474.3 | 2,470.0 | 2,547.8 |
| (S) | Childcare transfer to Prov. & Terr. | 650.0 | - | - | - |
| (S) | Civil Service Insurance actuarial liability adjustments | 0.1 | - | 0.1 | 0.1 |
| (S) | Payments of compensation respecting government employees and merchant seamen | 48.8 | 39.5 | 43.0 | 46.2 |
| (S) | Canada Learning Bond payments to Registered Education Savings Plans (RESPs) trustees on behalf of RESP beneficiaries to support access to post-secondary education for children from low-income families | 21.8 | 35.8 | 34.0 | 47.8 |
| (S) | Canada Education Savings Grant payments to Registered Education Savings Plans (RESPs) trustees on behalf of RESP beneficiaries to encourage Canadians to save for post-secondary education for their children | 505.0 | 579.7 | 588.0 | 580.7 |
| (S) | Wage Earner Protection Program payments to eligible applicants owed wages and vacation pay from employers who are either bankrupt or in receivership as well as payments to trustees and receivers who will provide the necessary information to determine eligibility | - | - | - | 3.7 |
| (S) | Energy Cost Benefits | 3.7 | 0.1 | - | - |
| (S) | Canada Disability Savings Bond payments to Registered Disability Savings Plan (RDSP) issuers on behalf of RDSP beneficiaries to encourage long-term financial security of eligible individuals with disabilities | - | - | - | - |
| (S) | Canada Disability Savings Grant payments to Registered Disability Savings Plan (RDSP) issuers on behalf of RDSP beneficiaries to encourage long-term financial security of eligible individuals with disabilities | - | - | - | 0.1 |
| (S) | Spending of proceeds from disposal of Crown Assets | 0.3 | 0.1 | - | 0.1 |
| (S) | Labour Adjustment benefits in accordance with the terms and conditions prescribed by the Governor in Council to assist workers who have been laid off as a result of import competition, industrial restructuring, or severe economic disruption in an industry or region | - | - | - | - |
| (S) | Spending pursuant to section 12(4) of the Canada Education Saving Act | - | - | - | 0.1 |
| (S) | Contributions to employee benefit plans | 226.0 | 236.9 | 232.7 | 248.5 |
| Total Budgetary | 35,598.1 | 39,321.0 | 39,741.2 | 39,564.5 | |
| Plus: Non-Budgetary | |||||
| Loans disbursed under the Canada Student Financial Assistance Act | 1,231.9 | 1,099.5 | 906.3 | 987.9 | |
| Total Department | 36,830.0 | 40,420.5 | 40,647.5 | 40,552.4 | |
| Plus: Specified Purpose Accounts: | |||||
| Employment Insurance costs | 15,814.6 | 16,063.2 | - | 18,136.5 | |
| Canada Pension Plan costs | 26,689.2 | 28,135.7 | - | 29,699.1 | |
| Other Specified Purpose Accounts costs | 48.6 | 45.2 | - | 42.3 | |
| Departmental Employee Benefit Plan recoverable from Employment Insurance Account and Canada Pension Plan | (157.3) | (160.2) | - | (166.1) | |
| Total Consolidated Expenditures | 79,225.1 | 84,504.4 | 40,647.5 | 88,264.2 | |
| a. As published in Main Estimates 2008-2009. | |||||