
Treasury Board of Canada Secretariat
www.tbs-sct.gc.ca
Common menu bar links
Breadcrumb Trail
ARCHIVED - Public Safety Canada
 This page has been archived.
Archived Content
Information identified as archived on the Web is for reference, research or recordkeeping purposes. It has not been altered or updated after the date of archiving. Web pages that are archived on the Web are not subject to the Government of Canada Web Standards. As per the Communications Policy of the Government of Canada, you can request alternate formats on the "Contact Us" page.
Section IV: Supplementary Information
This section depicts how the Department’s Program Activities align with Government of Canada outcome areas, reports on progress against specific government initiatives and policies (as required by Treasury Board Canada) and includes additional information on the Department’s structure and performance in 2007-08.
The figures in the following set of tables have been rounded to the nearest thousand. Due to rounding, figures may not add to the totals shown. The Corporate Services Program Activity is not reported separately; it has been pro-rated across the other Program Activities.
Main Estimates figures are as reported in the 2007-08 Main Estimates.
Planned Spending figures are as reported in the 2007-08 Report on Plans and Priorities (RPP). Resources that are earmarked in the fiscal framework and are anticipated to be incorporated into the Department’s reference levels through 2008-09 Supplementary Estimates are included.
Total Authorities represent 2007-08 Main Estimates plus Supplementary Estimates and Allotment transfers received during the 2007-08 fiscal year, as well as adjustments to statutory amounts, internal adjustments and transfers (combined total of $16,116.8K), as reported in the 2007-08 Public Accounts.
Actual figures represent the actual expenditures incurred during the 2007-08 fiscal year, as reported in the 2007-08 Public Accounts.
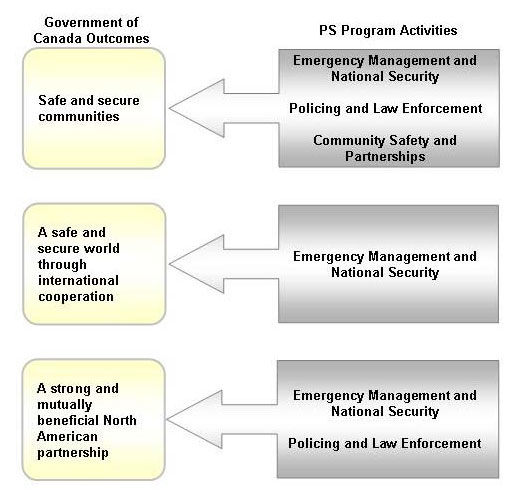
Departmental Links to the Government of Canada Outcomes
The Department’s Strategic Outcome of enhancing the safety, security and emergency preparedness of Canadians in an open society contributes to the achievement of the following Government of Canada Outcomes:
- Safe and secure communities;
- A safe and secure world through international cooperation; and
- A strong and mutually beneficial North American partnership.
| Program Activity | Actual Budgetary Spending 2007-08 (thousands of dollars) |
|||
|---|---|---|---|---|
| Operating | Grants | Contributions | Total | |
| Emergency Management and National Security | 67,530 | 154 | 86,103 | 153,788 |
| Policing and Law Enforcement | 46,610 | 0 | 2,482 | 49,092 |
| Community Safety and Partnerships | 48,432 | 4,996 | 83,598 | 137,026 |
| Total | 162,573 | 5,150 | 172,183 | 339,906 |
Table 1: Comparison of Planned to Actual Spending
| (thousands of dollars) | 2007-08 | |||||
|---|---|---|---|---|---|---|
| Program Activity | 2005-06 Actual | 2006-07 Actual | Main Estimates | Planned Spending | Total Authorities | Total Actual |
| Emergency Management and National Security | 184,872 | 108,918 | 206,736 | 232,183 | 230,473 | 153,788 |
| Policing and Law Enforcement | 44,601 | 33,615 | 32,195 | 36,946 | 55,118 | 49,092 |
| Community Safety and Partnerships | 140,249 | 157,920 | 189,119 | 189,146 | 158,575 | 137,026 |
| Total | 369,723 | 300,453 | 428,050 | 458,275 | 444,166 | 339,906 |
| Less: Non-Respendable Revenue [1] | (8,190) | (11,480) | N/A | N/A | N/A | (5,013) |
| Plus: Cost of services received without charge [2] | 12,900 | 13,514 | N/A | 13,800 | N/A | 13,422 |
| Total Departmental Spending | 374,434 | 302,487 | 428,050 | 472,075 | 444,166 | 348,315 |
| Full-time Equivalents | 810 | 825 | N/A | 995 | N/A | 827 |
[1] Non-Respendable Revenue includes proceeds from court awards, gain on exchange, access to information requests, parking fee reimbursement and other miscellaneous revenues.
[2] Cost of services received without charge includes accommodation provided by Public Works and Government Services Canada (PWGSC), the employer’s share of employees’ insurance premiums and expenditures paid by TBS, Workers’ Compensation coverage provided by Human Resources and Social Development Canada, and services provided by the Department of Justice.
* The variance between the Main Estimates ($428M) and the Planned Spending ($458M) is mainly due to the funds earmarked in the fiscal framework for the departmental Core Emergency Management Capacity ($23M) and for the National Integrated Interagency Information System ($4M). Furthermore, the $14M decrease between Planned Spending and the Authorities is mainly due to $6M of the earmarked items in the fiscal framework that was not accessed, Supplementary Estimates (A), resulting in the reduction in authorities of $26.5M and a net increase in funding of $12M from Supplementary Estimates (B) as well as $6.6M from TBS central votes.
** Actual spending ($340M) is lower than the authorities by $104M due to less spending than anticipated on the Disaster Financial Assistance Arrangements (DFAA) program ($64M), the grants and contributions of the National Crime Prevention Centre due to the refocusing of the strategy ($20M), the inability of the Communities At-Risk program to spend due to the short time-frame to implement the program ($2M), and a lapse in the Department's Operating Budget ($16M).
*** The increase in the actual spending ($39M between 2006-07 and 2007-08) is mainly due to increased claims under the Disaster Financial Assistance Arrangements contribution program offset by a decrease in operating expenditures.
Table 2: Voted and Statutory Items
| 2007-08 Voted and Statutory Items (thousands of dollars) | |||||
|---|---|---|---|---|---|
| Vote or Statutory Item | Main Estimates | Planned Spending | Total Authorities | Total Actual | |
| 1 | Operating expenditures | 115,432 | 145,657 | 166,857 | 150,977 |
| 5 | Grants and contributions | 301,315 | 301,315 | 265,715 | 177,333 |
| S | Minister of Public Safety Canada—Salary and motor car allowance | 75 | 75 | 74 | 74 |
| S | Contributions to employee benefit plans | 11,228 | 11,228 | 11,521 | 11,521 |
| Total | 428,050 | 458,275 | 444,166 | 339,906 | |
Vote 1 – Operating expenditures
The $30M increase between the Vote 1 - Planned Spending and the Main Estimates is mainly due to the funds earmarked in the fiscal framework for the departmental Core Emergency
Management Capacity ($23M) and for the National Integrated Interagency Information System ($4M). The $16M variance between the total authorities and total actual represents the lapse
in the Operating Budget which exceeds the Department's maximum eligible Carry-Forward of $6.1M.
Vote 5 – Grants and Contributions
The variance ($88M) between the authorities and actual spending is mainly due to the estimated provincial claims under the Disaster Financial Assistance Arrangements (DFAA) not being
realized ($63.6M) and the lapse in grants and contributions of the National Crime Prevention Centre (NCPC) due to the refocusing of the strategy ($20M).
Table 3: Non-Respendable Revenue
| (thousands of dollars) | Actual 2005-06 | Actual 2006-07 | 2007-08 | |||
|---|---|---|---|---|---|---|
| Main Estimates | Planned Revenue | Total Authorities | Actual | |||
| Emergency Management and National Security | ||||||
| Refund of previous years’ expenditures | 765 | 443 | N/A | 0 | N/A | 68 |
| Adjustments to prior year’s payables | 1,962 | 2,480 | N/A | 0 | N/A | 2,006 |
| Miscellaneous revenues | 2 | 11 | N/A | 0 | N/A | 32 |
| Policing and Law Enforcement | ||||||
| Refund of previous years’ expenditures | 765 | 122 | N/A | 0 | N/A | 49 |
| Adjustments to prior year’s payables | 1,962 | 4,960 | N/A | 0 | N/A | 218 |
| Miscellaneous revenues | 3 | 11 | N/A | 0 | N/A | 11 |
| Community Safety and Partnerships | ||||||
| Refund of previous years’ expenditures | 765 | 1,313 | N/A | 0 | N/A | 341 |
| Adjustments to prior year’s payables | 1,962 | 2,126 | N/A | 0 | N/A | 2,255 |
| Miscellaneous revenues | 3 | 12 | N/A | 0 | N/A | 33 |
| Total | ||||||
| Total refund of previous years’ expenditures | 2,295 | 1,878 | N/A | 0 | N/A | 458 |
| Total adjustment to prior year’s payables | 5,886 | 9,566 | N/A | 0 | N/A | 4,479 |
| Total miscellaneous revenues | 8 | 35 | N/A | 0 | N/A | 76 |
| Total Non-Respendable Revenues | 8,190 | 11,480 | N/A | 0 | N/A | 5,013 |
Miscellaneous revenues include such items as fees collected for access to information requests, parking fee reimbursements, gain on currency rate exchange. Miscellaneous revenues are higher this year mainly due to gain on currency rate exchange.
Table 4: Sustainable Development Strategy
During fiscal year 2007-08, Public Safety Canada (PS) developed and tabled in Parliament its Sustainable Development Strategy (SDS) for 2007 09. Building on previous strategies, the SDS is fully aligned with the federal government's approach by focusing on the three mandatory federal priorities: building energy; vehicle emissions; and green procurement. In addition, PS has broadened its Strategy with a fourth priority: that of contributing to the sustainability of Canadian communities.
The SDS groups the Department's four priorities under two broad headings: greening operations - representing the sustainable direction for PS office management; and the role of Public Safety Canada in sustainable communities, increasing the sustainability of Canadian communities through the work of individual programs that support public safety and emergency management.
The Department is making steady progress in implementing the changes in culture and practices that reflect a fully integrated approach between sustainable development and departmental programs.
Briefly, in the first year of the Strategy, the Department has:
- Developed (with the assistance of PWGSC Government Consulting Services) and launched an implementation action plan;
- Established a SDS program by assigning dedicated staff to manage the SDS program and support the Leads responsible for the implementation of specific targets in the strategy, as well as provide the necessary liaison with Environment Canada and other federal SDS officials;
- Established a formal governance framework to oversee SDS activities, and monitor progress;
- Initiated the development of an evergreen communications action plan to support employee awareness and engagement in SDS activities, and launched a departmental Green Corner on Info-Central – the Department’s electronic reference centre for news and information.
The SDS 2007-09 and performance information for the entire reporting period may be viewed at http://www.publicsafety.gc.ca/abt/dpr/sds-eng.aspx#annexa.
|
1. SDS Departmental goals :
|
||
|
2. Federal SD Goal (s):
|
||
|
Proposed Federal SDS Goals |
||
|
Environmental Quality |
|
|
Sustainable Development Management | |
|
3. Department's Expected Results for 2007-08 |
4. Supporting Performance Measure(s) |
5. Achieved SDS Departmental Results for 2007-08 |
|
Establish baseline data - number of printers and personal printers in use at PSC NHQ that are set to a default duplex setting. Develop employee communications. |
Reduction in use of paper for printing/copying. Reduction of office electricity use. |
24 Duplex printers have been installed to replace single side printers, including personal printers. Energy meters have been installed at PS’s NHQ offices and are now able to provide monthly electricity use data to establish a measurement baseline. |
|
Establish baseline data—number of personal lights in use at PSC NHQ, and whether they use compact fluorescent bulbs or LEDs. Work with GWL Realty Advisors to determine energy use on PS floors. Develop employee communications on energy reduction. |
Reduction of office electricity use. |
Baseline data and performance data will be established via the new energy meters installed at PS’s NHQ offices and through an audit of personal lights and office equipment in use in the NCR to be conducted in 2008-09. The Department’s Info Central Green Corner provides information regarding alternative lighting options. |
|
Develop a GHG reduction strategy. Develop employee communications on energy reduction. |
Completion of energy audits for PS offices located in the National Capital Region by 2007-08. Completion of GHG emissions reduction strategy for PS offices located in the National Capital Region by 2007-08. |
The GHG reduction strategy for the PS offices in NCR is still under development. |
|
Identify the number and type of office equipment in use at PS NHQ. Determine proportional energy use. Develop employee communications on reduction of energy use. |
Reduction of office electricity use. |
The majority of the Department’s office equipment has been set to default to sleep mode. |
|
Establish data collection mechanism to determine number of “green” car rentals. Provide periodic reporting on “green” car rentals. Develop employee communications to encourage “green” rental practices where possible. |
Increase in number of green or fuel-efficient vehicles leased or rented by PS staff. |
An employee survey regarding green rental availability and rental practices has been developed to initiate data collection and determine where “green”
rental vehicles are feasible in departmental business activities. |
|
Establish data collection mechanism to determine number of Ecopass users Develop employee communications to promote ECOPASS program use. |
Increase in number of new users of public transit services. |
Baseline data collection initiated and data collected since September 2007 suggests an increase in the number of users of public transit services. |
|
Establish baseline data regarding the number of employees who are in carpooling arrangements. Develop employee communications to encourage use of Carpooling as a transportation option. |
Increase in number of new users of carpooling. |
An employee survey has been developed to collect voluntary data on the number of employees who are in carpooling arrangements. The survey will be conducted in 2008-09. |
|
Identify departmental staff to receive Eco-driving training on a priority basis. Develop mechanism for identifying fuel consumption data and monitoring impact of Eco-driving training. Develop employee communications to promote employee training in Eco-driving. |
Reduction of fuel purchased on PS business, per kilometre driven. |
The Department has developed its own Eco-Driving training program and is proceeding to provide training on-line. The training is mandatory for departmental drivers/chauffeurs and those who drive on departmental business and voluntary for other employees. |
|
Identify number and type of office equipment in use at PS NHQ. Determine energy usage. Develop employee communications. |
Reduced energy use in offices. |
97 % of office equipment currently in use at PS is Energy Star rated. |
|
Determine designated staff to receive green procurement training. Develop employee communications to raise awareness on green procurement and inform employees of the new green procurement training requirements. |
Increase in percentage of "green products" procured. |
Staff to be trained were identified and notified by email of expectations and requirement to have completed on-line training. Training is ongoing. |
|
Identify volume of toner cartridges that are sent to recycling. Develop employee communications to inform employees of available programs and encourage recycling. |
All toner cartridges used are remanufactured or recycled. Reduction in the number of toner cartridges sent to landfill (waste). |
95 % of toner cartridges procured are recycled product. Used toner cartridges are also diverted to recycling. |
|
Identify volume/destination of electronic office equipment being disposed of from PS NHQ to determine volume that could be further diverted for recycling. |
Increase in volume of computer and office equipment diverted to E-waste depots or returned to manufacturers. |
Used computers (95%) and printers (60%) are re-used in schools through Computers for Schools programs. The remainder are returned to crown assets. |
|
Identify potential to expand types of materials to be recycled. Determine, in consultation with PWGSC, mechanism for collection of performance data. Develop employee communications to raise awareness and engagement regarding new recycling options. |
Increase in volume of recycled materials diverted to recycling programs. |
The Department is in the process of negotiating arrangements for the collection and recycling of batteries. A waste audit conducted in 2007 for 269 Laurier shows that a little less than 30 % of building waste is being diverted to recycling programs. The audit results are
under review by the Department’s SDS Implementation Management Group. Recommendations are expected to follow, along with enhanced employee communications. |
|
Legislation adopted by parliament. |
Legislation in force. |
Target achieved. |
|
Develop the National Strategy and Action Plan for Critical Infrastructure. |
National Strategy and Action Plan for Critical Infrastructure implemented. |
The development of the National Strategy and Action plan for Critical Infrastructure is underway. |
|
Provide assistance in gathering data on the level of youth engaged. Undertake staff communications to reduce youth gang criminal activity. |
Number of youth engaged in gang prevention activities. |
6 projects have been launched which have contributed to the engagement of 424 youths in gang prevention activities. |
|
Provide assistance in gathering data on the level of programs aimed at reducing substance-related crime Support the program activities with communications activities. |
Number of projects aimed at reducing substance -related crime. |
6 projects aimed at reducing substance-related crime were identified for funding. |
|
Provide assistance in gathering data on the level of programs for at risk families/children. Support the program activities with communications activities. |
Number of projects funded to lower risk factors for at-risk families and children. |
19 projects aimed at reducing risk factors for at-risk families and children have been funded. Performance is being monitored. |
|
Develop and implement a communications plan for employee awareness and engagement in support of the SDS. |
Employee awareness and engagement in achieving SDS targets. |
A comprehensive communications plan is still under development which will be in place in 2008-09. Ad hoc communications activities include the launch of a Green Corner on the Department’s Info Central electronic information site. The Green Corner allows departmental employees to access the Department’s SDS and pull information that constitutes environment-friendly tips. Also, a coffee mug program was launched, providing each employee with a travel beverage mug bearing the Department’s name and encouraging employees to avoid unnecessary waste caused by disposable coffee cups. |
Additional Tables Available Electronically
For supplementary information, the following tables are available online at http://publiservice.tbs-sct.gc.ca/dpr-rmr/2007-2008/index-eng.asp.
2007-08 Financial Statements
Statement of Management Responsibility (unaudited)
Responsibility for the integrity and objectivity of the accompanying financial statements for the year ended
March 31, 2008 and all information contained in these statements rests with Public Safety and Emergency Preparedness Canada's management (PSEPC). These financial statements have been
prepared by management in accordance with Treasury Board accounting policies which are consistent with Canadian generally accepted accounting principles for the public sector.
Management is responsible for the integrity and objectivity of the information in these financial statements. Some of the information in the financial statements is based on management's best estimates and judgment and gives due consideration to materiality. To fulfill its accounting and reporting responsibilities, management maintains a set of accounts that provides a centralized record of the department's financial transactions. Financial information submitted to the Public Accounts of Canada and included in PSEPC's Departmental Performance Report is consistent with these financial statements.
PSEPC maintains a system of financial management and internal control designed to provide reasonable assurance that financial information is reliable, that assets are safeguarded and that transactions are in accordance with the Financial Administration Act, are executed in accordance with prescribed regulations, within Parliamentary authorities, and are properly recorded to maintain accountability of Government funds. Management also seeks to ensure the objectivity and integrity of data in its financial statements by careful selection, training and development of qualified staff, by organizational arrangements that provide appropriate divisions of responsibility, and by communication programs aimed at ensuring that regulations, policies, standards and managerial authorities are understood throughout the department.
The financial statements of PSEPC have not been audited.
 |
 |
| Deputy Minister | Elisabeth Nadeau |
| Suzanne Hurtubise | Assistant Deputy Minister, |
| Ottawa, Canada | Corporate Management Branch |
| Senior Financial Officer | |
 |
 |
Statement of Financial Position (unaudited)
| As at March 31 (in dollars) |
2008 | 2007 |
|---|---|---|
| Assets | ||
| Financial assets | ||
| Accounts receivable and advances (Note 5) | 1,445,382 | 3,302,783 |
| Non-financial assets | ||
| Tangible capital assets (Note 6) | 15,396,818 | 15,443,604 |
| Total Assets | 16,842,200 | 18,746,387 |
| Liabilities and Equity of Canada | ||
| Liabilities | ||
| Accounts payable and accrued liabilities | 93,972,985 | 77,247,783 |
| Joint research and development project | 1,370,099 | 2,048,335 |
| Vacation pay and compensatory leave | 4,210,964 | 4,195,718 |
| Employee severance benefits (Note 7) | 12,174,990 | 11,445,931 |
| Disaster financial assistance arrangements program (Note 9) | 510,512,677 | 575,525,839 |
| Total Liabilities | 622,241,715 | 670,463,606 |
| Equity of Canada | (605,399,515) | (651,717,219) |
| Total Liabilities and Equity | 16,842,200 | 18,746,387 |
| There are no contingent liabilities or contractual obligations | ||
| The accompanying notes form an integral part of these financial statements | ||
Statement of Equity (Unaudited)
| For the Year ended March 31 (in dollars) |
2008 | 2007 |
|---|---|---|
| Equity of Canada, beginning of year | (651,717,219) | (637,372,208) |
| Net cost of operations | (284,984,166) | (306,874,502) |
| Current year appropriations used (Note 3) | 339,905,885 | 300,452,729 |
| Revenue not available for spending (Note 3) | (76,170) | (35,332) |
| Refunds of prior year expenditures (Note 3) | (458,158) | (1,873,096) |
| Change in net position in the Consolidated Revenue Fund (Note 3) | (22,286,274) | (19,527,834) |
| Services received without charge from other government departments (Note 8) | 14,216,587 | 13,513,023 |
| Equity of Canada, end of year | (605,399,515) | (651,717,219) |
| The accompanying notes form an integral part of these financial statements | ||
Statement of Operations (unaudited)
| For the Year ended March 31 (in dollars) |
2008 | 2007 | |||
|---|---|---|---|---|---|
| Community Safety and Partnerships | Emergency Management and National Security | Policing and Law Enforcement | Total | ||
| Total | |||||
| Expenses | |||||
| Transfer payments (Note 4) | 86,271,339 | 20,331,970 | 2,365,981 | 108,969,290 | 143,244,475 |
| Operating expenses | |||||
| Salaries and employee benefits | 31,409,256 | 39,940,650 | 14,878,897 | 86,228,803 | 77,988,635 |
| Professional and special services | 8,190,917 | 14,454,289 | 19,607,146 | 42,252,352 | 41,236,519 |
| Accommodation | 5,608,703 | 5,503,999 | 1,951,343 | 12,064,045 | 10,225,561 |
| Equipment rentals | 705,167 | 871,584 | 9,076,389 | 10,653,140 | 11,388,175 |
| Travel and relocation | 1,896,859 | 3,442,304 | 757,044 | 6,096,207 | 5,565,122 |
| Equipment | 1,967,716 | 2,725,932 | 701,434 | 5,395,082 | 5,375,042 |
| Information | 2,302,927 | 2,101,924 | 845,256 | 5,250,107 | 4,779,120 |
| Communication | 1,142,791 | 1,586,247 | 384,928 | 3,112,966 | 3,224,814 |
| Utilities, material and supplies | 490,810 | 878,172 | 160,653 | 1,529,635 | 1,546,532 |
| Amortization | 379,239 | 938,886 | 125,180 | 1,453,305 | 771,535 |
| Repairs | 328,123 | 568,561 | 140,772 | 1,037,466 | 1,564,294 |
| Bad debt expense | 16,938 | - | - | 16,938 | - |
| Total Operating expenses | 54,439,456 | 73,012,548 | 48,639,042 | 176,091,046 | 163,665,359 |
| Total Expenses | 140,710,795 | 93,344,518 | 51,005,023 | 285,060,336 | 306,909,834 |
| Revenues | |||||
| Revenues | 32,753 | 31,992 | 11,425 | 76,170 | 35,332 |
| Net Cost of Operations | |||||
| Net Cost of Operations | 140,678,042 | 93,312,526 | 50,993,598 | 284,984,166 | 306,874,502 |
| The accompanying notes form an intergral part of these financial statements | |||||
Statement of Cash Flow (unaudited)
| For the Year ended March 31 (in dollars) |
2008 | 2007 | ||
|---|---|---|---|---|
| Operating activities | ||||
| Net Cost of Operations | 284,984,166 | 306,874,502 | ||
| Non-cash items: | ||||
| Amortization of tangible capital assets (Note 6) | (1,453,305) | (771,535) | ||
| Services received without charge from other government departments (Note 8) | (14,216,587) | (13,513,023) | ||
| Variations in Statement of Financial Position: | ||||
| Increase (decrease) in accounts receivable and advances | (1,857,401) | (438,719) | ||
| Decrease (increase) in liabilities | 48,221,891 | (27,673,086) | ||
| Cash used by operating activities | 315,678,764 | 264,478,139 | ||
| Capital investment activities | ||||
| Acquisitions of tangible capital assets (Note 6) | 1,406,519 | 14,538,328 | ||
| Cash used by capital investment activities | 1,406,519 | 14,538,328 | ||
| Financing activities | ||||
| Net cash provided by Government of Canada | (317,085,283) | (279,016,467) | ||
| The accompanying notes form an integral part of these financial statements | ||||
Notes to the Financial Statements (unaudited)
1. Authority and objectives
The Department of Public Safety and Emergency Preparedness Canada (PSEPC) was created in 2003 to ensure coordination across all federal departments and agencies responsible for national security and the safety of Canadians. The department operates under the Department of Public Safety and Emergency Preparedness Act (2005, c.10) that received Royal assent on March 23, 2005.
PSEPC contributes to the public safety of Canadians through the promotion and maintenance of a just, peaceful and safe society; it has three main core activities:
- Community Safety and Partnerships: providing national public safety leadership, protecting the security of Canadians, enhancing the role of Canadians in community safety and security;
- Emergency Management and National Security: delivering a broad range of national emergency preparedness, and critical infrastructure protection; and
- Policing and Law Enforcement: providing leadership and strategic policy advice with respect to policing policy and public safety interoperability.
2. Significant accounting policies
The financial statements have been prepared in accordance with Treasury Board accounting policies which are consistent with Canadian generally accepted accounting principles for the public sector.
Significant accounting policies are as follows:
(a) Parliamentary appropriations
PSEPC is financed by the Government of Canada through Parliamentary appropriations. Appropriations provided to the department do not parallel financial reporting according to
generally accepted accounting principles since appropriations are primarily based on cash flow requirements. Consequently, items recognized in the statement of operations and the
statement of financial position are not necessarily the same as those provided through appropriations from Parliament. Note 3 provides a high-level reconciliation between the bases of
reporting.
(b) Net Cash provided by government
PSEPC operates within the Consolidated Revenue Fund (CRF), which is administered by the Receiver General for Canada. All cash received by the department is deposited to the CRF and
all cash disbursements made by the department are paid from the CRF. The net cash provided by Government is the difference between all cash receipts and all cash disbursements
including transactions between departments of the federal government.
(c) Change in net position in the Consolidated Revenue Fund
The change in net position in the Consolidated Revenue Fund is the difference between the net cash provided by Government and appropriations used in a year, excluding the amount of
non respendable revenue recorded by the department. It results from timing differences between when a transaction affects appropriations and when it is processed through the CRF.
(d) Revenues
Revenues are accounted for in the period in which the underlying transaction or event occurred that gave rise to the revenues. Revenues include access to information program (ATIP)
fees, employees' parking fees etc.
(e) Expenses
Expenses are recorded on the accrual basis:
- Grants are recognized in the year in which the conditions for payment are met. In the case of grants which do not form part of an existing program, the expense is recognized when the Government announces a decision to make a non-recurring transfer, provided the enabling legislation or authorization for payment receives parliamentary approval prior to the completion of the financial statements;
- Contributions are recognized in the year in which the recipient has met the eligibility criteria or fulfilled the terms of a contractual transfer agreement;
- Vacation pay and compensatory leave are expensed as the benefits accrue to employees under their respective terms of employment; and
- Services provided without charge by other government departments for accommodation, the employer's contribution to the health and dental insurance plans and legal services are recorded as operating expenses at their estimated cost.
(f) Employee future benefits
Pension benefits: Eligible employees participate in the Public Service Pension Plan, a multiemployer plan administered by the Government of Canada. The department's contributions to
the Plan are charged to expenses in the year incurred and represent the total departmental obligation to the Plan. Current legislation does not require the department to make
contributions for any actuarial deficiencies of the Plan.
Severance benefits: Employees are entitled to severance benefits under labour contracts or conditions of employment. These benefits are accrued as employees render the services necessary to earn them. The obligation relating to the benefits earned by employees is calculated using information derived from the results of the actuarially determined liability for employee severance benefits for the Government as a whole.
(g) Receivables
Accounts receivables are stated at amounts expected to be ultimately realized; a provision is made for receivables where recovery is considered uncertain.
(h) Tangible capital assets
All tangible capital assets and leasehold improvements having an initial cost of $10,000 or more are recorded at their acquisition cost. The department does not capitalize
intangibles, works of art and historical treasures that have cultural, aesthetic or historical value, assets located on Indian Reserves and museum collections.
Amortization of tangible capital assets is done on a straight-line basis over the estimated useful life of the asset as follows:
| Asset Class | Amortization Period |
|---|---|
| Informatics hardware | 4 years |
| Informatics software | 3-5 years |
| Motor Vehicles | 3 years |
| Leasehold improvements | remaining term of the lease or useful life of the improvement |
(i) Measurement uncertainty
The preparation of these financial statements in accordance with Treasury Board accounting policies which are consistent with Canadian generally accepted accounting principles for the
public sector requires management to make estimates and assumptions that affect the reported amounts of assets, liabilities, revenues and expenses reported in the financial
statements. At the time of preparation of these statements, management believes the estimates and assumptions to be reasonable. The most significant items where estimates are used are
the liability for employee severance benefits and Disaster Financial Assistance Arrangements program and the useful life of tangible capital assets. Actual results could significantly
differ from those estimated. Management's estimates are reviewed periodically and, as adjustments become necessary, they are recorded in the financial statements in the year they
become known.
3. Parliamentary appropriations
PSEPC receives its funding through annual Parliamentary appropriations. Items recognized in the statement of operations and the statement of financial position in one year may be
funded through Parliamentary appropriations in prior, current or future years. Accordingly, PSEPC has different net results of operations for the year on a government funding basis
than on an accrual accounting basis. The differences are reconciled in the following tables:
(a) Reconciliation of net cost of operations to current year appropriations used:
| (in dollars) | 2008 | 2007 | |
|---|---|---|---|
| Net cost of operations | 284,984,166 | 306,874,502 | |
| Adjustments for items affecting net cost of operations but not affecting appropriations: | |||
| Add (Less): | |||
| Employee severance benefits (Note 7) | (729,059) | (1,115,942) | |
| Services received without charge from other government departments (Note 8) | (14,216,587) | (13,513,023) | |
| Accruals for disaster financial assistance (Note 9) | 65,013,162 | (16,135,805) | |
| Refund of prior year expenditures | 458,158 | 1,873,096 | |
| Adjustments to previous years' payables at year-end | 4,478,751 | 9,560,422 | |
| Vacation pay and compensatory leave | (15,246) | (308,580) | |
| Reduction for amounts paid to Justice Canada not affecting appropriation | - | (565,045) | |
| Amortization of tangible capital assets | (1,453,305) | (771,535) | |
| Bad debt expenses | (16,938) | - | |
| Revenue not available for spending | 76,170 | 35,332 | |
| Adjustments to previous years' receivables at year-end | (79,906) | - | |
| 53,515,200 | (20,941,080) | ||
| Adjustments for items not affecting net cost of operations but affecting appropriation: | |||
| Add (Less): | |||
| Acquisitions of tangible capital assets | 1,406,519 | 14,519,307 | |
| 1,406,519 | 14,519,307 | ||
| Current year appropriations used | 339,905,855 | 300,452,729 | |
(b) Appropriations provided and used:
| (in dollars) | 2008 | 2007 |
|---|---|---|
| Operating expenditures - Vote 1 | 166,856,501 | 165,546,330 |
| Grants & Contributions - Vote 5 | 265,714,745 | 291,680,000 |
| 432,571,246 | 457,226,330 | |
| Less: | ||
| Lapsed appropriations | (104,260,548) | (167,077,826) |
| 328,310,698 | 290,148,504 | |
| Minister's salary and motor car allowance | 74,322 | 75,709 |
| Contributions to employee benefits plan | 11,520,865 | 10,228,516 |
| Current year appropriations used | 339,905,885 | 300,452,729 |
(c) Reconciliation of net cash provided by Government to current year appropriations used:
| (in dollars) | 2008 | 2007 |
|---|---|---|
| Net cash provided by Government | 317,085,283 | 279,016,467 |
| Revenue not available for spending | 76,170 | 35,332 |
| Refunds of prior year expenditures | 458,158 | 1,873,096 |
| 317,619,611 | 280,924,895 | |
| Change in net position in the Consolidated Revenue Fund | ||
| Adjustments to previous years' payables at year-end | 4,478,751 | 9,560,422 |
| Bad debt expense | (16,938) | - |
| Increase (decrease) in joint research and development project | (678,236) | (1,194,596) |
| Reduction for amounts paid to Justice Canada not affecting appropriation | - | (565,045) |
| (Increase) decrease in accounts receivable | 1,857,401 | 438,719 |
| Increase (decrease) in accounts payable | 16,725,202 | 11,307,355 |
| Adjustments to previous years' receivables at year-end | (79,906) | - |
| Motor vehicle transferred from Industry Canada without charge | - | (19,021) |
| 22,286,274 | 19,527,834 | |
| Current year appropriations used | 339,905,885 | 300,452,729 |
4. Transfer payments
The following table presents details of transfer payments:
| (in dollars) | 2008 | 2007 |
|---|---|---|
| Grants | ||
| Community Safety and Partnership | 4,996,376 | 5,988,450 |
| Emergency Management and National Security | 154,000 | 590,466 |
| Contributions | ||
| Community Safety and Partnership | 81,274,963 | 79,123,667 |
| Emergency Management and National Security | 20,177,970 | 55,707,056 |
| Policing and Law Enforcement | 2,365,981 | 1,834,836 |
| Total | 108,969,290 | 143,244,475 |
5. Accounts receivable and advances
The following table presents details of accounts receivable and advances:
| (in dollars) | 2008 | 2007 |
|---|---|---|
| Receivables from other federal government departments and agencies | 1,425,813 | 3,278,031 |
| Employee advances | 19,569 | 24,752 |
| Total | 1,445,382 | 3,302,783 |
6. Tangible capital assets
| (in dollars) Cost |
Opening balance | Acquisitions | Disposals and write-offs | Closing balance |
||
|---|---|---|---|---|---|---|
| Informatics hardware | 3,406,602 | 367,483 | - | 3,774,085 | ||
| Informatics software | 147,970 | - | - | 147,970 | ||
| Motor vehicles | 121,948 | 30,722 | - | 152,670 | ||
| Leasehold improvements | 15,560,196 | 1,008,314 | - | 16,568,510 | ||
| Total cost | 19,236,716 | 1,406,519 | - | 20,643,235 | ||
| Accumulated amortization | Opening balance | Amortization | Disposals and write-offs |
Closing |
2008 |
2007 Net book Value |
| Informatics hardware | 2,013,012 | 391,154 | - | 2,404,166 | 1,369,919 | 1,393,590 |
| Informatics software | 111,835 | 15,433 | - | 127,268 | 20,702 | 36,135 |
| Motor vehicles | 95,975 | 14,548 | - | 110,523 | 42,147 | 25,973 |
| Leasehold improvements | 1,572,290 | 1,032,170 | - | 2,604,460 | 13,964,050 | 13,987,906 |
| Total accumulated amortization | 3,793,112 | 1,453,305 | - | 5,246,417 | 15,396,818 | 15,443,604 |
Amortization expense for the year ended March 31, 2008 is $1,453,305 (2007 - $771,535)
7. Employee benefits
PSEPC's employees participate in the Public Service Pension Plan, which is sponsored and administered by the Government of Canada. Pension benefits accrue up to a maximum period of 35 years at a rate of 2 percent per year of pensionable service, times the average of the best five consecutive years of earnings. The benefits are integrated with Canada/Qu�bec Pension Plans benefits and they are indexed to inflation.
Both the employees and the department contribute to the cost of the Plan. The 2007-08 expense amounts to $8,667,248 ($7,538,416 in 2006-07), which represents approximately 2.1 times the contributions by employees.
The departmental responsibility with regard to the Plan is limited to its contributions. Actuarial surpluses or deficiencies are recognized in the financial statements of the
Government of Canada, as the Plan's sponsor.
(b) Severance benefits
PSEPC provides severance benefits to its employees based on eligibility, years of service and final salary. These severance benefits are not pre-funded. Benefits will be paid from
future appropriations. Information about the severance benefits, measured as at March 31, is as follows:
| (in dollars) | 2008 | 2007 |
|---|---|---|
| Accrued benefit obligation, beginning of year | 11,445,931 | 10,329,989 |
| Expense for the year | 1,628,387 | 1,943,591 |
| Benefits paid during the year | (899,328) | (827,649) |
| Accrued benefit obligation, end of year | 12,174,990 | 11,445,931 |
8. Related party transactions
The PSEPC is related as a result of common ownership to all Government of Canada departments, agencies, and Crown corporations. The department enters into transactions with these entities in the normal course of business and on normal trade terms. Also, during the year, the department received services which were obtained without charge from other Government departments as presented in part (a).
(a) Services received without charge from other government departments
During the year the department received services without charge from other departments. These services have been recognized in the department's Statement of Operations as follows:
| (in dollars) | 2008 | 2007 |
|---|---|---|
| Accommodation | 8,376,971 | 7,680,133 |
| Employer's contribution to the health and dental insurance plans | 4,892,434 | 4,907,479 |
| Legal services provided by Justice Canada without charges | 939,338 | 917,861 |
| Worker's compensation coverage | 7,844 | 7,550 |
| 14,216,587 | 13,513,023 |
The Government has structured some of its administrative activities for efficiency and cost-effectiveness purposes so that one department performs these on behalf of all without
charge. The costs of these services, which include payroll and cheque issuance services provided by Public Works and Government Services Canada are not included as an expense in the
department's Statement of Operations.
(b) Payables outstanding at year-end with related parties:
| (in dollars) | 2008 | 2007 |
|---|---|---|
| Accounts payable to other government departments and agencies | 11,117,617 | 11,223,722 |
9. Disaster financial assistance arrangements program (DFAA)
In the event of a natural disaster in Canada, the federal government provides financial assistance to provincial and territorial governments through the Disaster Financial Assistance Arrangements Program to help meet the basic costs of response and recovery when such expenditures exceed what an individual province or territory could reasonably be expected to bear on its own. The current outstanding liabilities of $510,512,677 is the estimated cost to PSEPC of 41 natural disaster events for which the Federal Government has agreed to share the costs and final payments have not yet been made.
| (in dollars) | 2008 | 2007 |
|---|---|---|
| Opening balance | 575,525,839 | 559,390,034 |
| Disbursements | (76,385,468) | (31,679,253) |
| Accrued expenses for the year | 11,372,306 | 47,815,058 |
| Closing balance | 510,512,677 | 575,525,839 |
10. Comparative information
Comparative figures have been reclassified to conform to the current year's presentation.