ARCHIVED - Correctional Service Canada
 This page has been archived.
Archived Content
Information identified as archived on the Web is for reference, research or recordkeeping purposes. It has not been altered or updated after the date of archiving. Web pages that are archived on the Web are not subject to the Government of Canada Web Standards. As per the Communications Policy of the Government of Canada, you can request alternate formats on the "Contact Us" page.
2006-2007
Departmental Performance Report
Correctional Service Canada
The Honourable Stockwell Day, P.C., M.P.
Minister of Public Safety
Table of Contents
- SECTION 1 - OVERVIEW
- SECTION 2 - ANALYSIS OF PROGRAM ACTIVITIES
- SECTION 3 - SUPPLEMENTARY INFORMATION
- SECTION 4 - OTHER ITEMS OF INTEREST
SECTION 1 - OVERVIEW

1.1 Minister's Message
As Canada's Minister of Public Safety, I am pleased to present to Parliament the Departmental Performance Report for Correctional Service Canada (CSC) for the period ending on March 31, 2007.
The Public Safety Portfolio is responsible for public safety activities that help ensure the safety of Canadians - policing and law enforcement, corrections and conditional release of federal offenders, emergency management, national security, crime prevention and the protection of Canada's borders.
The Portfolio consists of Public Safety Canada, five agencies - the Canada Border Services Agency, the Canadian Security Intelligence Service, the Correctional Service of Canada, the National Parole Board and the Royal Canadian Mounted Police - as well as three review bodies.
The Correctional Service of Canada's 2006-2007 Report on Plans and Priorities identified four strategic priorities, which directly contribute to public safety:
- Safe transition of offenders into the community;
- Safety and security for staff and offenders in our institutions;
- Enhanced capacities to provide effective interventions for First Nations, M�tis and Inuit offenders; and
- Improved capacities to address mental health needs of offenders.
In addition, CSC has placed, and continues to place, a high priority on strengthening its management practices to improve the way it delivers on the above priorities, and more generally, on all aspects of its mandate. CSC has also committed to achieving tangible results in each of these areas, despite serious challenges due to a changing offender population and escalating costs.
The Government is committed to strengthening our criminal justice system so that we are better able to protect society, particularly against serious violent and sexual offenders. CSC has a key role to play in this regard and must contribute to the successful rehabilitation and reintegration of eligible offenders back into our communities.
I invite you to explore the content of this report and, if you have inquiries, to consult the list of CSC contacts. You can also obtain more information on CSC's website at: www.csc-scc.gc.ca.
__________________________________________
The Honourable Stockwell Day, P.C., M.P.
Minister of Public Safety
1.2 Commissioner's Message
In recent years, CSC has experienced serious challenges in delivering on our mandate and sustaining our contribution to public safety, due to the changing offender profile and escalating costs. In response, we have reviewed and adjusted funding and expenditure patterns to reallocate resources to the most urgent requirements.
In November 2006, in order to stay within our allocated budget, we introduced a series of temporary measures to reduce CSC's expenditures. The measures remained in effect until the end of the fiscal year and included such items as suspending non-essential training and equipment purchases, travel and staffing actions. As a result of the expenditure reductions a number of plans outlined in CSC's 2006-2007 Report on Plans and Priorities (RPP) were delayed. We also had to adjust our performance expectations to focus on sustaining our contribution to public safety.
In response to these funding pressures, the spring 2007 Federal Budget provided interim funding for CSC and announced an independent review of CSC. The funding provided $102 million in interim operating funding and $133 million in interim capital funding (accrual basis) over two years. This funding enabled CSC to begin to address some of our most urgent requirements.
In April 2007, Public Safety Minister Stockwell Day launched an independent review of federal corrections, which included an examination of our operational priorities, strategies and plans. The review will be completed by the end of October 2007. CSC has welcomed this review, and I am confident that it will help set the stage for the important decisions that will need to be taken about CSC's future direction and resource levels.
This Departmental Performance Report is an account of the results we achieved against planned performance expectations as set out in CSC's 2006-07 RPP. Thanks to the ongoing efforts of our highly dedicated, professional staff, CSC continues to make significant contributions to keeping Canada's communities safe.
__________________________________________
Keith Coulter
Commissioner, Correctional Service of Canada
1.3 Management Representation Statement
I submit for tabling in Parliament, the 2006-2007 Departmental Performance Report for the Correctional Service of Canada.
This document has been prepared based on the reporting principles contained in the Guide to the Preparation of Part III of the 2006-2007 Estimates: Reports on Plans and Priorities and Departmental Performance Reports.
- It adheres to the specific reporting requirements outlined in the Treasury Board Secretariat guidelines;
- It is based on the department's approved Strategic Outcome and Program Activity Architecture that were approved by the Treasury Board;
- It presents consistent, comprehensive, balanced and reliable information;
- It provides a basis of accountability for the results achieved with the resources and authorities entrusted to it; and
- It reports finances based on approved numbers from the Estimates and the Public Accounts of Canada.
__________________________________________
Keith Coulter
Commissioner, Correctional Service of Canada
1.4 Program Activity Architecture
The Program Activity Architecture (PAA) of a federal department or agency identifies the organization's strategic outcome(s), and describes the activities supporting these outcomes and how the organization is structured to manage them. It establishes activities and sub-activities, and groups them appropriately, so that the organization can tie priorities, plans and day-to-day operations to resourcing levels and better demonstrate results and value-for-money.
In all CSC activities, and all decisions that staff make, public safety is the paramount consideration. This is captured in CSC's single Strategic Outcome, which states "offenders are safely and effectively accommodated and reintegrated into Canadian communities." 1Three program activities support this Strategic Outcome: Care and Custody, Rehabilitation and Case Management, and CORCAN. Corporate Services--i.e., finance, human resources and similar functions at CSC--support all three Program Activities and resources attributable to Corporate Services have been allocated throughout the PAA.
CSC's PAA is depicted in the following chart. It presents the Strategic Outcome, the three Program Activities, their respective Sub-Activities, and, for each Sub-Activity, outlines the key results, outputs and performance indicators.
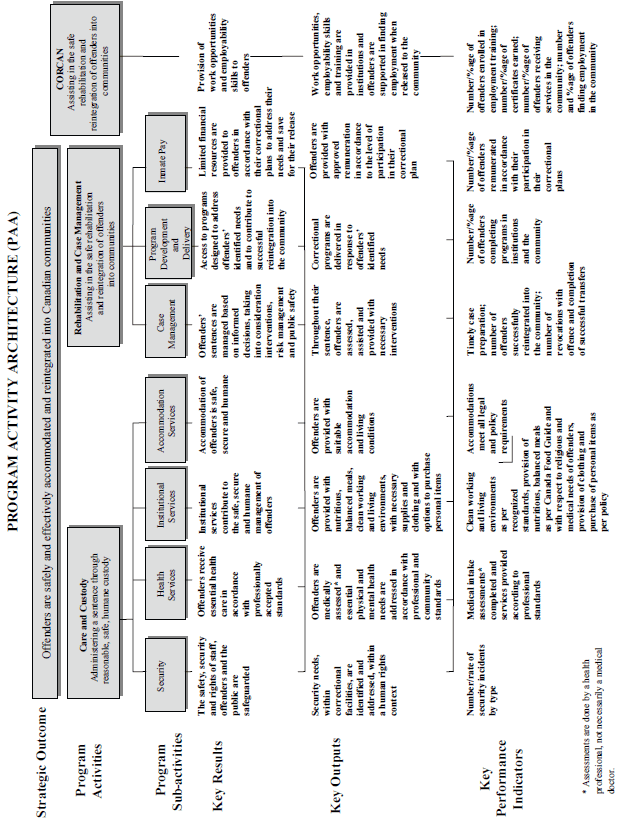
Note: An amended PAA was approved by Treasury Board in June 2007 and will be implemented in CSC's 2008-09 RPP.
1.5 Strategic Context
Operating Environment 2
The Correctional Service of Canada (CSC) is an agency within the Public Safety Portfolio. The portfolio brings together key federal agencies dedicated to public safety, including the Royal Canadian Mounted Police, the National Parole Board, the Canada Border Services Agency, the Canadian Security Intelligence Service, and three review bodies, including the Office of the Correctional Investigator.
CSC contributes to public safety through the custody and reintegration of eligible offenders. More specifically, CSC is responsible for administering court-imposed sentences for offenders sentenced to two years or more. This includes both the custodial and community supervision components of an offender's sentence. CSC also administers post-sentence supervision of offenders with Long Term Supervision Orders (LTSOs) for periods of up to ten years. 3
At the end of the 2006-07 fiscal year, CSC was responsible for approximately 13,200 federally incarcerated offenders and 8,000 offenders in the community. Over the course of the year, including all admissions and releases, CSC managed 19,500 different incarcerated offenders and 14,000 different supervised offenders in the community. 4
FEDERALLY MANAGED FACILITIES
- 58 institutions
- 16 community correctional centres
- 71 parole offices
- 4 Aboriginal healing lodges
CSC has a presence from coast to coast--from large urban centres with their increasingly diverse populations, to remote Inuit communities across the North. CSC manages institutions, treatment centres, Aboriginal healing lodges, community correctional centres and parole offices. In addition, CSC has five regional headquarters that provide management and administrative support and serve as the delivery arms of CSC's programs and services. CSC also manages an addictions research centre, a correctional management learning centre, regional staff colleges and a national headquarters (NHQ).
CORCAN, a Special Operating Agency of CSC, provides work and employability skills training to offenders in institutions in order to enhance job readiness upon their release to communities, and to increase the likelihood of successful reintegration. CORCAN also offers support services at 37 community-based employment locations across Canada to assist offenders on conditional release in securing employment. CORCAN's services are provided through partnership contracts internally (CSC and CORCAN) as well as externally with other government organizations, Non-Governmental Organizations (NGOs), and private enterprises.
Approximately 72% of CSC's 2006-07 Annual Reference Level5 was dedicated to the provision of care and custody of offenders in institutions and in communities, which includes such fixed and semi-fixed costs as security systems, salaries for correctional staff, facilities maintenance and food. The remaining 28% was allocated to rehabilitation and case management services.6
WORKFORCE
- Approximately 14,500 employees, of whom 87% work in institutions and communities
CSC employs approximately 14,500 staff7 across the country and strives to maintain a workforce that reflects Canadian society. Slightly more than 5% are from visible minority groups, approximately 4% are persons with disabilities, and approximately 7% are Aboriginal.8 These rates are at or above the labour market availability9 of workers in these operational groups for the types of employment offered by CSC. Just under 45% of CSC staff are women.
Two occupational groups, for the most part exclusive to CSC, represent over half of all staff employed in operational units. The CX, or correctional officer group, comprises 43% of staff, while another 14% of staff are in the WP category, that is, the group that includes parole and program officers who work in the institutions and in the community. The remainder of CSC's workforce reflects the variety of other skills required to operate institutions and community offices--from health professionals, to electricians, to food service staff--as well as staff providing corporate and administrative functions at the local, regional and national levels. All staff work together to ensure that the institutions operate in a secure and safe fashion and that offenders are properly supervised on release.
Challenges
The offender population continues to change, presenting significant security and reintegration challenges for CSC. In recent years, the offender population has been increasingly characterized by offenders with extensive histories of violence and violent crimes, previous youth and adult convictions, affiliations with gangs and organized crime, serious substance abuse histories and problems, serious mental health disorders, higher rates of infection with Hepatitis C and HIV and a disproportionate representation of Aboriginal people. Among other things, between 1997 and 2005 changes to the offender population profile have included: 10
- More extensive histories of involvement with the court system--roughly 9 out of 10 offenders now have previous criminal convictions;
- More extensive histories of violence and violent offences, with far more assessed as violence-prone, hostile, impulsive and aggressive on admission;
- An increase of more than 100% in the proportion of offenders who are classified as maximum security on admission--13% are now classified at this level on admission;
- An increase of 33% in the proportion of offenders with gang and/or organized crime affiliations--one in six men and one in ten women offenders, now have known affiliations;
- An increase of 14% in the proportion of offenders serving sentences for homicide--it now stands at more than one in four male offenders;
- An increase of 71% in the percentage of male offenders and 100% increase in women offenders identified at admission as having very serious mental health problems--12% of male and 25% of women offenders are now so identified;
- An increasing prevalence of learning disabilities as well as offenders with low functioning capacities;
- An increasing prevalence of substance abuse--about four out of five offenders now arrive at a federal institution with a serious substance abuse problem, with one out of two having committed their crime under the influence of drugs, alcohol or other intoxicants; and
- An increasing rate of infectious diseases--inmates now have a 7 to 10 times higher rate of HIV than the general Canadian population, and approximately a 30 times higher rate of Hepatitis C.
For a number of complex reasons, there has also been a trend towards shorter sentences, and for CSC this has meant an increase of 62% in the proportion of male offender admissions serving a sentence of less than three years.11 The result of this is an increasing polarization of the offender population, with roughly one in four male offenders and one in three women offenders serving sentences of three years or less, and roughly one in four male offenders and one in six women offenders serving life/indeterminate sentences--adding to the complexity of the management challenges in CSC's institutions.12
The trend lines for the changes in the composition of the offender population illustrate that CSC should expect this transformation to continue. Effective management of the more challenging and complex offender population requires greater resources, new training and equipment for staff, an increase in specialized services (e.g., mental health care for offenders) and more distinct and targeted interventions.
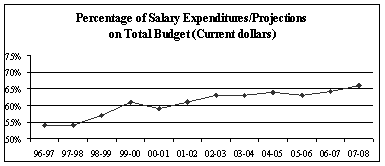
The additional expenditures required to address the changing offender population are exacerbated by the nature of CSC's operations. Close to ninety percent of CSC's expenditures are non-discretionary as prescribed by legislation (e.g., salaries, utilities, food, medical services).13 These expenditures are driven by factors beyond CSC's direct control (e.g., inflation, price fluctuations, and new employee contracts) and are escalating. For example, as the chart below illustrates, salary costs have increased from 54% to 66% over the past 11 years, because of inflation and new collective agreements with key operational staff. Such increases in non-discretionary costs leave very limited flexibility for policy and program modifications, or investments that could yield longer-term results.
Another major challenge is the basic maintenance requirements of CSC's institutions. CSC has one of the largest facility portfolios in the Government of Canada, consisting of a variety of institutions, community correctional centres and parole offices14 in communities across Canada. Together, these represent nearly 200 different sites. These facilities date from the early 1800s to the present, with most being over 40 years old. To compound this issue, significant portions of CSC's funding for capital and for Operations and Maintenance (O&M) are not adjusted to inflation, and as a result, CSC's capacity to carry out essential ongoing engineering and maintenance activities has been severely diminished.
In order to manage shortfalls in capital and O&M, CSC has routinely delayed basic maintenance in recent years. As a result, what were once routine maintenance items are now emergency maintenance issues. In addition, many older facilities require updated security equipment to continue to ensure the safety and security of staff, the public and offenders.
In this context, CSC has not been able to make the adjustments to its infrastructure that are needed to manage the current and projected offender population. With the offender population changing over recent years as described above, the reality is that there is now a multitude of sub-populations, such as gang members, offenders affiliated with organized crime, sex offenders, young offenders, violence-prone offenders, offenders with mental health problems, Aboriginal offenders, and a growing number of aged and infirm offenders--each with unique and distinct requirements. The risks and needs posed by these offenders often require separation from the rest of the inmate population, which is a significant challenge for older institutions as the original structures were built to accommodate a homogeneous inmate population. Today, for example, it is not possible for all inmates to share common outdoor, dining hall and programming spaces without threatening the safety and security of inmates and staff, but many institutions were designed and built for precisely this.
Because of the factors described above, CSC operations have been significantly impacted over the past ten years. More specifically, CSC is experiencing challenges in:
- Managing different sub-populations in maximum and medium security institutions;
- Consistently delivering timely, critical and effective programs and other interventions in institutions aimed at enhancing public safety by targeting the causes of criminal behaviour;
- Effectively supervising and managing offenders requiring higher levels of contact and surveillance in the community;
- Addressing safety concerns; and
- Managing workload and stress, at all levels.
CSC has exhausted its ability to reallocate existing resources to meet these current and future challenges. In short, the changing offender profile and the escalating costs have placed CSC in an ever more challenging position, and a significant number of plans have had to be scaled back or suspended due to lack of funds.
Shortly after the 2007-08 Report on Plans and Priorities (RPP) was finalized, the Government announced, in the Federal Budget, interim funding over the next two fiscal years to address CSC's most pressing needs, while it conducts an independent review of CSC's operational priorities, strategies and plans. Based on this review, the panel will provide the Minister of Public Safety with an independent assessment of CSC's contributions to public safety, and advice on how they might be strengthened. The panel's report is due in October 2007.
1.6 Departmental Performance
Given the challenges described above, in 2006-07 CSC implemented five priorities in order to sustain its public safety results:
- Safe transition of offenders into the community;
- Safety and security for staff and offenders in our institutions;
- Enhanced capacities to provide effective interventions for First Nations, M�tis and Inuit offenders;
- Improved capacities to address mental health needs of offenders; and
- Strengthened management practices.
In support of each priority, CSC developed a series of strategies and plans in order to ensure specific, concrete actions would be undertaken. Furthermore, CSC, for the first time, developed a series of long-term result commitments, aligned with its priorities and in support of its Strategic Outcome. These targets will ensure that CSC remains focussed on results that matter to Canadians and that its progress against its priorities, in the long term, is measurable and transparent.
The following is a summary of CSC's progress and results against each priority at the PAA Program Activity level, preceded by its planned and actual financial and human resources for 2006-07.
Total Financial Resources for the Department ($ million)
Total Human Resources
| Planned Spending 15 | Total Authorities | Actual Spending |
|---|---|---|
|
1,715.6 |
1,930.4 |
1,865.5 |
for the Department (full-time equivalents)
| Planned | Actual | Difference |
|---|---|---|
|
14,829 |
14,803 |
(26) |
CSC's Performance by Program Activity and Priority
In an effort to improve public reporting, CSC, in its 2006-07 RPP, developed and implemented a series of result commitments and measurement strategies for each of its strategic priorities. In view of the fiscal restraint measures introduced in November 2006, CSC adjusted its performance expectations to sustaining public safety results, as reflected in its 2007-08 RPP. CSC's performance is evaluated against these revised result commitments.
|
STRATEGIC OUTCOME: Offenders are safely and effectively accommodated and reintegrated into Canadian communities |
||||
| Program Activity 16 | Priority | Performance Status 17 | Planned Spending ($ millions) 2006-07 |
Actual Spending ($ millions) 2006-07 |
|---|---|---|---|---|
|
Care and Custody Expected Result: Reasonable, safe, secure and humane custody |
Safety and Security in Institutions: Safety and security for staff and offenders in our institutions. |
Successfully Met |
1,114.1 |
1,110.7 |
|
Mental Health: Improved capacities to address mental health needs of offenders. |
Successfully Met |
|||
|
Rehabilitation and Case Management Expected Result: Safe reintegration into the community when appropriate and consistent with the law |
Community Transition: Safe transition of offenders into the community. |
Successfully Met |
437.2 |
415.8 |
|
Aboriginal Offenders: Enhanced capacities to provide effective interventions for First Nations, M�tis and Inuit offenders. |
Successfully Met |
|||
| Program Activity | Priority | Performance Status | Planned Spending ($ millions) 2006-07 |
Actual Spending ($ millions) 2006-07 |
|
CORCAN Expected Result Provision of work opportunities and employability skills to offenders |
Community Transition: Safe transition of offenders into the community. |
N/A 18 |
0.0 19 |
-2.8 |
|
Corporate Management 20 Expected Result: Direction and support so that offenders are safely and effectively accommodated and reintegrated into Canadian communities |
Management: Strengthen Management Practices. |
Successfully Met |
158.1 |
171.5 |
|
Sub-Total |
1,709.4 |
1,695.2 |
||
|
Additional salary expenditures further to signed collective agreements |
Current year impact |
57.5 |
||
|
Previous years retro pay |
112.8 |
|||
|
Total |
1,709.4 |
1,865.5 |
||
Below is a detailed presentation of the results achieved against each priority in support of its associated Program Activities and Strategic Outcome, as well as information on the strategies implemented to achieve those results. Information on specific plans associated with these strategies is presented in Section 2, at the Program Sub-Activity level.
Priority: Safety and Security in Institutions
One of CSC's fundamental responsibilities is to ensure that its institutions are safe for staff and offenders. Violence and illicit drugs are not tolerated. Offenders involved in violent incidents or found in possession of, or using, illicit drugs face disciplinary actions or criminal charges. Over the years, CSC has implemented a number of measures in an effort to reduce both violence and illicit drugs in institutions. To further improve results in this area, CSC implemented three strategies in 2006-07:
Develop and implement measures to reduce violence in institutions
The increasingly complex offender population presents significant new challenges requiring significant enhancements to security intelligence capacity. This increased capacity was aimed at enhancing CSC's ability to mitigate risks posed by offenders and contribute to providing a safer environment for their effective rehabilitation.
Develop and implement additional measures to reduce illicit drugs in institutions
As indicated earlier, the availability and use of illicit drugs are not compatible with secure environments and effective and safe reintegration. This strategy was aimed at curtailing the supply, use and impacts of drugs in institutions.
Enhance staff safety
This strategy was aimed at ensuring the protection of staff, which required ongoing adjustments to security and interventions to address the changing offender profile.
Safety and Security in Institutions: Results
Result Commitment 21
Preventing an increase in violent behaviour within institutions, as measured by the rate of major security incidents.
Preventing an increase in disrespectful and assaultive behaviour within institutions, as measured by:
- The rate of assaults on staff;
- The rate of assaults on offenders;
- The rate of injuries to staff caused by offenders; and
- The rate of injuries to offenders caused by offenders.
Preventing an increase in illicit drugs within institutions, as measured by the percentage of offenders testing positive during random urinalysis tests.
As the following chart indicates, there was a slight increase from 2005-06 in the rate of major security incidents in CSC institutions:
Major Institutional Incidents 22
| 02-03 | 03-04 | 04-05 | 05-06 | 06-07 | ||
|---|---|---|---|---|---|---|
|
Major Incidents |
year |
133 |
135 |
86 |
92 |
109 |
|
3-year average |
141.7 |
133.0 |
118.0 |
104.3 |
95.7 |
|
|
Institutional Flowthrough 23 |
year |
18588 |
18532 |
18623 |
19039 |
19490 |
|
3-year average |
18628 |
18567 |
18581 |
18731 |
19051 |
|
|
Rate |
year |
0.7% |
0.7% |
0.5% |
0.5% |
0.6% |
|
3-year average |
0.8% |
0.7% |
0.6% |
0.6% |
0.5% |
Source: Corporate Reporting System (July 31, 2007). Institutional Flowthrough as of April 8, 2007.
As for assaults, there has been a steady decline in the rate of assaults on staff by inmates over the last five years, as demonstrated by the 3-year moving average: 24
Staff Assaults (by Inmates)
| 02-03 | 03-04 | 04-05 | 05-06 | 06-07 | ||
|---|---|---|---|---|---|---|
|
Staff Assaults |
year |
465 |
367 |
293 |
375 |
355 |
|
3-year average |
478.7 |
446.7 |
375.0 |
345.0 |
341.0 |
|
|
Institutional Staff 25 |
year |
11277 |
11480 |
11260 |
11247 |
11339 |
|
3-year average |
10985 |
11267 |
11339 |
11329 |
11282 |
|
|
Rate |
year |
4.1% |
3.2% |
2.6% |
3.3% |
3.1% |
|
3-year average |
4.4% |
4.0% |
3.3% |
3.0% |
3.0% |
Source: Offender Management System (April 8, 2007).
Given the more challenging offender profile, the increasing offender population and the relatively stable employee population, this is a significant achievement. On the other hand, the rate of assaults among inmates has not declined in recent years.
Inmate Assaults (by Inmates)
| 02-03 | 03-04 | 04-05 | 05-06 | 06-07 | ||
|---|---|---|---|---|---|---|
|
Inmate Assaults |
year |
540 |
468 |
463 |
558 |
556 |
|
3-year average |
530.7 |
506.0 |
490.3 |
496.3 |
525.7 |
|
|
Institutional Flowthrough |
year |
18588 |
18532 |
18623 |
19039 |
19490 |
|
3-year average |
18628 |
18567 |
18581 |
18731 |
19051 |
|
|
Rate |
year |
2.9% |
2.5% |
2.5% |
2.9% |
2.9% |
|
3-year average |
2.8% |
2.7% |
2.6% |
2.6% |
2.8% |
Source: Offender Management System (April 8, 2007). Institutional Flowthrough as of April 8, 2007.
Similarly, there has been a steady decline in the rate of staff injuries due to assaults by inmates since 2002-03. For the same period, the rate of inmate injuries due to assaults by inmates has remained relatively constant, although in absolute numbers, there has been a steady increase in inmate injuries due to assaults by inmates, over the last five years. 26
Staff Injuries due to Assaults by Inmates
| 02-03 | 03-04 | 04-05 | 05-06 | 06-07 | ||
|---|---|---|---|---|---|---|
|
Staff Injuries |
year |
90 |
90 |
67 |
91 |
85 |
|
3-year average |
95.3 |
91.3 |
82.3 |
82.7 |
81.0 |
|
|
Institutional Staff |
year |
11277 |
11480 |
11260 |
11247 |
11339 |
|
3-year average |
10985 |
11267 |
11339 |
11329 |
11282 |
|
|
Rate |
year |
0.8% |
0.8% |
0.6% |
0.8% |
0.7% |
|
3-year average |
0.9% |
0.8% |
0.7% |
0.7% |
0.7% |
Source: Offender Management System (April 8, 2007).
Inmate Injuries due to Assaults by Inmates
| 02-03 | 03-04 | 04-05 | 05-06 | 06-07 | ||
|---|---|---|---|---|---|---|
|
Inmates Injuries |
year |
483 |
423 |
435 |
491 |
498 |
|
3-year average |
483.7 |
457.3 |
447.0 |
449.7 |
474.7 |
|
|
Institutional Flowthrough |
year |
18588 |
18532 |
18623 |
19039 |
19490 |
|
3-year average |
18628 |
18567 |
18581 |
18731 |
19051 |
|
|
Rate |
year |
2.6% |
2.3% |
2.3% |
2.6% |
2.6% |
|
3-year average |
2.6% |
2.5% |
2.4% |
2.4% |
2.5% |
Source: Offender Management System (April 8, 2007). Institutional Flowthrough as of April 8, 2007.
The presence of any illicit drugs in institutions continues to be an ongoing concern. Despite the fact that the rate of offenders testing positive in urinalysis has steadily but marginally declined over the past five years, as reflected in the three-year moving average, the rate of positive test results has increased between 2005-06 and 2006-07 This, despite the fact that the offender refusal rate for urinalysis testing has been declining.
Random Urinalysis Test
Positive Results
| 02-03 | 03-04 | 04-05 | 05-06 | 06-07 | ||
|---|---|---|---|---|---|---|
|
Positive results |
year |
762 |
765 |
728 |
764 |
837 |
|
3-year average |
775 |
748 |
752 |
752 |
776 |
|
|
Samples tested |
year |
5793 |
5733 |
5932 |
6351 |
6737 |
|
3-year average |
5778 |
5765 |
5819 |
6005 |
6340 |
|
|
Rate |
year |
13.2% |
13.3% |
12.3% |
12.0% |
12.4% |
|
3-year average |
13.4% |
13.0% |
12.9% |
12.5% |
12.2% |
Source: Corporate Reporting System (April 8, 2007).
Random Urinalysis Test
Refusal Rate
| 02-03 | 03-04 | 04-05 | 05-06 | 06-07 | ||
|---|---|---|---|---|---|---|
|
Refusals |
year |
929 |
835 |
802 |
893 |
802 |
|
3-year average |
945 |
917 |
855 |
843 |
832 |
|
|
Samples requested |
year |
6822 |
6655 |
6829 |
7413 |
7759 |
|
3-year average |
6815 |
6778 |
6769 |
6966 |
7334 |
|
|
Rate |
year |
13.6% |
12.5% |
11.7% |
12.0% |
10.3% |
|
3-year average |
13.9% |
13.5% |
12.6% |
12.1% |
11.3% |
Source: Corporate Reporting System (April 8, 2007).
Priority: Mental Health
CSC provides a full-spectrum response to the broad and multi-dimensional mental health needs of offenders. CSC has developed an overarching Mental Health Strategy that has five 27 components. Late in 2006-07, the Government of Canada provided two-year funding for three components of CSC's Mental Health Strategy, namely: clinical screening and assessment, provision of primary mental health care in all CSC institutions, and consistent standards and approach in CSC mental health treatment. 28 Implementation in these areas began in 2007-08.
In addition, in 2006-07 CSC continued implementation of the one previously funded component of its Mental Health Strategy, namely, the Community Mental Health Initiative. 29 The goal of the Initiative is to ensure that inmates requiring mental health services receive the best possible preparation for reintegration, and can transition to the community mental health system at the appropriate time with continuity of support. The funds are to be used toward discharge planning; transitional care; specialized mental health staff working out of selected parole offices to provide support to offenders with mental health disorders in Community Correctional Centres (CCCs) and Community Residential Facilities (CRFs); annual mental health training for staff of selected parole offices, CCCs and CRFs; and funds for specialized services such as psychiatric and psychological interventions.
Mental Health: Results
Result Commitment 30
Improved correctional results for federal offenders with mental disorders, as measured by:
- The percentage of federal offenders with mental disorders whose parole has been revoked, with or without a new conviction or charge, while under CSC supervision; 31
- The percentage of federal offenders with mental disorders returning to federal custody within two years of the end of their sentence; and
- The percentage of federal offenders with mental disorders convicted of an offence within five years of the end of their sentence. 32
The following table shows the rate of offenders with identified mental health disorders whose parole has been revoked, while under CSC supervision, with or without a new conviction or charge. While the rate has been fluctuating over the past few years, the three-year moving average shows an overall increase since 2002-03 (from 52.1% to 56.1%).
Mental Health Cases
Revocation while on Supervision
| 02-03 | 03-04 | 04-05 | 05-06 | 06-07 | ||
|---|---|---|---|---|---|---|
|
Revocations |
year |
286 |
398 |
464 |
498 |
616 |
|
3-year average |
186 |
294 |
383 |
453 |
526 |
|
|
Release Flowthrough |
year |
517 |
695 |
806 |
936 |
1072 |
|
3-year average |
358 |
528 |
673 |
812 |
938 |
|
|
Rate |
year |
55.3% |
57.3% |
57.6% |
53.2% |
57.5% |
|
3-year average |
52.1% |
55.7% |
56.9% |
55.8% |
56.1% |
Source: Offender Management System (April 8, 2007).
The following table displays the percentage of federal offenders with a mental health disorder returning to federal custody within two years following the end of their sentence, due to a new offence. Apart from a sharp decline from 2000-01 to 2001-02, the three-year averages in the last four years show a steady increase in the rate of return to custody. This suggests that offenders may have more serious and longer-term mental health problems and/or that the community's capacity for support of mental health cases has been eroding.
Mental Health Cases
Return to Federal Custody for New Offence within 2 Years post- Warrant Expiry Date (WED)
| 00-01 | 01-02 | 02-03 | 03-04 | 04-05 | ||
|---|---|---|---|---|---|---|
|
Re-Admission |
year |
4 |
7 |
20 |
32 |
33 |
|
3-year average |
1 |
4 |
10 |
20 |
28 |
|
|
Offenders Reaching WED |
year |
21 |
113 |
189 |
231 |
267 |
|
3-year average |
8 |
45 |
108 |
178 |
229 |
|
|
Rate |
year |
19.0% |
6.2% |
10.6% |
13.9% |
12.4% |
|
3-year average |
17.4% |
8.1% |
9.6% |
11.1% |
12.4% |
Source: Offender Management System (April 8, 2007).
The provision of mental health services is a legislative requirement and a corporate priority for CSC. When mental health needs are addressed through assessment and treatment, public safety and the safety of CSC's institutions are enhanced.
In May 2006, the Standing Senate Committee on Social Affairs, Science and Technology released its report on mental health, mental illness, and addiction, titled Out of the Shadows at Last.33 The report made 118 recommendations, of which 11 relate directly to CSC. The Committee's primary goal for federal offenders is to raise the standard of mental health care within correctional institutions (and in post-release settings) to be equivalent to that available to members of the general public. This goal is reflected in CSC's Mental Health Strategy, which also incorporates many of the Committee's recommendations.34
Recognizing the need to improve the quality of mental, as well as physical, health services provided to inmates, CSC announced, in 2006-07, a new governance structure for CSC Health Services, which came into effect in August 2007. The Health Services branch was promoted to a sector, headed by a dedicated Assistant Commissioner, and organized to include Clinical Services; Public Health; Mental Health; Planning, Policy, and Quality Improvement.
Priority: Community Transition
CSC's ultimate goal is to enhance public safety through reduced re-offending. There are serious challenges in this regard. Reoffending is a major problem as about thirty-six percent of federal offenders will be convicted of a new crime within two years of completing their sentence, the majority receiving some type of provincial sentence (i.e., less than two years).35 That said, the majority of offenders will one day return to the community and CSC must focus on preparing offenders for a safe transition. In 2006-07, CSC implemented four strategies in support of this priority:
Enhance supervision and monitoring tools for higher-risk offenders in the community
This strategy was aimed at fostering closer supervision for certain groups of offenders and the provision of targeted programs and services, in partnership with community organizations, provincial and territorial jurisdictions, and police services, in order to enhance the potential of offenders for safe reintegration. Targeted groups of offenders included those with a propensity for violence, those on statutory release with or without a residency condition, those under a Long Term Supervision Order, and offenders with a significant mental health disorder.
Adapt the assessment process at reception (intake) for shorter sentences
This strategy was designed to adapt the intake assessment process for offenders with shorter sentences, in particular for those with a propensity for violence, so that a correctional plan can be rapidly established and the offenders' criminogenic factors addressed in a timely fashion.
Amend case management and programming approaches to provide timely and purposeful interventions for shorter sentences
The purpose of this strategy was to amend the case management approach for offenders serving shorter sentences. Timely and appropriate interventions are critical to safe reintegration into the community.
Enhance the role of Community Correctional Centres (CCCs) in managing the transition to the community
Throughout 2006-07, CSC conducted a comprehensive analysis of the role and capacity of CCCs in addressing the needs and risks presented by the changing offender profile, and in particular, higher-needs offenders.
Community Transition: Results
Result Commitment 36
Preventing an escalation in violent re-offending 37 by federal offenders returning to the community, as measured by:
- The percentage of federal offenders in communities convicted 38 of a violent offence while under CSC supervision;
- The percentage of federal offenders convicted of a violent offence and returning to federal custody within two years of the end of their sentence; and
- The percentage of federal offenders convicted of a violent offence within five years of the end of their sentence.
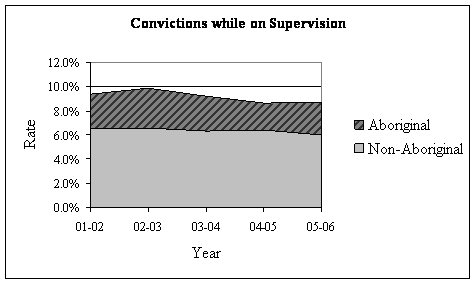
As the following table demonstrates, since 2003-04, there has been a steady but marginal decline in the rate of violent convictions of offenders under CSC supervision in the community.
Re-Offending with a Violent Conviction while on Supervision 39
| 01-02 | 02-03 | 03-04 | 04-05 | 05-06 | ||
|---|---|---|---|---|---|---|
|
Violent Convictions |
year |
249 |
250 |
246 |
232 |
192 |
|
3-year average |
266 |
262 |
248 |
243 |
223 |
|
|
Release Flowthrough |
year |
16611 |
16382 |
16168 |
16156 |
16368 |
|
3-year average |
16870 |
16656 |
16387 |
16235 |
16231 |
|
|
Rate |
year |
1.5% |
1.5% |
1.5% |
1.4% |
1.2% |
|
3-year average |
1.6% |
1.6% |
1.5% |
1.5% |
1.4% |
Source: Offender Management System (April 8, 2007).
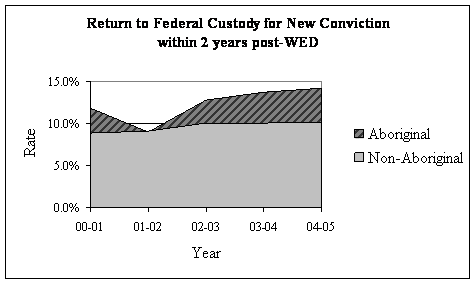
Although CSC has achieved a small decline in the violent re-offending while under supervision, there has been an increase in violent re-offending post-warrant expiry. This underscores the need to ensure that supervised offenders receive the skills and motivation that will enable them to live as law-abiding citizens in the vulnerable years following the end of their supervision period. It also points to the need for increased collaboration with community partners to ensure continuity of support upon sentence completion to prevent recidivism.
Return to Federal Custody with Violent Conviction within 2 years post-WED
| 00-01 | 01-02 | 02-03 | 03-04 | 04-05 | ||
|---|---|---|---|---|---|---|
|
Re-Admission |
year |
233 |
222 |
242 |
233 |
271 |
|
3-year average |
228 |
221 |
232 |
232 |
249 |
|
|
Offenders Reaching WED |
year |
4636 |
4690 |
4634 |
4523 |
4543 |
|
3-year average |
4529 |
4576 |
4653 |
4616 |
4567 |
|
|
Rate |
year |
5.0% |
4.7% |
5.2% |
5.2% |
6.0% |
|
3-year average |
5.0% |
4.8% |
5.0% |
5.0% |
5.4% |
Source: Offender Management System (April 8, 2007).
Return to Federal Custody with Violent Conviction within 5 years post-WED
| 97-98 | 98-99 | 99-00 | 00-01 | 01-02 | ||
|---|---|---|---|---|---|---|
|
Re-Admission |
year |
462 |
456 |
377 |
438 |
412 |
|
3-year average |
469 |
462 |
432 |
424 |
409 |
|
|
Offenders Reaching WED |
year |
4650 |
4550 |
4401 |
4636 |
4690 |
|
3-year average |
4734 |
4648 |
4534 |
4529 |
4576 |
|
|
Rate |
year |
9.9% |
10.0% |
8.6% |
9.4% |
8.8% |
|
3-year average |
9.9% |
9.9% |
9.5% |
9.4% |
8.9% |
Source: Offender Management System (April 8, 2007).
While not identified in CSC's result commitments, the rate of non-violent re-offending both under supervision and under post-warrant expiry is also of concern to CSC. Data on this is presented in Section 4 of this report.
Research shows that society is best protected when an offender is gradually reintegrated into society through supervised release, rather than released at the end of sentence with no controls--no supervision or constraints; no opportunity to revoke the release on indication of problematic behaviour; and no opportunity to reassess and intervene in a manner that would reduce the potential for re-offending.40 In light of this, and the general trend in recent years toward lower rates of recidivism while under CSC supervision compared to after sentence completion, CSC must continue to invest in refining its case management processes.
Priority: Aboriginal Offenders
CSC is committed to addressing the needs of Aboriginal offenders --who are over-represented in the federal correctional system -- through enhancing its capacities to provide effective interventions for First Nations, M�tis and Inuit offenders. Throughout 2006-07, CSC implemented four strategies aimed at narrowing the gap in terms of correctional results between Aboriginal and non-Aboriginal offenders. These were:
Develop and implement culturally appropriate interventions
The intent of this strategy was to address the specific criminogenic needs of Aboriginal offenders through the development and implementation of actions at both the national and regional levels based on the continuum of care model.41
Address CSC internal systemic barriers and develop cultural competence
This strategy was aimed at making CSC more capable of addressing the specific needs of Aboriginal offenders by making the organization more aware and representative of Aboriginal cultures.
Improve the continuum of care for Aboriginal women offenders
This strategy was aimed at improving correctional results through initiatives that would enhance the continuum of care for Aboriginal women offenders.
Enhance collaboration
This strategy was aimed at enhancing horizontal collaboration with the objective of closing the gap in the "life chances" of Aboriginal offenders. It also endeavoured to position CSC to take advantage of partnerships and opportunities among governmental and Non- Governmental Organizations to support Aboriginal offenders in communities, including those returning to urban areas.
Aboriginal Offenders: Results 42
Result Commitment 43
Preventing the gap between Aboriginal and non-Aboriginal correctional results from widening, as measured by:
- The percentage of Aboriginal and non-Aboriginal federal offenders convicted of, or charged with, violent or non-violent offences in communities while under CSC supervision;
- The percentage of Aboriginal and non-Aboriginal federal offenders convicted of a violent or non-violent offence and returning to federal custody within two years of the end of their sentence; and
- The percentage of Aboriginal and non-Aboriginal federal offenders convicted of violent or non-violent offences within five years of the end of their sentence.
The following tables show the gaps in correctional results between Aboriginal and non-Aboriginal offenders. More detailed statistical information is presented in Section 4 of this report.
As evidenced by the above performance results, a considerable gap still remains with respect to reoffending, both while the offenders are under CSC supervision in the community, and following the completion of their sentence. As such, reducing recidivism among Aboriginal Offenders will continue to be a priority for CSC.
In an effort to address this issue, CSC's Strategic Plan for Aboriginal Corrections 2006-2011 44 was completed in October 2006. The Strategic Plan builds on the learning from Aboriginal engagement in correctional program and service delivery since 2000-01. It responds to the needs and aspirations of Aboriginal people within existing correctional legislation, and provides the framework to enhance capacities to provide effective interventions for First Nations, M�tis and Inuit offenders.
CSC is at a critical juncture in developing the infrastructure to move forward on this priority. Greater investment and focus on full implementation of the Strategic Plan, in particular the Aboriginal continuum of care, is needed in order to influence the rates of re-incarceration and reoffending. However, given infrastructure needs and other pressures throughout the organization, there are limited options for reallocation of resources to support such implementation. Only once the continuum of care is fully implemented will it be possible to assess the full potential and effectiveness of Aboriginal-specific approaches in addressing the needs of Aboriginal offenders, their communities and their neighbourhoods.
A June 2006 Statistics Canada report, Victimization and Offending among the Aboriginal Population in Canada, 45 suggests that social disruption, particularly on-reserve, will remain a significant challenge for many Aboriginal communities. Social marginalization, particularly in large urban centres, will also continue to be a barrier to addressing disparities between Aboriginal and non-Aboriginal Canadians, including offenders. The reality is that the majority of Aboriginal offenders are returning to communities that face major challenges in supporting or sustaining them.
Launching the new five-year Strategic Plan for Aboriginal Corrections is a critical step forward in CSC's efforts. At the same time, it is also part of a larger attempt to reduce recidivism in federal offenders as a whole.
Priority: Strengthened Management Practices
CSC recognizes that its success in achieving correctional results over the coming years in its priority areas depends on developing strong management practices.
Four strategies were developed for 2006-07 in pursuit of this priority:
Clarify roles and responsibilities
This strategy is aimed at fostering strong teamwork that is based on a clear understanding of the roles and responsibilities across boundaries and disciplines within CSC. Defining roles and responsibilities also reinforces accountability for results, increases transparency and addresses ambiguities and potential overlaps within different parts of the organization, ensuring greater cost efficiency.
Enhance the values and ethics program and results
CSC committed to a strengthened values and ethics program that responds to the nature of the correctional environment and the Values and Ethics Code for the Public Service, in order to create a stronger values-based workplace. This strategy was aimed at developing and implementing integrated plans that build on existing programs to ensure that values and ethics are more fully incorporated into decision-making practices and understood by employees at all levels within CSC.
Improve internal communications
This strategy was aimed at building greater capacity for effective internal communications between and across all levels of the organization. The goal was to develop a strategic framework and action plan and the appropriate products, services and tools to support and enhance CSC's internal communications capacity.
Enhance the management of infrastructure needs and address facility rust-out
This strategy was aimed at developing a comprehensive investment strategy that rigorously examines CSC's infrastructure needs and population management requirements associated with the changing offender profile as well as increases in construction and maintenance costs.
Strengthened Management Practices: Results
CSC committed to the following target and measurement strategy for 2006-07:
Result Commitment
A stronger contribution to public safety in priority areas, as measured by:
- Achievement of targeted operational results in priority areas, as defined in previous sections;
- Improvements in management practices as reflected in Management Accountability Framework assessments by the Treasury Board Secretariat (TBS) and responses to employee surveys. 46
The Management Accountability Framework (MAF) sets out the Treasury Board's expectations of senior public service managers for good public service management. The MAF is structured around 10 key elements that collectively define "management" and establish the expectations for good management of a department or agency. 47
TBS's Management Accountability Framework assessment for 2006-07 was generally positive. TBS noted particular improvement in the areas of:
- Effectiveness of financial management and control; and
- Effectiveness of Corporate Risk Management.
Progress was also noted in the areas of:
- Values and Ethics;
- Development and implementation of a long-term resourcing strategy; and
- Strengthened leadership with the National Parole Board.
TBS indicated that CSC should continue to work on those three areas; more specifically, that CSC should:
- Implement the Year One action items of the Human Resources Strategic Plan, the National Values and Ethics Strategy, and the Informal Conflict Management System; and
- Fully implement the new Shared Services Partnership with the National Parole Board.
1.7 Link to the Government of Canada Outcome Areas 48
A "whole-of-government" framework groups all federal departments' Strategic Outcomes and Program Activities into 13 long-term benefits to Canadians--referred to as "Government of Canada Outcomes"--in three broad sectors: social, economic, and international.
Through three Program Activities-- Care and Custody, Rehabilitation and Case Management and CORCAN --CSC contributes directly and indirectly to the social affairs sector, under the Government of Canada Outcome, "Safe and Secure Communities".
| Government of Canada Outcome | CSC's Direct Contribution | CSC's Indirect Contribution |
|---|---|---|
|
Canada's Social Affairs Safe and Secure Communities |
|
|
CSC's third Program Activity, CORCAN, also contributes to the economic sector, under the Government of Canada Outcome, "Income Security and Employment for Canadians."
| Government of Canada Outcome | CSC's Direct Contribution | CSC's Indirect Contribution |
|---|---|---|
|
Canada's Economic Affairs Income Security and Employment for Canadians |
|
|
In addition, CSC contributes to the Government's cross-cutting theme on Aboriginal peoples, in the following ways:
|
Directly |
Indirectly |
|
|
CSC makes an important, but more indirect, contribution to other Government of Canada Outcomes, notably, "Healthy Canadians", via infectious diseases surveillance and control within federal institutions; provision of harm reduction programs that reduce the impact of high-risk behaviour; and interdiction procedures that reduce the amount of illicit drugs getting into institutions.
SECTION 2 ANALYSIS OF PROGRAM ACTIVITIES
This section presents each Program Activity in greater detail vis-�-vis results expected and results achieved. For each Program Activity, the plans associated with the priorities and strategies discussed in Section 1 are presented at the Program Sub-Activity level. The table below is a cross-walk that shows where each plan associated with CSC's priorities and strategies is situated within the Program Activity Architecture (PAA).
| CSC Strategic Priority |
Strategies | Plans | PAA: Related Sub-Activity49 |
|---|---|---|---|
|
Safe transition of offenders into the community |
Enhance supervision and monitoring tools for higher-risk offenders in the community |
Community Supervision |
|
|
Electronic Monitoring |
|||
|
Partnerships |
|||
|
Employment Continuum |
|||
|
Community Programs |
|||
|
Adapt the assessment process at reception (intake) for shorter sentences |
Offender Intake Assessment |
||
|
Security Classification Tools (for women offenders) |
|||
|
Amend case management and programming approaches to provide timely and purposeful interventions for shorter sentences |
Targeted Interventions |
||
|
Violence Prevention Program for Women Offenders |
|||
|
Enhance the role of Community Correctional Centres (CCCs) in managing the transition to the community |
Role of Community Correctional Centres |
| CSC Strategic Priority |
Strategies | Plans | PAA: Related Sub-Activity |
|---|---|---|---|
|
Safety and security for staff and offenders in our institutions |
Develop and implement measures to reduce violence in institutions |
Strategic Intelligence |
|
|
Develop and implement additional measures to reduce illicit drugs in institutions |
Drug Interdiction |
||
|
Strategic Plan |
|||
|
Enhance staff safety |
Front-line Roles and Responsibilities |
||
|
Assaultive Behaviour |
|||
|
Staff Safety |
|||
|
Enhanced capacities to provide effective interventions for First Nations, M�tis and Inuit offenders |
Develop and implement culturally appropriate interventions |
Aboriginal Correctional Programs |
|
|
Population Management |
|||
|
Aboriginal Reintegration |
|||
|
Address CSC internal systemic barriers and develop cultural competence |
Systemic Barriers |
||
|
Aboriginal Employee Representation |
|||
|
CSC Cultural Competence |
|||
|
Improve the continuum of care for Aboriginal women offenders |
Assessment |
||
|
Programming |
|||
|
Interventions |
|||
|
Knowledge |
|||
|
Enhance collaboration |
Internal Collaboration |
||
|
Horizontal Collaboration |
|||
|
Aboriginal Community Engagement |
| CSC Strategic Priority |
Strategies | Plans | PAA: Related Sub-Activity |
|---|---|---|---|
|
Improved capacities to address mental health needs of offenders |
Implement Community Mental Health Initiative |
Refer to Section 2.1.2 |
|
|
Strengthened management practices |
Clarify roles and responsibilities |
Succession Management |
|
|
Operational Responsibilities |
|||
|
Program Evaluation |
|||
|
Enhance the values and ethics program and results |
Values and Ethics Unit |
||
|
National Values and Ethics Program |
|||
|
National Informal Conflict Management System (ICMS) |
|||
|
Strengthened Independent Audit Function |
|||
|
Improve internal communications |
Strategy and Action Plan |
||
|
New Products, Tools and Services |
|||
|
Cross-Sectional Staff Survey |
|||
|
Enhance the management of infrastructure needs and address facility rust-out |
Investment Strategy Development |
||
|
An Updated Comprehensive Capital Plan |
2.1 Care and Custody Program Activity
Description of Program Activity: Administering a sentence through reasonable, safe and humane custody.
CSC is mandated to provide custody to offenders in a secure and safe environment while preparing them for eventual release. As CSC institutions are, by necessity, isolated from society, CSC provides for many of the day-to-day needs of offenders in custody. The Care and Custody Program Activity includes a wide range of activities that address health and safety issues, including providing basics such as food, clothing and mental and physical health care. It also addresses security within (as well as outside) the walls of institutions, including secure facilities, drug interdiction, and appropriate control practices to prevent incidents such as an escape or an assault on staff or inmates.
The Care and Custody Program Activity is comprised of the following key Sub-Activities: Security, Health Services, and Accommodation Services.50
Expected Result: Reasonable, safe, secure and humane custody.
For fiscal year 2006-07, the corporate priorities associated with the Care and Custody Program Activity were:
- Safety and security for staff and offenders in our institutions;
- Improved capacities to address mental health needs of offenders; and
- Strengthened management practices.
The total planned and actual spending, and human resource allocations, related to this Program Activity were:
2006-07 Total Financial Resources ($ millions)
| Planned Spending | Authorities | Actual Spending |
|---|---|---|
|
1,228.1 |
1,418.8 |
1,397.9 |
2006-07 Total Human Resources (full-time equivalents)
|
Planned |
Actual |
Difference |
|---|---|---|
|
10,406 |
10,454 |
(48) |
2.1.1 Security Sub- Activity
Planned Spending for 2006-07: $581.4 million
Actual Spending for 2006-07: $790.6 million
Expected Result: The safety, security and rights of staff, offenders and the public are safeguarded.
CSC must ensure the safety of staff, offenders and visitors in institutions. This is achieved through preventing violence (including assaults by inmates), intercepting illicit drugs, and enhancing safety and security measures.
2.1.1.1 Plans and Results
Enhance Strategic Intelligence
Maximizing the use of technology for timely, accurate, and confidential information sharing is crucial to mitigating safety and security risks in institutions.
SINet software was installed in institutions to allow encrypted exchange of information among Security Intelligence Officers (SIOs). This allows SIOs to send documents and exchange e-mails in real time that contain 'Protected C' information,51 both between two SIOs and by setting up a forum for input from more than two SIOs.
This exchange helps interrupt inmate plans to get drugs into an institution and prevents escapes or disturbances that would endanger those within the correctional environment or community. When shared with community law enforcement partners, the information obtained may also assist in preventing or solving criminal activity in the community.
Develop and Implement a Strategic Plan
Preventing the introduction of drugs into an institution has been an ongoing challenge for all modern correctional systems, including CSC. While keeping drugs out of institutions is a high priority, a strategy is needed that recognizes efforts are also required in the areas of treatment, enforcement and harm reduction when drugs do get inside or when legitimate medications are abused.
An overall Strategic Plan was drafted, identifying strategies for communication, training, programs and other future actions CSC can pursue to create drug-free institutions and mitigate harm when drugs are available. The first stage of the Plan is to enhance CSC's interdiction efforts to prevent drugs from entering the institution. Other elements of the Plan will be introduced as resources are realigned or additional resources are identified.
Strengthening CSC's Drug Interdiction Plan
Building on the experiences to date, and the recommendations of the Audit of Drug Interdiction Activities,52 an enhanced drug interdiction plan was developed and implemented, which included increased use of drug dogs and ion scanning technology as well as enhanced searching within the institution.
Clarifying Front-line Roles and Responsibilities
Over time, the offender population changes, the labour market changes, and CSC accumulates additional correctional experience and knowledge. Maximizing the effectiveness of CSC's human resources requires periodic review.
Following a review of its 20-year-old staff deployment model, CSC developed a more effective means of deploying staff, which will enhance the safety of the public, staff and inmates. A national and regional implementation team was established to ensure the development of new security staff deployment standards. As well, the team developed an implementation strategy that was approved in February 2007. Institutional managers initiated a local planning and consultation process to prepare for implementation of the new standards and operating practices in 2007-08. Implementation began in September 2007.
Enhance Staff Safety
In order for staff to be able to perform their duties, and make optimum use of the new deployment strategy, they need safe environments in which to work.
CSC is enhancing the physical safety of staff with measures such as the provision of protective equipment, specialized training for Correctional Officers (e.g., gang identification and management) and by reviewing measures such as access to OC spray53 and firearms.
The draft implementation protocol for stab-resistant vests has been completed and will be sent to the field for consultation. Procurement of additional vests is underway. Additionally:
- Ballistics vests were distributed to all medium and maximum security sites;
- Correctional officers and most Primary Workers (who work in women's institutions) were issued hand-cuffs, keys and pouches;
- Training on gangs was delivered in two CSC regions, and specialized interviewing skills for Security Intelligence Officers was delivered in one region;
- Pilot projects are currently underway in two maximum security institutions to determine the effectiveness of equipment that would allow for the use of OC spray in large areas; and
- A three-year implementation plan for replacing all CSC firearms (side-arms, gas guns, shotguns and rifles) was approved, and procurement of the side-arms has commenced.
Reporting Assaultive Behaviour
By nature, correctional environments can be high-tension environments. This tension is sometimes discharged in a variety of negative behaviours such as spitting, throwing bodily fluids and wastes, verbal assaults and threats, and physical assaults and injuries.
Understanding the actual level of risk in CSC's institutions is important for choosing the best preventative interventions and for providing staff, their families, and the community with a balanced and realistic understanding of the correctional work environment.
CSC is working with union representatives on improving reporting of assaultive behaviour against staff in an effort to implement a more consistent approach for dealing with unacceptable behaviour in institutions and provide safe working environments.
The definition of "assault", for purposes of data collection and for staff leave-of-absence, has been expanded to include such activity as spitting, throwing of bodily fluids, and persistent or severe verbal threats.
2.1.1.2 Key Performance and Other Indicators
As per CSC's Program Activity Architecture, the key performance indicator for the Security Sub-Activity is the number/rate of security incidents by type. Statistics on major security incidents in institutions were presented in Section 1.6, and are presented in more detail in the following table.
Major Institutional Incidents Details54
| 02-03 | 03-04 | 04-05 | 05-06 | 06-07 | ||
|---|---|---|---|---|---|---|
|
Major Disturbance |
4 |
8 |
1 |
0 |
2 |
|
|
Murder - Staff |
0 |
0 |
0 |
0 |
0 |
|
|
Murder - Inmate |
2 |
8 |
3 |
3 |
3 |
|
|
Hostage Taking/Forcible Confinement |
3 |
1 |
2 |
5 |
2 |
|
|
Suicide |
12 |
11 |
9 |
10 |
10 |
|
|
Assault on Staff |
0 |
0 |
1 |
6 |
2 |
|
|
Assault on Inmate |
51 |
43 |
31 |
39 |
40 |
|
|
Inmate Fight |
11 |
7 |
6 |
5 |
12 |
|
|
Attempted Murder |
2 |
0 |
0 |
0 |
1 |
|
|
Escapees from Maximum |
0 |
0 |
0 |
0 |
0 |
|
|
Escapees from Medium |
0 |
1 |
1 |
0 |
0 |
|
|
Escapees from Minimum |
48 |
54 |
31 |
26 |
37 |
|
|
Escapees from Multi-Level |
0 |
1 |
1 |
0 |
0 |
|
|
Escapees from Escort (Max) |
0 |
0 |
0 |
0 |
0 |
|
|
Escapees from Escort (Med) |
0 |
0 |
0 |
0 |
0 |
|
|
Escapees from Escort (Min) |
0 |
0 |
0 |
0 |
0 |
|
|
Escapees from Escort (Multi) |
0 |
1 |
0 |
0 |
0 |
|
|
Major Institutional |
year |
133 |
135 |
86 |
92 |
109 |
|
3-year average |
141.7 |
133.0 |
118.0 |
104.3 |
95.7 |
|
|
Institutional Flowthrough |
year |
18588 |
18532 |
18623 |
19039 |
19490 |
|
3-year average |
18628 |
18567 |
18581 |
18731 |
19051 |
|
|
Rate |
year |
0.7% |
0.7% |
0.5% |
0.5% |
0.6% |
|
3-year average |
0.8% |
0.7% |
0.6% |
0.6% |
0.5% |
|
Source: Corporate Reporting System (July 31, 2007). Institutional Flowthrough as of April 8, 2007.
The data illustrates that, although the number of offenders flowing through the institutions has increased in the last five years, the number of incidents has declined slightly, and the rate of major incidents has remained relatively stable. This suggests that efforts at managing the changing offender profile have had some limited success and should improve further given the recent measures taken.
The following table shows the number and rate of incidents in the community.
Community Incidents55
| 2002-03 | 2003-04 | 2004-05 | 2005-06 | 2006-07 | ||
|---|---|---|---|---|---|---|
|
Murder |
9 |
4 |
12* |
7 |
7 |
|
|
Attempted Murder |
5 |
8 |
4 |
2 |
5 |
|
|
Sexual Assault |
21 |
14 |
15 |
15 |
26 |
|
|
Major Assault |
72 |
61 |
59 |
42 |
13 |
|
|
Hostage Takings |
0 |
1 |
2 |
0 |
1 |
|
|
Unlawful Confinement |
4 |
4 |
1 |
3 |
3 |
|
|
Armed Robbery |
30 |
62 |
60 |
64 |
51 |
|
|
Robbery |
68 |
62 |
34 |
48 |
64 |
|
|
Other |
29 |
19 |
21 |
19 |
16 |
|
|
Total |
year |
238 |
235 |
208 |
200 |
186 |
|
3-year average |
234 |
229 |
227 |
214 |
198 |
|
|
Community Flowthrough |
year |
16382 |
16168 |
16156 |
16368 |
16399 |
|
3-year average |
16656 |
16387 |
16235 |
16231 |
16308 |
|
|
Incident Rate |
year |
1.5% |
1.5% |
1.3% |
1.2% |
1.1% |
|
3-year average |
1.4% |
1.4% |
1.4% |
1.3% |
1.2% |
|
Source: Corporate Reporting System (June 30, 2007). Community Flowthrough as of April 8, 2007.
* Includes the murder of a CSC Staff member.
The number and rate of incidents in the community has declined in the last five years, as has the number of offenders in the community under supervision. There has been a dramatic decline in major assaults but at the same time an increase in sexual assaults and robberies in recent years.
CSC faces particular challenges from offenders released on Statutory Release, which mandates release after an inmate has served two-thirds of their sentence. Less than sixty percent of Statutory Release supervision periods are completed without revocation56 and seventy-five percent of violent re-offending in the community by federal offenders is committed by offenders on Statutory Release.
2.1.2 Health Services Sub-Activity
Planned Spending for 2006-07: $144.5 million
Actual Spending for 2006-07: $156.7 million
Expected Result: Offenders are provided with essential health care (including mental health care) in accordance with professionally accepted standards.
The Corrections and Conditional Release Act (CCRA) requires that CSC provide every inmate with essential health care and with reasonable access to non-essential mental health care in accordance with professionally accepted standards. This improves their participation in correctional programs and reduces their public health and safety risk.
2.1.2.1 Plans and ResultsImplement the Community Mental Health Initiative
CSC is observing an increase in the mental health needs of offenders coming into the federal system. Offenders are entering with an increased number of prior mental health diagnoses and problems such as addictions. In response, CSC developed a multi-year, multi-faceted Mental Health Strategy starting in 2005-06.
The initiative's goal is to ensure that inmates requiring mental health services receive the appropriate preparation for reintegration, and can transition to the community mental health system at the appropriate time with continuity of support.
In 2006-07, the second year of five-year funding for this initiative:
- An evaluation plan and a measurement strategy were developed;
- The initial two-day national mental health training package was developed and piloted. As well, a version of the training focusing on women's mental health was prepared and delivered to women's halfway house staff;
- Approximately 50% of newly created clinical positions were filled or candidates identified. (The remainder of the positions are expected to be staffed by Fall 2007. Although it had been anticipated that 90% of these positions would be hired by March 2007, there were significant staffing delays due to difficulties associated with the creation of new positions and establishing their classifications); and
- Over 40 regional service contract proposals have been approved, of which approximately 25 are currently in place. They provide services and support to offenders with mental disorders under CSC jurisdiction in the community.
Apart from the Community Mental Health Initiative, CSC undertook some preliminary work in other areas of the Mental Health Strategy, for which, until late in the fiscal year, it had not received funding. Examples include:
- The Regional Reception and Assessment Centre (RRAC) in the Pacific Region reached the half-way mark in a pilot project involving mental health screening and assessment of offenders at intake; and
- Following the preliminary data from the RRAC, the Computerized Mental Health Intake Screening System was developed. This system, incorporating computerized testing technology, is a cost-effective alternative to the resource-intensive model used in the pilot project at RRAC to screen and assess offenders for mental health problems. The system facilitates the gathering of data regarding the prevalence of mental disorders in the inmate population that enables better planning.
2.1.2.2 Key Performance and Other Indicators
CSC's Program Activity Architecture identifies the key performance indicators for the Health Services Sub-Activity: Medical intake assessments completed and services provided according to professional standard.
With respect to health intake assessments, all offenders admitted to a CSC institution receive a health intake assessment within 48 hours of admission to assess their current state of health and prescribe treatment as necessary.
With respect to the quality of health services, in 2006-07, all institutions completed a verification tool against four criteria. These criteria and the national compliance rates were as follows:
The institution ensures that:
- Offenders have access to essential health care services by registered professionals 24 hours per day (98.1% compliance);
- Appropriate procedures are in place for dealing with hunger strikes; (96.3% compliance);
- Appropriate health-related procedures are followed prior to an inmate's transfer (98.1% compliance); and
- A team of professionals provides quality mental health services to offenders in keeping with community standards (92.5% compliance).57
Areas of deficiency were noted and remedial actions identified.
Another means of testing CSC's performance against its commitment is to examine the complaints and grievances received from offenders concerning Health Services. Upheld grievances are those where the complainant's objections were deemed valid.
The rate of complaints and grievances have remained relatively stable despite an increase in the inmate population and growing public expectations for better health care services.
Upheld Inmate Health Care-Related Complaints and Grievances
| 2002-03 | 2003-04 | 2004-05 | 2005-06 | 2006-07 | |
|---|---|---|---|---|---|
|
Complaints |
244 |
268 |
226 |
248 |
251 |
|
Institutional Level Grievances |
31 |
40 |
32 |
27 |
37 |
|
Regional Level Grievances |
6 |
17 |
16 |
24 |
17 |
|
National Level Grievances |
4 |
15 |
4 |
9 |
13 |
|
Institutional Flowthrough |
18588 |
18532 |
18623 |
19039 |
19490 |
|
Total |
285 |
340 |
278 |
308 |
318 |
|
Rate |
1.5% |
1.8% |
1.5% |
1.6% |
1.6% |
Source: Corporate Reporting System (August 5, 2007). Institutional Flowthrough as of April 8, 2007.
2.1.3 Accommodation Services Sub-Activity
Planned Spending for 2006-07: $392.1 million
Actual Spending for 2006-07: $345.6 million
Expected Result: Accommodation of offenders is safe, secure and humane
CSC manages offenders' sentences through reasonable, safe and humane custody. This includes the provision of safe, secure and humane accommodations.
2.1.3.1 Plans and Results
Providing appropriate accommodations is a challenge in a situation where the buildings receive constant and heavy use, must accommodate people in close quarters under varying degrees of control, sometimes over very long periods, and must facilitate a variety of services and purposes.
There are two plans associated with the Accommodation Services Sub-Activity:
Develop a Long-Term Investment Strategy
Correctional facilities are expensive to construct or modify. With changes in society at large come new challenges in protecting the public, delivering necessary programs and services, and taking advantage of the most current technology and correctional approaches. It is important, therefore, to identify long-term pressures and anticipate future needs accurately. Accordingly, CSC developed a long-term capital plan in order to meet the intentions of the Treasury Board policy on management of real property with the application of an Integrated Investment Strategy.
Update CSC's Comprehensive Capital Plan
To address short-to-medium term issues, in 2006-07, CSC tabled two versions of a capital plan within its National Capital, Accommodation and Operations Plan (NCAOP)--one within the existing reference levels and one requiring an increase to the capital reference levels. The capital plan was recognized as "a good transitional start toward the proposed Investment Planning Policy" in CSC's latest Management Accountability Framework assessment by TBS. CSC is awaiting formal TBS review of the NCAOP.
CSC continued, within existing capital reference levels, implementing its Long Term Capital Plan towards realizing its corporate priorities, including addressing both a changing offender population and infrastructure and facility rust-out.
Projects of note in 2006-07 include:
- Achieving key milestones in major redevelopments at Springhill, Collins Bay and Cowansville institutions;
- Completion of critical infrastructure replacement projects; and
- The initiation of construction at Kent Institution and Saskatchewan Penitentiary of the first new maximum-security housing units in over 20 years.
Notwithstanding this progress, the next phase of major institutional redevelopments had to be delayed due to resource limitations.
As an interim strategy, CSC was successful in obtaining additional partial funding, as part of the 2007 Federal Budget,58 to initiate critical infrastructure replacements pending the results of the current independent Panel Review. The funding, provided over two fiscal years, will target the highest priority areas, including fire safety (equipment and training), electronic security systems, vehicle fleet, infrastructure maintenance, enhanced security measures and equipment, environmental protection (drinking water quality), as well as food and health equipment.
2.1.3.2 Key Performance and Other Indicators
As per the Program Activity Architecture, the key performance indicator for the Accommodation Services Sub-Activity is: Accommodations meet all legal and policy requirements.
As the following table shows, the number of upheld inmate complaints and grievances with regard to accommodations-related issues has declined over the past three years.
Upheld Accommodation-Related Complaints and Grievances
| 2002-03 | 2003-04 | 2004-05 | 2005-06 | 2006-07 | |
|---|---|---|---|---|---|
|
Complaints |
150 |
160 |
181 |
145 |
115 |
|
Institutional Level Grievances |
13 |
11 |
20 |
9 |
18 |
|
Regional Level Grievances |
2 |
3 |
1 |
6 |
9 |
|
National Level Grievances |
0 |
2 |
1 |
1 |
0 |
|
Institutional Flowthrough |
18588 |
18532 |
18623 |
19039 |
19490 |
|
Total |
165 |
176 |
203 |
161 |
142 |
|
Rate |
0.9% |
0.9% |
1.1% |
0.8% |
0.7% |
Source: Corporate Reporting System (August 5, 2007). Institutional Flowthrough as of April 8, 2007.
The number of complaints and grievances has remained relatively stable over time, although there was a decline in complaints in 2006-07.
2.2 Rehabilitation and Case Management Program Activity
Description of Program Activity: Assisting in the safe rehabilitation and reintegration of offenders into communities.
Case management begins when offenders enter the correctional system, and continues for as long as they are under supervision, whether in an institution or in the community.
Case management is closely aligned with rehabilitation. Incarceration and supervision alone do not produce the long-term changes that many offenders require in order to lead productive, law-abiding lives in the community. Correctional interventions, which include programs in the institution and in the community, are necessary to help bring about positive changes in behaviour. These interventions are aimed at addressing problems that are directly related to offenders' criminal behaviour and that interfere with their ability to function as law-abiding members of society.
The Rehabilitation and Case Management Program Activity includes the following major Sub-Activities: Case Management, and Program Development and Delivery.59
Expected Result: Safe reintegration into the community when appropriate and consistent with the law.
For fiscal year 2006-07, the priorities associated with this Program Activity were:
- Safe transition of offenders into the community; and
- Enhanced capacities to provide effective interventions for First Nations, M�tis and Inuit offenders.
The total planned spending and human resource allocations related to this Program Activity were:
2006-07 Total Financial Resources ($ million)
| Planned Spending | Authorities | Actual Spending |
|---|---|---|
|
487.5 |
501.6 |
470.4 |
2006-07 Total Human Resources (full-time equivalents)
| Planned | Actual | Difference |
|---|---|---|
|
4,008 |
3,917 |
91 |
2.2.1 Case Management Sub-Activity
Case management practices and policies are developed to ensure that offenders' sentences are managed based on informed decision-making that takes into consideration interventions, risk management and, most importantly, public safety. To achieve this, all offenders are assessed throughout their sentence, via a Correctional Plan developed upon admission and regularly updated, in order to ensure that staff can provide the necessary interventions at the appropriate times.
2.2.1.1 Plans and Results
Enhance Collaborative Community Supervision
CSC works with local police to ensure public safety while offenders are under supervision in the community. In this partnership, CSC explores opportunities for collaborative ventures to maximize mutual effectiveness.
Reporting Centres are police-operated locations where offenders report to confirm they are in compliance with probation or parole regulations. CSC planned to implement a Reporting Centre in each of its five regions. This plan was put on hold due to lack of funding. As well, a local evaluation of the Vancouver Reporting Centre, completed in August 2006, suggests that while reporting centres prove useful for offenders who have a positive release plan and for offenders transitioning from a halfway house setting, their efficacy is limited unless the offenders are first stabilized in terms of housing and community support.
Treasury Board provided dedicated funding for CSC to implement a Police-Parole Initiative embodied in the form of Community Corrections Liaison Officers (CCLOs). Arrangements have been made for 17 CCLOs to be located in parole offices across Canada . As of March 2007, CSC had 11 CCLOs via Interchange Canada agreements with various police forces. The CCLOs are currently deployed in parole offices across the country.
CCLOs are involved in a number of activities, including:
- Offender supervision interviews with Parole Officers when staff safety is a concern;
- Tandem supervision with Parole Officers as required by policy for a specific group of recently released, higher-risk offenders;
- Developing strategies for the release of higher-risk offenders in addition to ongoing monitoring and assessment of this group of offenders while in the community;
- Assisting in the flow of information between Parole Officer and law enforcement officials for offenders of particular interest (e.g., gang members); and
- Establishing links with other agencies and government departments to track parole violators who are Unlawfully at Large.
Jurisdictions with CCLOs have reported an increase in the level of intelligence-sharing and improved relationships between parole officers and the police.
Implementing Electronic Monitoring for High-Risk Offenders
In June 2006, CSC conducted a feasibility study in relation to an Electronic Monitoring Program (EMP). Subsequently, a number of procurement, legal, privacy, and information management and security issues came to light, delaying finalization of the project proposal.
Nevertheless, significant progress was made in resolving identified impediments, and work continues towards piloting the use of electronic monitoring technology with federal offenders. Although a formal pilot project has yet to been implemented, CSC has been responsible for the electronic monitoring of provincial offenders on parole in British Columbia after it assumed responsibility for parole supervision of these cases in April 2007.
Seven provincial offenders were subject to an electronic monitoring condition. Staff reported that the EMP was a very helpful tool in monitoring the offender's compliance with his curfew. They felt that the EMP could not replace the Parole Officer's ability to perform risk assessments through one-on-one contact, but was of particular assistance after hours.
Effective Partnerships
CSC recognizes the impact offenders have on communities and that offenders will remain in a community after their sentence ends. Therefore, CSC continues actively to promote partnerships with Non-Governmental Organizations (NGOs) to better understand the needs of each community and to connect offenders with resources to help continue the progress they make while under supervision.
One form of partnership is reflected in Community-based Residential Facilities (CRFs), which provide 24-hour supervision and accommodation for released offenders. In April 2007, revised standards for CRFs were implemented after having been developed in consultation with external partners, including local halfway house associations and NGOs (i.e., St. Leonard's Society, the Salvation Army, the Elizabeth Fry Society, the John Howard Society and l'Association des services de r�habilitation sociale du Qu�bec).
A working group, composed of members of the National Association Active in Criminal Justice (NAACJ) and CSC, was established to explore the development of a framework for collaboration, including on horizontal, operational and strategic capacity issues.
CSC meets regularly with the Federation of Canadian Municipalities to ensure community elected officials and representatives have input into strategic plans and to foster collaborative projects.
As well, CSC continues to meet regularly with the Community Reintegration Sub-committee of the national Citizens' Advisory Committee (CAC) to address community concerns and resolve issues. These meetings provide CAC members an opportunity to review and provide advice on new CSC policies or on changes to existing policies, while informing CSC about issues of importance to CAC.
Re-examine the Offender Intake Assessment
The Offender Intake Assessment (OIA) is a comprehensive assessment done at the start of the offender's sentence that informs the Correctional Plan against which the offender's progress is assessed. For short-term offenders, the time required to complete the OIA competes with the time available to participate in programs that would help change the offenders' behaviour.
The piloting of an accelerated OIA for short-term sentences ended in June 2007. Initial results indicate support for some aspects of the modified process; however, overall the initiative did not yield the desired result. Given these offenders' violent offence histories, and the consequent requirement for specialized and supplementary assessments, few short-term sentence offenders met the criteria for the accelerated process.
CSC further reviewed the intake assessment process to identify areas that could be streamlined or eliminated. A planned milestone, piloting the Dynamic Factor Identification and Analysis,60 had to be postponed to 2007-08 due to internal expenditure reduction measures at CSC.
Initial Security Classification Tool for Women Offenders
Many of the tools CSC uses are based on existing research done primarily on white male offenders. Increasingly, research is becoming available that allows tools to be developed specifically to assess the security dynamics relevant to women and Aboriginal offenders.
CSC engaged a contractor to create an initial security classification tool for women offenders. Based on stakeholder consultations in the Spring of 2006, additional steps were added to the contract and CSC adjusted the milestones for this project. A draft instrument was presented in March 2007, however it required significant adjustment. In order to ensure the development of an appropriate tool that will meet the needs of Aboriginal women, the contractor will consult with subject-matter experts and their input will inform scale development for this critical piece.
Because of the additional work, field-testing is expected to commence in the late Fall of 2007, with an anticipated completion date of late Spring 2008. Barring further required changes or adjustments, it is expected that implementation across sites will occur in 2009.
Examine the Role of Community Correctional Centres
Community Correctional Centres (CCCs) are residential facilities operated by CSC in communities across Canada. These 16 centres provide accommodation and 24-hour supervision for offenders.
In recent years, the need for increased resources and capacity in CCCs has been highlighted, primarily in response to changes in the type of offenders accommodated in these facilities. The most significant changes are the number of Statutory Release cases with a residency condition and the number of offenders on a Long Term Supervision Order with a residency condition. Both of these types of offenders are considered higher-risk cases requiring additional structure and supervision in the community. The need for a more relevant staffing model to address these needs is vital to the continued safe and successful operation of CCCs.
In response to these challenges, the National CCC Working Group, comprised of CCC Directors from each of CSC's five regions, developed a staffing model recommending additional resources for CCCs. Further consultation within the regions concluded that there was overall support for the staffing model.
Treasury Board approved temporary funding for fiscal year 2006-07 to support Parole Officers in CCCs (at a ratio of one to every eight offenders) and to double the level of coverage for Protective Services (i.e., Canadian Corps of Commissionaires).
Strengthen Aboriginal Community Development Officers (ACDOs)
Timing of parole eligibility and offender commitment are key factors in engaging communities in release planning for individual offenders. The ACDO works with both the offender and the Aboriginal community members to develop and sustain appropriate release plans.
In 2006-07, community release planning was initiated for 315 cases. Of these, 51 were presented to the National Parole Board and 191 were in progress at year-end. This is a decrease from 2005-06, attributable to normal fluctuations in human resource capacity. The small number of ACDO positions and the expertise required to work with communities meant that even short-term vacancies had an impact on the number of release plans completed.
ACDOs made 293 initial contacts with Aboriginal communities in 2006-07 to build relationships and raise awareness of the Section 84 provision.61 Pending the outcome of the CSC Panel Review, additional funding allocated over the next two years will serve to expand the number of ACDOs from 9 to 12.
It is important to note that Section 84 does not address the area of greatest need for community engagement--preparation for return of the majority of Aboriginal offenders who are released on Statutory Release. In 2006-07, 71.5% of Aboriginal releases (1,096 of 1,532) were on Statutory Release.
Address Aboriginal Population Management Issues
CSC faced three challenges: to expand Pathways Healing Units to all regions in both men's and women's institutions; to complete the implementation of the Healing Lodge Action Plan; and to develop a strategy to address the needs of Northern offenders, including the Inuit.
Results:
i) Expand Pathways healing units to all regions in both men's and women's institutions.
Pathways healing units operate on an Aboriginal, holistic, continuum of care model that treats the entire individual in an effort to get them, and keep them, on a path to successful living in their community.
CSC received funding in December 2005 to add one Pathways unit in each of the Pacific, Ontario and Atlantic Regions, and to one women offender institution. Following are the locations and opening dates of these units:
- December 2005 - Mission Institution, Pacific Region;
- March 2006 - Warkworth Institution, Ontario Region, and Dorchester Institution, Atlantic Region; and
- September 2006 - Fraser Valley Institution, Pacific Region.
There are now seven funded Pathways healing units providing a total capacity of 200 beds at medium security. However, on average, there are over 2,500 Aboriginal inmates across Canada. In response to growing demands for broader implementation, some transitional models have emerged. These models include "pre-Pathways" at maximum security and "post-Pathways" at minimum security. These transitional units have been funded through internal reallocations; however, there is a need to assess whether they have the capacity to maintain the integrity of the Pathways concept. A post-implementation review is scheduled in 2007-08. A formal evaluation will be completed for reporting to Treasury Board in 2008-09.
ii) Complete the implementation of the Healing Lodge Action Plan.
Healing Lodge occupancy rates have improved with implementation of the recommendations in the 2002 An Examination of Healing Lodges for Federal Offenders in Canada.62 Average occupancy in 2006-07 was 82.5%, compared to 71.3% in 2004-05 and 86.5% in 2005-06. Consultations with communities on a new organizational model for CSC-operated healing lodges were conducted in 2006-07 and the new model is scheduled for implementation in Fall 2007.
iii) Develop a strategy to address the needs of Northern offenders, including the Inuit.
The framework for development of a Northern Corrections Initiative along with an analysis of the Inuit offender population was completed early in 2006-07. Following consultation with Federal-Provincial-Territorial Heads of Corrections in December 2006, "corridors" have been established for liaison by the Atlantic Region with Newfoundland and Labrador ; by the Quebec Region with Nunavik; and by the Ontario Region with Nunavut . Further collaborative work with provincial/territorial governments will be undertaken in consultation with Indian and Northern Affairs Canada.
Since September 2006, an Inuit Offender Officer has been employed with the Aboriginal Initiatives Directorate on a one-year Interchange Canada Agreement between CSC and the Pauktuutit Inuit National Organization. This individual has been working on Inuit community corrections development in the remote Arctic and the pursuit of meaningful partnerships with Inuit communities related to reintegration. In March 2007, a National Inuit Gathering of staff and Elders working with Inuit offenders met to discuss options and to make recommendations for updating the CSC Inuit Action Plan.
Aboriginal Community Engagement
Healing-based approaches implemented within the Aboriginal corrections continuum of care model are showing promise, and preliminary evaluations have identified the need for community maintenance programming and support to sustain positive results during offenders' transition back to their communities and beyond the end of their sentence.
However, the majority of Aboriginal communities today have difficulty supporting or sustaining offenders who return to their home communities. As a result, community engagement in correctional initiatives has been focused on raising awareness of healing-based approaches in corrections and engaging Aboriginal organizations and communities in individual release planning (through the work of the ACDOs). In the absence of broader community capacity, Elders have been and will continue to be instrumental in reconnecting offenders with their families and communities.
A Citizen Engagement Strategy was developed to ensure enhanced collaboration with partners, stakeholders and community members, and portfolio-specific plans were developed. Next steps include implementing action plans that include increasing the participation of Aboriginal communities. A presentation on the Strategic Plan for Aboriginal Corrections was delivered to the Citizens Advisory Committee Annual General Meeting in September 2006, along with a session by an Aboriginal Elder on culture and traditions, to enhance awareness of the Aboriginal agenda and community engagement in implementing the Strategic Plan. Also, a new Citizens Advisory Committee (CAC) was established in Nunavut (Ontario Region).
Eliminate Systemic Barriers Impeding Aboriginal Offenders
A significant overarching accomplishment in 2006-07 was the amendment of Case Management policies to integrate Aboriginal social history throughout correctional planning and decision-making processes, from admission until sentence completion. This recognizes the unique social experience of Aboriginal people that should inform a continuum of assessment, planning, intervention, and reintegration efforts. Interventions founded on this should provide culturally appropriate and more effective results for Aboriginal offenders and communities.
Since barriers may be best perceived by those affected, processes have been established for consultations and feedback on Aboriginal offender complaints and grievances. At the third-level (national headquarters) grievance, all responses to grievances relating to Aboriginal-specific issues are reviewed by the Director General Aboriginal Initiatives to ensure any systemic barriers are identified and addressed appropriately.
Guidelines for the development of all correctional policies were revised in May 2006. The policy framework includes an explicit requirement for Aboriginal consultations throughout the policy development process, and for sign-off by the Director General Aboriginal Initiatives for all policies forwarded to the Commissioner for approval.
In institutions, the Independent Chairperson is the decision-maker when an offender is charged with an internal misconduct. In September 2006, a half-day interactive dialogue was conducted with Regional Senior Independent Chairpersons. Additional orientation and training needs for all Independent Chairpersons were identified, and will be further defined in 2007-08, following the completion of data analysis on the differences in the discipline process between Aboriginal and non-Aboriginal offenders.
Implement Interventions for Aboriginal Women
The Pathways initiative has been implemented at a second women's facility: Edmonton Institution for Women.63
In October 2007, CSC will again host a national Gathering of Elders and other staff who work directly with Aboriginal women at Okimaw Ohci Healing Lodge. Expected outcomes include better collaboration between sites, increased knowledge of program and service delivery at Okimaw Ohci Healing Lodge, and a greater understanding of each other's roles.
A contract has been awarded to New Directions, an organisation in Abbotsford, BC, to develop a structured assistance model, called Moving Forward , for women, including Aboriginal women, serving long sentences.
Implement Culturally Sensitive Classification and Assessment Tools for Women
In addition to tools for an initial security classification of offenders, a re-classification tool is used to reassess the security requirements presented by an offender after they have had time to make progress on their Correctional Plan.
CSC has implemented a gender-informed Security Reclassification Scale for Women (SRSW). An overrepresentation of Aboriginal women was included in the development and validation samples to ensure applicability to this group. Results of the validation studies reveal that the SRSW performs at least as well with Aboriginal women as with non-Aboriginal women.
The Dynamic Factors Identification and Analysis component of the offender intake assessment process, to be piloted in 2007-08, has been revised to incorporate some women-specific, ethno-cultural and Aboriginal-specific factors (e.g., unique cultural communication style, strong cultural identity).
Enhance CSC's Knowledge of Aboriginal Women and Effective Corrections for that Specific Population
CSC has completed an analysis of research on the needs of Aboriginal women in order to identify initiatives to address issues related to reintegration, health, employment and substance abuse.
The Research Branch has completed an evaluation of the Spirit of a Warrior program for Aboriginal women. The report will be released in the Fall 2007 and will be available on the CSC Internet site.
2.2.1.2 Key Performance and Other Indicators
Key performance indicators for the Case Management Sub-Activity, as per the Program Activity Architecture, are: Timely case preparation; completion of successful transfers; number of offenders successfully reintegrated into the community; and number of revocations with offence.64
The cornerstone of CSC's correctional model is a comprehensive assessment that leads to an integrated Correctional Plan. A Post-Sentence Community Assessment (PSCA) of the offender's support in the community informs that Plan.
To maximize the effectiveness of the Correctional Plan, particularly with sentences of four years or less, the Plan must be promptly and accurately completed if offenders are to obtain maximum benefit from their incarceration. The Plan is incomplete until the PSCA is received and the information incorporated.
The table below indicates that the case preparation process is functioning reasonably well. An increasing inmate population is putting some pressure on completing reports on time, and as a result, streamlining strategies are being examined to improve performance.
Timeliness of Completion of Correctional Plans
and Post-Sentence Community Assessments
| 2002-03 | 2003-04 | 2004-05 | 2005-06 | 2006-07 | |
|---|---|---|---|---|---|
|
% Correctional Plans Completed On-time |
86% |
93% |
83% |
81% |
88% |
|
% Post Sentence Community Assessments Completed On-time |
92% |
92% |
90% |
90% |
93% |
Source: Corporate Monitoring Tool (April 8, 2007).
Number of Successful Transfers to Lower Security Levels
Transfer to reduced security is associated with a reduction in the risk presented by an offender. A transfer is considered successful when the offender does not return to a higher security level for at least 120 days. Only transfers for programming or for security reclassification are included.
| 2002-03 | 2003-04 | 2004-05 | 2005-06 | 2006-07 | |
|---|---|---|---|---|---|
|
% Transfers to Lower Security Completed Successfully |
94% |
95% |
94% |
95% |
94% |
Offender Management System (April 8, 2007).
2.2.2 Program Development and Delivery Sub-Activity
Planned Spending for 2006-07: $178.9 million
Actual Spending for 2006-07: $171.1 million
Expected Results: Access to programs designed to address offenders' identified needs and contribute to successful reintegration into the community.
Programs that address the needs of the federal offender population at the most appropriate time in the sentence are the most effective and contribute to their successful reintegration into the community
2.2.2.1 Plans and Results
Enhance Community Programs
The nature of some programs is that they are more effective when offered in the community.
Community programming has been substantially enhanced through the revision of the Counter-Point Program . A new program entitled Attitudes, Associates, and Alternatives (AAA), developed in 2006-07, is designed to address the needs of male offenders who experience reintegration difficulties in the community. Regional trainers and Correctional Program Officers from across the country received training. The AAA program is currently being delivered and implementation results are being analysed through monthly conference calls involving program staff, regional staff, and national managers.
CSC has continued to increase community program capacity by training, quality assuring, and certifying CSC and NGO staff in the delivery of the Community Maintenance Program. This generic competency program is the maintenance program for almost all categories of offenders, sustaining the gains they have made in earlier programs.
Implement Targeted Interventions, in Particular, for Violent Offenders
In 2006-07, CSC developed a Moderate Intensity Violence Prevention Program (MIVPP), the first program specifically to target the characteristics of the changing offender population. Offenders can enter the program at the start of different modules, making it possible for them to start the program at one site (e.g., an intake unit), and continue and complete the program at another site. This increases the likelihood of timely program access and completion for short-term offenders.
MIVPP is based on the Violence Prevention Program and is consistent with the Community Maintenance Program. Regional trainers and Correctional Program Officers from across the country were trained in 2006-07. The MIVPP is currently being delivered and implementation results are being analysed through regular conference calls involving program staff, regional staff, and national managers.
In 2006-07, CSC successfully implemented the piloting of correctional programs at intake units. An operational impact analysis demonstrated that some intake units lack the physical and human resource capacity to deliver correctional programs. However, at the institutions where correctional programs could be delivered, the preliminary results are very encouraging.
In 2006-07, CSC and NGO Parole Officers were trained65 to enhance their supervision activities by using a basic set of self-management, relapse prevention, and motivational skills that all CSC programs have in common. This training will help them to better monitor the risk factors and high-risk situations that can lead to recidivism, and intervene as needed.
Develop a Violence Prevention Program for Women Offenders
Consistent with CSC's findings in other areas, it was deemed necessary to develop a program specific to the needs of women who commit, or demonstrate a high risk of committing, violent offences. Ongoing consultation with experts has identified a requirement for additional time to develop and deliver the program. Completion is targeted for the end of 2007-08.
Enhance the delivery of Aboriginal Correctional Programs
Aboriginal Correctional Program delivery capacity was substantially enhanced through the training of CSC program staff in 2006-07, in the following program areas:
- Aboriginal Family Violence Prevention (22 staff trained);
- In Search of your Warrior (16 staff trained);
- Basic Healing Program (25 staff trained); and
- Aboriginal Offender Substance Abuse Program (27 staff trained).
Implement culturally sensitive programs for Aboriginal women
Spirit of a Warrior is a violence prevention program for Aboriginal women and is currently available at Edmonton Institution for Women and at the Okimaw Ohci Healing Lodge. This program is being revised by Native Counselling Services of Alberta to include substance abuse and gang affiliation as treatment targets.
Circles of Change has been implemented at Fraser Valley Institution, Edmonton Institution for Women, the Okimaw Ohci Healing Lodge, Grand Valley Institution and plans are being made for implementation at Joliette Institution and Nova Institution. This program targets social skills and relationships.
An Aboriginal Women's Maintenance Program has been developed by Native Counselling Services of Alberta. Field-testing at the Okimaw Ohci Healing Lodge and at the Winnipeg Parole Office started in August 2007.
2.2.2.2 Key Performance and Other Indicators
As per the Program Activity Architecture, key performance indicators for the Program Development and Delivery Sub-Activity are: Number/percentage of offenders completing programs in institutions and the community.
Programs serve as a critical vehicle in providing offenders with the skills they will require to find work, control their behaviour, make better choices, and overcome addictions in order to live a law-abiding life. Offenders are encouraged to complete and fully participate in a program to obtain the maximum benefit from it. However, factors such as a transfer to reduced security, or other risk management interventions, may interrupt completion of a program.
Offender Program Outcomes66 by Type of Program
| 2002-03 | 2003-04 | 2004-05 | 2005-06 | 2006-07 | ||
|---|---|---|---|---|---|---|
|
Violence Prevention Programs |
All Outcomes |
526 |
649 |
577 |
561 |
482 |
|
% Completions |
67% |
65% |
62% |
62% |
65% |
|
|
Sex Offender Programs |
All Outcomes |
1389 |
1370 |
1212 |
1121 |
1060 |
|
% Completions |
67% |
59% |
59% |
58% |
63% |
|
|
Substance Abuse Programs |
All Outcomes |
6060 |
5257 |
5051 |
5249 |
5458 |
|
% Completions |
69% |
63% |
60% |
62% |
66% |
|
|
Family Violence Prevention Programs |
All Outcomes |
1235 |
977 |
745 |
817 |
836 |
|
% Completions |
84% |
78% |
68% |
73% |
74% |
|
|
Living Skills Programs |
All Outcomes |
4366 |
3622 |
2996 |
2822 |
2534 |
|
% Completions |
78% |
76% |
76% |
78% |
79% |
|
|
Community Correctional Programs |
All Outcomes |
473 |
487 |
563 |
610 |
763 |
|
% Completions |
64% |
59% |
64% |
58% |
55% |
|
|
Special Needs Programs |
All Outcomes |
182 |
144 |
189 |
151 |
285 |
|
% Completions |
54% |
45% |
52% |
42% |
53% |
|
|
Women Offender Programs |
All Outcomes |
82 |
149 |
300 |
358 |
405 |
|
% Completions |
77% |
52% |
39% |
35% |
28% |
|
|
Aboriginal Initiative Programs |
All Outcomes |
263 |
267 |
289 |
220 |
304 |
|
% Completions |
39% |
49% |
35% |
37% |
29% |
|
|
Educational Programs |
All Outcomes |
11478 |
11917 |
11346 |
11134 |
10705 |
|
% Completions |
27% |
29% |
30% |
30% |
31% |
|
|
Personal Development |
All Outcomes |
2617 |
1425 |
615 |
499 |
280 |
|
% Completions |
93% |
89% |
92% |
74% |
91% |
Source: Corporate Reporting System (August 19, 2007).
2.3 CORCAN Program Activity
Description of Program Activity: Assisting in the safe reintegration of offenders by providing employment and employability skills.
Employment and employment-related skills are major factors in an offender's ability to pursue a crime-free life. Many offenders lack specific training or qualifications in a field of work but also lack the behavioural and planning skills needed to maintain work once they have marketable skills.
CORCAN is a Special Operating Agency of CSC, operating through a revolving fund. CORCAN contributes to the safe reintegration of offenders into Canadian society by providing employment and training opportunities to offenders incarcerated in federal penitentiaries and, for brief periods, to offenders after they are released into the community.67
For fiscal year 2006-07, the strategic priority associated with the CORCAN Program Activity was:
- Safe transition of offenders into the community.
Expected Result: Provision of work opportunities and employability skills to offenders.
2006-07 Total Financial Resources ($ millions)
| Planned Spending | Authorities | Actual Spending |
|---|---|---|
|
0.0 |
10.0 |
-2.8 |
2006-07 Total Human Resources (full-time equivalents)
| Planned | Actual | Difference |
|---|---|---|
|
415 |
432 |
(17) |
2.3.1 Plans and Results
The single plan under the CORCAN Program Sub-Activity is in support of CSC's strategic priority, "Safe transition of offenders into the community."
Full Implementation of the Employment Continuum
The employment continuum, aimed at providing inmate employment assistance from intake to post-release, was implemented. CSC introduced a position of Manager of Employment and Employability to oversee this implementation.
A certification is issued when an offender completes an employment program. As part of the skills training component, over 6,400 third-party certifications were issued in 2006-07.
Obtaining vital documents, such as Birth Certificates and Social Insurance Numbers, continues to be a barrier to employment for some offenders. Many documents are provided by provincial authorities in provinces other than where the offender is currently incarcerated. CSC will continue to work with the various jurisdictions involved to seek solutions for obtaining these documents more easily. The Managers of Employment and Employability have reduced the number of inmates with unaddressed employment needs by 12% this year through revised practices.
The National Employment Skills program was delivered at 34 minimum, medium and multilevel (women) institutions. Over 300 inmates received certificates from the Conference Board of Canada for successful completion of the program.
With respect to Aboriginal offenders, pilot projects were completed in March 2007 at several women's and men's institutions on a new employment assessment tool, called Guiding Circles. This is a self-assessment process whereby participants are guided through an intervention to identify goals that will increase their employability and help determine a career path. A maximum of 10 participants per group spend six hours in group sessions and three hours individually defining their goals. Data analysis of the pilot will be completed by the end of October 2007. If the pilot is successful, it could potentially serve as a replacement for current employment assessments.
2.3.2 Key Indicators
Following are the key performance indicators,68 and results, for the CORCAN Sub-Activity:
1. The Number/percentage of inmates enrolled in employment training:
- 4,151 men and 100 women inmates worked a total of 2.590 million hours in CORCAN shops--an increase of 9% from 2005-06;
- 12,424 men and 538 women inmates worked in other assignments through Institutional Operations; and
- 8,899 offenders stayed in one work assignment within CORCAN and CSC over 90 days (research indicates that a minimum of 90 days is required to maximize skill development).
The focus in 2006-07 remained on ensuring that employment training opportunities were provided to those inmates assessed at intake as having some or considerable need in this area. Despite CORCAN's efforts, 1070 (20%) of non-Aboriginal male offenders still had an employment gap at the end of the fiscal year--a result similar to 2005-06. The employment gap for Aboriginal male offenders was at 19%, virtually the same as for non-Aboriginal offenders.
The rate of non-Aboriginal women offenders with an employment gap increased from 16% in 2005-06 to 23% in 2006-07. However, for Aboriginal women offenders the rate decreased from 28% in 2005-06 to 22% in 2006-07.
While these results support CSC's objective of improving results with Aboriginal offenders, internal assessment is being done to determine what changes are necessary to improve results with all offenders.
2. Number of certificates earned:69
6,467 third-party certificates were earned in 2006-07: 1,234 by Aboriginal men, 4,631 by non-Aboriginal men, 223 by Aboriginal women, and 379 by non-Aboriginal women.
The majority of certificates were in Basic Food Safe, the Workplace Hazardous Materials Information System (WHMIS), Safe Start Pre-employment, First Aid, Construction Safety and Recognition, and the National Employability Skills Program.
3. Number of offenders receiving services at community employment centres:
A total of 3,201 offenders received services, of which 2,958 were men and 243 were women.
4. Number of offenders finding employment in the community for the very first time:
1,609 offenders (1,520 men and 89 women) found employment with the assistance of a CORCAN Community Employment Centre, on par with 2005-06.
2.4 Corporate Management: CSC's Management Improvement Agenda
While not formally part of CSC's Program Activity Architecture, CSC's management improvement agenda influences all Program Activities and Sub-Activities across the organization.
Enhanced focus on Aboriginal Employee Representation
CSC is the second-largest employer of Aboriginal people, after Indian and Northern Affairs Canada. Seven percent of CSC employees have self-declared as being of Aboriginal origin.70 However, given the disproportionate representation of Aboriginal people in the offender population, CSC must strive to ensure that its workforce is more representative of the offender population.
The implementation of a national strategy for recruiting, developing and retaining Aboriginal employees to meet CSC's business needs is part of the CSC Strategic Plan for Human Resource Management 2007-2010.71 Although some work has been done, implementation of the plan for increasing Aboriginal employee representation has not been completed on target due to the corporate necessity of curtailing CSC expenditures in 2006-07.
Develop Cultural Competence throughout CSC
As Canada becomes increasingly diverse, CSC staff need to become increasingly skilled in connecting with various cultures.
The deliverable as stated in the RPP--provide training and awareness sessions to all CSC policy developers regarding the impact of policy on Aboriginal offenders--was revised.
The focus in 2006-07 has been on needs analysis and content development to equip non-Aboriginal staff to work more effectively with Aboriginal offenders and communities.
The "Aboriginal Perspectives Training: First Nations, Inuit and M�tis Perceptions", developed in partnership with the National Parole Board, targets front-line Parole Officers as a first priority. Fifty staff were trained in the pilot sessions conducted in October 2006, 17 of whom participated in subsequent "train the trainer" sessions in December 2006. Based on the pilot, the training manual was revised and approved by the National Parole Board. CSC is currently at the national implementation stage. How and when this training will be delivered will be assessed within the framework of CSC's National Training Standards and operational priorities with respect to other training initiatives.
Integrate the Aboriginal Dimension
Traditionally, Aboriginal issues were dealt with by a separate branch within the CSC. However, in time it was recognized that in order to adequately address CSC's mandate concerning Aboriginal persons (both offenders and Aboriginal communities), it was necessary that all parts of the organization embrace a responsibility to integrate Aboriginal issues into what they are doing. To direct strategic growth, the Aboriginal Initiative Branch now falls under the Senior Deputy Commissioner.
The Strategic Plan for Aboriginal Corrections published in October 2006 reflects the Senior Deputy Commissioner's leadership role in governance and strategic direction to advance the Aboriginal agenda in CSC, and articulates accountabilities for the integration of Aboriginal considerations at the national, regional and local levels.
A data collection framework identifying results and performance indicators relative to the first key objective on implementation of the Aboriginal continuum of care was completed in 2006. These requirements were incorporated into an "Offender Management System - Aboriginal Business Requirements" document to address the gaps in information on offender participation in Aboriginal-specific initiatives. Implementation of changes to the Offender Management System72 is scheduled for September 2007. This will provide the organization with more complex data on the dynamics and results concerning Aboriginal offenders.
Development of a Results-based Management and Accountability Framework for the remaining two key objectives--horizontal collaboration and cultural competency--will be completed in 2007-08.
Strengthen Horizontal Collaboration
The factors that bring Aboriginal persons into conflict with the law and the various initiatives to address the role and place of Aboriginal persons in Canadian society extend well beyond the walls, fences, and supervision of CSC. To maximize the effectiveness of government initiatives for Aboriginal persons, CSC must strengthen its plans for collaboration within the Public Safety Portfolio and across government and community organizations.
CSC's Horizontal Collaboration plan has been revised to an ongoing initiative, given the evolution of the relationship between the federal government and Aboriginal peoples.
CSC's Aboriginal Initiatives Directorate has been actively promoting linkages at the federal and provincial/territorial level to enhance their understanding of the mandate for Aboriginal corrections; to share what has been achieved; to bring issues to the federal table; and to identify opportunities for collaboration. A network of connections has been developed and consultations are underway to define partnerships and specific projects.
In May 2006, the Government announced a healing-based resolution framework whose current focus is the completion of a compensation settlement agreement for former students of Indian residential schools. CSC is working with Indian Residential Schools Resolution Canada (IRSRC), Health Canada and Service Canada to ensure that former students who are incarcerated are aware of their rights and have every opportunity to participate in the court-supervised settlement process. CSC is also represented on a Community Impacts Working Group co-chaired by IRSRC and the Aboriginal Healing Foundation to prepare for implementation of the Agreement. Further information on the resolution framework can be found at: www.irsr-rqpi.gc.ca
Communication of court-approved notifications for the first phase of the settlement process was completed in July 2006, including information for inmates on accessing the Help Desk and support services available to former residents.
Develop an Overall Succession Management Framework for Operational Managers
An effective, representative workforce is one of four priorities identified in the Strategic Plan for Human Resource Management 2007-2010.73 CSC's employees, although somewhat younger than the average age in the federal public service, are nevertheless aging. Just over 45% of all CSC employees are currently 45 years or older and nearly 30% of all CSC employees are aged 50 and over.74 Key to addressing the increase in departures is a robust succession-planning framework.
The development of the succession management framework was postponed due to expenditure reduction measures in 2006-07. A succession planning framework for the EX (executive-level) group and EX feeder groups will be established by the end of March 2008.
Clarify and Strengthen Roles and Responsibilities
Roles and responsibilities in the area of human resources management have been clarified and strengthened at both functional and line levels. In addition to the work accomplished in 2006-07, CSC plans to continue the work in this area in 2007-08, by implementing a roles and responsibilities framework for all human resources disciplines.
Clarify Program Evaluation
According to TBS's 2006-07 MAF assessment report of CSC, the organization was found to comply with TBS Evaluation policy, including in the areas of relevance, utilization of multiple lines of evidence, cost effectiveness and neutrality. Report writing was noted to be clear and concise.
TBS is currently reviewing the Evaluation policy, and the renewed policy is expected to be released in April 2008. In the interim, CSC has also been moving toward more strategic and risk-based evaluations. All proposed evaluation projects for the next three fiscal years were subjected to a strategic and risk-based analysis, as reflected in CSC's 2007-2010 Evaluation Plan.
Strengthen Values and Ethics Processes
Although CSC articulates principles and values in its policy and day-to-day activities, such as the use of value-based analysis in the selection of its staff, sustaining a values-based ethical workplace poses additional challenges. In a correctional environment, staff are constantly surrounded by challenges to pro-social values and are working with offenders whose behaviour is discordant with their own values.
Providing strategic direction for a coordinated ethics program at CSC; implementing a national Values and Ethics Program; and collecting baseline data to establish targets for future improvement are three strategic thrusts for a strengthened Values and Ethics approach within CSC. In addition, existing programs, such as Internal Disclosure, have been integrated under the one umbrella.
CSC has developed an ethics-training package. CSC has also incorporated values and ethics commitments in performance agreements. Fifty focus sessions on values and ethics were conducted in November and December 2006, involving 40 operational units and over 400 staff. The data has been compiled and is being used as a basis for developing a comprehensive multi-year ethics strategy.
CSC has collaborated with bargaining agents to begin addressing issues arising from the 2005 Public Service Employee Survey.75 It has co-developed a one-year action plan to address issues in three areas of concern: Harassment; Grievances; and Respect, Trust and Accountability.
CSC has already taken concrete actions against the action plan. For instance, CSC has:
- Taken steps to increase training and awareness of harassment for all CSC employees by identifying high-risk sites requiring training, and developing competency profiles for anti-Harassment coordinators;
- Clarified roles, responsibilities and accountabilities of managers, supervisors, employees and unions with respect to harassment and grievance matters; and
- Implemented systemic mechanisms (e.g., standing items at labour-management meetings) to monitor harassment and grievance processes and trends.
In line with TBS' recommendations in its 2006-07 MAF assessment, CSC will continue to address issues reflected in the 2005 Public Service Employee Survey, including maintaining its internal disclosure mechanisms; fostering a culture of respect and integrity; increasing employee recognition and participation in decision-making; establishing an informal conflict management system; and addressing the representation, separation and promotion of Employment Equity groups.76
Implement a National Informal Conflict Management System (ICMS)
As result of the Public Service Modernization Act, all government departments are required to implement an ICMS. Work is underway to develop the system, in consultation with the unions, regional managers and human resources advisors. Selected questions from the 2005 Public Service Employee Survey were used to establish a baseline to monitor and track progress in order to set targets for improvements. The next steps are to complete staffing of regional ICMS practitioners and to finalize the policy framework and RMAF77 for CSC's ICMS.
Strengthened Independent Audit Function
In April 2006, an Audit Committee with three external members was established, which played a critical role in strengthening CSC's internal audit function. The Committee's accomplishments in 2006-07 include:
- The development of a Charter and an implementation strategy to meet the requirements of TBS's Policy on Internal Audit (2006);78
- The review and approval of audit plans, audit reports and related management action plans; and
- The implementation of a systematic follow-up process which informs Audit Committee members of progress in addressing recommendations for all audits approved as of 2006-07.
Communications
A large measure of the success of previously mentioned initiatives is ensuring that those impacted are aware of both the goals and the actions of the organization. The following plans were aimed at improving internal communication at CSC:
- Implement an overall strategy and action plan based on the consultative process;
- Develop new products, tools and services; and
- Survey a cross-section of staff to determine where advances have been made and to identify areas for further improvement.
Performance agreements for the executive committee managers now include commitments to make demonstrable internal communications improvements. To support this leadership commitment, a number of actions were taken.
In 2006-07, a strategic framework and action plan was developed based on input from national and regional consultations conducted during the Winter of 2006. The action plan has been implemented and will be updated annually based on mid-year and year-end reporting.
The first phase of Intranet (CSC's internal internet communication system) revitalization plans was achieved, including the creation of a weekly News@Work e-bulletin that summarizes important announcements from throughout the week. The Intranet was also redesigned in order to facilitate navigation, and portals of information were developed to improve information retrieval.
A new strategic direction was taken for Let's Talk , CSC's corporate magazine, to reflect CSC's five priorities.
A staff survey has been completed to benchmark the effectiveness of CSC's internal communications. A follow-up survey will be conducted by the end of 2007-08 to gauge the improvement in internal communications.
Other internal communications initiatives include:
- An Internal Communications Advisory Committee was established and will meet regularly to review and address internal communications issues and activities;
- A training module has been developed that will educate employees on how to better communicate with staff and colleagues through effective internal communications practices, tools, and resources; and
- A manager's toolkit is in development to provide CSC managers with one-stop information to assist them in their daily operations and in communicating effectively with staff and colleagues.
Regions and sectors continue to report progress in a number of areas, including:
- Establishing new, and improving existing, print and electronic publications (including newsletters, toolkits, calendars and InfoNet sites);
- Increasing the frequency and improving the efficacy of face-to-face meetings, teleconferences, and training sessions; and
- Promoting employee recognition.
Not surprisingly, with this communications effort, the 2006 MAF assessment rated CSC as strong in its integration of various strategic plans (e.g., Aboriginal offenders, Women offenders, Information Management/Technology, mental health, etc), which indicates effective collaboration across teams and regions.
SECTION 3 Supplementary Information
3.1 Organizational Information
CSC is organized to provide effective correctional services in a fiscally responsible manner. There are three levels of management: national, regional and local.
National Headquarters
Provides support to the Commissioner and the Executive Committee and delivers services to all of CSC including: provision of information to Parliamentary Committees, Central Agencies and the public; ministerial liaison; communications and citizen engagement; correctional operations; human resource and financial management expert advice; corporate review and audit; performance assurance; policy and planning; program development; research; legal services; and information management.
Regional Headquarters
Provides support to National Headquarters in developing Commissioner's Directives and national programs; develops and implements regional procedures, plans and programs for performance measurement, human resources, financial management, federal/provincial/territorial relations and public consultation; and provides information to the media, elected officials, interest groups and the public.
Institutional/Parole Offices --CSC manages 58 institutions, 16 Community Correctional Centres and 71 Parole Offices. A description of institutional security level classifications (i.e., maximum, medium, minimum and multi-level) is provided in the Glossary, at the end of this report
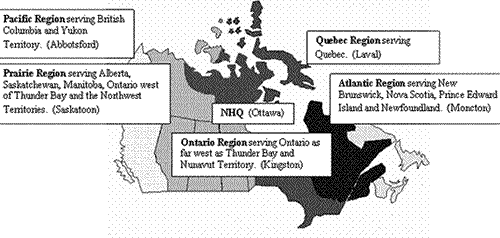
The Commissioner is the Agency Head of the Correctional Service Canada and is accountable to the Minister of Public Safety. An Executive Committee of national and regional officials sets the vision and agenda for correctional services delivery. Specific functions, as of March 2007, are depicted in the following chart and outlined in the paragraphs below:79
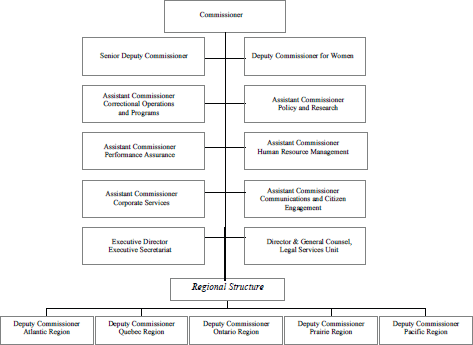
The Senior Deputy Commissioner is accountable to the Commissioner. His or her main role is to support the Commissioner, focus on the management of operational and strategic issues, provide leadership on Aboriginal initiatives and oversight of policy and program development for Aboriginal offenders, oversee the incident investigation process, and act as Commissioner when required. As of July 2007, the Senior Deputy Commissioner acquired additional accountabilities, including for the Information Management Technology Branch and the Performance Assurance Sector.
The five Regional Deputy Commissioners are responsible for the management of CSC operations within their respective regions, implementation of correctional policy, and leadership in providing advice on criminal justice system matters.
The Deputy Commissioner for Women is responsible for effective policy and program development and oversight for program delivery for women offenders.
The Assistant Commissioner, Correctional Operations and Programs is responsible for the integrity of community and institutional operations across CSC for improving the development and delivery of health care,80 security, case management, and program development.
The Assistant Commissioner, Policy and Research is responsible for corporate policy and research in support of the government agenda; federal, provincial, territorial and international relations; and fairness and equity of correctional practices through offender redress mechanisms and delivery of services under the Access to Information Act and the Privacy Act.
The Assistant Commissioner, Performance Assurance is responsible for ensuring mechanisms are in place to analyze, monitor and measure CSC's performance on delivering correctional results. In addition, Performance Assurance is accountable for evaluation, internal disclosure programs, the informal conflict management system, integrated business planning and reporting. The Assistant Commissioner is currently the Senior Values and Ethics Officer.
The Assistant Commissioner, Corporate Services is responsible for technical services, facilities, finance and materiel management and for the Comptroller's Branch.
The Assistant Commissioner, Human Resource Management is responsible for the development of human resource management strategies, management of administrative and human resource activities and interpretation of human resources-related policies, directives and guidelines.
The Assistant Commissioner, Communications and Citizen Engagement is responsible for leadership in the development of the voluntary sector and communication engagement initiatives, for the implementation of communication policy, and for the development and implementation of strategies to improve media and public understanding of CSC's mandate, policies and programs, through outreach activities and public consultation, as well as the design, production, dissemination and evaluation of multi-media products.
The Executive Director, Executive Secretariat is responsible for Ministerial liaison and Parliamentary relations to support the Commissioner and the Minister in fulfilling CSC's mandate.
The Director and General Counsel, Legal Services Unit provides advice on legal risks in the development of correctional policy, programs and services, as well providing legal advice to CSC on litigation.
The Chief Audit Executive is responsible for the effective management of the internal audit function, which is designed to assess and improve the effectiveness of risk management, control and governance processes within CSC.
The Assistant Commissioner, Health Services is responsible for supporting and continually improving the quality of health services provided to inmates, while ensuring that policies are applied consistently. In addition, the Health Services Sector will ensure standardized practices and provide greater integration of physical and mental health services.
Federal Institutions81 by Region and Security Level
|
Atlantic Region |
Quebec Region |
|
Atlantic Institution (Maximum) |
Donnacona Institution (Maximum) |
|
Nova Institution for Women (Multi) |
Port-Cartier Institution (Maximum) |
|
Shepody Healing Centre (Multi) |
Regional Reception Centre82 (Maximum) |
|
Dorchester Penitentiary (Medium) |
Joliette Institution (Multi) |
|
Springhill Institution (Medium) |
Regional Mental Health Centre (Multi) |
|
Westmorland Institution (Minimum) |
Archambault Institution (Medium) |
|
Carlton CCC (Minimum) |
Cowansville Institution (Medium) |
|
Carlton Annex CCC (Minimum) |
Drummond Institution (Medium) |
|
Newfoundland and Labrador CCC (Min) |
La Macaza Institution (Medium) |
|
Parrtown CCC (Minimum) |
Leclerc Institution (Medium) |
|
|
Federal Training Centre (Minimum) |
|
Mont�e Saint-Fran�ois Institution (Min) |
|
|
Ontario Region |
Sainte-Anne-des Plaines Institution (Min) |
|
Kingston Penitentiary (Maximum) |
Hochelaga CCC (Minimum) |
|
Millhaven Institution (Maximum) |
Laferri�re CCC (Minimum) |
|
Grand Valley Institution for Women (Multi) |
Marcel Caron CCC (Minimum) |
|
Regional Treatment Centre (Multi) |
Martineau CCC (Minimum) |
|
Bath Institution (Medium) |
Ogilvy CCC (Minimum) |
|
Collins Bay Institution (Medium) |
Sherbrooke CCC (Minimum) |
|
Fenbrook Institution (Medium) |
|
|
Joyceville Institution (Medium) |
|
|
Warkworth Institution (Medium) |
Prairie Region |
|
Beaver Creek Institution (Minimum) |
Edmonton Institution (Maximum) |
|
Frontenac Institution (Minimum) |
Edmonton Institution for Women (Multi) |
|
Isabel McNeill (Minimum) |
Okimaw Ohci Healing Lodge (Minimum/Medium) |
|
Pittsburgh Institution (Minimum) |
Regional Psychiatric Centre (Multi) |
|
Hamilton CCC (Minimum) |
Saskatchewan Penitentiary (Multi) |
|
Keele CCC (Minimum) |
Bowden Institution (Medium) |
|
Portsmouth CCC (Minimum) |
Bowden Annex (Minimum) |
|
|
Drumheller Institution (Medium) |
|
Drumheller Annex (Minimum) |
|
|
Pacific Region |
Stony Mountain Institution (Medium) |
|
Kent Institution (Maximum) |
Grande Cache Institution (Minimum) |
|
Fraser Valley Institution (Multi) |
Riverbend Institution (Minimum) |
|
Pacific Institution (Multi) |
Rockwood Institution (Minimum) |
|
Regional Treatment Centre (Multi) |
Willow Cree Healing Lodge (Minimum) |
|
Matsqui Institution (Medium) |
Grierson Centre (Minimum) |
|
Mission Institution (Medium) |
P� S�k�st�w (Minimum) |
|
Mountain Institution (Medium) |
Osborne CCC (Minimum) |
|
Ferndale Institution (Minimum) |
Oskana CCC (Minimum) |
|
Kwikw�xwelhp Healing Village (Minimum) |
|
|
William Head Institution (Minimum) |
|
|
Chilliwack CCC (Minimum) |
|
3.2 Financial Information
List of Tables Page
Table 1 - Comparison of Planned to Actual Spending (including FTEs)
Table 2 - Resources by Program Activity
Table 3 - Voted and Statutory Items
Table 4 - Services Received Without Charge
Table 6 - Sources of Respendable and Non-respendable Revenue
Table 7 - Revolving Fund
Table 8 - Resource Requirement by Sub-Activity
Table 9-a - User Fees Act
Table 11 - Details on Project Spending
Table 15-a - Financial Statements of Departments and Agencies
Table 15-b - Financial Statements of Departments and Agencies
Table 16 - Response to Parliamentary Committees, Audits and Evaluations (non-financial)
Table 17 - Sustainable Development Strategies (non-financial)
In 2006-07, the budget of the CSC was $1,709,353,000 as approved by Parliament in the Main Estimates. This budget was comprised of the following main elements, excluding CORCAN.
| ($ millions) | % | |
|---|---|---|
|
Salaries |
877.2 |
51.3% |
|
Employee Benefit Plans (EBP) |
166.7 |
9.7% |
|
Operating |
503.5 |
29.5% |
|
Capital |
162.0 |
9.5% |
|
1,709.4 |
100% |
With regard to the distribution of the budget by Program Activity, the resources were broken down as follows:
| ($ millions) | % | |
|---|---|---|
|
Care and Custody |
1,225.5 |
71.7% |
|
Rehabilitation and Case Management |
483.9 |
28.3% |
|
CORCAN |
- |
N/A |
|
1,709.4 |
100% |
Table 1 - Comparison of Planned to Actual Spending (including FTEs)
| ($ millions) | 2004-05 Actual | 2005-06 Actual | 2006-07 | |||
|---|---|---|---|---|---|---|
| Main Estimates | Planned Spending | Total Authorities | Total Actual | |||
|
Care and Custody |
1,161.0 |
1,197.4 |
1,225.5 |
1,228.1 |
1,418.8 |
1,397.9 |
|
Rehabilitation and Case Management |
425.7 |
452.9 |
483.9 |
487.5 |
501.6 |
470.4 |
|
CORCAN |
-4.1 |
1.8 |
0.0 |
0.0 |
10.0 |
-2.8 |
|
TOTAL |
1,582.6 |
1,652.1 |
1,709.4 |
1,715.6 |
1,930.4 |
1,865.5 |
|
Less: Non-respendable Revenue |
14.9 |
13.4 |
N/A |
10.9 |
N/A |
9.6 |
|
Plus: Cost of services received without charge |
91.9 |
91.2 |
N/A |
86.6 |
N/A |
106.4 |
|
Total Departmental Spending |
1,659.6 |
1,729.9 |
N/A |
1,791.3 |
N/A |
1,962.3 |
|
Full-Time Equivalents |
14,530 |
14,638 |
N/A |
14,829 |
N/A |
14,803 |
The increase in expenditures for all Program Activities is mostly due to signed collective agreements and in prices paid (inflation) for basic goods and services.
Explanations of changes between the Estimates and the actual expenditures for 2006-07:
CSC has spent $1,865.5M, or $156.1M in excess of the amount approved in the PART II of the Estimates; i.e., $1,709.4M. In order to analyze the financial results of the Service, additional resources provided via Supplementary Estimates and Treasury Board should be taken into consideration. The following reconciliation is provided:
|
Main Estimates |
1,709.4 |
|
|
Plus |
||
|
Operating Expenditures - Supplementary Estimates |
33.5 |
|
|
Adjustments and Transfers |
||
|
TB Vote 10 (Internal Audit) |
0.4 |
|
|
TB Vote 15 (Collective Agreements) |
161.7 |
|
|
Total Adjustments and Transfers |
162.1 |
|
|
Increase to Employee Benefit Plan |
14.3 |
|
|
Non-Estimates Items |
||
|
CORCAN - ANCAFA |
10.0 |
|
|
Others (including Crown Assets, etc.) |
1.1 |
|
|
Total Authority available for use |
1,930.4 |
|
|
Less |
||
|
CORCAN & Crown Assets Disposal |
(13.8) |
|
|
Total Available to CSC |
1,916.6 |
|
|
Less |
||
|
Actual |
(1,865.5) |
|
|
Variance |
51.1 |
Table 2 - Resources by Program Activity
| 2006-07 | |||||||||
|---|---|---|---|---|---|---|---|---|---|
| ($ millions) | Budgetary | Plus: Non-Budgetary | Total | ||||||
| Operating 3 | Capital | Grants | Contributions and Other Transfer Payments | Total: Gross Budgetary Expenditures | Less: Respendable Revenue 4 | Total Net Budgetary Expenditures | Loans, Investments, and Advances | ||
|
Care and Custody |
|||||||||
|
Main Estimates |
1,083.6 |
141.5 |
0.3 |
0.1 |
1,225.5 |
0.0 |
1,225.5 |
0.0 |
1,225.5 |
|
Planned spending |
1,079.9 |
147.8 |
0.3 |
0.1 |
1,228.1 |
0.0 |
1,228.1 |
0.0 |
1,228.1 |
|
Total authorities |
1,303.0 |
115.5 |
0.3 |
0.0 |
1,418.8 |
0.0 |
1,418.8 |
0.0 |
1,418.8 |
|
Actual Spending |
1,293.5 |
104.0 |
0.4 |
0.0 |
1,397.9 |
0.0 |
1,397.9 |
0.0 |
1,397.9 |
|
Rehabilitation and |
|||||||||
|
Main Estimates |
462.0 |
20.5 |
0.2 |
1.2 |
483.9 |
0.0 |
483.9 |
0.0 |
483.9 |
|
Planned spending |
465.6 |
20.5 |
0.2 |
1.2 |
487.5 |
0.0 |
487.5 |
0.0 |
487.5 |
|
Total authorities |
478.8 |
21.3 |
0.2 |
1.3 |
501.6 |
0.0 |
501.6 |
0.0 |
501.6 |
|
Actual Spending |
448.8 |
20.7 |
0.0 |
0.9 |
470.4 |
0.0 |
470.4 |
0.0 |
470.4 |
|
CORCAN |
|||||||||
|
Main Estimates |
73.2 |
0.0 |
0.0 |
0.0 |
73.2 |
73.2 |
0.0 |
0.0 |
0.0 |
|
Planned spending |
73.2 |
0.0 |
0.0 |
0.0 |
73.2 |
73.2 |
0.0 |
0.0 |
0.0 |
|
Total authorities |
80.8 |
2.4 |
0.0 |
0.0 |
83.2 |
73.2 |
10.0 |
0.0 |
10.0 |
|
Actual Spending |
76.9 |
3.3 |
0.0 |
0.0 |
80.2 |
83.0 |
-2.8 |
0.0 |
-2.8 |
Notes:
- Numbers in italics denote Total Authorities for 2006-07 (Main Estimates plus Supplementary Estimates and other authorities).
- Bolded numbers denote actual expenditures in 2006-07.
- Operating includes Contributions to Employee Benefit Plans.
- These revenues were formerly called "Revenues Credited to the Vote".
Table 3 - Voted and Statutory Items
| ($ millions) | 2006-07 | ||||
|---|---|---|---|---|---|
| Vote or Statutory Item |
Truncated Vote or Statutory Wording |
Main Estimates |
Planned Spending |
Total Authorities |
Actual |
|
Correctional Service |
|||||
|
40 |
Operating Expenditures |
1,380.7 |
1,380.6 |
1,601.6 |
1,562.6 |
|
45 |
Capital Expenditures |
162.0 |
168.3 |
136.7 |
124.5 |
|
S |
Contributions to employee benefit plan |
166.7 |
166.7 |
181.0 |
181.0 |
|
S |
CORCAN Revolving Fund |
10.0 |
-2.8 |
||
|
S |
Spending of proceeds from Disposal of Crown Assets |
1.1 |
0.2 |
||
|
S |
Refund of previous year's revenues |
0.0 |
0.0 |
||
|
TOTAL |
1,709.4 |
1,715.6 |
1,930.4 |
1,865.5 |
|
Table 4 - Services Received Without Charge
| ($ millions) | 2006-07 Actual Spending |
|---|---|
|
Accommodation provided by Public Works and Government Services Canada (PWGSC) |
10.0 |
|
Contributions covering employers' share of employees' insurance premiums and expenditures paid by TBS (excluding revolving funds) |
88.7 |
|
Salary and associated expenditures of legal services provided by Justice Canada |
1.9 |
|
Worker's compensation coverage provided by Social Development Canada |
5.8 |
|
Total 2006-07 Services received without charge |
106.4 |
Table 5 - Loans, Investments and Advances (Non-Budgetary)
Not Applicable.
Table 6 - Sources of Respendable and Non-respendable Revenue
Respendable Revenue
| ($ millions) | Actual 2004-05 |
Actual 2005-06 |
2006-07 | |||
|---|---|---|---|---|---|---|
| Main Estimates | Planned Revenues | Total Authorities 1 | Actual | |||
|
|
0.0 |
0.0 |
0.0 |
0.0 |
0.0 |
0.0 |
|
Rehabilitation and Case Management |
0.0 |
0.0 |
0.0 |
0.0 |
0.0 |
0.0 |
|
CORCAN |
77.7 |
69.1 |
73.2 |
73.2 |
73.2 |
83.0 |
|
Total Respendable Revenues 2 |
77.7 |
69.1 |
73.2 |
73.2 |
73.2 |
83.0 |
Non-Respendable Revenue
| ($ millions) | Actual 2004-05 |
Actual 2005-06 |
2006-07 | |||
|---|---|---|---|---|---|---|
| Main Estimates | Planned Revenues | Total Authorities 1 | Actual | |||
|
|
10.9 |
12.0 |
N/A |
9.4 |
6.8 |
8.6 |
|
Rehabilitation and |
4.0 |
1.4 |
N/A |
1.5 |
3.6 |
1.0 |
|
CORCAN |
0.0 |
0.0 |
N/A |
0.0 |
0.0 |
0.0 |
|
Total Non-Respendable Revenues 3 |
14.9 |
13.4 |
N/A |
10.9 |
10.4 |
9.6 |
Notes:
- Main Estimates plus Supplementary Estimates and other authorities.
- The source of this revenue is the CORCAN Revolving Fund. Revenues are mainly from the sale of products made by inmates.
- The main sources of these revenues are: offender canteen sales, revenues such as contracted offender temporary detention; offender board and lodgings; and miscellaneous revenues.
Table 7 - Revolving Fund
CORCAN Revolving Fund
Statement of Operations
| ($ millions) | Actual 2004-05 |
Actual 2005-06 |
2006-07 | |||
|---|---|---|---|---|---|---|
| Main Estimates |
Planned Spending |
Total Authorities |
Actual* |
|||
|
Revenue |
77.6 |
69.9 |
73.2 |
73.2 |
73.2 |
82.9 |
|
Expenses |
||||||
|
Salaries & employee benefits |
28.2 |
34.2 |
27.9 |
27.9 |
27.9 |
34.1 |
|
Depreciation |
1.2 |
1.3 |
1.4 |
1.4 |
1.4 |
1.5 |
|
Repairs & maintenance |
1.9 |
1.3 |
1.6 |
1.6 |
1.6 |
2.6 |
|
Admin & support services |
10.7 |
8.9 |
10.2 |
10.2 |
10.2 |
9.5 |
|
Utilities, materials & supplies |
32 |
25.1 |
32.1 |
32.1 |
32.1 |
33.1 |
|
74.0 |
70.8 |
73.2 |
73.2 |
73.2 |
80.8 |
|
|
Net results |
3.6 |
(0.9) |
0.0 |
0.0 |
0.0 |
2.1 |
Since the table above refers to the Revolving Fund's operating surplus or deficit and not to cash requirements, the Fund has been calculated through accrual accounting. Therefore, the cash expenditures in the estimates do not affect the operating balance, and other items that must be considered when calculating the surplus or deficit do not require a direct cash outlay. The two can be reconciled as follows:
Statement of Cash Flows
| ($ millions) | Actual 2004-05 | Actual 2005-06 | 2006-07 | |||
|---|---|---|---|---|---|---|
| Main Estimates | Planned Spending | Author-ized | Actual | |||
|
Net results |
3.6 |
(0.9) |
0.0 |
0.0 |
0.0 |
2.1 |
|
Adjustments for non-cash item: |
||||||
|
Provision for termination benefits |
0.9 |
0.6 |
0.8 |
0.8 |
0.8 |
0.7 |
|
Amortization |
1.1 |
1.3 |
1.4 |
1.4 |
1.4 |
1.5 |
|
Other |
(0.1) |
0.1 |
0.0 |
0.0 |
0.0 |
0.0 |
|
Change in non-cash working capital |
||||||
|
Accounts receivable |
2.4 |
1.0 |
2.3 |
2.3 |
2.3 |
0.5 |
|
Inventories |
1.2 |
(2.4) |
1.2 |
1.2 |
1.2 |
0.6 |
|
Employee termination |
(0.3) |
(0.4) |
0.4 |
0.4 |
0.4 |
(0.4) |
|
Accounts payable |
(2.4) |
3.4 |
(1.8) |
(1.8) |
(1.8) |
0.5 |
|
Vacation pay and salary accrual |
2.7 |
(2.1) |
0.0 |
0.0 |
0.0 |
0.1 |
|
Deferred revenue |
0.0 |
0.0 |
0.0 |
0.0 |
0.0 |
0.5 |
|
Investing activities: |
||||||
|
Net capital asset acquisitions |
(2.9) |
(2.2) |
(4.3) |
(4.3) |
(4.3) |
(3.4) |
|
Increase (decrease) in accumulated net charge against the Fund's authority (ANCAFA) |
6.2 |
(1.6) |
0.0 |
0.0 |
0.0 |
2.7 |
Projected Use of Authority
| ($ millions) | Actual 2004-05 | Actual 2005-06 | 2006-07 | |||
|---|---|---|---|---|---|---|
| Main Estimates | Planned Spending | Author-ized | Actual | |||
|
Authority |
5.0 |
5.0 |
5.0 |
5.0 |
5.0 |
5.0 |
|
Drawdown: |
||||||
|
ANCAFA balance as |
7.1 |
13.3 |
11.6 |
11.6 |
11.6 |
11.6 |
|
Increase (decrease) in ANCAFA |
6.2 |
(1.7) |
0.0 |
0.0 |
0.0 |
2.7 |
|
ANCAFA balance as |
13.3 |
11.6 |
11.6 |
11.6 |
11.6 |
14.3 |
|
Net PAYE/RAYE adjustment to authority |
(4.3) |
(4.4) |
(6.4) |
|||
|
9.0 |
7.2 |
11.6 |
11.6 |
11.6 |
7.9 |
|
|
Unused authorities |
14.0 |
12.2 |
16.6 |
16.6 |
16.6 |
12.9 |
Table 8 - Resource Requirement by Sub-Activity
| 2006-07 | ($ millions) |
|---|---|
|
CARE AND CUSTODY |
|
|
SECURITY |
|
|
Planned Spending |
581.4 |
|
Actual Spending |
790.6 |
|
HEALTH |
|
|
Planned Spending |
144.5 |
|
Actual Spending |
156.7 |
|
INSTITUTIONAL SERVICES |
|
|
Planned Spending |
110.1 |
|
Actual Spending |
105.0 |
|
ACCOMMODATION |
|
|
Planned Spending |
392.1 |
|
Actual Spending |
345.6 |
|
REHABILITATION AND CASE MANAGEMENT |
|
|
CASE MANAGEMENT |
|
|
Planned Spending |
282.4 |
|
Actual Spending |
276.7 |
|
PROGRAM DEVELOPMENT & DELIVERY |
|
|
Planned Spending |
178.9 |
|
Actual Spending |
171.1 |
|
INMATE PAY |
|
|
Planned Spending |
26.2 |
|
Actual Spending |
22.6 |
|
CORCAN (Revolving Fund) |
|
|
Planned Spending |
0.0 |
|
Actual Spending |
(2.8) |
Note: For Health, Institutional Services, Accommodation and Case Management, the difference between planned and actual spending is mainly due to the in-year adjustments such as signed collective agreements and other new initiatives.
Table 9-a - User Fees Act
|
($ thousands) |
2006-07 |
Planning Years |
|||||||||
|---|---|---|---|---|---|---|---|---|---|---|---|
|
A. |
Fee Type |
Fee |
Date Last |
Forecasted |
Actual |
Full |
Performance |
Performance |
Fiscal Year |
Forecasted Revenue |
Estimated Full Cost |
|
Fees charged for the processing of access requests under the Access to Information Act (ATIA) |
R |
Access to Information Act |
April 2004 |
2.8 |
2.3 |
2,100.0 |
Requests must be responded to within 30 working days. Responses may be extended as per section 9. In accordance with the Federal Accountability Act, TBS policies presently being modified. For more info, see ATI legislation on Justice Website |
97% on time |
2007-08 2008-09 |
3.3 |
2,400 |
|
Sub-Total (O) |
2.8 |
2.3 |
2,100.0 |
2007-08 |
3.3 |
2,400 |
|||||
|
Sub-Total (R) |
0.0 |
0.0 |
0.0 |
2008-09 |
3.3 |
2,400 |
|||||
|
2009-10 |
3.3 |
2,400 |
|||||||||
|
Total |
2.8 |
2.3 |
2,100.0 |
Total |
9.9 |
7,200 |
|||||
|
B. Date Last Modified : N/A |
|||||||||||
|
C. Other Information: N/A |
|||||||||||
Table 9-b - Policy on Service Standards for External Fees
Supplementary information on Service Standards for External Fees can be found at: www.tbs-sct.gc.ca/rma/dpr3/06-07/index_e.asp
Table 10 - Progress Against the Department's Regulatory Plan
Not Applicable.
Table 11 - Details on Project Spending
Capital Projects by Program Activity ($ millions)
| Program Activity | Current Estimated Total Cost |
Actual 2004- 05 |
Actual 2005- 06 |
2006-07 | |||
|---|---|---|---|---|---|---|---|
| Main Estimates |
Total Planned Spending |
Total Authority 1 |
Actual | ||||
|
Care and Custody |
|||||||
|
A. New Accommodation Projects |
|||||||
|
RHC Pacific Expansion |
71.5 |
11.5 |
0.1 |
0.0 |
0.0 |
0.0 |
0.0 |
|
Archambault New CRSM & Redevelopment |
33.0 |
0.5 |
0.4 |
0.7 |
1.8 |
0.7 |
0.1 |
|
Sask Pen 96-Bed Maximum Unit |
21.7 |
0.0 |
0.0 |
7.1 |
6.0 |
7.1 |
6.3 |
|
Kent 96-Bed Maximum Unit |
23.1 |
0.0 |
0.0 |
6.1 |
0.5 |
6.1 |
0.6 |
|
B. Major Asset Preservation |
|||||||
|
Springhill Institution Refurbish/ Replace |
32.2 |
7.0 |
7.9 |
9.8 |
10.0 |
9.8 |
9.2 |
|
Collins Bay Refurbish/ Replace |
57.6 |
2.0 |
22.0 |
20.0 |
23.0 |
20.0 |
19.1 |
|
Cowansville Refurbish/ Replace |
49.5 |
0.3 |
0.6 |
4.4 |
14.8 |
4.4 |
4.2 |
|
Saskatchewan Pen Refurbish/ Replace |
180.0 |
0.6 |
1.2 |
0.0 |
0.0 |
0.0 |
0.0 |
|
Total Capital Spending |
21.9 |
32.2 |
48.1 |
56.1 |
48.1 |
39.5 |
|
Notes:
- 1 Main Estimates plus Supplementary Estimates and other authorities.
2 CSC's delegation authority level is $18 million according to TB decision of December 14, 1995 ; therefore, only capital projects with total estimated value of $18 million or above have been individually listed.
Table 12 - Status Report on major Crown Projects
Not Applicable.
Table 13 - Details on Transfer Payment Programs (TPPs)
Not Applicable.
Table 14 - Conditional Grants (Foundations)
Not Applicable.
Table 15-a - Financial Statements of Departments and Agencies
(including Agents of Parliament)
CORRECTIONAL SERVICE CANADA
Statement of Management Responsibility
CORRECTIONAL SERVICE CANADA
Statement of Operations (unaudited)
For the year-ended March 31
(in thousands of dollars)
|
2007 |
(restated) 2006 |
||||
|---|---|---|---|---|---|
|
Care and Custody |
Rehabilitation |
Total |
Total |
||
|
Transfer payments |
|||||
|
Non-profit organizations |
- |
846 |
846 |
1,960 |
|
|
Individuals |
356 |
- |
356 |
252 |
|
|
Other countries and international organizations |
- |
55 |
55 |
80 |
|
|
|
Total transfer payments |
356 |
901 |
1,257 |
2,292 |
|
Operating expenses |
|||||||
|
Salaries and employee benefits |
1,047,379 |
391,556 |
1,438,935 |
1,200,479 |
|||
|
Professional and special services |
140,699 |
66,010 |
206,709 |
199,262 |
|||
|
Utilities |
104,560 |
11,901 |
116,461 |
115,292 |
|||
|
Amortization |
73,262 |
3,758 |
77,020 |
74,067 |
|||
|
Repairs and maintenance |
36,728 |
14,818 |
51,546 |
44,590 |
|||
|
Travel |
19,631 |
17,099 |
36,730 |
37,176 |
|||
|
Payment in lieu of taxes |
26,651 |
- |
26,651 |
26,773 |
|||
|
Machinery and equipment |
10,750 |
12,601 |
23,351 |
26,958 |
|||
|
Inmate pay |
- |
19,581 |
19,581 |
19,018 |
|||
|
Cost of goods sold |
- |
14,754 |
14,754 |
11,340 |
|||
|
Accommodation |
3,287 |
6,677 |
9,964 |
10,143 |
|||
|
Relocation |
2,492 |
1,090 |
3,582 |
3,145 |
|||
|
Loss on disposal of tangible capital assets |
603 |
421 |
1,024 |
3,397 |
|||
|
Other |
8,505 |
3,301 |
11,806 |
9,936 |
|||
|
Total operating expenses |
1,474,547 |
563,567 |
2,038,114 |
1,781,846 |
|||
| Total Expenses | 14,474,903 | 564,468 | 2,039,371 | 1,784,138 | |||
|
Revenues |
|||||
|
Sales of goods and services |
2,274 |
48,539 |
50,813 |
39,921 |
|
|
Gains on sales of tangible capital assets |
866 |
4 |
870 |
823 |
|
|
Other |
4,522 |
607 |
5,129 |
4,168 |
|
|
Total Revenues |
7,662 |
49,150 |
56,812 |
44,912 |
|
|
Net Cost of Operations |
1,467,241 |
515,318 |
1,982,559 |
1,739,226 |
|
The accompanying notes form an integral part of these financial statements.
CORRECTIONAL SERVICE CANADA
Statement of Financial Position (unaudited)
At March 31
(in thousands of dollars)
|
2007 |
(restated) |
||
|---|---|---|---|
| Assets | |||
|
Financial Assets |
|||
|
Accounts receivable, loans and advances (Note 4) |
21,361 |
11,684 |
|
|
Inventory held for resale |
9,215 |
9,860 |
|
|
Total financial assets |
30,576 |
21,544 |
|
|
Non-financial Assets |
|||
|
Prepaid expenses |
344 |
2,316 |
|
|
Inventory not for resale |
19,936 |
18,539 |
|
|
Tangible capital assets (Note 5) |
1,252,382 |
1,246,726 |
|
|
Total non-financial assets |
1,272,662 |
1,267,581 |
|
|
Total |
1,303,238 |
1,289,125 |
|
|
Liabilities and Equity of Canada |
|||
|
Liabilities |
|||
|
Accounts payable and accrued liabilities |
187,788 |
142,912 |
|
|
Employee severance benefits (Note 6) |
132,750 |
117,961 |
|
|
Vacation pay and compensatory leave |
52,196 |
48,646 |
|
|
Environmental liabilities (Note 8) |
13,776 |
12,964 |
|
|
Inmate trust fund (Note 7) |
12,271 |
11,459 |
|
|
Claims and litigations (Note 8) |
5,519 |
3,860 |
|
|
Total Liabilities |
404,300 |
337,802 |
|
|
Equity of Canada |
898,938 |
951,323 |
|
|
Total |
1,303,238 |
1,289,125 |
|
Contingent liabilities (Note 8)
Contractual obligations (Note 9)
The accompanying notes form an integral part of these financial statements.
CORRECTIONAL SERVICE CANADA
Statement of Equity of Canada (unaudited)
For the year ended March 31
(in thousands of dollars)
|
2007 |
(restated) |
||
|---|---|---|---|
|
Equity of Canada, beginning of year |
951,323 |
954,380 |
|
|
Correction of previous years' severance benefit liability (Note 11) |
- |
4,001 |
|
|
Correction of previous years' tangible capital assets (Note 11) |
- |
(17,864) |
|
|
Equity of Canada, adjusted beginning of year |
951,323 |
940,517 |
|
|
Net cost of operations |
(1,982,559) |
(1,739,226) |
|
|
Current year appropriations used (Note 3) |
1,865,543 |
1,652,095 |
|
|
Revenue not available for spending |
(8,715) |
(10,680) |
|
|
Change in net position in the Consolidated Revenue Fund (Note 3) |
(33,020) |
17,289 |
|
|
Services received without charge from other government departments (Note 10) |
106,366 |
91,228 |
|
|
Equity of Canada, end of year |
898,938 |
951,323 |
|
The accompanying notes form an integral part of these financial statements.
CORRECTIONAL SERVICE CANADA
Statement of Cash Flow (unaudited)
For the year ended March 31
(in thousands of dollars)
|
2007 |
(restated) |
||
|---|---|---|---|
|
Operating activities |
|||
|
Net cost of operations |
1,982,559 |
1,739,226 |
|
|
Non Cash items |
|||
|
Amortization of tangible capital assets |
(77,020) |
(74,067) |
|
|
Loss on disposal and write-down of tangible capital assets |
(154) |
(2,574) |
|
|
Services provided without charge |
(106,366) |
(91,228) |
|
|
Capital asset adjustments |
- |
(1,602) |
|
|
Variations in Statement of Financial Position: |
|||
|
(Decrease) increase in accounts receivable and advances |
9,677 |
(19,474) |
|
|
(Decrease) increase in prepaid expenses |
(1,972) |
(63) |
|
|
Increase in inventories |
752 |
3,153 |
|
|
Decrease (increase) in liabilities |
(66,498) |
15,397 |
|
|
Cash used by operating activities |
1,740,978 |
1,568,768 |
|
|
Capital investment activities |
|||
|
Acquisitions of tangible capital assets |
83,700 |
90,859 |
|
|
Proceeds from disposal of tangible capital assets |
(870) |
(823) |
|
|
Cash used by capital investment activities |
82,830 |
90,036 |
|
|
Financing activities |
|||
|
Cash Provided by Government of Canada |
1,823,808 |
1,658,804 |
|
The accompanying notes form an integral part of these financial statements.
CORRECTIONAL SERVICE CANADA
Notes to the Financial Statements (unaudited)
1. Authority and Objectives
The constitutional and legislative framework that guides the Correctional Service of Canada (CSC) is set out by the Constitution Act 1982 and the Corrections and Conditional Release Act (CCRA).
The Correctional Service of Canada (CSC), as part of the criminal justice system and respecting the rule of law, contributes to public safety by actively encouraging and assisting offenders to become law-abiding citizens, while exercising reasonable, safe, secure and humane control. It delivers its mandate under two major program activities:
- Care and Custody: Administering a sentence through reasonable, safe and humane custody;
- Rehabilitation and Case Management: Assisting in the safe rehabilitation and reintegration of offenders into communities.
2. Summary of Significant Accounting Policies
The financial statements have been prepared in accordance with Treasury Board accounting policies, which are consistent with Canadian generally accepted accounting principles for the public sector.
Significant accounting policies are as follows:
a) Parliamentary appropriations
CSC is financed by the Government of Canada through Parliamentary appropriations. Appropriations provided to the department do not parallel financial reporting according to generally accepted accounting principles since appropriations are primarily based on cash flow requirements. Consequently, items recognized in the statement of operations and in the statement of financial position are not necessarily the same as those provided through appropriations from Parliament. Note 3 provides a high-level reconciliation between the bases of reporting.
b) Consolidation
These financial statements include the accounts of CSC including its revolving fund CORCAN. All of the accounts of this sub-entity have been consolidated with those of CSC and all inter-organizational balances and transactions have been eliminated.
c) Net Cash Provided by Government
CSC operates within the Consolidated Revenue Fund (CRF), which is administered by the Receiver General for Canada . All cash received by the department is deposited to the CRF and all cash disbursements made by the department are paid from the CRF. The net cash provided by Government is the difference between all cash receipts and all cash disbursements including transactions between departments of the federal government.
d) Change in Net Position in the Consolidated Revenue Fund (CRF)
Change in net position in the Consolidated Revenue Fund is the difference between the net cash provided by Government and appropriations used in a year, excluding the amount of non-respendable revenue recorded by the department. It results from timing differences between when a transaction affects appropriations and when it is processed through the CRF.
e) Revenues
Revenues are accounted for in the period in which the underlying transaction or event occurred that gave rise to the revenues.
f) Expenses
Expenses are recorded on the accrual basis:
- Grants are recognized in the year in which the conditions for payment are met. In the case of grants which do not form part of an existing program, the expense is recognized when the Government announces a decision to make a non-recurring transfer, provided the enabling legislation or authorization for payment receives parliamentary approval prior to the completion of the financial statements;
- a Contributions are recognized in the year in which the recipient has met the eligibility criteria or fulfilled the terms of a contractual transfer agreement;
- a Vacation pay and compensatory leave are expensed as the benefits accrue to employees under their respective terms of employment;
- a Services provided without charge by other government departments for accommodation, the employer's contribution to the health and dental insurance plans, worker's compensation coverage and legal services are recorded as operating expenses at their estimated cost.
g) Employee future benefits
a Pension benefits: Eligible employees participate in the Public Service Pension Plan, a multi-employer plan administered by the Government of Canada. CSC's contributions to the Plan are charged to expenses in the year incurred and represent the total departmental obligation to the Plan. Current legislation does not require CSC to make contributions for any actuarial deficiencies of the Plan.
a Severance benefits: Employees are entitled to severance benefits under labour contracts or conditions of employment. These benefits are accrued as employees render the services necessary to earn them. The obligation relating to the benefits earned by employees is calculated using information derived from the results of the actuarially determined liability for employee severance benefits for the Government as a whole.
h) Accounts and loans receivables from external parties
Accounts and loans receivables are stated at amounts expected to be ultimately realized; a provision is made for receivables where recovery is considered uncertain.
i) Contingent liabilities
Contingent liabilities are potential liabilities that may become actual liabilities when one or more future events occur or fail to occur. To the extent that the future event is likely to occur or fail to occur, and a reasonable estimate of the loss can be made, an estimated liability is accrued and an expense recorded. If the likelihood is not determinable or an amount cannot be
reasonably estimated, the contingency is disclosed in the notes to the financial statements.
j) Environmental liabilities
Environmental liabilities reflect the estimated costs related to the management and remediation of environmentally contaminated sites. Based on management's best estimates, a liability is accrued and an expense recorded when the contamination occurs or when the department becomes aware of the contamination and is obligated, or is likely to be obligated to incur such costs. If the likelihood of the department's obligation to incur these costs is not determinable, or if an amount cannot be reasonably estimated, the costs are disclosed as contingent liabilities in the notes to the financial statements.
k) Inventories
a Inventories held for resale include raw materials, finished goods and work-in-progress. They belong to the CORCAN revolving fund and are valued at the lower of cost and net realizable value.
a Inventories not for resale consist of material and supplies held for future program delivery. They are valued at cost. If they no longer have service potential, they are written-off.
l) Tangible capital assets
All tangible capital assets and leasehold improvements having an initial cost of $10,000 or more are recorded at their acquisition cost. CSC does not capitalize intangibles, works of art and historical treasures that have cultural, aesthetic or historical value, assets located on Indian Reserves and museum collections.
Amortization of tangible capital assets is done on a straight-line basis over the estimated useful life of the asset as follows:
|
Asset Class |
Sub-asset class |
Amortization Period |
|---|---|---|
|
Buildings |
Buildings |
25 to 40 years |
|
Works and infrastructure |
Works and infrastructure |
20 to 25 years |
|
Machinery & equipment |
Machinery & equipment |
10 years |
|
Informatics hardware |
3 to 4 years |
|
|
Informatics software |
3 to 10 years |
|
|
Arms and weapons for defence |
10 years |
|
|
Other equipment |
10 years |
|
|
Vehicles |
Motor vehicles (non-military) |
5 years |
|
Other vehicles |
10 years |
|
|
Leasehold improvements |
Leasehold improvements |
Term of lease |
|
Assets under construction |
Buildings |
Once in service, 25 to 40 years |
|
Informatics software |
Once in service, 3 to 10 years |
|
|
Assets under capital leases |
Assets under capital leases |
In accordance with asset type |
m) Measurement uncertainty
The preparation of these financial statements in accordance with Treasury Board accounting policies, which are consistent with Canadian generally, accepted accounting principles for the public sector requires management to make estimates and assumptions that affect the reported amounts of assets, liabilities, revenues and expenses reported in the financial statements. At the time of preparation of these statements, management believes the estimates and assumptions to be reasonable. The most significant items where estimates are used are contingent liabilities, environmental liabilities, the liability for employee severance benefits and the useful life of tangible capital assets. Actual results could significantly differ from those estimated. Management's estimates are reviewed periodically and, as adjustments become necessary, they are recorded in the financial statements in the year they become known.
3. Parliamentary Appropriations
The Department receives most of its funding through annual Parliamentary appropriations. Items recognized in the statement of operations and the statement of financial position in one year may be funded through Parliamentary appropriations in prior, current or future years. Accordingly, the Department has different net results of operations for the year on a government-funding basis than on an accrual accounting basis. The differences are reconciled in the following tables:
|
a) Reconciliation of net cost of operations to current year appropriations used: |
|||
|---|---|---|---|
|
(in thousands of dollars) |
2007 |
2006 |
|
|
Net cost of operations |
1,982,559 |
1,739,226 |
|
|
Adjustments for items affecting net cost of operations but not affecting appropriations: |
|||
|
Add (Less): |
|
|
|
|
Amortization |
(77,020) |
(74,067) |
|
|
Vacation pay and compensatory leave |
(3,550) |
(4,195) |
|
|
Prepaid expenses |
- |
(63) |
|
|
Environmental liabilities and other provisions |
(2,471) |
760 |
|
|
Employee severance benefits |
(14,789) |
(14,799) |
|
|
Loss on disposal and write-down of tangible capital assets |
(154) |
(2,574) |
|
|
Legal services |
(2,029) |
(2,131) |
|
|
Services provided without charge |
(106,366) |
(91,228) |
|
|
Revenue not available for spending |
8,715 |
10,680 |
|
|
Other |
(4,107) |
(1,530) |
|
|
(201,771) |
(179,047) |
||
|
Adjustments for items not affecting net cost of operations but affecting appropriations: |
|||
|
Add (Less): |
|||
|
Acquisitions of tangible capital assets |
83,700 |
90,859 |
|
|
Inventory |
752 |
1,057 |
|
|
Prepaid expenses |
303 |
- |
|
|
84,755 |
91,916 |
||
|
Current year appropriations used |
1,865,543 |
1,652,095 |
|
|
b) Appropriations provided and used: |
|||
|---|---|---|---|
|
(in thousands of dollars) |
2007 |
2006 |
|
|
Vote 40 (35) - Operating expenditures |
1,601,550 |
1,388,791 |
|
|
Vote 45 (40) - Capital expenditures |
136,740 |
138,217 |
|
|
Statutory amounts |
192,130 |
177,386 |
|
|
Less: |
|||
|
Authorities available for future years |
13,746 |
12,423 |
|
|
Lapsed appropriations: Operating |
38,930 |
12,423 |
|
|
Lapsed appropriations: Capital |
12,201 |
21,374 |
|
|
Current year appropriations used |
1,865,543 |
1,652,095 |
|
|
c) Reconciliation of net cash provided by Government to current year appropriations used: |
|||
|---|---|---|---|
|
(in thousands of dollars) |
2007 |
2006 |
|
|
Net cash provided by Government |
1,823,808 |
1,658,804 |
|
|
Revenue not available for spending |
8,715 |
10,680 |
|
|
Change in net position in the Consolidated Revenue Fund |
|||
|
Variation in accounts receivable and advances |
(9,639) |
19,484 |
|
|
Variation in accounts payable and accrued liabilities |
44,876 |
(34,149) |
|
|
Other adjustments |
(2,217) |
(2,724) |
|
|
Current year appropriations used |
1,865,543 |
1,652,095 |
|
4. Accounts Receivable, Loans and Advances
|
The following table presents details of cash, accounts receivable, loans and advances: |
||
|---|---|---|
|
(in thousands of dollars) |
2007 |
2006 |
|
Receivables from other Federal Government departments and agencies |
13,004 |
5,519 |
|
Receivables from external parties |
8,409 |
6,317 |
|
Employee advances |
331 |
336 |
|
Parolee loans |
4 |
5 |
|
21,748 |
12,177 |
|
|
Less: |
(387) |
(493) |
|
Total |
21,361 |
11,684 |
5. Tangible Capital Assets
(in thousands of dollars)
|
Cost |
Accumulated amortization |
||||||||||
|---|---|---|---|---|---|---|---|---|---|---|---|
|
Capital asset class |
(restated) |
Acquis-itions |
Dis-posals and write-offs |
Transfer of assets under con-struction and adjust-ments |
Closing Balance |
Opening Balance |
Amorti-zation |
Dis-posals, write-offs and adjust-ments |
Closing Balance |
2007 |
(restated) |
|
|
12,467 |
- |
- |
- |
12,467 |
- |
- |
- |
- |
12,467 |
12,467 |
|
|
1,384,090 |
- |
- |
70,437 |
1,454,527 |
505,545 |
42,123 |
- |
547,668 |
906,859 |
878,545 |
|
Works and infrastructure |
408,103 |
- |
- |
349 |
408,452 |
238,985 |
17,698 |
- |
256,683 |
151,769 |
169,118 |
|
Machinery and equipment |
152,837 |
15,957 |
14,626 |
47,464 |
201,632 |
105,503 |
12,937 |
13,847 |
104,593 |
97,039 |
47,334 |
|
|
42,343 |
4,396 |
3,583 |
- |
43,156 |
25,914 |
4,131 |
3,338 |
26,707 |
16,449 |
16,429 |
|
Leasehold improvements |
1,380 |
1,301 |
- |
- |
2,681 |
268 |
131 |
- |
399 |
2,282 |
1,112 |
|
Assets under construction |
121,721 |
62,046 |
- |
(118,250) |
65,517 |
- |
- |
- |
- |
65,517 |
121,721 |
|
|
2,122,941 |
83,700 |
18,209 |
0 |
2,188,432 |
876,215 |
77,020 |
17,185 |
936,050 |
1,252,382 |
1,246,726 |
Amortization expense for year ended March 31, 2007 is $77,020,000 (2006 - $74,067,000).
6. Employee Benefits
a) Pension benefits:
CSC's employees participate in the Public Service Pension Plan, which is sponsored and administered by the Government of Canada. Pension benefits accrue up to a maximum period of 35 years at a rate of 2 percent per year of pensionable service, times the average of the best five consecutive years of earnings. The benefits are integrated with Canada/Qu�bec Pension Plans benefits and they are indexed to inflation.
Both the employees and the department contribute to the cost of the Plan. The 2006-2007 expense amounts to $136,752,791 ($123,760,134 in 2005-2006), which represents approximately 2.2 times (2.6 in 2005-2006) the contributions by employees.
The department's responsibility with regard to the Plan is limited to its contributions. Actuarial surpluses or deficiencies are recognized in the financial statements of the Government of Canada, as the Plan's sponsor.
b) Severance benefits:
CSC provides severance benefits to its employees based on eligibility, years of service and final salary. These severance benefits are not pre-funded. Benefits will be paid from future appropriations. Information about the severance benefits, measured as of March 31, is as follows:
|
(in thousands of dollars) |
2007 |
(restated) |
|---|---|---|
|
Accrued benefit obligation, beginning of year |
117,691 |
103,162 |
|
Expenses for the year |
34,333 |
29,736 |
|
Benefits paid during the year |
(19,544) |
(14,937) |
|
Accrued benefit obligation, end of year |
132,750 |
117,961 |
7. Inmate trust fund
Pursuant to section 111 of the Corrections and Conditional Release Regulations, the Inmate Trust Fund is credited with moneys received from inmates at the time of incarceration, net of earnings of inmates from employment inside institutions, moneys received for inmates while in custody, moneys received from sales of hobby craft, money earned through work while on day parole, and interest. Payments to assist in the rehabilitation of inmates are also charged to this account. Receipts to the Inmate Trust Fund totalled $37,809,500 ($36,312,608 in 2005-2006), while payments totalled $36,998,114 ($35,593,251 in 2005-2006).
|
(in thousands of dollars) |
2007 |
2006 |
|---|---|---|
|
Beginning balance |
11,460 |
10,740 |
|
Receipts |
37,809 |
36,313 |
|
Disbursements |
(36,998) |
(35,593) |
|
Ending Balance |
12,271 |
11,460 |
8. Contingent Liabilities
a) Contaminated sites
Liabilities are accrued to record the estimated costs related to the management and remediation of contaminated sites where the department is obligated or likely to be obligated to incur such costs. The department has identified approximately 67 sites (same as in 2006) where such action is possible and for which a liability of $13,775,571 ($12,964,000 in 2006) has been recorded. CSC has estimated additional clean-up costs of $22,039,000 ($24,239,000 in 2006) that are not accrued, as these are not considered likely to be incurred at this time. CSC's ongoing efforts to assess contaminated sites may result in additional environmental liabilities related to newly identified sites, or changes in the assessments or intended use of existing sites. These liabilities will be accrued by the department in the year in which they become known.
b) Claims and litigations
Claims have been made against the department in the normal course of operations. Legal proceedings for claims totalling approximately $5,519,500 ($3,859,500 in 2006) were still pending at March 31, 2007. Some of these potential liabilities may become actual liabilities when one or more future events occur or fail to occur. To the extent that the future event is likely to occur or fail to occur, and a reasonable estimate of the loss can be made, an estimated liability is accrued and an expense recorded in the financial statements.
9. Contractual Obligations
The nature of the department's activities can result in some large multi-year contracts and obligations whereby the department will be obligated to make future payments when the services/goods are received. Significant contractual obligations that can be reasonably estimated are summarized as follows:
|
(in thousands of dollars) |
2008 |
2009 |
2010 |
2011 |
2012 and thereafter |
Total |
|---|---|---|---|---|---|---|
|
Acquisition of other goods |
25,900 |
10,353 |
3,331 |
2,685 |
- |
42,269 |
10. Related Party Transactions
CSC is related, as a result of common ownership, to all Government of Canada departments, agencies, and Crown corporations. CSC enters into transactions with these entities in the normal course of business and on normal trade terms. Also, during the year, CSC received services that were obtained without charge from other Government departments as presented in part a). In addition, as at March 31, CSC had accounts receivable and accounts payable with other government departments and agencies as presented in part b).
a) Services provided without charge:
During the year, CSC received without charge from other departments services such as accommodation, legal fees, employer's contribution to the health and dental insurance plans and worker's compensation coverage. These services without charge have been recognized in CSC's Statement of Operations as follows:
|
(in thousands of dollars) |
2007 |
2006 |
|---|---|---|
|
Accommodation |
9,964 |
10,143 |
|
Employer's contribution to the health and dental insurance plans |
88,696 |
72,894 |
|
Legal services |
1,942 |
1,973 |
|
Worker's compensation |
5,764 |
6,218 |
|
Total |
106,366 |
91,228 |
The Government has structured some of its administrative activities for efficiency and cost-effectiveness purposes so that one department performs these on behalf of all without charge. The costs of these services, which include payroll and cheque issuance services provided by Public Works and Government Services Canada, are not included as an expense in CSC's Statement of Operations.
b) Payables and receivables outstanding at year-end with related parties:
|
(in thousands of dollars) |
2007 |
2006 |
|---|---|---|
|
Accounts receivable from other government departments and agencies |
13,004 |
5,519 |
|
Accounts payable to other government departments and agencies |
41,848 |
16,107 |
11. Correction of previous year's errors
In 2006-2007, CSC reviewed its tangible capital assets balances. During that exercise, prior years' errors were detected. The tangible capital asset balance was overstated. As a result, an adjustment of $20,757,000 was made. The equity was restated for $17,864,000 and the statement of operations for 2005-2006, for $2,893,000.
In addition, an adjustment of $4,001,000 was made to equity for an overstatement of the severance liability.
12. Comparative Information
Comparative figures have been reclassified to conform to the current year's presentation.
Table 15-b - Financial Statements of Departments and Agencies
(including Agents of Parliament)
CORCAN Revolving Fund
AUDITORS' REPORT
To the Commissioner of Correctional Services Canada
We have audited the statement of financial position of CORCAN Revolving Fund as at March 31, 2007 and the statements of operations, net assets and cash flows for the year then ended. These financial statements have been prepared to comply with Section 6.4 of the Treasury Board of Canada's policy on special revenue spending authorities. These financial statements are the responsibility of CORCAN's Revolving Fund management. Our responsibility is to express an opinion on these financial statements based on our audit.
We conducted our audit in accordance with Canadian generally accepted auditing standards. Those standards require that we plan and perform an audit to obtain reasonable assurance whether the financial statements are free of material misstatement. An audit includes examining, on a test basis, evidence supporting the amounts and disclosures in the financial statements. An audit also includes assessing the accounting principles used and significant estimates made by management, as well as evaluating the overall financial statement presentation.
In our opinion, these financial statements present fairly, in all material respects, the financial position of CORCAN Revolving Fund as at March 31, 2007 and the results of its operations and its cash flows for the year then ended in accordance with the basis of accounting as described in note 2 to the financial statements.
These financial statements, which have not been, and were not intended to be, prepared in accordance with Canadian generally accepted accounting principles, are solely for the information and use of the management of the Revolving Fund and the Treasury Board. The financial statements are not intended to be and should not be used by anyone other than the specified users or for any other purpose.

Ottawa, Canada,
May 23, 2007.
CORCAN Revolving Fund
Statement of Financial Position
As at March 31
(in thousands of dollars)
|
2007 |
2006 |
|
|---|---|---|
|
ASSETS |
||
|
Current |
||
|
Accounts receivable (note 4) |
4,299 |
4,753 |
|
Inventories (note 5) |
9,215 |
9,861 |
|
Other |
181 |
231 |
|
13,695 |
14,845 |
|
|
Capital Assets (note 6) |
10,467 |
8,571 |
|
24,162 |
23,416 |
|
|
LIABILITIES |
||
|
Current |
||
|
Accounts payable (note 7) |
8,476 |
8,036 |
|
Deferred revenue |
727 |
284 |
|
Vacation pay and salary accrual |
2,447 |
2,306 |
|
11,650 |
10,626 |
|
|
Long-Term |
||
|
Employee termination benefits (note 8) |
3,890 |
3,602 |
|
Commitments and contingencies (note 9) |
||
|
Net assets (note 10) |
8,622 |
9,188 |
|
24,162 |
23,416 |
The accompanying notes are an integral part of the financial statements.
CORCAN Revolving Fund
Statement of Operations and Net Assets
Year ended March 31
(in thousands of dollars)
|
2007 |
2006 |
|
|---|---|---|
|
Revenues (note 11) |
60,307 |
46,477 |
|
Cost of goods sold (note 11) |
66,253 |
56,490 |
|
(5,946) |
(10,013) |
|
|
OTHER REVENUES |
||
|
Training and correctional fees (note 3) |
22,262 |
22,598 |
|
Miscellaneous |
332 |
581 |
|
22,594 |
23,179 |
|
|
EXPENSES |
||
|
National/regional headquarters |
9,038 |
9,008 |
|
Employment and employability programs |
3,331 |
3,105 |
|
Selling and marketing |
2,172 |
1,961 |
|
14,541 |
14,074 |
|
|
Net results |
2,107 |
(908) |
|
Net assets, beginning of year |
9,188 |
8,499 |
|
Net financial resources used (provided) and |
(2,673) |
1,597 |
|
Net assets, end of year (note 10) |
8,622 |
9,188 |
The accompanying notes are an integral part of the financial statements.
CORCAN Revolving Fund
Statement of Cash Flows
Year ended March 31
(in thousands of dollars)
| 2007 | 2006 | ||
|---|---|---|---|
|
OPERATING ACTIVITIES |
|||
|
Net Results |
2,107 |
(908) |
|
|
Adjustments for non-cash items: |
|||
|
Provision for termination benefits |
701 |
638 |
|
|
Amortization |
1,516 |
1,298 |
|
|
Loss on disposal of capital assets |
3 |
64 |
|
|
Other |
(1) |
16 |
|
|
4,326 |
1,108 |
||
|
Changes in non-cash working capital: |
|||
|
Accounts receivable |
454 |
1,042 |
|
|
Inventories |
646 |
(2,449) |
|
|
Other |
50 |
(58) |
|
|
Employee termination benefits |
(412) |
(375) |
|
|
Accounts payable |
440 |
3,436 |
|
|
Deferred revenue |
443 |
(1) |
|
|
Vacation pay and salary accrual |
141 |
(2,069) |
|
|
Net Financial resources used by operating activities |
6,088 |
634 |
|
|
INVESTING ACTIVITIES |
|||
|
Capital asset acquisitions |
(3,419) |
(2,265) |
|
|
Proceeds on disposal of capital assets |
4, |
34 |
|
|
Net financial resources used by investing activities |
(3,415) |
(2,231) |
|
|
Net financial resources provided (used) and change in |
2,673 |
(1,597) |
|
|
Accumulated net charge against the Fund's authority, |
11,707 |
13,304 |
|
|
Accumulated net charge against the Fund's authority, |
14,380 |
11,707 |
|
The accompanying notes are an integral part of the financial statements.
CORCAN Revolving Fund
Notes to Financial Statements
March 31, 2007
1. Authority and Purpose
CORCAN Revolving Fund is a special operating agency within Correctional Service Canada financed by way of a Revolving Fund. The CORCAN Revolving Fund ("CORCAN" or "the Fund") was established under Appropriation Act No. 4, 1991-92, which authorized the operation of the Fund effective April 1, 1992 in accordance with terms and conditions prescribed by Treasury Board. CORCAN Revolving Fund's purpose is to aid in the safe reintegration of offenders into Canadian society by providing employment and training opportunities to offenders incarcerated in federal penitentiaries and, for brief periods, after they are released into the community. The Fund has a continuing non-lapsing authority from Parliament to make payments out of the Consolidated Revenue Fund for working capital, capital acquisitions and temporary financing of accumulated operating deficits, the total of which is not to exceed $5,000,000 at any time. An amount of $15,218,000 representing Net Assets assumed by the Fund was charged to this authority when the Fund became operative on April 1, 1992. The Fund is a non-taxable entity.
2. Significant Accounting Policies
The accompanying financial statements have been prepared in accordance with Treasury Board accounting policies which are consistent with Canadian generally accepted accounting principles for the public sector, except for the following: (1) The obligation for employee termination benefits is based on management's estimate of the liability and not an actuarial valuation; and (2) The liability for employee termination benefits earned prior to the creation of the Fund will not to be recorded until 2008, the fifteenth anniversary of the Fund (see note 8).
The significant accounting policies are as follows:
a) Recognition of revenue and expense
Except as noted below, the Fund recognizes revenue when persuasive evidence of a final agreement exists, delivery has occurred and services have been rendered, the selling price is fixed or determinable and collectibility is reasonably assured.
Revenues are accounted for in the period in which the underlying transaction or event occurred that gave rise to the revenues. Revenues that have been received but not yet earned are recorded as deferred revenues.
For multi-year construction contracts in excess of $100,000, the percentage of completion method of accounting is used. Degree of completion is determined by comparing direct costs incurred to date to the total direct costs anticipated for the entire contract. The effect of changes to the total estimated income for each contract is recognized in the period in which the determination is made and losses, if any, are recognized fully when anticipated. Revenues and profits on construction contracts of up to $100,000 are recognized only when the contract has been substantially completed.
Expenses are recorded in the period they are incurred. Vacation pay and compensatory leave are expensed as the benefits accrue to employees under their respective terms of employment.
b) Net cash provided by government
CORCAN operates within the Consolidated Revenue Fund (CRF), which is administered by the Receiver General for Canada . All cash received by CORCAN is deposited to the CRF and all cash disbursements made by CORCAN are paid from the CRF. The net cash provided by Government is the difference between all cash receipts and all cash disbursements including transactions between departments of the federal government.
c) Accounts receivable
Accounts and loans receivables are stated at amounts expected to be ultimately realized; a provision is made for receivables where recovery is considered uncertain.
d) Inventories
Raw materials, Finished Goods and Work in Process inventories are valued at the lower of cost and net realizable value. The Fund makes provisions for excess and obsolete inventory on a site-by-site basis.
e) Capital assets
Capital assets with an initial cost of $10,000 or greater are recorded at cost and are amortized on a straight-line basis over their estimated useful lives commencing on the month after they are put in service, as follows:
|
Equipment |
10 years |
|
Office furniture and equipment |
10 years |
|
Leasehold improvement |
Straight line over the life of the lease |
|
Vehicle fleet |
5 years |
|
Computer equipment |
3 years |
f) Employee future benefits
i. Pension plan: Employees of CORCAN Revolving Fund are covered by the Public Service Superannuation Act and the Supplementary Retirement Benefits Act. The Government of Canada's portion of the pension cost is included in the employee benefits assessed against the Fund. The actual payment of the pension is made from the Public Service Superannuation and Supplementary Retirement Benefits accounts. Pension plan expense is recognized when it is paid. Contributions to the Plan are charged to expenses in the year incurred and represent CORCAN's total obligation to the Plan. Current legislation does not require CORCAN to make contributions for any actuarial deficiencies of the Plan.
ii. Severance benefits: Employees of CORCAN Revolving Fund are entitled to severance benefits under labour contracts or conditions of employment. Severance benefits earned by employees of CORCAN Revolving Fund prior to April 1, 1992 are considered a liability of the Treasury Board and, accordingly, have not been recorded in the accounts of the Fund. The financial statements of CORCAN Revolving Fund include the severance benefits earned by the employees of CORCAN since the inception of the Fund. These benefits are accrued as employees render the services necessary to earn them. The obligation relating to the benefits earned by employees is calculated using information derived from the results of the actuarially determined liability for employee severance benefits for the Government as a whole. CORCAN will account for the pre 1992 severance benefit liability of $1,255,000 on April 1, 2007.
g) Measurement uncertainty
The preparation of these financial statements in accordance with Treasury Board accounting policies which are consistent with Canadian generally accepted accounting principles for the public sector requires management to make estimates and assumptions that affect the reported amounts of assets, liabilities, revenues and expenses reported in the financial statements. At the time of preparation of these statements, management believes the estimates and assumptions to be reasonable. The most significant items where estimates are used are the liability for employee severance benefits, the provision for warranty and the useful life of tangible capital assets. Actual results could significantly differ from those estimated. Management's estimates are reviewed periodically and, as adjustments become necessary, they are recorded in the financial statements in the year they become known.
h) Sick leave
Employees are permitted to accumulate unused sick leave. However, such leave entitlements may only be used in the event of an illness. As per current Government practice, unused sick leave upon employee termination is not payable to the employee. Accordingly, no amount has been accrued in these financial statements.
i) Warranty provision
Potential warranty costs associated with products are recorded when the products are sold.
j) Financial instruments
The fair value of the financial instruments approximates costs unless otherwise specified. The Fund's financial instruments consist of accounts receivable, accounts payable, accrued liabilities and long-term debt. It is management's opinion that the Fund is not exposed to significant interest, currency or credit risks arising from those instruments.
3. Related Party Transactions
CORCAN is related, as a result of common ownership, to all Government of Canada departments, agencies, and Crown corporations. CORCAN enters into transactions with these entities in the normal course of business and on normal trade terms.
During the year, Correctional Service Canada, the parent organization of CORCAN, has provided and is to continue to provide CORCAN Revolving Fund with the use of existing infrastructure including buildings, shops and farms as well as maintenance of said facilities and human resource services. The costs of these services are not included as an expense in the CORCAN's Statement of Operations and Net Assets.
The Government has structured some of its administrative activities for efficiency and cost-effectiveness purposes so that one department performs these on behalf of all without charge. The costs of these services, which include payroll, cheque issuance services and legal services provided by Public Works, Government Services Canada and Justice Canada, are not included as an expense in the CORCAN's Statement of Operations and Net Assets.
CORCAN Revolving Fund entered into the following transactions with the Correctional Service Canada ("CSC") and all Other Government Departments:
|
2007 |
2006 |
|
|---|---|---|
|
(in thousands of dollars) |
||
|
Correctional Service Canada |
||
|
Trade revenues |
14,524 |
12,470 |
|
Training, correctional and other fees |
22,262 |
22,598 |
|
Other Government Departments |
||
|
Trade revenues |
34,964 |
24,542 |
|
71,750 |
59,610 |
|
4. Accounts Receivable
|
2007 |
2006 |
|
|---|---|---|
|
(in thousands of dollars) |
||
|
Government of Canada |
1,182 |
2,120 |
|
Outside parties |
3,315 |
2,911 |
|
4,497 |
5,031 |
|
|
Allowance for doubtful accounts |
(198) |
(278) |
|
4,299 |
4,753 |
|
5. Inventories
Inventories consist of the following:
|
2007 |
2006 |
|
|---|---|---|
|
(in thousands of dollars) |
||
|
Raw materials |
3,963 |
4,399 |
|
Work-in-progress |
439 |
545 |
|
Finished goods |
3,869 |
4,099 |
|
Agribusiness inventory |
1,222 |
1,322 |
|
9,493 |
10,365 |
|
|
Provision for obsolete inventory |
(278) |
(504) |
|
9,215 |
9,861 |
|
6. Capital Assets and Accumulated Amortization
Capital assets consist of the following:
|
Cost |
||||
|---|---|---|---|---|
|
Opening balance |
Acquisitions |
Disposals and write-offs |
Closing balance |
|
|
(in thousands of dollars) |
||||
|
Equipment |
25,591 |
1,934 |
14 |
27,511 |
|
Leasehold improvement |
- |
1,300 |
1,300 |
|
|
Vehicle fleet |
1,375 |
20,165 |
1,395 |
|
|
Other |
158 |
3,419 |
323 |
|
|
27,124 |
3,419 |
14 |
30,529 |
|
|
Accumulated amortization |
||||
|---|---|---|---|---|
|
Opening balance |
Amortization |
Disposals and write-offs |
Closing balance |
|
|
(in thousands of dollars) |
||||
|
Equipment |
17,738 |
1,205 |
7 |
18,936 |
|
Leasehold improvement |
- |
77 |
77 |
|
|
Vehicle fleet |
667 |
216 |
883 |
|
|
Other |
148 |
18 |
166 |
|
|
18,553 |
1,516 |
7 |
20,062 |
|
|
2007 Net book value |
2006 Net book value |
|
|---|---|---|
|
(in thousands of dollars) |
||
|
Equipment |
8,575 |
7,853 |
|
Leasehold improvement |
1,223 |
- |
|
Vehicle fleet |
512 |
708 |
|
Other |
157 |
10 |
|
10,467 |
8,571 |
|
The amortization expense for the year was $1,516,010 (2006 - $1,298,000).
7. Accounts Payable
|
2007 |
2006 |
|
|---|---|---|
|
(in thousands of dollars) |
||
|
Government of Canada |
1,628 |
1,243 |
|
Outside parties |
6,848 |
6,793 |
|
8,476 |
8,036 |
|
8. Employee Future Benefits
a) Pension benefits
CORCAN's employees participate in the Public Service Pension Plan, which is sponsored and administered by the Government of Canada. Pension benefits accrue up to a maximum period of 35 years at a rate of 2 percent per year of pensionable service, times the average of the best five consecutive years of earnings. The benefits are integrated with Canada/Qu�bec Pension Plans benefits and they are indexed to inflation.
Both the employees and CORCAN contribute to the cost of the Plan. The 2006 - 2007 expense amounts to $3,364,000 ($3,680,000 in 2005-2006), which represents approximately 2.6 times the contributions by employees.
CORCAN's responsibility with regard to the Plan is limited to its contributions. Actuarial surpluses or deficiencies are recognized in the financial statements of the Government of Canada, as the Plan's sponsor.
b) Severance benefits
Severance benefits earned prior to the creation of CORCAN on April 1, 1992 are considered a liability of the Treasury Board and therefore not recorded in the accounts of the Fund. As at March 31, 2007, the Treasury Board liability for benefits earned by CORCAN employees prior to April 1, 1992 is $1,255,000 (2006 - $1,335,000). The Treasury Board will fund the payout of these benefits for a period of up to 15 years from the establishment date of CORCAN. CORCAN will therefore become liable for these benefits starting in fiscal 2008.
Information about the severance benefits, measured as at March 31, is as follows:
|
2007 |
2006 |
|
|---|---|---|
|
(in thousands of dollars) |
||
|
Accrued benefit obligation, beginning of the year |
3,602 |
3,339 |
|
Expense for the year |
701 |
638 |
|
Benefits paid during the year |
(413) |
(375) |
|
3,890 |
3,602 |
|
9. Commitments and Contingencies
The nature of CORCAN's activities can result in some multi-year contracts and obligations whereby CORCAN will be obligated to make future payments when the services/goods are received. CORCAN Revolving Fund is committed under the terms of various lease agreements including an amount of $8,591,182 relating to the Kingston warehouse. The lease was entered into on September 2006 and expires in August 2016.
Significant contractual obligations for future payments that can be reasonably estimated are summarized as follows:
|
(in thousands of dollars) |
|
|
2008 |
180 |
|
2009 |
936 |
|
2010 |
1,097 |
|
2011 |
1,085 |
|
2012 and thereafter |
5,685 |
|
8,983 |
In the normal course of operations, CORCAN Revolving Fund becomes involved in various claims and legal proceedings. It is the opinion of management that no claims exist at March 31, 2007.
10. Net Assets
The Net Assets consist of the following:
|
2007 |
2006 |
|
|---|---|---|
|
(in thousands of dollars) |
||
|
Contributed capital |
30,542 |
30,542 |
|
Accumulated net charge against the Fund's authority |
(14,380) |
(11,707) |
|
Accumulated deficit |
(7,540) |
(9,647) |
|
Net assets, end of year |
8,622 |
9,188 |
11. Revenues and Cost of Goods Sold
|
Year ended March 31, 2007 |
|||
|---|---|---|---|
|
Revenues |
Cost of Goods Sold |
Operating Results |
|
|
(in thousands of dollars) |
|||
|
Agribusiness and forestry |
7,896 |
10,919 |
(3,023) |
|
Services |
5,022 |
5,586 |
(564) |
|
Textile |
3,935 |
4,977 |
(1,042) |
|
Manufacturing |
32,392 |
34,048 |
(1,656) |
|
Construction |
11,062 |
10,723 |
339 |
|
60,307 |
66,253 |
(5,946) |
|
|
Year ended March 31, 2006 |
|||
|---|---|---|---|
|
Revenues |
Cost of Goods Sold |
Operating Results |
|
|
(in thousands of dollars) |
|||
|
Agribusiness and forestry |
6,674 |
10,140 |
(3,466) |
|
Services |
5,123 |
4,728 |
395 |
|
Textile |
3,836 |
5,180 |
(1,344) |
|
Manufacturing |
22,750 |
27,755 |
(5,005) |
|
Construction |
8,094 |
8,687 |
(593) |
|
46,477 |
56,490 |
(10,013) |
|
12. Expenses
The following table presents details of expenses by category:
|
2007 |
2006 |
|
|---|---|---|
|
(in thousands of dollars) |
||
|
Salaries and employee benefits |
8,652 |
8,141 |
|
Professional and special services |
3,335 |
3,834 |
|
Rentals |
1,049 |
909 |
|
Transportation and communication |
943 |
789 |
|
Utilities, materials and supplies |
276 |
299 |
|
Other expenditures |
150 |
6 |
|
Purchased repair and maintenance |
71 |
49 |
|
Information |
65 |
47 |
|
14,541 |
14,074 |
|
13. Comparative Information
Comparative figures have been reclassified to conform to the current year's presentation.
Table 16 - Response to Parliamentary Committees, Audits and Evaluations
(non-financial)
1. Responses to Parliamentary Committees
CSC has not responded to any Parliamentary Committee recommendations in 2006-07.
2. Responses to the Auditor General
Reports related to CSC published by the Office of the Auditor General over the course of the year include the following:
- 2006 November - Chapter 4 - Proper Conduct of Public Business - Public Safety and Emergency Preparedness Agencies www.oag-bvg.gc.ca/domino/reports.nsf/html/20061104ce.html
- Commissioner of the Environment and Sustainable Development - 2006 Report www.oag-bvg.gc.ca/domino/reports.nsf/html/c20060904ce.html
3. External Audits:
Office of the Commissioner of Official Languages: Audit of the Direct Health Care Services by Four Federal Institutions: Health Canada, Veterans Affairs Canada, Royal Canadian Mounted Police, and Correctional Service Canada - July 2007 (audit period: May 2005 to May 2006): www.ocol-clo.gc.ca/docs/e/Sante_Health_EN.pdf
4. Internal Audits
In 2006-07, the following audits were completed and approved by CSC's Audit Committee:
- Audit of Travel and Hospitality - December 2006;
- Audit of Staffing Activities - October 2006;
- Audit of Privacy - October 2006;
- Audit of Occupational Safety and Health Programs - August 2006;
- Audit of Drug Interdiction Activities - August 2006;
- Audit of Compensation and Benefits - August 2006;
- Audit of Fire Safety Program - June 2006;
- Audit of Accommodating the Needs of Offenders with Disabilities - April 2006;
- Audit of Environmental Management System - April 2006; and
- Audit of Management of Leave & Overtime - April 2006.
Since the beginning of 2007-08, the following audit reports were also completed:
- Audit of Staff Safety in the Community ;
- Audit of Administrative Segregation ; and
- Audit of Contracting for Goods and Services.
These reports, which also contain the Management Action Plans to address the recommendations, can be found on the CSC website at the following address: www.csc-scc.gc.ca/text/pblct/pa/toc_e.shtml
5. Internal Evaluations
The following evaluation reports were completed in 2006-07:
- Evaluation of the Memorandum of Agreement between the University of Saskatchewan & CSC (2004); and
- Evaluation of the Impact of Uniforms in Women Offender Facilities (2006).
The following evaluation reports were published in 2006-07:
- Effective Corrections: Volunteers in CSC;
- Stan Daniels Healing Centre;
- Effective Corrections Initiative - Aboriginal Reintegration; and
- National Contribution Program/National Aboriginal Contribution Program (Nov 2004).
These reports, which also contain the Management Action Plans to address the recommendations, can be found on the CSC website at the following address: www.csc-scc.gc.ca/text/eval_reports_e.shtml
Table 17 - Sustainable Development Strategies (non-financial)
| Department/Agency: Correctional Service Canada | |
|---|---|
| Points to address | Departmental Input |
|
1. What are the key goals, objectives, and/or long-term targets of the SDS? |
During this final year of SDS Revision 2003, CSC's goals, objectives and targets remained focused on the implementation of initiatives and projects aimed at minimizing CSC's contribution to climate change; smog; water pollution; and the depletion of physical resources from its institutional operations. |
|
2. How do your key goals, objectives and/or long-term targets help achieve your department's / agency's strategic outcomes? |
CSC has one overarching Strategic Outcome: "Offenders are safely and effectively accommodated and reintegrated into Canadian communities." CSC's Sustainable Development Strategy focuses mostly on the environmental sustainability of CSC's infrastructure, ensuring that CSC's facilities are managed in such a way as to limit the impact on the natural environment. The energy conservation, water conservation and solid waste reduction initiatives yield substantial cost savings for CSC, thereby allowing for better offender reintegration programs. As offenders reintegrate into communities, they, their families and other community residents enjoy a safer environment. |
|
3. What were your targets for the reporting period? |
The nine targets established in support of CSC's long-term objectives and key goals are detailed in the agency's Sustainable Development Strategy revision 2003 that can be found at: www.csc-scc.gc.ca/text/pblct/sustain/sds04_e.pdf |
|
4. What is your progress to date? |
Progress was made in fostering result-based accountability within our Regions. We found that the call letter from NHQ to the Regions for submissions of environmental projects and initiatives was, on average, responded to in a more comprehensive and better-documented fashion than it had been in previous years. Cost-benefit analysis studies conducted at some sites in 2004-05 supported acquisition of wind generators for two sites, namely Dorchester and Drumheller institutions. A contract was awarded for the procurement of two 600-kilowatt wind turbines, and commissioning will likely occur in early 2008. Even though many energy-saving projects were implemented, the latest estimates of our energy consumption indicate only a slight reduction (1 to 2%) from the 2000 baseline. This reduction rate, however, has to be balanced against the additional square meters added to CSC's property holdings since 2000. |
|
4. What is your progress to date? (continued) |
The slow administrative processes to award contracts for rehabilitation work on contaminated sites and the limited access to necessary expertise in this field prevented us from making significant progress. However, as a result of the numerous environmental site assessments performed in previous years, we are now in a good position to accelerate site rehabilitation activities in 2007-08. We developed and, with our CORCAN partners, began implementing an environmental farm plan (EFP) at Westmorland Institution in New Brunswick. There is tangible evidence that significant progress is being made in implementing the EFP. By replacing the wastewater treatment system at Joyceville Institution in Ontario (project completed in June 2005) with a system that meets current needs, we improved our performance with regard to treated wastewater flow by 11.7%, which is an average wastewater flow of 700 m3 /day on a corporate total of 6,000 m3/day. Furthermore, we invested in many improvement projects for our wastewater treatment systems in 3 smaller institutions, for a total reduction of 20.3% across CSC. During the first quarter of 2006-07 quarter, our average corporate water consumption was approximately 665 litres per day per occupant, a 17% decrease compared to the 2003 reference year. We attribute this success to the many projects we completed since 2004 to replace water-cooled systems with air-cooled systems, thereby reducing our water consumption. In 2005, we conducted an extensive survey on solid waste management, in which all institutions participated. Consequently, we were able to determine that the average amount of corporate solid waste sent to landfills was 1.36 kg per day per occupant, a 15% decrease compared to the reference year 2000. |
|
5. What adjustments have you made, if any? |
In addition to the above activities, CSC continued to work horizontally within the interdepartmental community, contributing to key issues of sustainable development initiatives and/or programs, including Greening Government Operations. In developing new commitments for the next SDS cycle, i.e., SDS 2007-2010, CSC placed particular emphasis on contributions that support the federal government's objectives. Therefore, in our SDS 2007-2010, we have once again confirmed our priorities; i.e., regrouped under seven main goals, and set 14 commitments linked to tangible targets. For each target, measuring our performance will be straightforward, since we have carefully chosen targets that are measurable. For more information about CSC's SDS 2007-2010, please go to CSC's website at: www.csc-scc.gc.ca/text/pblct/environmentRpt/sds_e.pdf |
Table 18 - Procurement and Contracting
Supplementary information on Procurement and Contracting can be found at: www.tbs-sct.gc.ca/rma/dpr3/06-07/index_e.asp
Table 19 - Client-Centred Service
Not Applicable.
Table 20 - Horizontal Initiatives
CSC participates in, but does not lead any horizontal initiatives. TBS's Horizontal Results database is available at: www.tbs-sct.gc.ca/rma/eppi-ibdrp/hrdb-rhbd/dep-min/dep-min_e.asp
Table 21 - Travel Policy
Correctional Service Canada follows the Treasury Board Secretariat Travel Directive, Rates and Allowances. For more information on CSC's travel and hospitality proactive disclosures, see: www.csc-scc.gc.ca/text/travel/travel_e.shtml
Table 22 - Storage Tanks
Not Applicable.
SECTION 4 OTHER ITEMS OF INTEREST
4.1 Additional Data on Correctional Results
Aboriginal and Non-Aboriginal Offenders: Comparative Data
The following tables present reintegration results for Aboriginal and for non-Aboriginal offenders during community supervision and post-sentence completion (post-WED). Summary versions of these tables, showing the gap in results between Aboriginal and non-Aboriginal offenders, appear in Section 1.6: Departmental Performance.
Re-Offending with Any Conviction while on Supervision
|
Aboriginal |
01-02 |
02-03 |
03-04 |
04-05 |
05-06 |
|
|---|---|---|---|---|---|---|
|
All Convictions |
year |
237 |
240 |
228 |
220 |
228 |
|
3-year average |
250 |
245 |
235 |
229 |
225 |
|
|
Release Flowthrough |
year |
2516 |
2429 |
2471 |
2564 |
2631 |
|
3-year average |
2529 |
2502 |
2472 |
2488 |
2555 |
|
|
Rate |
year |
9.4% |
9.9% |
9.2% |
8.6% |
8.7% |
|
3-year average |
9.9% |
9.8% |
9.5% |
9.2% |
8.8% |
Source: Corporate Reporting System (April 8, 2007). Release Flowthrough as of April 8, 2007.
|
Non-Aboriginal |
01-02 |
02-03 |
03-04 |
04-05 |
05-06 |
|
|---|---|---|---|---|---|---|
|
All Convictions |
year |
937 |
916 |
860 |
874 |
830 |
|
3-year average |
978 |
980 |
904 |
883 |
855 |
|
|
Release Flowthrough |
year |
14095 |
13953 |
13697 |
13592 |
13737 |
|
3-year average |
14341 |
14154 |
13915 |
13747 |
13675 |
|
|
Rate |
year |
6.6% |
6.6% |
6.3% |
6.4% |
6.0% |
|
3-year average |
6.8% |
6.9% |
6.5% |
6.4% |
6.2% |
Source: Corporate Reporting System (April 8, 2007). Release Flowthrough as of April 8, 2007.
Re-Offending with Violent Convictions while on Supervision
|
Aboriginal |
01-02 |
02-03 |
03-04 |
04-05 |
05-06 |
|
|---|---|---|---|---|---|---|
|
Violent Convictions |
year |
61 |
48 |
59 |
60 |
49 |
|
3-year average |
57 |
56 |
56 |
56 |
56 |
|
|
Release Flowthrough |
year |
2516 |
2429 |
2471 |
2564 |
2631 |
|
3-year average |
2529 |
2502 |
2472 |
2488 |
2555 |
|
|
Rate |
year |
2.4% |
2.0% |
2.4% |
2.3% |
1.9% |
|
3-year average |
2.3% |
2.2% |
2.3% |
2.2% |
2.2% |
Source: Corporate Reporting System (April 8, 2007). Release Flowthrough as of April 8, 2007.
|
Non-Aboriginal |
01-02 |
02-03 |
03-04 |
04-05 |
05-06 |
|
|---|---|---|---|---|---|---|
|
Violent Convictions |
year |
188 |
202 |
187 |
172 |
143 |
|
3-year average |
209 |
206 |
192 |
187 |
167 |
|
|
Release Flowthrough |
year |
14095 |
13953 |
13697 |
13592 |
13737 |
|
3-year average |
14341 |
14154 |
13915 |
13747 |
13675 |
|
|
Rate |
year |
1.3% |
1.4% |
1.4% |
1.3% |
1.0% |
|
3-year average |
1.5% |
1.5% |
1.4% |
1.4% |
1.2% |
Source: Corporate Reporting System (April 8, 2007). Release Flowthrough as of April 8, 2007.
Re-Offending with Non-violent Conviction while on Supervision
|
Aboriginal |
01-02 |
02-03 |
03-04 |
04-05 |
05-06 |
|
|---|---|---|---|---|---|---|
|
Non-violent Convictions |
year |
176 |
192 |
169 |
160 |
179 |
|
3-year average |
193 |
189 |
179 |
174 |
169 |
|
|
Release Flowthrough |
year |
2516 |
2429 |
2471 |
2564 |
2631 |
|
3-year average |
2529 |
2502 |
2472 |
2488 |
2555 |
|
|
Rate |
year |
7.0% |
7.9% |
6.8% |
6.2% |
6.8% |
|
3-year average |
7.6% |
7.6% |
7.2% |
7.0% |
6.6% |
Source: Corporate Reporting System (April 8, 2007). Release Flowthrough as of April 8, 2007.
|
Non-Aboriginal |
01-02 |
02-03 |
03-04 |
04-05 |
05-06 |
|
|---|---|---|---|---|---|---|
|
Non-violent Convictions |
year |
749 |
714 |
673 |
702 |
687 |
|
3-year average |
769 |
773 |
712 |
696 |
687 |
|
|
Release Flowthrough |
year |
14095 |
13953 |
13697 |
13592 |
13737 |
|
3-year average |
14341 |
14154 |
13915 |
13747 |
13675 |
|
|
Rate |
year |
5.3% |
5.1% |
4.9% |
5.2% |
5.0% |
|
3-year average |
5.4% |
5.5% |
5.1% |
5.1% |
5.0% |
Source: Corporate Reporting System (April 8, 2007). Release Flowthrough as of April 8, 2007.
Return to Federal Custody for Any Conviction within 2 years post-WED
|
Aboriginal |
00-01 |
01-02 |
02-03 |
03-04 |
04-05 |
|
|---|---|---|---|---|---|---|
|
Re-Admission |
year |
95 |
70 |
96 |
100 |
113 |
|
3-year average |
87 |
86 |
87 |
89 |
103 |
|
|
Offenders Reaching WED |
year |
805 |
776 |
754 |
730 |
794 |
|
3-year average |
751 |
766 |
778 |
753 |
759 |
|
|
Rate |
year |
11.8% |
9.0% |
12.7% |
13.7% |
14.2% |
|
3-year average |
11.6% |
11.2% |
11.2% |
11.8% |
13.6% |
Source: Corporate Reporting System (April 8, 2007).
|
Non-Aboriginal |
00-01 |
01-02 |
02-03 |
03-04 |
04-05 |
|
|---|---|---|---|---|---|---|
|
Re-Admission |
year |
342 |
357 |
389 |
379 |
381 |
|
3-year average |
336 |
336 |
363 |
375 |
383 |
|
|
Offenders Reaching WED |
year |
3831 |
3914 |
3880 |
3793 |
3749 |
|
3-year average |
3778 |
3809 |
3875 |
3862 |
3807 |
|
|
Rate |
year |
8.9% |
9.1% |
10.0% |
10.0% |
10.2% |
|
3-year average |
8.9% |
8.8% |
9.4% |
9.7% |
10.1% |
Source: Corporate Reporting System (April 8, 2007).
Return to Federal Custody for Violent Conviction within 2 years post-WED
|
Aboriginal |
00-01 |
01-02 |
02-03 |
03-04 |
04-05 |
|
|---|---|---|---|---|---|---|
|
Re-Admission |
year |
62 |
41 |
54 |
59 |
67 |
|
3-year average |
54 |
51 |
52 |
51 |
60 |
|
|
Offenders Reaching WED |
year |
805 |
776 |
754 |
730 |
794 |
|
3-year average |
751 |
766 |
778 |
753 |
759 |
|
|
Rate |
year |
7.7% |
5.3% |
7.2% |
8.1% |
8.4% |
|
3-year average |
7.1% |
6.7% |
6.7% |
6.8% |
7.9% |
Source: Corporate Reporting System (April 8, 2007).
|
Non-Aboriginal |
00-01 |
01-02 |
02-03 |
03-04 |
04-05 |
|
|---|---|---|---|---|---|---|
|
Re-Admission |
year |
171 |
181 |
188 |
174 |
204 |
|
3-year average |
174 |
170 |
180 |
181 |
189 |
|
|
Offenders Reaching WED |
year |
3831 |
3914 |
3880 |
3793 |
3749 |
|
3-year average |
3778 |
3809 |
3875 |
3862 |
3807 |
|
|
Rate |
year |
4.5% |
4.6% |
4.8% |
4.6% |
5.4% |
|
3-year average |
4.6% |
4.5% |
4.6% |
4.7% |
5.0% |
Source: Corporate Reporting System (April 8, 2007).
Return to Federal Custody for Non-violent Conviction within 2 years post-WED
|
Aboriginal |
00-01 |
01-02 |
02-03 |
03-04 |
04-05 |
|
|---|---|---|---|---|---|---|
|
Re-Admission |
year |
33 |
29 |
42 |
41 |
46 |
|
3-year average |
34 |
34 |
35 |
37 |
43 |
|
|
Offenders Reaching WED |
year |
805 |
776 |
754 |
730 |
794 |
|
3-year average |
751 |
766 |
778 |
753 |
759 |
|
|
Rate |
year |
4.1% |
3.7% |
5.6% |
5.6% |
5.8% |
|
3-year average |
4.5% |
4.5% |
4.5% |
5.0% |
5.7% |
Source: Corporate Reporting System (April 8, 2007).
|
Non-Aboriginal |
00-01 |
01-02 |
02-03 |
03-04 |
04-05 |
|
|---|---|---|---|---|---|---|
|
Re-Admission |
year |
171 |
176 |
201 |
205 |
177 |
|
3-year average |
161 |
166 |
183 |
194 |
194 |
|
|
Offenders Reaching WED |
year |
3831 |
3914 |
3880 |
3793 |
3749 |
|
3-year average |
3778 |
3809 |
3875 |
3862 |
3807 |
|
|
Rate |
year |
4.5% |
4.5% |
5.2% |
5.4% |
4.7% |
|
3-year average |
4.3% |
4.4% |
4.7% |
5.0% |
5.1% |
Source: Corporate Reporting System (April 8, 2007).
Return to Federal Custody for Any Conviction within 5 years post-WED
|
Aboriginal |
97-98 |
98-99 |
99-00 |
00-01 |
01-02 |
|
|---|---|---|---|---|---|---|
|
Re-Admission |
year |
142 |
165 |
147 |
171 |
159 |
|
3-year average |
147 |
153 |
151 |
161 |
159 |
|
|
Offenders Reaching WED |
year |
607 |
730 |
718 |
805 |
776 |
|
3-year average |
611 |
654 |
685 |
751 |
766 |
|
|
Rate |
year |
23.4% |
22.6% |
20.5% |
21.2% |
20.5% |
|
3-year average |
24.0% |
23.4% |
22.1% |
21.4% |
20.7% |
Source: Corporate Reporting System (April 8, 2007).
|
Non-Aboriginal |
97-98 |
98-99 |
99-00 |
00-01 |
01-02 |
|
|---|---|---|---|---|---|---|
|
Re-Admission |
year |
675 |
641 |
577 |
640 |
644 |
|
3-year average |
693 |
673 |
631 |
619 |
620 |
|
|
Offenders Reaching WED |
year |
4043 |
3820 |
3683 |
3831 |
3914 |
|
3-year average |
4122 |
3993 |
3849 |
3778 |
3809 |
|
|
Rate |
year |
16.7% |
16.8% |
15.7% |
16.7% |
16.5% |
|
3-year average |
16.8% |
16.8% |
16.4% |
16.4% |
16.3% |
Source: Corporate Reporting System (April 8, 2007).
Return to Federal Custody for Violent Conviction within 5 years post-WED
|
Aboriginal |
97-98 |
98-99 |
99-00 |
00-01 |
01-02 |
|
|---|---|---|---|---|---|---|
|
Re-Admission |
year |
92 |
108 |
85 |
121 |
98 |
|
3-year average |
96 |
101 |
95 |
105 |
101 |
|
|
Offenders Reaching WED |
year |
607 |
730 |
718 |
805 |
776 |
|
3-year average |
611 |
654 |
685 |
751 |
766 |
|
|
Rate |
year |
15.2% |
14.8% |
11.8% |
15.0% |
12.6% |
|
3-year average |
15.8% |
15.5% |
13.9% |
13.9% |
13.2% |
Source: Corporate Reporting System (April 8, 2007).
|
Non-Aboriginal |
97-98 |
98-99 |
99-00 |
00-01 |
01-02 |
|
|---|---|---|---|---|---|---|
|
Re-Admission |
year |
370 |
348 |
292 |
317 |
314 |
|
3-year average |
373 |
361 |
337 |
319 |
308 |
|
|
Offenders Reaching WED |
year |
4043 |
3820 |
3683 |
3831 |
3914 |
|
3-year average |
4122 |
3993 |
3849 |
3778 |
3809 |
|
|
Rate |
year |
9.2% |
9.1% |
7.9% |
8.3% |
8.0% |
|
3-year average |
9.0% |
9.0% |
8.7% |
8.4% |
8.1% |
Source: Corporate Reporting System (April 8, 2007).
Return to Federal Custody for Non-violent Conviction within 5 years post-WED
|
Aboriginal |
97-98 |
98-99 |
99-00 |
00-01 |
01-02 |
|
|---|---|---|---|---|---|---|
|
Re-Admission |
year |
50 |
57 |
62 |
50 |
61 |
|
3-year average |
50 |
52 |
56 |
56 |
58 |
|
|
Offenders Reaching WED |
year |
607 |
730 |
718 |
805 |
776 |
|
3-year average |
611 |
654 |
685 |
751 |
766 |
|
|
Rate |
year |
8.2% |
7.8% |
8.6% |
6.2% |
7.9% |
|
3-year average |
8.2% |
7.9% |
8.2% |
7.5% |
7.5% |
Source: Corporate Reporting System (April 8, 2007).
|
Non-Aboriginal |
97-98 |
98-99 |
99-00 |
00-01 |
01-02 |
|
|---|---|---|---|---|---|---|
|
Re-Admission for a non-violent offence |
year |
305 |
293 |
285 |
323 |
330 |
|
3-year average |
320 |
312 |
294 |
300 |
313 |
|
|
Offenders Reaching WED for any type of offence |
year |
4043 |
3820 |
3683 |
3831 |
3914 |
|
3-year average |
4122 |
3993 |
3849 |
3778 |
3809 |
|
|
Rate |
year |
7.5% |
7.7% |
7.7% |
8.4% |
8.4% |
|
3-year average |
7.8% |
7.8% |
7.6% |
7.9% |
8.2% |
Source: Corporate Reporting System (April 8, 2007).
Men and Women Offenders: Comparative Data
The following tables present reintegration results for men and women offenders during community supervision and post-sentence completion (post-WED).
Re-Offending with Violent Convictions while on Supervision
|
Men |
01-02 |
02-03 |
03-04 |
04-05 |
05-06 |
|
|---|---|---|---|---|---|---|
|
Violent Convictions |
year |
245 |
245 |
242 |
229 |
187 |
|
3-year average |
260 |
258 |
244 |
239 |
219 |
|
|
Release Flowthrough |
year |
15756 |
15539 |
15344 |
15307 |
15453 |
|
3-year average |
16020 |
15801 |
15546 |
15397 |
15368 |
|
|
Rate |
year |
1.6% |
1.6% |
1.6% |
1.5% |
1.2% |
|
3-year average |
1.6% |
1.6% |
1.6% |
1.6% |
1.4% |
Source: Corporate Reporting System (April 8, 2007). Release Flowthrough as of April 8, 2007.
|
Women |
01-02 |
02-03 |
03-04 |
04-05 |
05-06 |
|
|---|---|---|---|---|---|---|
|
Violent Convictions |
year |
4 |
5 |
4 |
3 |
5 |
|
3-year average |
6 |
4 |
4 |
4 |
4 |
|
|
Release Flowthrough |
year |
855 |
843 |
824 |
849 |
915 |
|
3-year average |
850 |
855 |
841 |
839 |
863 |
|
|
Rate |
year |
0.5% |
0.6% |
0.5% |
0.4% |
0.5% |
|
3-year average |
0.7% |
0.5% |
0.5% |
0.5% |
0.5% |
Source: Corporate Reporting System (April 8, 2007). Release Flowthrough as of April 8, 2007.
Return to Federal Custody for Violent Offence within 2 years post-WED
|
Men |
00-01 |
01-02 |
02-03 |
03-04 |
04-05 |
|
|---|---|---|---|---|---|---|
|
Re-Admission |
year |
229 |
218 |
236 |
231 |
265 |
|
3-year average |
224 |
217 |
228 |
228 |
244 |
|
|
Offenders Reaching WED |
year |
4408 |
4444 |
4386 |
4279 |
4351 |
|
3-year average |
4329 |
4349 |
4413 |
4370 |
4339 |
|
|
Rate |
year |
5.2% |
4.9% |
5.4% |
5.4% |
6.1% |
|
3-year average |
5.2% |
5.0% |
5.2% |
5.2% |
5.6% |
Source: Corporate Reporting System (April 8, 2007).
|
Women |
00-01 |
01-02 |
02-03 |
03-04 |
04-05 |
|
|---|---|---|---|---|---|---|
|
Re-Admission |
year |
4 |
4 |
6 |
2 |
6 |
|
3-year average |
4 |
4 |
5 |
4 |
5 |
|
|
Offenders Reaching WED |
year |
228 |
246 |
248 |
244 |
192 |
|
3-year average |
200 |
227 |
241 |
246 |
228 |
|
|
Rate |
year |
1.8% |
1.6% |
2.4% |
0.8% |
3.1% |
|
3-year average |
1.8% |
1.8% |
1.9% |
1.6% |
2.0% |
Source: Corporate Reporting System (April 8, 2007).
Mental Health Cases
Revocation while on Supervision
|
Men |
02-03 |
03-04 |
04-05 |
05-06 |
06-07 |
|
|---|---|---|---|---|---|---|
|
Revocations |
year |
259 |
372 |
424 |
453 |
547 |
|
3-year average |
166 |
269 |
352 |
416 |
475 |
|
|
Release Flowthrough |
year |
469 |
640 |
725 |
825 |
949 |
|
3-year average |
320 |
482 |
611 |
730 |
833 |
|
|
Rate |
year |
55.2% |
58.1% |
58.5% |
54.9% |
57.6% |
|
3-year average |
51.9% |
55.8% |
57.5% |
57.0% |
57.0% |
Source: Corporate Reporting System (April 8, 2007). Release Flowthrough as of April 8, 2007.
|
Women |
02-03 |
03-04 |
04-05 |
05-06 |
06-07 |
|
|---|---|---|---|---|---|---|
|
Revocations |
year |
27 |
26 |
40 |
45 |
69 |
|
3-year average |
20 |
25 |
31 |
37 |
51 |
|
|
Release Flowthrough |
year |
48 |
55 |
81 |
111 |
123 |
|
3-year average |
38 |
46 |
61 |
82 |
105 |
|
|
Rate |
year |
56.3% |
47.3% |
49.4% |
40.5% |
56.1% |
|
3-year average |
54.0% |
54.7% |
50.5% |
44.9% |
48.9% |
Source: Corporate Reporting System (April 8, 2007). Release Flowthrough as of April 8, 2007.
Mental Health Cases
Return to Federal Custody for New Offence within 2 years post-WED
|
Men |
00-01 |
01-02 |
02-03 |
03-04 |
04-05 |
|
|---|---|---|---|---|---|---|
|
Re-Admission |
year |
4 |
7 |
17 |
32 |
31 |
|
3-year average |
1 |
4 |
9 |
19 |
27 |
|
|
Offenders Reaching WED |
year |
16 |
101 |
170 |
215 |
249 |
|
3-year average |
6 |
40 |
96 |
162 |
211 |
|
|
Rate |
year |
25.0% |
6.9% |
10.0% |
14.9% |
12.4% |
|
3-year average |
22.2% |
9.2% |
9.8% |
11.5% |
12.6% |
Source: Corporate Reporting System (April 8, 2007).
|
Women |
00-01 |
01-02 |
02-03 |
03-04 |
04-05 |
|
|---|---|---|---|---|---|---|
|
Re-Admission |
year |
0 |
0 |
3 |
0 |
2 |
|
3-year average |
0 |
0 |
1 |
1 |
2 |
|
|
Offenders Reaching WED |
year |
5 |
12 |
19 |
16 |
18 |
|
3-year average |
2 |
6 |
12 |
16 |
18 |
|
|
Rate |
year |
0.0% |
0.0% |
15.8% |
0.0% |
11.1% |
|
3-year average |
0.0% |
0.0% |
8.3% |
6.4% |
9.4% |
Source: Corporate Reporting System (April 8, 2007).
Re-Offending Data
Section 1 presented tables displaying statistics on rates of violent re-offending convictions during community supervision and post-sentence completion (WED). The following tables show corresponding rates for non-violent convictions for the same period.
Re-Offending with Non-violent Conviction while on Supervision
|
01-02 |
02-03 |
03-04 |
04-05 |
05-06 |
||
|---|---|---|---|---|---|---|
|
Non-violent Convictions |
year |
925 |
906 |
842 |
862 |
866 |
|
3-year average |
962 |
962 |
891 |
870 |
857 |
|
|
Release Flowthrough |
year |
16611 |
16382 |
16168 |
16156 |
16368 |
|
3-year average |
16870 |
16656 |
16387 |
16235 |
16231 |
|
|
Rate |
year |
5.6% |
5.5% |
5.2% |
5.3% |
5.3% |
|
3-year average |
5.7% |
5.8% |
5.4% |
5.4% |
5.3% |
Source: Corporate Reporting System (April 8, 2007). Release Flowthrough as of April 8, 2007.
Return to Federal Custody with Non-violent Conviction 2 years post-WED
|
00-01 |
01-02 |
02-03 |
03-04 |
04-05 |
||
|---|---|---|---|---|---|---|
|
Re-Admission |
year |
204 |
205 |
243 |
246 |
223 |
|
3-year average |
195 |
200 |
217 |
231 |
237 |
|
|
Offenders Reaching WED |
year |
4636 |
4690 |
4634 |
4523 |
4543 |
|
3-year average |
4529 |
4576 |
4653 |
4616 |
4567 |
|
|
Rate |
year |
4.4% |
4.4% |
5.2% |
5.4% |
4.9% |
|
3-year average |
4.3% |
4.4% |
4.7% |
5.0% |
5.2% |
Source: Corporate Reporting System (April 8, 2007).
Return Federal Custody with Non-violent Conviction within 5 years post-WED
|
97-98 |
98-99 |
99-00 |
00-01 |
01-02 |
||
|---|---|---|---|---|---|---|
|
Re-Admission |
year |
355 |
350 |
347 |
373 |
391 |
|
3-year average |
371 |
363 |
351 |
357 |
370 |
|
|
Offenders Reaching WED |
year |
4650 |
4550 |
4401 |
4636 |
4690 |
|
3-year average |
4734 |
4648 |
4534 |
4529 |
4576 |
|
|
Rate |
year |
7.6% |
7.7% |
7.9% |
8.0% |
8.3% |
|
3-year average |
7.8% |
7.8% |
7.7% |
7.9% |
8.1% |
Source: Corporate Reporting System (April 8, 2007).
4.2 Incident Investigations
CSC's investigations process includes national and local investigations of incidents and issues affecting its operations. Investigations into inmate deaths or serious bodily injury are convened under section 19 of the CCRA, at either the national or the local level. CSC's Commissioner can also convene investigations under section 20 of the CCRA to report on any matter relating to the operations of CSC.
Other than investigations convened under section 19 and section 20 of the CCRA, the Director General, Incident Investigations and heads of operational units may convene investigations under Commissioner's Directive 041, Incident Reports, to report on incidents and issues affecting CSC's operations.
During fiscal year 2006-07, CSC convened 126 national investigations, including 32 investigations convened under Section 20 of the CCRA, and 94 Tier II Investigations--either convened under Section 19 of the CCRA (death or serious bodily injury) or under paragraph 9 of Commissioner's Directive 041. As indicated in the following tables, 72 investigations involved institution-related incidents, 49 investigations related to community incidents, 4 investigations related to a Community Correctional Centre, and 1 related to a Community-based Residential Facility.
Section 20 Investigations
|
Incident Type |
Community |
Institutional |
Total |
|---|---|---|---|
|
Accessory to Murder |
1 |
0 |
1 |
|
Assault on Inmate |
0 |
1 |
1 |
|
Death Unknown Causes |
0 |
1 |
1 |
|
Deaths by Natural Cause |
0 |
2 |
2 |
|
Major Disturbance |
0 |
1 |
1 |
|
Murder |
5 |
3 |
8 |
|
Murder and Attempted Murder |
1 |
0 |
1 |
|
Sexual activity between patients |
0 |
1 |
1 |
|
Sexual Assault Causing Bodily Harm |
1 |
0 |
1 |
|
Sexual assault on a Minor |
1 |
0 |
1 |
|
Suicide |
0 |
11 |
11 |
|
Attempted Murder |
0 |
1 |
1 |
|
Death by Possible Suicide or Overdose |
0 |
1 |
1 |
|
Missing Weapon, Ammunition and Suicide of Officer |
0 |
1 |
1 |
|
Grand Total |
9 |
23 |
32 |
Tier II Investigations
|
Incident Type |
Com-munity |
Instit-utional |
Instit-utional /CCC |
Instit-utional /CRF |
Total |
|---|---|---|---|---|---|
|
Accident, Attempted Escape |
0 |
1 |
0 |
0 |
1 |
|
Aggravated Assault Charges |
1 |
0 |
0 |
0 |
1 |
|
Aggravated Assault, Assault with Weapon etc. |
1 |
0 |
0 |
0 |
1 |
|
Aggravated Assault, Robbery, Unlawful Confinement etc. |
1 |
0 |
0 |
0 |
1 |
|
Assault on Inmate |
0 |
9 |
0 |
0 |
9 |
|
Assault on Staff |
0 |
4 |
0 |
0 |
4 |
|
Attempted murder, |
1 |
0 |
0 |
0 |
1 |
|
Attempted Murder, Assault with Weapon, Robbery with Violence |
1 |
0 |
0 |
0 |
1 |
|
Attempted Murder, Robbery with Firearm etc. |
1 |
0 |
0 |
0 |
1 |
|
Attempted suicide |
0 |
4 |
0 |
0 |
4 |
|
Attempted Suicide, Self-Inflicted Injuries |
0 |
1 |
0 |
0 |
1 |
|
Charges of Production of Marijuana for purposes of trafficking |
1 |
0 |
0 |
0 |
1 |
|
Charges Possession for the Purpose of Trafficking |
1 |
0 |
0 |
0 |
1 |
|
Death by Overdose |
1 |
1 |
1 |
0 |
3 |
|
Death by Suspected Overdose |
2 |
0 |
0 |
1 |
3 |
|
Death Natural Cause |
3 |
14 |
2 |
0 |
19 |
|
Death Unknown Cause |
0 |
4 |
0 |
0 |
4 |
|
Escape (single offender) |
0 |
2 |
0 |
0 |
2 |
|
Escape and subsequent robberies |
0 |
1 |
0 |
0 |
1 |
|
Escapes (multiple offenders) |
0 |
2 |
0 |
0 |
2 |
|
Inmate Fight |
0 |
1 |
0 |
0 |
1 |
|
Inmate Injury |
0 |
2 |
0 |
0 |
2 |
|
Multiple Assault and Weapons charges |
1 |
0 |
0 |
0 |
1 |
|
Multi-vehicle collision |
1 |
0 |
0 |
0 |
1 |
|
Offender Suicide |
4 |
0 |
0 |
0 |
4 |
|
Robbery |
1 |
0 |
0 |
0 |
1 |
|
Self-Inflicted Injury |
0 |
2 |
0 |
0 |
2 |
|
Sexual Offence |
15 |
0 |
0 |
0 |
15 |
|
Suicide |
2 |
0 |
0 |
0 |
2 |
|
Suspect in shooting |
1 |
0 |
0 |
0 |
1 |
|
Being Unlawfully at Large (UAL) |
0 |
0 |
1 |
0 |
1 |
|
UAL on Day Parole and new charges |
1 |
0 |
0 |
0 |
1 |
|
Use of Force |
0 |
1 |
0 |
0 |
1 |
|
Grand Total |
40 |
49 |
4 |
1 |
94 |
4.3 Glossary
Aboriginal
First Nation, M�tis or Inuit.
Aboriginal community
Aboriginal community is a First Nation, tribal council, band, community, organization or other group with a predominantly Aboriginal leadership.
Administrative segregation
Administrative segregation is confinement to keep the offender from associating with other inmates in order to maintain the security of the institution. Inmates may be segregated involuntarily or voluntarily.
Community-based Residential Facilities (CRF)
Facilities contracted from outside agencies or organizations to house federal offenders in the community.
Community Correctional Centre (CCC)
CCCs primarily house offenders on day parole and are designated as minimum-security institutions. In these, the director, parole officers and support staff work as a team, often in co-operation with community partners, to supervise and provide programs for offenders and prepare them for full parole.
Corrections and Conditional Release Act (CCRA)
The legislative framework governing Correctional Service Canada.
Conditional Release
Conditional release helps inmates make a gradual, supervised return to society while serving their sentence. Regardless of the type of conditional release, all offenders are supervised until their Warrant Expiry Date.
- Temporary Absences (TAs)
Temporary Absences may be granted to offenders for medical, administrative, community service, family contact, and personal development reasons.- Escorted temporary absence (ETA) may be granted at any time during the sentence .
- Unescorted temporary absence (UTA) may be granted after an offender has served one-sixth of the sentence or six months, whichever is greater.
- Work Release (WR)
Work release allows an offender, classified as minimum or medium security and who is judged not to pose an undue risk, to do paid or voluntary work in the community under supervision. - Day Parole (DP)
Day parole allows an offender to participate in community-based activities to prepare for release on full parole or statutory release. - Full Parole (FP)
Inmates are normally eligible to be considered for full parole by the National Parole Board, after serving one-third of their sentence, or seven years, whichever is less. - Statutory Release (SR)
By law, most offenders who are serving sentences of fixed length, and who have not been granted parole or had their parole revoked, must be released on statutory release after serving two-thirds of their sentence.
CORCAN
A Special Operating Agency (SOA) that employs federal offenders for its workforce and, in doing so, provides them with working skills and working habits necessary to compete in the workforce.
Correctional Programs
Correctional programs are designed to improve offenders' current knowledge and skill level, improving the likelihood of successful reintegration into the community upon release.
Healing Lodge
These types of facilities may or may not be located on First Nations' reservation land. There are two distinct types of Healing Lodges available to offenders under the care and custody of CSC.
A Section 81 Healing Lodge is an Aboriginal community based correctional facility where the community has entered into an agreement with the Minister of Public Safety and Emergency Preparedness Canada for the provision of correctional care and custody to Aboriginal and non-Aboriginal offenders. The second type is located on CSC property and run by CSC with the assistance of community Aboriginal people.
Ion scanner
An ion scanner is an electronic device that has the ability to detect residual amounts of particular drugs on personal items such as money or credit cards.
Long Term Supervision Order (LTSO)
A Long Term Supervision Order is an order imposed by the court. The offender who has received such an order is supervised in accordance with the CCRA. The Long Term Supervision Order commences when the offender has finished serving all sentences for offences for which he or she had been convicted. The period of supervision to which the offender is subject at any time must not total more than 10 years.
Maximum Security Institutions
House offenders who pose a serious risk to staff, other offenders and the community. The perimeter of a maximum-security institution is well defined, highly secure and controlled. Offender movement and association are strictly regulated and directly supervised.
Medium Security Institutions
House offenders who pose a risk to the safety of the community. The perimeter of a medium-security institution is well defined, secure and controlled. Offender movement and association is regulated and generally supervised.
Minimum Security Institutions
House offenders who pose a limited risk to the safety of the community. The perimeter of a minimum-security institution is defined but not directly controlled. Offender movement and association within the institution are regulated under minimal supervision.
Multi-level Institutions
House offenders of different security classifications in different secure areas of the institution.
Offender Management System (OMS)
The automated information system used by CSC as its main database for offender information.
Revocation
If parolees violate the conditions of their conditional release, or have been charged with a criminal offence, their conditional release (day parole, full parole) is suspended and they are re-incarcerated. Upon reviewing the case at a formal hearing, the National Parole Board may then decide to revoke parole and have the offender remain incarcerated. If the offender is not revoked, the conditional release is reinstated.
Sections 81/84 of CCRA
Section 81 enables CSC to enter into agreements with Aboriginal communities for the provision of correctional services to Aboriginal offenders. These agreements permit CSC, with the consent of the offender and the Aboriginal community, to transfer the care and custody of the offender to an Aboriginal community. Under Section 84 of the CCRA, CSC gives the Aboriginal community an opportunity to propose a plan for the inmate's release to, and integration into, the Aboriginal community.
Security Classification
Each offender is reviewed initially on admission and then periodically throughout their sentence and is classified as a maximum, medium or minimum security risk and normally placed in an institution of the same classification. The security risk level is based on an assessment of factors related to public safety, escape risk and institutional adjustment.
Warrant Expiry Date (WED)
The date the sentence imposed by the courts officially ends.
4.4 Further Information
Correctional Service of Canada Internet site: www.csc-scc.gc.ca
CSC Contacts:
Bill Staubi
Director General
Performance Management
340 Laurier Avenue West
Ottawa, Ontario
K1A 0P9
Telephone: (613) 992-8723
Facsimile: (613) 995-5064
Email: StaubiBH@csc-scc.gc.ca
Jennifer Wheatley
Acting Assistant Commissioner
Performance Assurance
340 Laurier Avenue West
Ottawa, Ontario
K1A 0P9
Telephone: (613) 996-1710
Facsimile: (613) 943-9292
Email: WheatleyJM@csc-scc.gc.ca
1 This is the Strategic Outcome as per the PAA that appears in the 2006-07 RPP. In the most recent RPP (2007-08) the wording was modified to: "Offenders are safely and effectively accommodated and reintegrated into Canadian communities with due regard to public safety."
2 More information on CSC is available in its 2007-08 RPP at: www.tbs-sct.gc.ca/rpp/0708/csc-scc/csc-scc_e.pdf
3 For more information, see the Glossary at the end of this report.
4 Source: CSC Offender Management System. Note that, within a given year, many offenders move between incarceration and conditional release. In such cases, the offender is counted only once in each category.
5 A Reference Level is the current dollar balance of funding available to an organization for each year as approved by Treasury Board and/or statutory estimates related to statutes of Canada.
6 Corporate management costs are factored into the above 72-28 percent distribution.
7 CSC has changed its definition of 'employee' to be consistent with the definition used by the Canada Public Service Agency. Previously, casual employees, employees on leave without pay and suspended employees were included. Source: CSC Human Resources Management System (March 31, 2007).
8 Source: CSC Human Resources Management System (Employment equity data, March 31, 2007).
9 As per the latest data released by Statistics Canada (2001 Census Data).
10 Source: CSC Research Branch. For more information, see "The Changing Federal Offender Population" (August 2006). Available at: www.csc-scc.gc.ca/text/rsrch/special_reports/highlights-2006_e.shtml
11 Ibid.
12 Ibid.
13 The annual average cost per offender has increased by 4.1% from 2004-05 ($68,216) to 2005-06 ($71,004). Source: CSC Comptroller Branch.
14 Parole offices, typically being rented facilities, do not present the same maintenance issues as correctional institutions.
15 Planned Spending includes Main Estimates plus adjustments already supported by TBS. Total Authorities includes Planned Spending as well as Supplementary Estimates and access to the TB contingency Vote 5. For more information, see Section 3.2: Financial Information.
16 CSC is currently developing performance measures for all levels of its Program Activity Architecture. These will be used for 2008-09 reporting.
17 Since they provide a more reliable indicator, the three-year moving averages (of rates) will be the primary method used by CSC to measure long-term improvements in performance. At the same time, annual objectives have been established and annual results are closely monitored to provide early indications of potential shifts in trends. CSC is committed to achieving improvements in its results, as reflected in both the annual results and the three-year moving averages.
18 Result commitments were not set for 2006-07.
19 CORCAN operates through a revolving fund, with operating costs offset by revenues.
20 While not a Program Activity, Corporate Management supports all program activities, and costs associated with it are distributed throughout the PAA in other financial tables, as reflected in the Main Estimates.
21 In view of the fiscal restraint measures introduced in November 2006, CSC adjusted these performance expectations as reflected in its 2007-08 RPP.
22 Results that are more detailed are presented in Section 2.1.1. Major Institutional Incidents include staff murders, inmate murders, hostage taking/forcible confinement, escapees from institutions or escorts, suicides, as well as any assaults on staff, assaults on inmates or inmate fights that result in a major injury.
23 "Institutional Flowthrough" refers to the number of offenders who spend at least one day during the fiscal year in an institution.
24 Data includes "Commit", "Attempt to commit", "Threaten to commit", "Suspected of committing", "Conspire to commit" and so on.
25 "Institutional Staff" reflects the number of CSC employees in institutions at a given point in the year. This number is thus a snapshot, rather than a flowthrough (see footnote 23).
26 The data in the two tables below include "minor" and "major" injuries.
27 Although the Report on Plans and Priorities 2006-07 described CSC's Mental Health Strategy as having six components, one component (providing coordination and leadership in the delivery and development of mental health services) has been subsumed under the other components of the Strategy. The five components are: Implement clinical screening and assessment process at intake; Provide primary mental health care in all CSC institutions; Create intermediate mental health care units in selected men's institutions; Ensure consistent standards and approach in CSC mental health treatment centres; and, Implement community mental health initiative.
28 The creation of intermediate mental health care units in selected men's institutions is the only remaining unfunded component of CSC's Mental Health Strategy.
29 The Community Mental Health Initiative received five-year funding starting in 2005-06.
30 In view of the fiscal restraint measures introduced in November 2006, CSC adjusted these performance expectations as reflected in its 2007-08 RPP. In the short term, CSC is limited to reporting results based on the mental health condition of offenders at admission. In the longer term, CSC will work toward improving its capability of reporting correctional results based on the mental health condition of offenders prior to their release into the community.
31 Revocation statistics require a case-by-case analysis in order to determine the appropriateness of any given case. As a result, revocation data, while it will continue to be monitored closely, will not be used as a result indicator in future years.
32 This mental health indicator was not available at intake for most of the offenders who reached the end of their sentence five to ten years ago. The few that had a completed intake mental health assessment are not representative of the offender population over the past ten years. For this reason, CSC is not able to report at this time on the re-offending rate of offenders with mental health disorders at five years past Warrant Expiry Date (WED).
33 Highlights and recommendations available at: www.parl.gc.ca/39/1/parlbus/commbus/senate/com-e/soci-e/rep-e/pdf/rep02may06high-e.pdf
34 There has not been a formal Government response to the Senate Committee report.
35 Source: CSC 2004-05 Departmental Performance Report.
36 In view of the fiscal restraint measures introduced in November 2006, CSC adjusted these performance expectations as reflected in its 2007-08 RPP.
37 It is important to note that while CSC contributes to reducing the long-term rate of offenders returning to federal custody, several external factors influence this result, including the profile of the offenders, legislation, sentencing trends, law enforcement capacity, and events that happen to offenders following sentence completion and when they are no longer under CSC's jurisdiction.
38 CSC's 2006-07 RPP also referred to the percentage of offenders charged with a new offence; however, after further analysis, conviction data is considered to be a more results-based indicator of reoffending. Charge data will continue to be monitored.
39 CSC has implemented a one-year delay in reporting new convictions for offenders in order to allow time for the judicial process. Reporting these results at the end of each fiscal year would misrepresent the actual results since the courts would not have had the opportunity to process the charges.
40 For more information, see the following research report: "The Safe Return of Offenders to the Community" (CSC: April 2005), available at: www.csc-scc.gc.ca/text/rsrch/safe_return2005/safe_return2005_e.pdf
41 Information on the continuum of care model for Aboriginal offenders is available at: www.csc-scc.gc.ca/text/prgrm/correctional/abissues/plan06_e.shtml#6
42 The data source for the following tables is the Offender Management System (April 8, 2007).
43 In view of the fiscal restraint measures introduced in November 2006, CSC adjusted these performance expectations as reflected in its 2007-08 RPP.
44 Available at: www.csc-scc.gc.ca/text/prgrm/correctional/abissues/documents/spac06_e.pdf
45 Available at: www.statcan.ca/english/freepub/85-002-XIE/85-002-XIE2006003.pdf
46 There were no corporate level employee surveys conducted in 2006-07.
47 For more information on the MAF, see: www.tbs-sct.gc.ca/maf-crg/index_e.asp
48 The Whole-of-Government Framework is used for whole-of-government reporting, as reflected in documents such as the annual Canada's Performance reports: www.tbs-sct.gc.ca/report/govrev/06/cp-rc_e.pdf
49 CSC's management improvement agenda, while not a Sub-Activity, is included in this column.
50 Institutional Services is another Sub-Activity; however, there are no RPP plans associated with it.
51 Information of an extremely sensitive and personal nature.
52 Available at: www.csc-scc.gc.ca/text/PA/audit_druginterdiction2006/druginterdiction2006_e.pdf
53 "Oleoresin Capsicum" spray, also known as pepper spray.
54 Assaults on staff, assaults on inmates and inmate fights are included only if they result in a major injury.
55 The data presented below includes, but is not limited to, incidents that involve charges or convictions.
56 Revocations can be for new offences or for other reasons, such as non-compliance with release conditions.
57 CSC Management Control Framework: Health Services ( Nov 30, 2006 ).
58 See "The Budget Plan 2007", available at: www.budget.gc.ca/2007/pdf/bp2007e.pdf
59 As per the PAA, Inmate Pay is a Sub-Activity as well. There were no RPP plans or priorities associated with Inmate Pay.
60 Dynamic Factor Identification and Analysis directs the Parole Officer/Primary Worker towards areas of concern that may be unique to an offender.
61 Under Section 84 of the CCRA, CSC gives the Aboriginal community an opportunity to propose a plan for the inmate's release to, and integration into, the Aboriginal community.
62 Available at: www.csc-scc.gc.ca/text/rsrch/reports/r130/r130_e.pdf
63 The Pathways unit re-opened on June 1, 2007
64 Results concerning reintegration of offenders can be found in Section 1.6: Departmental Performance , under the Community Transition priority. Additional data on correctional results is presented in Section 4.1 .
65 Due to expenditure reduction measures, training had to be curtailed, and not all Parole Officers were trained. As a result, this initiative was carried over to the subsequent year as reflected in the 2007-08 Report on Plans and Priorities.
66 "Outcomes" include all program assignments that ended within the fiscal year, whether as a result of successful completion, the offender dropping out of the program, transfer of the offender to another institution, and so on.
67 Further information on CORCAN can be found on CSC's website at: www.csc-scc.gc.ca/text/prgrm/corcan/home_e.shtml
68 As per the Program Activity Architecture.
69 An offender may earn more than one certificate.
70 Employee data: Human Resource Management System (March 31, 2007).
71 Available at: www.csc-scc.gc.ca/text/pblct/sphrm07_10/StrPlaHRMn_e.pdf
72 The Offender Management System is used to gather, store and retrieve information on federal offenders.
73 Available at: www.csc-scc.gc.ca/text/pblct/sphrm07_10/StrPlaHRMn_e.pdf
74 Source: CSC Human Resource Management System (March 31, 2007).
75 Available at: www.psagency-agencefp.gc.ca/survey-sondage/2005/index_e.asp
76 Four groups are designated as Employment Equity groups, as per the Employment Equity Act: women, Aboriginal peoples, members of visible minorities and persons with disabilities.
77 A Results-based Management and Accountability Framework provides Program Managers with a concise statement or road map to plan, monitor, evaluate and report on the results throughout the lifecycle of a program, policy or initiative.
78 Available at: www.tbs-sct.gc.ca/pol/doc-eng.aspx?id=12340
79 Although not a member of the Executive Committee, the Chief Audit Executive reports directly to the Commissioner. Also, in Summer 2007, a new Health Services sector, led by an Assistant Commissioner, was added to CSC's organizational structure.
80 As mentioned, in 2007-08 a new Health Services Sector was added to CSC's organizational structure, taking over accountability for health services from Correctional Operations and Programs. The new sector, which includes new directorates at headquarters and in regions, will help support and continually improve the quality of health services provided to inmates, while ensuring that policies are applied consistently. It will also ensure standardized practices and provide greater integration of physical and mental health services.
81 Includes 58 institutions as well as Community Correctional Centres, displayed in italic.
82 Includes the Special Handling Unit.
Table 9-b – Policy on Service Standards for External Fees
| A. External Fee | Service Standard | Performance Result | Stakeholder Consultation |
|---|---|---|---|
|
Fees charged for the processing of access requests filed under the Access to Information Act (ATIA). |
Response provided within 30 days following receipt of request; the response time may be extended pursuant to section 9 of the ATIA. Notice of extension to be sent within 30 days after receipt of request. |
97% on time for ATI requests. |
The service standard is established by the Access to Information Act and the Access to Information Regulations. Consultations with stakeholders were undertaken by the Department of Justice and the Treasury Board Secretariat for amendments done in 1986 and 1992. |
|
B. Other Information: N/A |
|||
Table 18-a – Procurement and Contracting
| Department/Agency: Correctional Service Canada | |
|---|---|
| Points to address | Departmental Input |
|
1. Role played by procurement and contracting in delivering programs |
Contracting and Materiel Services (CMS) divisions play an important role in CSC's day to day operations. Their responsibilities are many and varied. The Service's Contract Review Boards (CRB) and the trained and dedicated Personnel from the CMS divisions are the front-line review experts who ensure that contracting and materiel management policies and delegated authorities are properly administered. |
|
2. Overview of how the department manages its contracting function |
CSC operates in a decentralized environment with procurement personnel not only at Headquarters, but also in regional and institutional offices. Contracting authority, in most cases, is delegated to purchasing managers across CSC for the purchase of goods and services up to $5,000 and for call ups against Standing Offer Agreements. CSC's contracting functional authority awards most contracts above this amount and, in addition, provides advice, guidance and training to managers on policy and procedures. This reflects the department's aim to put into place the delegations necessary for managers to deliver quality services and programs to our clients within a reasonable time frame. All significant requests for contracts are reviewed by a national or regional CRB, our challenge mechanisms and decision making bodies to oversee our contracting processes. A National Standard Contracting delegation instrument with a checklist (questions to be asked) has been promulgated. In calendar year 2006, CSC awarded 72,500 contracts and amendments for a value of $338,000,000. |
|
3. Progress and new initiatives enabling effective and efficient procurement practices |
CSC continues to use the tools developed by CMS to monitor and heighten the visibility and reporting of contracting activities and emphasize the use of good contracting practices. Examples of this activity is: The creation of electronic information and reports that will enhance the accuracy of our year end Purchasing Activity information to be entered into the PWGSC system. Several hundred of our administrative and management personnel have received training related to the use of our National Contract delegation instrument. All significant Agreements other than contracts are now being reviewed by our Legal services and CRB; these documents include Memorandum of Understandings, Partnership Agreements, Interdepartmental letter of Agreements, Service Agreements and other cooperative arrangements for services. |
|
4. Key Accomplishments |
As part of the Treasury Board "Proactive Contract Disclosure Initiative", CSC identified and posted, on its web site, over 2,000 contracts above $10,000 that were awarded in 2006-2007. CSC continued to promote its approval of the "Professional Development and Certification Program" for members of the Procurement and Materiel Management community. Many of our members have begun to participate in the mandatory Fundamental courses that have been offered and have further enrolled in the Program. We have reinforced our mandate of supporting CORCAN, a special operating agency within CSC that provides employment to federal inmates by ensuring that CORCAN is designated as a primary supplier for the goods and services that CORCAN provides CSC by using offender labour. A rigorous internal audit of our contracting activities has confirmed CSC's effective and efficient procurement practices. The resulting audit recommendations were generally all administrative in nature. |
Table 18-b – Materiel Management
| Department/Agency: Correctional Service Canada | |
|---|---|
| Points to address | Departmental Input |
|
1. Overview of how the department manages its moveable assets |
CSC operates in a decentralized environment with personnel at Headquarters and in the regional and Institutional offices. CSC uses an Oracle based Integrated Financial and Materiel Management system (IFMMS) including a Fixed Assets module. This module identifies CSC moveable assets for custodial purposes for assets up to $10,000 in value and identifies depreciable assets and expected life cycle for all individual items equal to or greater than this amount. |
|
2. Inventory, life cycle and costs of moveable assets |
The life cycle is based on Treasury Board standards for life cycle management. |
|
3. Progress and new initiatives enabling effective and efficient Asset Management practices |
In conjunction with IFMMS, CSC is developing a more in-depth life-cycle asset management system for CSC Informatics Technology (IT) equipment. This initiative will provide IT personnel with additional information, required for the life cycle management of IT assets, which is not included in IFMMS. |