
Treasury Board of Canada Secretariat
www.tbs-sct.gc.ca
Common menu bar links
Breadcrumb Trail
ARCHIVED - Canada School of Public Service - Report
 This page has been archived.
Archived Content
Information identified as archived on the Web is for reference, research or recordkeeping purposes. It has not been altered or updated after the date of archiving. Web pages that are archived on the Web are not subject to the Government of Canada Web Standards. As per the Communications Policy of the Government of Canada, you can request alternate formats on the "Contact Us" page.
Section III: Supplementary Information
Financial Highlights
| % Change | 2010-11 | 2009-10 | |
|---|---|---|---|
| Total Assets | -10% | 20,120 | 22,327 |
| Total Liabilities | -9% | 29,287 | 32,092 |
| Equity of Canada | -6% | (9,167) | (9,765) |
| Total | -10% | 20,120 | 22,327 |
| % Change | 2010-11 | 2009-10 | |
|---|---|---|---|
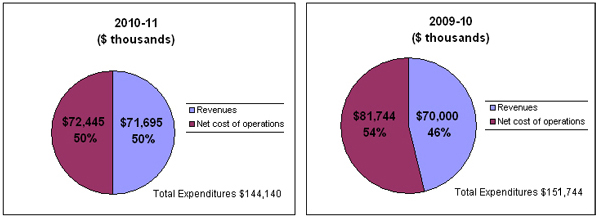
| Total Expenses | -5% | 144,140 | 151,744 |
| Total Revenues | 2% | 71,695 | 70,000 |
| Net Cost of Operations | -11% | 72,445 | 81,744 |
Financial Highlights Charts/Graphs
Financial Statements
The financial highlights presented within the Departmental Performance Report are intended to serve as a general overview of the School's financial position. More information is available on The School's website at: http://www.csps-efpc.gc.ca/aut/cdo/index-eng.asp.
List of Supplementary Information Tables
All electronic supplementary information tables found in the 2010-11 Departmental Performance Report can be found on the Treasury Board of Canada Secretariat's website.
- Sources of Respendable and Non-Respendable Revenue
- User Fees Reporting
- Status Report on Projects Operating with Specific Treasury Board Approval
- Green Procurement
- Response to Parliamentary Committees and External Audits
- Internal Audits and Evaluations
Section IV: Other Items of Interest
Organizational Contact Information
http://www.csps-efpc.gc.ca/cus/index-eng.asp
Additional Information
[1] "Type" is categorized as follows: Previously committed to—committed to in the first or second fiscal year before the subject year of the report; Ongoing—committed to at least three fiscal years before the subject year of the report; and New—newly committed to in the reporting year of the Departmental Performance Report.
[2] Exceeded: More than 100 per cent of the expected level of performance for the priority identified in the corresponding RPP was achieved during the fiscal year.
Met All: 100 per cent of the expected level of performance for the priority identified in the corresponding RPP was achieved during the fiscal year.
Mostly Met: 80 to 99 per cent of the expected level of performance for the priority identified in the corresponding RPP was achieved during the fiscal year.
Somewhat Met: 60 to 79 per cent of the expected level of performance for the priority identified in the corresponding RPP was achieved during the fiscal year.
Not Met: Less than 60 per cent of the expected level of performance for the priority identified in the corresponding RPP was achieved during the fiscal year.
[3] The School's Planned Spending figures include its appropriations and forecasted revenue generated for 2010-11. The School's Total Authorities include its appropriations, actual revenues generated and its carry forward revenues from the previous fiscal year pursuant to section 18(2) of the CSPS Act.
[4] Commencing in the 2009-10 Estimates cycle, the resources for Program Activity: Internal Services is displayed separately from other program activities; they are no longer distributed among the remaining program activities, as was the case in previous Main Estimates. This has affected the comparability of spending and FTEinformation by program activity between fiscal years.
[5] Internal Services includes: Management and Oversight Services; Communications Services; Legal Services; Human Resources (HR) Management Services; Financial Management Services; Information Management (IM) Services; Information Technology (IT) Services; Real Property Services; Material Services; Acquisition Services; and, Travel and Other Administrative Services.