
Treasury Board of Canada Secretariat
www.tbs-sct.gc.ca
Common menu bar links
Breadcrumb Trail
ARCHIVED - Western Economic Diversification Canada - Report
 This page has been archived.
Archived Content
Information identified as archived on the Web is for reference, research or recordkeeping purposes. It has not been altered or updated after the date of archiving. Web pages that are archived on the Web are not subject to the Government of Canada Web Standards. As per the Communications Policy of the Government of Canada, you can request alternate formats on the "Contact Us" page.
Section II: Analysis of Program Activities by Strategic Outcomes
2.1 Entrepreneurship & Innovation
Strategic Outcome: The western Canadian economy is competitive, expanded and diversified.
Western Economic Diversification (WD) contributes to achieve this strategic outcome by working with western Canadian business, industry and research organizations to undertake initiatives that enhance business productivity and competitiveness; support trade and investment attraction, and facilitate the penetration of western Canadian technologies, services and value-added products into international markets. WD also supports greater access to risk capital and business services for entrepreneurs and small business through programs and services offered in conjunction with other business services organizations and associations.
WD also contributes to this strategic outcome by supporting a range of activities to expand the western innovation system, increase capacity to develop and commercialize technologies and products to facilitate the West’s transition to a knowledge-based economy. These activities include targeted investments in knowledge infrastructure, research and development (R&D), highly qualified people, access to adequate long-term financing, technology commercialization facilities and support systems, and mechanisms to link these elements to each other.
WD utilizes a number of economic indicators to gauge the competiveness, growth, and diversity of the western Canadian economy in order to better understand the environment which it is attempting to influence. The year-over-year real Gross Domestic Product (GDP) growth rate for the West declined in both 2007 and 2008, and was negative in 2009, due to the global economic crisis; however, in four of the last five years it has exceeded the national rate.
Annual international trade (the value of exports excluding primary production sectors) decreased from $42.74B in 2008 to $34.97B in 2009, also reflecting the impact of the global economic downturn. R&D intensity as measured by Gross Domestic Expenditures on R&D (GERD) as a percentage of GDP, decreased slightly from 1.3 per cent in 2006 to 1.2 per cent in 2007, representing a relatively stable level of expenditure. Ideally, the percentage of R&D expenditures should grow over time in order to support the growth of the knowledge-based economy.
2.1.1 Program Activity: Business Development and Entrepreneurship
| Planned Spending | Total Authorities | Actual Spending |
|---|---|---|
| 48,849 | 52,420 | 46,941 |
| Planned | Actual | Difference |
|---|---|---|
| 67 | 43 | 24 |
Effective April 1, 2009 the department implemented a revised direct coding policy for operational resources. This combined with the introduction of the Internal Services program activity has resulted in variances in full-time equivalent (FTEs) positions at the program activity level for all program activities.
| Expected Results |
Performance Indicators | Targets | Performance Status | Performance Summary |
|---|---|---|---|---|
|
Strong small- and medium-sized enterprises (SMEs) in Western Canada with improved capacity to remain competitive in the global marketplace. |
SME revenue (All SME sizes, excluding non-employees) |
$428.596B (Stable growth rate) |
Mostly met |
$370.237B (2006 - Most recent data available) (Stable growth rate from 2001 through 2006) |
|
SME employment, (All SME sizes) (Excluding Non-employee businesses) |
2,508,300 (Stable) |
Mostly met |
2,498,000 (2007 - Most recent data available) (Stable from 2001 through 2007) |
|
|
Annual capital amount accessed by SMEs through WD programs |
$78.8M |
Exceeded |
$104.4M (includes WCBSN loans - $91.1M - and Loan and Investment (LI) Program lending - $13.3M) |
Small businesses are a key driver of the western Canadian economy, accounting for the majority of employment in the West. Therefore, WD tracks SMEs revenue, employment levels, as well as the capital accessed by SMEs through WD programs as indicators of SMEs’ capacity to remain competitive in the global marketplace.
Benefits for Canadians
In 2009-2010, WD’s funding of $61.8M, leveraged $43.9M from other sources, for 141 projects in support of Business Development and Entrepreneurship. This included 102 projects to extend operating funding for members of the Western Canada Business Service Network (WCBSN - 90 Community Futures (CF) organizations, four CF provincial associations, four Francophone Economic Development Organizations (FEDOs), and four Women Enterprise Initiative (WEI) organizations) for one more year (2010-2011) to ensure SMEs have the knowledge, skills and capacity to compete. In addition, WD continued to jointly fund the four Canada Business (CB) service centres in Western Canada with the provincial governments. Collectively, organizations comprising the WCBSN provided the following services in 2009-2010:
- Over 248 thousand information services;
- Over 62 thousand advisory services;
- Over 37 thousand clients trained;
- 1,749 loans approved totalling $91.1M, which created or maintained 10 thousand jobs, and created, maintained or expanded over 3,200 businesses; and
- Over 137 thousand client interactions through multiple access channels provided by the CB service centres across Western Canada, including: e-mail (11,449 interactions), telephone (60,468 interactions) and walk-in traffic (65,226 interactions).
In support of its 2009-2010 trade and investment operational priority, WD leveraged the 2010 Winter Olympic and Paralympic Games to enable western Canadian SMEs to showcase their products, services and expertise and also raise the profile of Western Canada as an attractive investment destination. For example, WD supported the 2010 Partnership Investment Program, an initiative that attracted foreign investors from 70 global companies and resulted in an estimated $60M in new business deals for Western Canada, exceeding expected program targets.
2009–2010 Operational Priorities
- Trade and Investment
- Business Productivity and Competitiveness
- Rural Diversification
In support of its business productivity and competitiveness priority, WD funded projects such as the Saskatchewan Research Council Centre for Advanced Microanalysis, which will provide SMEs with access to equipment to support R&D in chemical and materials engineering and mineral exploration programs. WD also supported this operational priority by enhancing SMEs’ access to capital through the LI Program. A recent five-year evaluation estimates that for every dollar of cost to WD, the LI Program directly generates nine dollars in new financing for small business clients plus a further $19 in investments from other sources.
The cumulative impact of all Business Development and Entrepreneurship projects reporting results since April 1, 2005, includes 2,977 businesses created and 2,951 companies that have participated in export and market development initiatives. (Please refer to Table 2a in Section III for complete results.)
Performance Analysis
In response to tight credit markets and a heightened need for access to capital, WCBSN members increased their lending to western SMEs by $7.6M (9.2 per cent) over 2008-09 levels. To address this increase in demand for capital in 2009-2010, WD provided an additional $3.5M to CF investment pools in Saskatchewan and Manitoba, which are joint loan funds enhancing CFs’ access to loan capital.
Examples of other WD projects approved in 2009-2010 to advance the objective of Business Development and Entrepreneurship, include:
- Prince Rupert Shore Power - WD invested $700 thousand to support this British Columbia (BC) project which will allow container vessels to shut down their engines and auxiliary generators, and transfer ship electrical loads to a clean electrical energy supply from shore in the Port of Prince Rupert. Anticipated economic benefits include a significant cost-savings in the operating costs of berthing container ships and a reduction in local air pollutants and greenhouse gases;
- Edmonton’s NorQuest College Centre for Excellence in Print Media – WD invested $897 thousand towards the purchase of new equipment, software and subject matter expertise for the Centre for Excellence in Print Media to enhance the print industry’s productivity;
- Agence national et international du Manitoba - WD invested $320 thousand to strengthen Manitoba’s economy by promoting trade and investment with international francophone markets, which resulted in 17 agreements between Manitoba and out-of-province/ foreign firms, with an estimated short-term economic impact of $3M;
- Alberta Women Entrepreneurs - WD invested $544 thousand over three years to implement a pan-west program to assist women entrepreneurs to access domestic and international supply chains.
As part of WD’s efforts to promote greater export opportunities for Western Canada, during 2009-2010 the department invested $416 thousand in 33 business development projects through the North American Platform Program (NAPP) designed to strengthen trade and investment linkages with the United States (US) and Mexico. WD’s support has enabled western Canadian SMEs to increase their profile in the US market. For example, WD supported a Systems Integrators incoming mission of five US information and communications technologies (ICT) firms which met with pre-screened Alberta firms in Calgary. As a result, the participating western Canadian firms gained at least a dozen business leads and numerous potential partnerships are under discussion.
Lessons Learned
WD’s experience in delivering international business development projects combined with recent research findings from the Conference Board of Canada, have highlighted the benefit of connecting western Canadian SMEs to large international suppliers to enhance SMEs ability to provide goods and services to large multi-national corporations and to participate in global value chains. WD will endeavour to increase its support for these types of value-added trade projects, including bringing suppliers into a number of western Canadian cities.
2.1.2 Program Activity: Innovation
| Planned Spending | Total Authorities | Actual Spending |
|---|---|---|
| 77,264 | 80,598 | 86,869 |
| Planned | Actual | Difference |
|---|---|---|
| 56 | 33 | 23 |
Effective April 1, 2009 the department implemented a revised direct coding policy for operational resources. This combined with the introduction of the Internal Services program activity has resulted in variances in FTEs positions at the program activity level for all program activities.
| Expected Results |
Performance Indicators | Targets | Performance Status | Performance Summary |
|---|---|---|---|---|
| A stronger knowledge-based economy. | Total western Canadian university income from the Commercialization of Intellectual Property | $40.40M (Increase) |
Not met | $22.88M (2007 - Most recent data available) (Stable level of income from 2005 through 2007) |
|
Business Expenditure on R&D as % of GDP |
0.6% (Stable) |
Mostly met | 0.5% (2007 - Most recent data available) (Stable 2004 through 2007) |
|
|
Employment in Natural and Applied Science and Related Occupations as a % of Total Employment |
6.6% (Increase) |
Unable to assess at this time due to a lack of current data | 6.5% (2006 - Most recent data available; represents the baseline upon which the tartget was based.) |
Benefits for Canadians
The Government of Canada’s Advantage Canada plan and the federal Science and Technology (S&T) strategy recognize the importance of innovation to Canada’s economic well-being. In addition the report, Innovation and Growth - Chasing a Moving Frontier (2009), from the Organization for Economic Co-operation and Development (OECD) and the World Bank stresses that innovation is a key driver of productivity growth, which can strengthen economic growth and development. In particular, innovation in goods, services, processes and practices can help accelerate the global economic recovery and put countries back on a path to sustainable growth.
WD tracks Western Canada’s progress in innovation through indicators such as western Canadian university income from the commercialization of intellectual property, business expenditure on R&D, and employment in natural and applied science. Income from commercialization of intellectual property has remained stable from the baseline year of 2005 through 2007 at $22.9M, although the targets have forecast increases. Business expenditure on R&D (BERD) as percentage of GDP has remained stable for the baseline year of 2004 through 2007 at approximately 0.5 per cent which is low compared to Canada as a whole (1.2%), as well as compared to Canada’s international competitors. The most recent data available regarding employment in natural and applied science is the baseline data from 2006 of 6.5 per cent.
The following case studies illustrate the impact of WD’s investments in support of its on-going technology commercialization priority:
2009–2010 Operational Priorities
- Technology Commercialization
- Composites Innovation Centre (CIC) has become a key facilitator in the composites industry in Manitoba. As of 2008, 107 projects have been completed or in progress at the CIC, 28 of which have a rural focus;
- International Performance Assessment Centre for Geologic Storage of Carbon Dioxide (IPAC-CO2) provides an independent performance assessment of carbon capture and storage (CCS) projects to meet a public and regulatory need. IPAC-CO2 recently announced that it has established a global network of organizations from eight countries that are conducting CCS research;
- Nanotechnology in Alberta - WD has invested approximately $22M in this sector, primarily with the University of Alberta in partnership with the province of Alberta, in which there are approximately 50 companies active that target capturing $2B or two per cent, of world markets by the year 2020;
- Okanagan Research and Innovation Centre (ORIC) is a key player in facilitating the emerging technology cluster in the Okanagan, with five on-site incubator clients, four off-site clients, three prototypes developed, three technologies launched to market, 20 new technology jobs created by incubator clients, and approximately $3.5M in new investments.
In addition, several external, independent impact assessments (Impact of Technology Adoption and Commercialization, and Knowledge Infrastructure and Impact of WD’s Investments in Life Sciences Cluster) have confirmed that WD has been influential in building the capacity of key technology clusters in the West, such as micro/nanotechnology, clean energy (such as fuel cells), medical devices and diagnostics, wireless and geomatics, composite materials, and functional foods and neutraceuticals. According to key partners and stakeholders, WD is valued for its flexibility, responsiveness, knowledge, and its role as an independent broker.
WD’s innovation activities also help forge stronger linkages between Canada’s S&T community and global innovation networks, under the Global Commerce Strategy. For example, WD partnered with International Science and Technology Partnerships Canada Inc. to create opportunities for collaborative R&D and partnership development activities between Alberta and Chinese business organizations. These projects are increasing technology transfer, collaboration and commercialization initiatives in these two jurisdictions. The primary focus of the initiative was to make Alberta companies more globally competitive through the use of international research-based alliances.
The cumulative impact of all Innovation projects reporting results since April 1, 2005, includes: 222 technology demonstrations, 53 technologies to market, 978 people trained, and 96 buildings and pieces of equipment acquired for R&D or training. (Please refer to Table 2a in Section III for complete results.
Performance Analysis
In 2009-2010, WD approved funding of $43.7M, which leveraged $190.9M from other sources, for 33 projects in support of innovation, such as:
- Canadian Environmental Test and Icing Certification facility in northern Manitoba for cold weather testing of new aerospace technologies to support R&D of new, more efficient and advanced, aerospace designs; and
- Hotchkiss Brain Institute at the University of Calgary for the commercialization of medical technologies that will create new economic and commercial opportunities and attract investment and skilled jobs to the West.
WD’s Innovation program activity received support through Budget 2010, which allocated an additional $14.7M to support commercialization, enhance global competitiveness and drive economic growth and development in communities. The breakdown of Innovation funding approved in 2009-2010 by sector is provided in the chart, below. WD’s sector priorities of Life Sciences, ICT and Environmental Technologies are consistent with those identified in Canada’s S&T Strategy: “Mobilizing Science and Technology to Canada’s Advantage.” Besides its priority sectors, WD supports other emerging innovation sectors, such as composites.
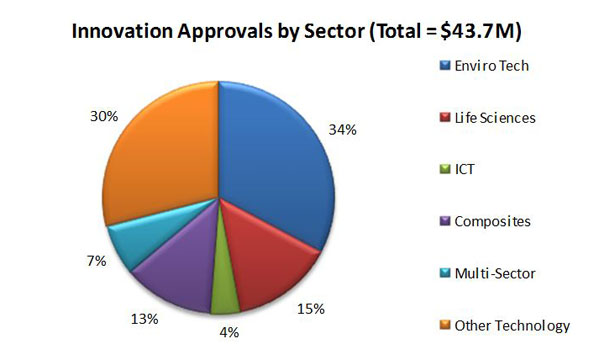
Figure 2: Source: WD’s InfoQuest database (April 7, 2010). “Other technology” includes investments in Synchrotron and Medical Isotopes.
Lessons Learned
WD is examining opportunities to increase economic outcomes in innovation. These include:
- New approaches to technology commercialization; and
- Additional effort on market pull and private sector driven commercialization to increase immediate results of innovation investments.
In 2009-2010, WD developed four sector profiles: life sciences, environmental technologies, ICT, and new media. These sector profiles will provide intelligence as WD reviews its approach to technology commercialization as well as provide a valuable benchmark for future impact assessment. WD also undertook research on best practices in other jurisdictions to identify new approaches to working with firms.
2.2 Community Economic Development
Strategic Outcome: Communities in Western Canada are economically viable.
WD contributes to this strategic outcome through economic development and diversification initiatives that support communities to sustain their economies and adjust to changing and challenging economic circumstances. WD often acts as the lead federal government department for the design and delivery of adjustment programs to respond to serious economic threats to the West. Examples of WD’s work in this area over the past year include the delivery of the Mountain Pine Beetle (MPB) program and the delivery in Western Canada of key components of Canada’s Economic Action Plan (EAP) to respond to the impacts of the economic downturn. While the department did not meet all of the key targets associated with Community Economic Development in 2009-2010, this was attributable largely to the priority placed on responding quickly to the delivery of EAP programs. Please refer to Section 2.4 for a more complete overview of the EAP and the department’s additional results in the area of Community Economic Development.
WD's strategic investments in support of Community Economic Development include projects that assist communities to assess community strengths, weaknesses, opportunities, and potential for new economic activity and to develop and implement community plans. WD also delivers community infrastructure programs in collaboration with Infrastructure Canada and provincial and municipal governments to maximize benefits.
2.2.1 Program Activity: Community Economic Planning, Development, and Adjustment
| Planned Spending | Total Authorities | Actual Spending |
|---|---|---|
| 81,280 | 94,161 | 58,540 |
| Planned | Actual | Difference |
|---|---|---|
| 68 | 30 | 38 |
The difference between total authorities and actual spending for the Community Economic Planning, Development and Adjustment program activity is primarily due to the transfer of the contractual commitment for the Alberta and Saskatchewan Centenaries (ASC) Initiative (Royal Alberta Museum) of $25.2M to future years and expenditures incurred against other program activities, such as Internal Services. Effective April 1, 2009 the department implemented a revised direct coding policy for operational resources. This combined with the introduction of the Internal Services program activity has resulted in variances in FTEs positions at the program activity level for all program activities.
| Expected Results | Performance Indicators | Targets | Performance Status | Performance Summary |
|---|---|---|---|---|
|
Communities have increased economic opportunities and capacity to respond to challenges. |
Employment: # of new jobs created |
84,000 (Grow at a slower rate) |
Not met |
-102,812 (2009 - Net job loss) |
|
Net migration rate - international and domestic |
81,879 (Grow at a slower rate) |
Somewhat met |
68,719 (2009 - Growth at slower rate than targeted) |
Benefits for Canadians
A significant proportion of WD's community economic development funding stems from the department's role as the western delivery agent of national programs such as municipal infrastructure programs and the CF Program, and from the support provided to FEDOs. In order to capture the impact of these activities, WD tracks job creation and the net migration rate as indicators of increased economic opportunities of communities and their capacity to respond to challenges. In 2009, Western Canada had a net job loss of 102,812 which was due primarily to the fallout from the global economic downturn, which WD identified as an external risk. This job loss was somewhat mitigated by the direct job creation from the Community Adjustment Fund (CAF) and the Recreational Infrastructure Canada program (RInC), which is reported to be 2,131 jobs. Net migration grew at a rate slower than targeted in 2009, again due to the impact of the global economic downturn on Western Canada.
2009–2010 Operational Priorities
- Rural Diversification
- Business Productivity & Competitiveness
WD helped rural communities diversify by undertaking value-added processing and encouraging new opportunities for skilled employment through projects such as:
- MLTC Resources Development Inc., in Meadow Lake, Saskatchewan, undertook applied R&D and value-added processing in the forestry industry to develop a test site for wood pellet processing and create a wood pellet processing business;
- Rural Economic Diversification Initiatives, in Alberta and BC were successful in supporting tourism clusters in the Canadian Badlands and Alberta’s Peace Country, an investment attraction and diversification initiative for the Red Deer region, as well as 11 projects in rural BC that will create 560 jobs.
The cumulative impact of all Community Economic Planning, Development and Adjustment projects reporting results since April 1, 2005, include: 145 activities providing planning leadership and expertise, 1,214 instances of increased capacity in community organizations, and 3,825 people trained. (Please refer to Table 2a in Section III for complete results.)
Performance Analysis
In 2009-2010, WD approved new funding of $18.2M, for 46 projects in support of Community Economic Planning, Development and Adjustment, through the Community Economic Diversification Initiative (CEDI) and Western Diversification Program (WDP) funding. WD’s funding leveraged $22.3M from other sources.
The diversification of Western Canada's resource-based industrial structure, and increasing the value-added of current economic output are key to enhancing the viability of communities and ensuring stable long-term growth. As part of the $200M federal MPB Program, WD has delivered over $51.5M in project funding through CEDI to help diversify local economies of communities affected by the mountain pine beetle infestation in BC. In 2009-2010, WD approved new CEDI funding of $14.8M for 38 economic development projects, which leveraged an additional $3.7M. In addition to projects approved under CEDI, an additional eight projects totaling $3.4M and leveraging $18.6M were approved in 2009-2010 under WDP in support of this program activity.
CAF also supports this program activity and is described further under the EAP, below.
There were three evaluations undertaken in 2009-2010 that addressed this program activity including the ASC Initiative evaluation and the evaluations of Urban Development Agreements (UDAs) in BC (Vancouver) and Saskatchewan (Regina and Saskatoon). The evaluation of the ASC Initiative concluded that the program was managed in a cost-effective manner and contributed to community economic development. Overall, it was found the program leveraged $3.37 from other funding sources for every departmental dollar spent, which compares favourably with other federal grants and contributions (Gs & Cs) programs (ranging from $1.50 to $2.30). Benefits of the agreements included contributing to raising the profile of arts and culture in the region and narrowing the gap in economic and community infrastructure investments.
Lessons Learned
The evaluations of the UDAs in British Columbia (Vancouver) and Saskatchewan (Regina and Saskatoon) recommended that WD develop individualized performance measurement strategies for future special purpose initiatives rather than using the broad one in place for WDP. This would facilitate a more tailored approach to performance measurement for each initiative. WD has followed this advice in working collaboratively with other Regional Development Agencies (RDAs) to develop a performance measurement strategy specific to CAF, as well as one specific to the Western Economic Partnership Agreements (WEPA).
The ASC Initiative evaluation recommended that WD should ensure its corporate database captures relevant project information in a timely manner. The Bring Forward tool in Project Gateway, implemented in February 2010, generates automatic reminders to staff about outstanding Client progress reports.
2.2.2 Program Activity: Infrastructure
| Planned Spending | Total Authorities | Actual Spending |
|---|---|---|
| 7,566 | 10,719 | 8,178 |
| Planned | Actual | Difference |
|---|---|---|
| 13 | 41 | -28 |
Planned and actual spending does not include G&C resources administered by WD on behalf of Infrastructure Canada (MRIF, CSIF) through OGD suspense account, as this amount (approximately $133.4M in actual spending) is reported by Infrastructure Canada. The FTE variance is as a result of operating funding related to the Building Canada Fund - Community Component and Major Infrastructure Component that was received through Supplementary Estimates.
| Expected Results | Performance Indicators | Targets | Performance Status | Performance Summary |
|---|---|---|---|---|
|
To maximize economic, social, cultural and environmental benefits to western Canadians through investments in public infrastructure in a coordinated manner with provincial and municipal governments. |
Percentage of key informants with the opinion that WD delivery of Infrastructure programs resulted in investments that reflect western Canadian infrastructure priorities |
50% |
Not met |
Several key informants interviewed as part of the national ICP evaluation noted that infrastructure challenges would be better served through a longer-term funding commitment and be better guided by a policy framework providing municipalities with more predictable funding streams on which to base longer term capital plans.[5] |
|
$ value of federal infrastructure projects funded per fiscal year |
$5.9M |
Somewhat met |
$4.2M (ICP expenditures in 2009-2010) |
|
|
$’s leveraged in addition to federal $’s for projects funded per fiscal year |
$11.8M |
Exceeded |
$13.3M (ICP leverage in 2009-2010) |
Benefits for Canadians
WD’s delivery of infrastructure programs in Western Canada contributes to the Government of Canada’s commitment to supporting economic growth and building strong communities. The national evaluation of the Infrastructure Canada Program (ICP) conducted by Infrastructure Canada concluded that funded projects achieved the intended intermediate outcomes: targeted communities were provided with better drinking water, air quality and water management services, and are benefiting from reduced greenhouse gas emissions and improved solid waste management. WD also tracks key informant opinion of the relevance of WD’s infrastructure investments, the value of those investments, as well as the leverage of funding from other sources. Results for 2009-2010 were mixed, as presented in the above chart.
The cumulative impact of all ICP projects in Western Canada since the program began in October 2000 is shown in Table 2b in Section III.
Performance Analysis
During 2009-2010, WD delivered infrastructure programs in each of the western provinces on behalf of Infrastructure Canada. This included the Municipal Rural Infrastructure Fund (MRIF) and the Building Canada Fund (BCF) Communities Component. As well, WD delivers a number of Canada Strategic Infrastructure Fund (CSIF) and BCF Major Infrastructure Component projects in the West. G&C funding for MRIF, BCF and CSIF is provided through Infrastructure Canada’s appropriation and is held in a suspense account[6] while operations funding for the delivery of these programs continues to be included in WD’s estimates. Details on infrastructure program results for which G&C funds are held in suspense accounts may be found in Infrastructure Canada’s Departmental Performance Report (DPR).
WD also continued to deliver the ICP on behalf of the federal government in Western Canada. The ICP was launched in 2000 to enhance infrastructure in Canada’s urban and rural communities and to improve quality of life through investments that protect the environment, support economic growth, and build strong communities. By March 31, 2010, WD had committed 97 per cent of the total federal funding of $564M towards 1,693 infrastructure projects across the West. A total of $4.2M was spent by the department in 2009-2010, leveraging $13.3M in funding from other orders of government. Since the launch of ICP in 2000, the total cumulative spending as of March 31, 2010, was $547.3M, excluding administrative costs.
Lessons Learned
Infrastructure Canada’s national evaluation of the ICP in 2009-2010 showed that the program, which relied upon the expertise and funding of all three orders of government, provided a collaborative and coordinated approach to addressing municipal and community infrastructure needs. The creation of joint or virtual secretariats, with federal and provincial staff working together to support the regional program management committees, was seen as an innovative solution for resolving issues and ensuring strong communications between delivery partners. The evaluation noted that the program delivery by RDAs was a major advantage because federal players such as WD had local knowledge and familiarity with local needs and their provincial government counterparts. It was also noted that the RDAs exercised due diligence in the delivery of ICP, and complied with all program and federal authorities and requirements.
The findings of the ICP evaluation are being used to inform the delivery of other infrastructure programs. For example, there are ongoing efforts to improve the Shared Information Management System for Infrastructure (SIMSI) and WD and the other federal delivery partners are working with Infrastructure Canada to develop a formal agreement to clarify their respective roles and responsibilities in program delivery, monitoring and reporting.
2.3 Policy, Advocacy & Coordination
Strategic Outcome: Policies and Programs that strengthen the western Canadian economy
One of WD’s responsibilities as mandated by the Western Economic Diversification Act (1988) is to advance the interests of Western Canada in national economic policy, program and project development and implementation. To fulfill this, WD maintains strong relationships with the western provinces, works collaboratively with a range of industry, research, and other stakeholders in the West, and undertakes research and analysis on economic and policy issues of importance to Western Canada. WD responds to key opportunities for long-term growth and diversification in areas of federal or shared federal-provincial jurisdiction. WD’s research and advocacy activities are also instrumental for informing the department’s policy and program decisions.
To measure effectiveness, WD utilizes a number of performance indicators which reflect the responsiveness of its own and federal policies and programs to the needs of western Canadians. In 2008-09, WD conducted an evaluation to establish baseline measures related to this strategic outcome. The results of a survey of key informants found that 94 per cent are of the opinion that WD activities provide policies that support the economic development of Western Canada, and 95 per cent held this same opinion with respect to programs. The department will repeat this survey every five years to monitor these opinions, and to identify trends and issues. WD also tracks total project funding approved from all sources to gauge the effectiveness of the department’s efforts to collaborate with other partners and leverage other sources of funding. This measure fluctuates from year-to-year, due to incremental G&C funding available to the department for one-time initiatives. For example, total funding of approved projects increased from $513.57M in 2008-2009 to $1.56B in 2009-2010 due to EAP initiatives. Finally, the percentage of projects completed per fiscal year that successfully met or exceeded performance targets is meant to reflect how effective the department’s overall efforts have been related to Policy, Advocacy, and Coordination. This performance indicator has been very stable, at about 85 per cent year-over-year, reflecting a very high success rate of completed projects.
Benefits for Canadians
2009–2010 Operational Priorities
- Technology Commercialization
- Trade and Investment
- Business Productivity and Competitiveness
- Rural Diversification
WD’s Policy, Advocacy and Coordination activities contribute to the achievement of the department’s other strategic outcomes and its operational priorities. For example, in support of its technology commercialization priority, WD coordinated the Senior Officials Forum on Innovation 2009 meetings, which resulted in a stronger network of policy makers and an increased awareness of best practices and relevant innovation issues.
In support of its trade and investment priority, WD promoted western Canadian companies and capabilities to prime contractors that have won or will be bidding on military procurements that have Industrial and Regional Benefits (IRB) obligations. Western Canadian companies benefitted from two WD-sponsored supplier development tours aimed at building awareness of business opportunities from major federal procurements by bringing together major international defence contractors and potential supply companies in Western Canada.
In support of its business productivity and competitiveness priority,WD and the four western provinces funded the Conference Board of Canada’s research on “Western Canada : Productivity , Competiveness and Potential”.
In support of its rural diversification priority,WD worked closely with the other RDAs to renew the national CF Program, resulting in the announcement in Budget 2010 of annual incremental funding of $3.63M for the program in Western Canada. The collaborative effort of the RDAs has allowed the CF Program to continue to support community economic development and business development in rural Western Canada.
The cumulative impact of all Policy, Advocacy and Coordination G &C projects reporting results since April 1, 2005, includes 59 opinion editorials based on WD-sponsored research and 112 spokesperson/ media references to WD-funded research. (Please refer to Table 2a in Section III for complete results.)
2.3.1 Program Activity: Collaboration and Coordination
| Planned Spending | Total Authorities | Actual Spending |
|---|---|---|
| 2,888 | 3,291 | 3,467 |
| Planned | Actual | Difference |
|---|---|---|
| 21 | 29 | -8 |
The FTE variance is as a result of an increased coordination role related with the delivery of EAP initiatives in the western provinces.
| Expected Results | Performance Indicators | Targets | Performance Status | Performance Summary |
|---|---|---|---|---|
| Better coordinated economic development activities, policies and programs in the West. | Percentage of key informants with the opinion that WD activities provide better coordinated economic activities, policies and programs in the West | 55% | Exceeded | 91% (2008-2009) |
| $’s leveraged for projects funded per fiscal year from all WD programs ($’s leveraged per WD $) | $1.00 | Exceeded | $1.54 | |
| $ value of project funding provided under interdepartmental agreements to which WD was a party | $25M | Exceeded | $29.82M (Includes WEPA and UDA G&C expenditures) |
Performance Analysis
The main objectives identified by WD in its 2009-2010 Report on Plans and Priorities (RPP) were accomplished in 2009-2010. These included the successful implementation of a new round of the WEPA with the four provincial governments, promoting collaboration of senior WD and provincial government decision-makers through the Western Deputy Ministers’ Forum, and participating in western-based consultations such as the Senior Officials Forum on Innovation.
Specific results attributable to the WEPA in 2009-2010 included the formation of WEPA committees in each province to guide priority setting and joint management of each agreement, and the approval of 38 projects, totalling $51.2M in WD funding.
The Western Deputy Minister’s Forum led to collaboration between WD and provincial governments on several initiatives, notably the identification of opportunities to capitalize on the economic opportunities presented by the Vancouver 2010 Winter Olympic and Paralympic Games, and the joint funding of a study by the Conference Board of Canada on “Western Canada: Productivity, Competitiveness and Potential”, which involved a series of roundtables held across the West in June 2009.
Other examples of WD’s collaboration and coordination activities included:
- Saskatchewan Indian Institute of Technologies' Aircraft Maintenance Engineering training facility - WD collaboration with the Province of Saskatchewan and several multinational companies resulted in this IRB opportunity for Saskatchewan;
- CentrePort Canada Inc. - WD played a central coordination role in this initiative which will position Winnipeg and Manitoba as a continental trade hub for rail, air and road cargo through the establishment of an inland port. It is expected that this inland port will help facilitate increased foreign trade and investment in the region.
Lessons Learned
WD collaboration and coordination activities have been successful in bringing together key stakeholders to further the economic development of the West. The recent global economic crisis reinforces the need for the West to move towards a sustainable, diversified, knowledge-based economy. Sustained efforts in building positive relationships and collaborating with various orders of government, departments and key stakeholders will ensure the West is making strides in addressing productivity and competitiveness challenges.
2.3.2 Program Activity: Advocacy
| Planned Spending | Total Authorities | Actual Spending |
|---|---|---|
| 3,246 | 3,796 | 3,344 |
| Planned | Actual | Difference |
|---|---|---|
| 31 | 28 | 3 |
| Expected Results | Performance Indicators | Targets | Performance Status | Performance Summary |
|---|---|---|---|---|
| Decisions by other organizations that improve economic policies and programs in the West. | Percentage of key informants with the opinion that WD activities provide an improved understanding and awareness of western issues, challenges, opportunities and priorities | 55% | Exceeded | 96% (2008-09) |
| Percentage of key informants with the opinion that WD advocacy work results in federal policies and programs that reflect western Canadian needs | 60% | Exceeded | 88% (2008-09) |
|
| Percentage of key informants with the opinion that WD advocacy work results in improved awareness of industrial and regional benefits and/ or federal procurement opportunities | 50% | Exceeded | 66% (2008-09) |
Performance Analysis
WD’s overall Advocacy activities in 2009-2010 included: advancing development opportunities for transportation, distribution and logistics, through projects such as Prince Rupert Shore Power; increasing value-added content and the promotion of western suppliers for high technology industries, through initiatives such as the Asia Pacific Gateway and Corridor Initiative; and bolstering national competitiveness and productivity.
Advocacy in aerospace and defence procurement is an important element of the department's economic diversification efforts, generating benefits for the western economy, businesses, and institutions. In 2009-2010, WD partnered with the Western Aerospace Alliance to advance business development and to increase Western Canada’s presence at the International Paris Air Show and promote the western Canadian aerospace and defence sector on the global stage.
An example of WD’s advocacy activities on behalf of western Canadians in 2009-2010 was the department’s work to engage western Canadian stakeholders in the Pan-Western Outreach Program, led by the department of Foreign Affairs and International Trade (DFAIT). This program is part of a broader national outreach strategy to raise business awareness of Canada’s international trade programs and policies, including foreign trade zone programs such as the Duty Deferral Program, the Export Distribution Centre Program, and the Exporters of Processing Services Program.
Other advocacy highlights in 2009-2010 include:
- WD’s engagement with other federal departments to advocate on behalf of western Canadian stakeholders regarding western interests on key national policy initiatives such as the federal S&T strategy, the environment, energy, and tourism;
- West Coast Chinook Salmon - WD collaborated with the Department of Fisheries and Oceans to identify and fund specific community adjustment measures in response to the implementation of new provisions under the Canada-US Pacific Salmon Treaty;
- Federal Framework for Aboriginal Economic Development - WD has been active in formulating policy and program initiatives that will provide added avenues for funding of Aboriginal economic development initiatives in Western Canada.
Lessons Learned
In order to ensure it is well positioned to represent western Canadian interests on a growing number of policy issues, WD will need to strengthen its advocacy approach and capacity. An example of the potential benefits that can result from its advocacy efforts is in the area of federal government procurement. Given the unprecedented level of military procurement and engagement of other regional development agencies in these procurements, WD has begun to take steps to increase its involvement in procurement and IRBs. Building relationships with prime contractors and lead federal departments, while thoroughly understanding the capabilities of western Canadian companies will enhance the department’s ability to play an effective role in supporting western Canadian firms to access new federal procurement opportunities.
2.3.3 Program Activity: Research & Analysis
| Planned Spending | Total Authorities | Actual Spending |
|---|---|---|
| 2,666 | 2,851 | 1,835 |
| Planned | Actual | Difference |
|---|---|---|
| 10 | 10 | 0 |
| Expected Results |
Performance Indicators |
Targets | Performance Status |
Performance Summary |
|---|---|---|---|---|
| Improved understanding of western Canadian economic issues, challenges, opportunities and priorities. | Percentage of key informants with the opinion that WD research and analysis contributes to an improved understanding of western Canadian issues, challenges, opportunities and priorities | 55% | Exceeded | 92% (2008-2009) |
| # of spokesperson and media references to WD economic research and analysis | 20 | Exceeded | 46 (2009-2010) |
Performance Analysis
WD’s Research and Analysis activities in 2009-2010 were designed to achieve the objective of improving awareness and understanding of western Canadian issues and economic opportunities. Many of the studies undertaken by the department will be used to contribute to the department’s own strategies to promote economic development and diversification in the West, and by other federal and provincial governments to inform their own policy and program development activities.
WD’s research and analysis activities in 2009-2010 included:
- Cleantech Report - provided market penetration and growth potential information required to assist in the development of policies and programs to support the commercialization of the Clean Technologies sector in Canada;
- Asia Pacific Gateway and Corridor Initiative - included research, strategies, and activities undertaken for the development of value-added industries and opportunities related to Canada’s role as an Asia Pacific Gateway such as a video series on Canada’s relationship with Asia.
2.4 Canada’s Economic Action Plan
| Planned Spending | Total Authorities | Actual Spending |
|---|---|---|
| 0 | 207,400 | 186,314 |
| Planned | Actual | Difference |
|---|---|---|
| 0 | 65 | -65 |
Funding for EAP initiatives was announced in Budget 2009, and received through Supplementary Estimates.
Benefits to Canadians
EAP is the Government of Canada's plan to help ensure a quick recovery from the economic downturn by focusing on the creation of short-term employment to support communities and the sectors that contribute to their viability. The national plan includes the two-year $1B CAF and the two-year $500M RInC, which WD is responsible to deliver throughout Western Canada with timely, targeted and temporary project activities. CAF is a national economic stimulus initiative that supports projects that create jobs and maintain employment in and around communities that have experienced significant job losses and lack alternative employment opportunities. RInC provides temporary economic stimulus that will help reduce the impacts of the global recession while renewing, upgrading and expanding recreational infrastructure in Canadian communities.
During 2009-2010, WD approved funding of $292.2M for 286 CAF projects across the West over two years; this leveraged an additional $235.6M from other sources. Similar progress is being achieved for RInC: $152.8M has been approved by WD for 718 projects in Western Canada over two years, leveraging an additional $417.4M.
WD also delivered two other EAP initiatives announced in Budget 2009: BCF top-up and Canada Business Network (CBN). In 2009-2010, WD delivered BCF in partnership with Infrastructure Canada and the four western provincial governments. Budget 2009 also provided $15M annually for the renewal of the national CBN, of which WD will receive $3.98M annually to support this initiative in Western Canada.
Performance Analysis
As of March 31, 2010, almost 100 per cent of the total combined EAP federal funding allocation for CAF and RInC of approximately $440M had been committed towards 1,004 projects across the West. As of March 31, 2010, CAF and RInC recipients reported the following results:
| CAF | RInC | Total | |
|---|---|---|---|
| WD funding expended | $142.5M | $43.2M | $185.7M |
| Number of projects funded | 286 | 718 | 1,004 |
| Person-months of employment[7] | 17,506 | 8,062 | 25,568 |
| Full-time equivalent (FTE)[8] jobs created or maintained | 1,459 | 672 | 2,131 |
| Businesses created, maintained or expanded | 785 | Not applicable | 785 |
| Infrastructure elements created or maintained | Not applicable | 374 | 374 |
| Number of projects completed[9] | 7 | 82 | 89 |
During 2009-2010, it was important to ensure that economic adjustment efforts were carried out in an efficient, timely and effective fashion. For the most part. WD delivered CAF and RInC project funding directly. Other delivery mechanisms employed under CAF included agreements with other orders of government and third party delivery by non-government organizations. For example, approximately $104M in approved CAF funding was redistributed to the ultimate recipients through the Province of British Columbia’s Job Opportunities Program, the Northern Development Initiative Trust in northern BC, the Province of Alberta, the Forest Resource Improvement Association of Alberta for projects that enhance Alberta's forest resources through fire hazard reduction and the promotion of forest health, and through the Canadian Badlands Inc. Examples of RInC project success stories are listed at: http://www.wd-deo.gc.ca/eng/12241.asp.
WD collaborated with the other RDAs to ensure consistent delivery of programs and sharing of best practices, especially with EAP initiatives. A shared performance measurement framework (PMF) for RInC was developed in 2009-2010 to assist with consistent performance measurement.
Lessons Learned
As with the MPB initiatives and soft wood lumber initiatives, WD demonstrated it has the capacity to effectively and rapidly deliver major short-term economic stimulus programs while maintaining core departmental activities. Experience gained through CAF and RInC will be beneficial to the department when new initiatives are launched in the future. Delivery of CAF and RInC also assisted WD in assessing how its management information and financial administration systems and tools may be further enhanced to help expedite program delivery, without compromising program implementation or due diligence requirements.
2.5 Program Activity: Internal Services
This program activity supports all of WD's strategic outcomes.
| Planned Spending | Total Authorities | Actual Spending |
|---|---|---|
| 18,762 | 21,873 | 25,815 |
| Planned | Actual | Difference |
|---|---|---|
| 135 | 189 | -54 |
Commencing in the 2009-2010 Estimates cycle, the resources for the Internal Services program activity is displayed separately, rather than being distributed among the remaining program activities, as was the case in the previous Main Estimates. This has impacted the comparability of financial and human resources information by program activity between fiscal years. The increase in actual FTEs is tied to two events that occurred in the fiscal year:
- increased governance and oversight, financial and human resource management, and technology services including changes to the departmental project management system for the delivery of EAP initiatives; and
- a revised direct coding policy for operational resources that was implemented April 1, 2009.
Internal Services are groups of related activities and resources that are administered to support the needs of programs and other corporate obligations of an organization (e.g. corporate planning, program management, internal audit). Internal Services include only those activities and resources that apply across WD and not to those provided specifically to another program activity.