
Treasury Board of Canada Secretariat
www.tbs-sct.gc.ca
Common menu bar links
Breadcrumb Trail
ARCHIVED - Natural Resources Canada - Report
 This page has been archived.
Archived Content
Information identified as archived on the Web is for reference, research or recordkeeping purposes. It has not been altered or updated after the date of archiving. Web pages that are archived on the Web are not subject to the Government of Canada Web Standards. As per the Communications Policy of the Government of Canada, you can request alternate formats on the "Contact Us" page.
Section III – Supplementary Information
Financial Statements – Highlights
The financial highlights presented within this Report are intended to serve as a general overview of NRCan’s financial position and operations.
For the Period ending March 31, 2010
Condensed Statement of Financial Position
(in thousands of dollars) |
Percentage Variance |
2010 | 2009 |
|---|---|---|---|
| Assets | |||
| Financial Assets | 11% | 416,617 | 376,022 |
| Non-Financial Assets | 108% | 170,319 | 81,974 |
| TOTAL ASSETS | 28% | 586,936 | 457,996 |
| Liabilities | 0% | 1,194,603 | 1,196,800 |
| Equity | - 18% | -607,667 | -738,804 |
| Total LIABILITIES & EQUITY | 28% | $586,936 | $457,996 |
For the Period ending March 31, 2010
Condensed Statement of Operations
(in thousands of dollars) |
Percentage Variance |
2010 | 2009 |
|---|---|---|---|
| Transfer Payments | -34% | 2,464,530 | 3,733,140 |
| Operating Expenses | 6% | 951,455 | 898,591 |
| Total Expenses | - 26% | 3,415,985 | 4,631,731 |
| Total Revenues | - 45% | 1,493,475 | 2,720,043 |
| Net Cost of Operations | 1% | $1,922,510 | $1,911,688 |
Condensed Statement of Financial Operations
Total Assets have increased by $129 million. The increase in Financial Assets is mostly attributable to more Accounts Receivable from external parties ($41 million). The increase in non-Financial Assets is mostly due to an increase in prepayments, as a result of an increase of $58 million in advance payments for transfer payment programs. The amount of liabilities remained fairly
constant with liabilities at the end of the previous fiscal year.
Condensed Statement of Operations
The Net Cost of Operations remained fairly constant with the result of the previous fiscal year. Expenses and revenues under Economic Opportunities for Natural Resources have decreased in 2009-2010 due to a reduction in the rate of production and in the value for crude oil (attributable to the volatile nature of such commodities) for Nova Scotia and Newfoundland and Labrador Offshore programs: expenses decreased by $1.5 billion, and the revenues by $1.2 billion. Interest revenues have increased by $272 million due to an increase in the Net Profits Interest revenues from the Hibernia Offshore Oil project ($306 million) and a decrease in other interest revenues ($34 million).
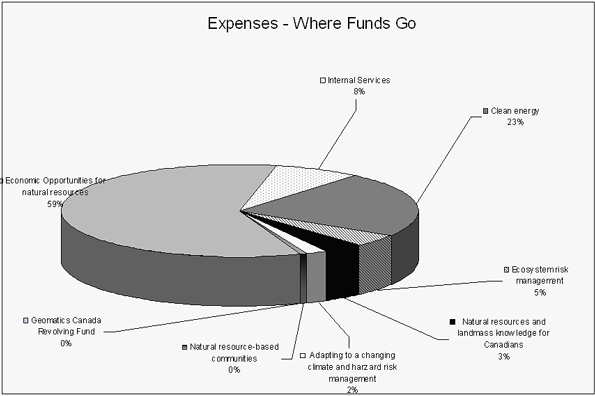
The following chart presents a distribution of Natural Resource Canada’s total expenses in 2009-10 by program activity. Total expenses amounted to $3,415,985,000.
The Condensed Statement of Financial Operations, complete NRCan financial statements, and that of the Geomatics Canada Revolving Fund can be found on Natural Resource Canada's110 website.
List of Supplementary Information Tables
- Sources of Respendable and Non-Respendable Revenue
- User Fees / External Fees
- Details of Transfer Payment Programs (TPP)
- Up-Front, Multi-Year Funding
- Horizontal Initiative – Improving the Performance of the Federal Regulatory System for Major Natural Resource Projects
- Green Procurement
- Response to Parliamentary Committees and External Audits
- Internal Audits and Evaluations
These tables can be found on the Treasury Board Secretariat’s website111.
Endnotes
1 http://www.nrcan-rncan.gc.ca/com/resoress/actacte-eng.php?PHPSESSID=1ddbc9afab5f1a5ede94452759abf9b0
2 http://www.nrcan.gc.ca/com/deptmini/portf-eng.php
3 http://www.aecl.ca/site3.aspx
4 http://www.neb.gc.ca/clf-nsi/rcmmn/hm-eng.html
5 http://www.cnsc-ccsn.gc.ca/eng/
9 http://www.appointments-nominations.gc.ca/prflOrg.asp?OrgID=ESR&type-typ=3&lang=eng
10 http://www.infosource.gc.ca/inst/npa/fedtb-eng.asp
11 http://www.actionplan.gc.ca/eng/index.asp
12 Economic Action Plan initiatives are identified with *. A summary of all EAP initiative is provided in Section I.
13 Knowledge and innovation indicators are presented in this report under SO 2, and PAs 2.1, 2.2, 3.1 and 3.2 as the sum of peer-reviewed scientific and technical papers published by NRCan researchers in a range of fields of enquiry over two successive five-year periods: 1997-2001 and 2002-2006. It is important to note that this presentation is just a partial view of NRCan’s overall contribution to knowledge and innovation; further development of this set of indicators will appear in future DPRs.
14 Indices of success are a summation of the performance of a program activity’s constituent sub-activities in delivering planned-spending-weighted expected results and outputs that are on time and on budget. Note that indices of success are newly developed indicators for 2009-10. Data shown for 2009-10 indices of success illustrate actual performance, whereas data for the previous fiscal year – 2008-09 – are best estimates, and there is insufficient data available for fiscal year 2007-08 and earlier. The performance status is assigned as follows: Met All: 99% and above; Mostly Met: 80-98%.
15 http://www.tbs-sct.gc.ca/rpp/2009-2010/inst/rsn/rsn00-eng.asp
16 Performance of priorities is calculated as a summation of the constituent sub-activities in delivering planned-spending-weighted expected results and outputs that are on time and on budget. Performance status is assigned as follows: Met All: 99% and above; Mostly Met: 80-98%.
17 http://oee.nrcan-rncan.gc.ca/corporate/retrofit-summary.cfm
18 http://www.nrcan.gc.ca/eneene/science/ceffep-eng.php
19 http://www.actionplan.gc.ca/initiatives/eng/index.asp?initiativeID=157&mode=3
20 http://www.actionplan.gc.ca/initiatives/eng/index.asp?mode=7&initiativeID=158
21 http://www.valuetowood.ca/html/english/index.php
22 http://gsc.nrcan.gc.ca/gem/index_e.php
23 Employee Benefit Plan (EBP) and Public Works Government Services Canada (PWGSC) accommodation amounts have been included in the budget and actuals in this report. EBP funding was received through supplementary estimates and all adjustments were made at the end of the year.24 The performance status is assigned as follows: Met All: 99% and above; Mostly Met: 80-98%. The performance includes both planned initiatives and resources spent.
25 http://www.tbs-sct.gc.ca/est-pre/index-eng.asp
26 http://www.tbs-sct.gc.ca/ppg-cpr/home-accueil-eng.aspx
27 he Soldier Settlement Board Agreement for an amount of $83.5M represents the main variance between the Planned Spending and Total Authorities.
28 The main variance between the Planned Spending and Total Authorities within Natural Resource-based Communities Program Activity is the $2.9M approved through supplementary estimates as part of a program funded from Indian and Northern Affairs Canada
29 The main variance between the Planned Spending and Total Authorities for Clean Energy Program Activity is the $49.8M approved through supplementary estimates and the ecoENERGY Retrofit - Homes program for an amount of $37.9M.
30 The Collective Bargaining and Carry Forward for an amount of $14.6M, represents the variance between the Planned Spending and Total Authorities.
31 Minor items explain the small variance between the Planned Spending and Total Authorities.
32 The main variance between the Planned Spending and Total Authorities for Natural Resources and Landmass Knowledge for Canadians program activity is the $15.9 M approved through supplementary estimates.
33 The variance is explained by the accounting treatment of the Geomatics Canada Revolving Fund. Funding unspent in one year moves forward into the future year as part of the total authority but is not part of the Main Estimates or Planned Spending. Actual expenditures are relative to the revolving funds needs and the 'variance' in one year becomes part of the total authorities in the following year.
34 Commencing in the 2009-10 Estimates cycle, the resources for Program Activity: Internal Services are displayed separately from other program activities; they are no longer distributed among the remaining program activities, as was the case in previous Main Estimates. NRCan has incorporated the amounts for Internal Services for 2008-09 actuals in this DPR to address the comparability of spending and FTEs information by Program Activity between the fiscal years. In Internal Services, the Modernizing Federal Laboratories initiative for an amount of $17.1M, the Accelerating Federal Contaminated Sites Action Plan for an amount of $12.3M and the Collective Bargaining and Carry Forward for an amount of $14.8M represent the main variance between the Planned Spending and Total Authorities.
35 The variance between Main Estimates and Total Authorities is explained by additional funding received through Supplementary Estimates A, B and C.
36 The difference between the Main Estimates and Total Authorities is explained by lower royalty revenues received from the Atlantic Offshore Accords Statutory Programs. The revenues are affected by the price of oil and production levels. The amount of $1,764.0 M for Statutory Programs does not include EBP, Minister and car allowances, spending of proceeds from the disposal of Crown Assets and the Geomatics Canada Revolving Fund. It explains the variance between $1,764.0M and $1,839.9M stated in the Financial Statements.
37 Due to the dispersed nature of NRCan’s financial management system, the best estimate was used to determine the difference between Planned and Actual FTEs by Strategic Outcomes and Program Activities. NRCan is working towards implementing a SAP-based financial management system (Felix project) in 2011-12. Among other things, it will enable the department to better explain variances between planned and actual FTEs.
38 Under Vote 1, NRCan received additional approvals during the fiscal year (through the Supplementary Estimates) totalling $149.8M. This included funding to support the ecoENERGY Retrofit – Homes Program, Investing in Canada’s Forest Sector, the relocation and enhancement of the CANMET Materials Technology Laboratory, the Pulp and Paper Green Transformation Program, the assessment, management and remediation of federal contaminated sites, the modernization of federal laboratories, and the completion of Settlement Agreements with the provinces of Alberta and Saskatchewan in relation to the Soldier Settlement Board mineral rights. NRCan also received the following supplemental allocations during the fiscal year: $27.0M for collective bargaining; $39.4M carried over from the previous fiscal year; and $11.1M from TB Vote 30 (severance pay, parental leave, etc.).
39 An internal reallocation of resources to create a Capital vote for the acquisition of machinery and equipment was done after NRCan received additional approvals during the fiscal year (through the Supplementary Estimates) totalling $8.9M.
40 Under Vote 5, NRCan received additional approvals during the fiscal year (through the Supplementary Estimates) totalling $253.3M, which included funding to support the ecoENERGY Retrofit – Homes program, Investing in Canada’s Forest Sector, the Pulp and Paper Green Transformation program, the Clean Energy Fund and the ecoENERGY for Biofuels program. Actual spending under Vote 5 was less than planned because $68.8M in spending was deferred to future years.
41 The original 2009-10 Main Estimates forecast was based on royalty forecasts from the province. The 2009-10 actual expenditures reflect a decrease in payments to the province resulting from a decrease in gas prices.
42 The original 2009-10 Main Estimates forecast was based on royalty forecasts from the province. These forecasts were significantly overstated when compared to 2009-10 actual expenditures due to decreases in both oil prices and production levels.
43 Regulations under the provisions of the Fiscal Equalization Offset Payments in the Canada-Newfoundland Atlantic Accord Implementation Act allow Newfoundland and Labrador to be compensated for losses to equalization payments due to increases in offshore oil and gas revenues. The province has an option of using the formula in accordance with the Act or can use the generic calculation under the equalization rules. If the latter is chosen, the Newfoundland and Labrador Fiscal Equalization Offset payment is zero. The increase reflects the province’s decision to use the Accord Act formula, and the $465.3M represents the equalization offset payment for 2009-10, which is calculated by Finance Canada.
44 http://www.nrcan-rncan.gc.ca/com/resoress/pubpub-eng.php?PHPSESSID=45cf88f73a946b28dfe3c6329d7ea785
45 http://www.nrcan-rncan.gc.ca/com/
46 http://www.tbs-sct.gc.ca/rpp/2009-2010/inst/rsn/rsn00-eng.asp
47 Canada’s share of resource-based world trade is measured by the Trade Performance Index (TPI) as defined and reported by the International Trade Centre of UNCTAD/WTO. TPI is the simple average of Canada’s ranking compared to the world on five underlying indicators: i) value of net exports; ii) per capita exports; iii) share in world market; iv) product diversification and concentration; and v) market diversification and concentration. This indicator responds to NRCan's activities over the longer term, but may respond to other influences – such as global economic conditions - more immediately.
48 Capital investments for forestry and energy are measured by “new capital investment” as defined and reported by Statistics Canada. In the case of mines, exploration investments are separated and measured by on-and off-mine-site “exploration plus deposit appraisal”, less “repair and maintenance” as defined and reported by the Minerals &
Metals Mining Statistics Division of NRCan. Data for 2005-2008 are actuals; data for 2009 are intentions. This indicator responds to NRCan's activities over the longer term, but may respond to other influences – such as domestic economic conditions - more immediately.
49 Diversity is defined in terms of receiving countries as measured by a Herfindahl Index. Underlying data is collected from Statistics Canada World Trade Atlas. A value of 1.0 indicates only a single receiving country for all of Canada’s exports; as the value moves towards zero, the more Canada has diversified its dependency on one receiving country. This indicator responds to NRCan's activities over the longer term, but may respond to other influences – such as economic conditions in destination markets - more immediately.
50 http://www.actionplan.gc.ca/initiatives/eng/index.asp?mode=3&initiativeID=157
51 http://www.actionplan.gc.ca/initiatives/eng/index.asp?mode=3&initiativeID=158
52 http://www.actionplan.gc.ca/initiatives/eng/index.asp?mode=3&initiativeID=121
53 http://www.actionplan.gc.ca/initiatives/eng/index.asp?mode=3&initiativeID=125
54 http://www.actionplan.gc.ca/initiatives/eng/index.asp?mode=3&initiativeID=123
55 http://www.actionplan.gc.ca/initiatives/eng/index.asp?mode=3&initiativeID=124
56 http://ess.nrcan.gc.ca/tgi/index_e.php
57 Studies have shown that industry invests on average $5 in exploration, and finds about $125 worth of minerals in the ground for each $1 invested in public geosciences programs.
58 http://gsc.nrcan.gc.ca/gem/index_e.php
59 http://www.nrcan.gc.ca/evaluation/reprap/2009/e20090611-eng.php
60 http://nrcan.gc.ca/eneene/sources/uranuc/pdf/panrep-rapexp-eng.pdf
61 http://www.nrcan-rncan.gc.ca/com/consultation/arcarc-eng.php
62 http://www.nrcan.gc.ca/media/newcom/2009/200981a-eng.php
63 http://cfs.nrcan.gc.ca/subsite/forest-communities
64 http://cfs.nrcan.gc.ca/subsite/fnfp/home
65 Canada's total energy savings due to efficiency are measured by the difference between energy use without energy efficiency improvements and energy use with energy efficiency improvements as defined and reported in Energy Efficiency Trends in Canada, 1990-2007. No data are available past 2007. The data are referenced to a 1990 baseline. This indicator responds to NRCan's activities over the longer term, but may respond to other influences (e.g., domestic economic conditions) more immediately. The 2007 drop in petajoule reductions is a result of a shift from conventional to more energy intensive unconventional oil production in the oil and gas sector.
66 Results shown are the sum of peer-reviewed scientific and technical papers published by the Canadian Forest Service, CanmetENERGY, CANMET-MTL, and CANMET-MMSL as reported in a study commissioned by NRCan from Science-Metrix. The study is presented in Table 14 of the 2009 Evaluation of Minerals and Metals Sector (MMS) Science and Technology. This is a partial view of NRCan’s overall contribution; further development of this indicator will appear in future DPRs.
67 http://www.discours.gc.ca/eng/media.asp?id=1388
68 GHG reductions attributable to NRCan programming are measured under the horizontal ecoACTION initiative administered by Environment Canada. NRCan programming beginning in 2007-08, and captured by this indicator includes eight different ecoENERGY programs: Buildings & Houses, Retrofit, Industry, Equipment, Personal Vehicles, Fleets, Renewable Power, and Renewable Heat.
69 Results shown are the sum of peer-reviewed scientific and technical papers published by CanmetENERGY as determined by a study commissioned by NRCan from Science-Metrix. The study is presented in Table 14 of the 2009 Evaluation of Minerals and Metals Sector (MMS) Science and Technology. This is a partial view of NRCan’s overall contribution; further development of this indicator will appear in future DPRs.
70 http://www.nrcan.gc.ca/eneene/science/ceffep-eng.php
72 http://www.nrcan.gc.ca/eneene/science/renren-eng.php
73 http://www.climatechange.gc.ca/default.asp?lang=En&n=BDE8CD02-1
74 http://www.ecoaction.gc.ca/index-eng.cfm
75 http://www.ecoaction.gc.ca/ecoenergy-ecoenergie/index-eng.cfm
76 http://www.ecoaction.gc.ca/ecoenergy-ecoenergie/power-electricite/index-eng.cfm
77 http://www.ecoaction.gc.ca/ecoenergy-ecoenergie/heat-chauffage/index-eng.cfm
78 http://www.nrcan.gc.ca/eneene/science/etiiet-eng.php
79 http://oee.nrcan-rncan.gc.ca/corporate/retrofit-summary.cfm
80 http://www.ecoaction.gc.ca/ecoenergy-ecoenergie/buildingshouses-batimentshabitations-eng.cfm
81 http://www.ecoaction.gc.ca/ecoenergy-ecoenergie/industry-industrie-eng.cfm
82 http://www.ecoaction.gc.ca/ecoenergy-ecoenergie/fleets-parcsvehicules-eng.cfm
83 http://oee.nrcan.gc.ca/transportation/personal-vehicles-initiative.cfm
84 http://www.nrcan-rncan.gc.ca/com/elements/issues/39/energ-eng.php
85 http://oee.nrcan.gc.ca/transportation/ecoenergy-biofuels/index.cfm
86 http://climatechange.gc.ca/default.asp?lang=En&n=7F9841C4-1
87 http://oee.nrcan.gc.ca/publications/statistics/parliament08-09/index.cfm
88 http://www.ec.gc.ca/Publications/default.asp?lang=En&xml=EB302ECB-BA4E-4387-A279-DFFD600EA3EE
89 http://www.ec.gc.ca/Publications/default.asp?lang=En&xml=492D914C-2EAB-47AB-A045-C62B2CDACC29
90 http://www.ecoaction.gc.ca/index-eng.cfm
91 http://cfs.nrcan.gc.ca/subsite/pulp-paper-green-transformation
92 The indicator measures NRCan’s contribution on an on-demand basis to: 1) federal environmental assessment and reporting processes; and 2) Mineral and Energy Resource Assessments (MERA) for the potential establishment of national parks and other protected areas.
93 Results shown are the sum of papers published by the Canadaian Forest Service as determined by a study commissioned by NRCan from Science-Metrix. The study is presented in Table 14 of the 2009 Evaluation of Minerals and Metals Sector (MMS) Science and Technology. This is partial view of NRCan’s overall contribution; further development of this indicator will appear in future DPRs
94 https://nfi.nfis.org/home.php?lang=en
95 Results shown here for safety, security, and geographic knowledge are the sum of papers published by the CANMET Canadian Explosives Research Laboratory, Geological Survey of Canada, and Geomatics Canada, as determined by a study commissioned by NRCan from Science-Metrix. The study is presented in Table 14 of them 2009 Evaluation of Minerals and Metals Sector (MMS) Science and Technology. This is a partial view of NRCan’s overall contribution; further development of this indicator will appear in future DPRs.
96 Twenty-one of the 53 projects being managed under the MPMO were actively undergoing or had completed a federal regulatory review process. A Project Agreement with target timelines had been signed for nearly all of these projects.
97 Timeliness and accessibility of landmass and natural hazard system data is measured by: 1) Percent of target geomagnetic data posted to the web after quality control by the Canadian Hazard Information Service (CHIS); 2) Percent of target seismic data posted to the web after quality control review by CHIS; and 3) RADARSAT data reception accuracy within the Earth Observation Data Services (EODS) system. Deviations from 100% for these sources represent: a) technical disruptions such as transmission failures or data collection station outages; and b) data corruption such as interference from extraneous activities near data collection stations.
98 Results shown here for safety, security, and geographic knowledge are the sum of papers published by the CANMET Canadian Explosives Research Laboratory, as determined by a study commissioned by NRCan from Science-Metrix. The study is presented in Table 14 of the 2009 Evaluation of Minerals and Metals Sector (MMS) Science and Technology. This is a partial view of NRCan’s overall contribution; further development of this indicator will appear in future DPRs.
99 Timeliness and accessibility of natural hazard system data is measured by: 1) Percent of target geomagnetic data posted to the web after quality control by the Canadian Hazard Information Service (CHIS); 2) Percent of target seismic data posted to the web after quality control review by CHIS. Deviations from 100% for these sources represent: a) technical disruptions such as transmission failures or data collection station outages; and b) data corruption such as interference from extraneous activities near data collection stations.
100 http://www.nrcan-rncan.gc.ca/mms-smm/mate-mate/pip-pip-eng.htm
101 http://www.nrcan-rncan.gc.ca/mms-smm/expl-expl/index-eng.htm
102 Results shown here for geoscience knowledge are the sum of papers published by the Geological Survey of Canada and Geomatics Canada as determined by a study commissioned by NRCan from Science-Metrix. The study is presented in Table 14 of the 2009 Evaluation of Minerals and Metals Sector (MMS) Science and Technology. This is a partial view of NRCan’s overall contribution; further development of this indicator will appear in future DPRs.
103 The data shown here for boundary management and surveys illustrate: 1) New cadastral parcels added to the Canada Lands Survey System (CLSS); 2) Kilometres of vista and survey lines cleared on the Canada-U.S. border (IBC); 3) Average monthly access to geodetic referencing data that support geodetic and gravity information standards for precise positioning and geo-referencing (e.g., GPS); 4) New and/or updated 1:50,000 scale maps (only for 2009-10); and 5) Remote sensing scene production and client downloads of remote sensing data (RADARSAT). Certain of these measures – e.g., for the CLSS – are strongly influenced by domestic economic conditions; in addition, variation in the quantity of survey activities on the Canada-US border is strongly influenced by the difficulty of terrain in the area under survey.
104 Twenty-one of the 53 projects being managed under the MPMO were actively undergoing or completed a federal regulatory review process. A Project Agreement with target timelines had been signed for nearly all of these projects
105 http://www.nrcan-rncan.gc.ca/mms-smm/pubr-pubr/pub-sta-eng.htm
106 http://www.actionplan.gc.ca/initiatives/eng/index.asp?mode=3&initiativeID=123
107 Under UNCLOS, coastal states can use scientific data to determine the outer limits of their continental shelf beyond the customary 200 nautical miles, which would give them the exclusive rights for the exploration of the resources found within their continental shelf. The treaty allows a country 10 years from ratification to submit the scientific proof; giving Canada until 2013 to submit its report.
108 The Actual spending of the Geomatics Canada Revolving Fund is reducing due to the transition to a different funding model.
109 http://www.nrcan.gc.ca/audit/reprap/2010/au1016-eng.php?PHPSESSID=6d0f11425632b1dcc64e6142525bbfcc
110 http://www.nrcan.gc.ca/com/resoress/pubpub-eng.php
111 http://www.tbs-sct.gc.ca/dpr-rmr/2009-10/index-eng.asp