
Treasury Board of Canada Secretariat
www.tbs-sct.gc.ca
Common menu bar links
Breadcrumb Trail
ARCHIVED - Royal Canadian Mounted Police - Report
 This page has been archived.
Archived Content
Information identified as archived on the Web is for reference, research or recordkeeping purposes. It has not been altered or updated after the date of archiving. Web pages that are archived on the Web are not subject to the Government of Canada Web Standards. As per the Communications Policy of the Government of Canada, you can request alternate formats on the "Contact Us" page.
Section III – Supplementary Information
Financial Highlights 41
| Condensed Statement of Financial Position At End of Year (March 31, 2010) |
% Change | 2008–09 | 2009–10 |
|---|---|---|---|
| Assets | |||
| Total Assets | 4.2% | 1,997.0 | 1,915.6 |
| Total | 4.2% | 1,997.0 | 1,915.6 |
| Liabilities | |||
| Total Liabilities | 2.5% | 14,051.6 | 13,712.9 |
| Equity | |||
| Total Equity | 2.2% | (12,054.6) | (11,797.3) |
| Total | 4.2% | 1,997.0 | 1,915.6 |
| Condensed Statement of Financial Operations At End of Year (March 31, 2010) |
% Change | 2008–09 | 2009–10 |
|---|---|---|---|
| Expenses | |||
| Total Expenses | 11.3% | 5,070.0 | 4,554.7 |
| Revenues | |||
| Total Revenues | 9.6% | 1,724.3 | 1,573.5 |
| Net Cost of Operations | 12.2% | 3,345.7 | 2,981.2 |
Condensed Statement of Financial Position
In summary, the RCMP’s total assets and liabilities increased by 4.2 percent and 2.5 percent, respectively.
The year-over-year increase in total assets of $81.4 million (or 4.2 percent) is a result of increases in tangible capital assets ($36.3 million), accounts receivable ($33.9 million) and inventory ($11.2 million). The increase in tangible capital assets represents acquisitions of $214.5 million less disposals of $52 million and amortization of $126.2 million.
Accounts receivable increased as a result of an increment in accrued revenue for contract policing. The growth in inventory is mainly due to an increase in purchases of uniforms and equipment for members.
The year-over-year increase in total liabilities of $338.7 million (or 2.5 percent) is mainly attributable to the increase in RCMP Pension Accounts of $291.2 million, which represents accrued interest less benefits paid during the year.
Condensed Statement of Financial Operations
The year-over-year increase in total expenses of $515.3 million (or 11.3 percent) is primarily due to expenses incurred for the planning and operations related to policing and security for the Vancouver 2010 Olympic and Paralympic Winter Games. In addition, expenses were incurred for the planning and pre-event procurement related to the security for the G8 and G20 Summits in June 2010. These increases are reflected primarily in the Protective Policing program activity.
The increase in revenue of $150.8 million (or 9.6 percent) in fiscal year 2009-2010 is mainly due to additional activities related to contract policing services for the provinces, municipalities, and aboriginal communities. Included in this revenue is $45 million received from the Province of British Columbia related to the security costs of the 2010 Olympics.
Financial Highlights Charts/Graphs
The charts below illustrate the distribution of each of the items in the Statement of Financial Position and the Statement of Operations.
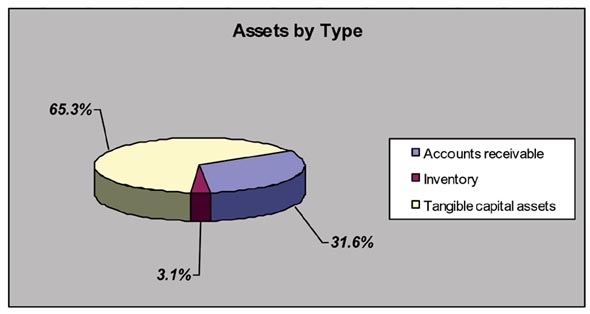
Assets
More than 65 percent of its total assets are made up of tangible capital assets, which are used to primarily support contract policing activities aimed at improving the health and safety of Canadian families and their communities.
The balance represents accounts receivable (31.6 percent) and inventory (3.1 percent).
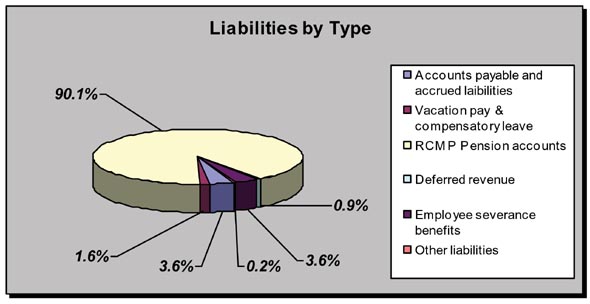
Liabilities
The liabilities consist mainly of RCMP’s Pension Accounts which account for 90.1 percent, accounts payables, accrued liabilities accounts (3.6 percent), and employee severance benefits (3.6 percent).
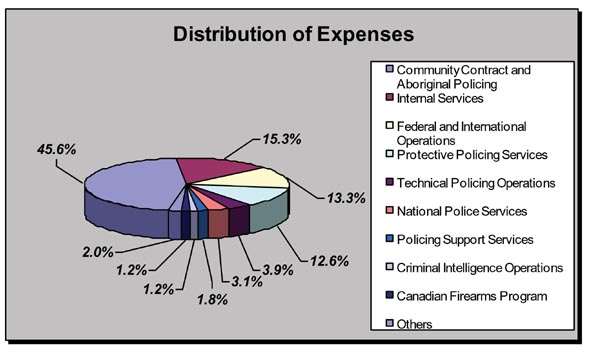
Expenses
The majority of the expenses ($2,311 million, or 45.6 percent) were related to the Community Contract and Aboriginal Policing program, which contributes to improving the health and safety of Canadian families and their communities.
Approximately $774.3 million (or 15.3 percent) was related to Internal Services, which support the needs of programs and corporate obligations of the RCMP. Another $674 million (or 13.3 percent) was related to activities that contribute to Federal and International Operations.
Lastly, $641 million (or 12.6 percent) was spent on activities under Protective Policing Services, which consists mainly of policing and security for the Vancouver 2010 Olympic and Paralympic Winter Games as well as the planning of the security for the G8 and G20 Summits in June 2010.
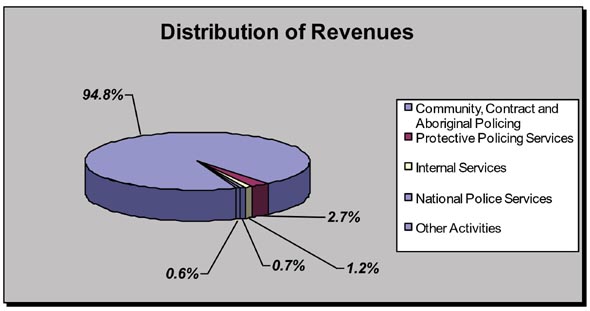
Revenues
The majority of the RCMP’s revenues ($1.63 billion, (or 94.8 percent) was generated from the Community, Contract and Aboriginal Policing program, which contributes to improving the health and safety of Canadian families and their communities.
This revenue represents the contracting partners’ share of these costs.
List of Supplementary Information Tables 42
The following tables are located on the Treasury Board Secretariat website:
- Details on Transfer Payment Programs
- Horizontal Initiatives:
- Games Security and Public Safety for the Vancouver 2010 Olympic and Paralympic Winter Games
- Integrated Border Enforcement Teams (IBET)
- Investments to Combat the Criminal Use of Firearms (ICCUF)
- Internal Audits
- Evaluations
- Projects Operating with Specific Treasury Board Approval
- Status Report on Major Crown Project: Real-Time Identification (RTID)
- Sources of Respendable and Non-respendable Revenue
- User Fees Reporting:
- Firearms
- Access to Information and Privacy
- Green Procurement
Other Items of Interest 43
- Financial Statements
- Corporate Risk Profile
- Governance and Cultural Change
- Three-Year Performance Information: Strategic Priorities
- Three-Year Performance Information: Strategic Outcomes
- Forensic Science and Identification Services Statistics
- Summary of Capital Spending by Program Activity
- Annex to the Statement of Management Responsibility (Internal Control over Financial Reporting)
| Footnotes |
|---|
| 1 Performance rating: Exceeded (more than 100%); Met all (100%); Mostly met (80%-99%); Somewhat met (60%-79%); Not met (less than 60%). 2 In 2009-2010 there were 2,230 licence revocations and an increase of 77,069 individuals subject to court ordered firearms prohibitions. This is a 19% increase in the number of individuals whose firearms licences were revoked and prohibited from possession of firearms in 2009-2010. 3 Canadian Firearms Registry Online queries to the firearms database by front-line police have increased from 3,539,627 queries to 4,361,983 since fiscal year 2008-2009, a 19% increase 4 In 2009-2010, there were 3,794 affidavits in support of firearms prosecutions requested and produced. 5 Commencing in the 2009-2010 Estimates cycle, the resources for the Internal Services Program Activity is displayed separately from other program activities; they are no longer distributed among the remaining program activities, as was the case in previous Main Estimates. This has affected the comparability of spending and FTE information by Program Activity between fiscal years. 6 Performance rating: Exceeded (more than 100%); Met all (100%); Mostly met (80%-99%); Somewhat met (60%-79%); Not met (less than 60%). 7 The sample size for respondents to this survey question is very small (<50), therefore large shifts in the percentages from year to year do not actually represent a significant shift in overall satisfaction. 8 Performance rating: Exceeded (more than 100%); Met all (100%); Mostly met (80%-99%); Somewhat met (60%-79%); Not met (less than 60%). 9 This police screening tool increases police awareness of risk and protective factors of youth offenders, community satisfaction with RCMP youth-related services, and police awareness of community-based youth-serving resources and referral procedures. 10 Although the requirements have been identified, funding has not been secured in order to start the project which will deliver functionality. 11 Voluntary Information Reports provide information concerning suspicions including the identifying information on the person(s) or organization(s) that may be involved in the suspicious financial activities. 12 Although personal information is protected under privacy legislation, FINTRAC may disclose this information under a production order or certain other compulsory processes. 13 Threat and risk assessments establish what serious events may occur, and assesses the risk level and action required to mitigate the threat. 14 National security criminal investigations are complex, resource-intensive and long-term investigations. While they may lead to a disruption, they may not always lead to the laying of terrorism criminal charges. 15 Under the Proceeds of Crime (Money Laundering) and Terrorist Financing Act, which is designed to facilitate combating the money laundering and terrorist financing, both domestically and internationally. In 2009-2010, there were two seizures, both of which are currently before the courts. 16 All national security-related requests for information or assistance from a foreign law enforcement, security or intelligence department or agency are reviewed by National Security Criminal Investigations to ensure their accuracy and adherance to national security-related policies. 17 Performance rating: Exceeded (more than 100%); Met all (100%); Mostly met (80%-99%); Somewhat met (60%-79%); Not met (less than 60%). 18 The risk map for RCMP corporate risks can be found in the Supplementary Tables: http://www.rcmp-grc.gc.ca/dpr-rmr/2009-2010/index-eng.htm 19 The RCMP Planned Spending for 2009-2010 as reported in the 2009-2010 RPP was $2,854 million. Its actual Total Spending Authorities for 2009-2010 were significantly higher at $3,583 million. The difference of $729 million is primarily due to the following increases: $100M for additional resources requested by provinces, territories and municipalities where the RCMP provides policing services under contract; $260M for policing and security at the 2010 Olympic and Paralympic Winter Games; $134M for planning and pre-event operational costs related to policing and security at the June 2010 G8 and G20 summits; $145M in deferred operating and capital spending carried forward from 2008-2009; $20M to implement the new Operational Response Allowance Policy and Service Pay Improvements in response to recommendations made by the Task Force on Governance and Cultural Change in the RCMP; $97M transferred from Treasury Board for compensation adjustments and to fund costs of maternity/paternity leaves and severance pay; and other less significant adjustments accounting for the remainder of the difference. Total Authorities are $271M higher than actual expenditures of $3,312 million. Of the $271M that was not used, approximately half was in frozen allotments and not available for use in-year by the RCMP. Some areas making up this difference include: $102M that had been approved with respect to commitments that the RCMP had foreseen having to make in advance of the G8/G20 meeting were either deferred or reduced allowing it to be carried forward funding into 2010-2011; $38M related to lower than projected costs for the 2010 Olympic and Paralympic Winter Games; $68M in lower than expected requirements to meet policing services demands of provincial, territorial and municipal policing partners; Approximately $37M in operating funds across various programs, and $20M within capital vote for various projects that were deferred or delayed; and $6M in reduced Grants and Contribution funding requirements. 20 2009-2010 actuals differ from those reported in the Performance Summary by $5.4 million. This is the amount spent using proceeds available from the disposal of surplus Crown Assets and it is not reflected in the above table. 21 Performance rating: Exceeded (more than 100%); Met all (100%); Mostly met (80%-99%); Somewhat met (60%-79%); Not met (less than 60%). 22 As a result of delays with the system that was to measure these hours, data is unavailable for 2009-2010. The accountability framework by which time-on-mandate is measured is being examined in 2010-2011. The examination should produce baseline data. 23 Employee surveys are done biennially within the RCMP; these results are from the 2009 survey. The next survey is scheduled to take place in early 2011. 24 Performance rating: Exceeded (more than 100%); Met all (100%); Mostly met (80%-99%); Somewhat met (60%-79%); Not met (less than 60%). 25 Performance rating: Exceeded (more than 100%); Met all (100%); Mostly met (80%-99%); Somewhat met (60%-79%); Not met (less than 60%). 26 Performance rating: Exceeded (more than 100%); Met all (100%); Mostly met (80%-99%); Somewhat met (60%-79%); Not met (less than 60%). 27 This measure is no longer being tracked. 28 Although the question “Percentage of law enforcement partners who agree that the Criminal Intelligence Program provides value” was used in the 2009-2010 Report on Plans and Priorities, the actual wording of the question on the 2010 core survey was “Criminal Intelligence Program is making an important contribution to intelligence-led policing in Canada”. 29 Performance rating: Exceeded (more than 100%); Met all (100%); Mostly met (80%-99%); Somewhat met (60%-79%); Not met (less than 60%). 30 Performance rating: Exceeded (more than 100%); Met all (100%); Mostly met (80%-99%); Somewhat met (60%-79%); Not met (less than 60%). 31 Forensic Science and Identification Services (FS&IS) statistics can be found in the Supplementary Tables at: http://www.rcmp-grc.gc.ca/dpr-rmr/2009-2010/index-eng.htm 32 Criminal record backlog reported in the 2009 Departmental Performance report was 553,564. 33 Performance results from 2009-2010 will be used as baseline information for future target setting. 34 Kirkpatrick Survey Model: Level 3 (6 month follow-up with student) 21% response rate, 5 point scale; results: 4s and 5s = strongly 35 Canadian Police College survey results are calculated by calendar year. 36 Forensic Science and Identification Services (FS&IS) statistics can be found in the Supplementary Tables: http://www.rcmp-grc.gc.ca/dpr-rmr/2009-2010/index-eng.htm 37 Please refer to the Supplementary Tables, Status Report on Major Crown/Transformational Projects – Real Time Identification, for an update on the RTID project: http://www.rcmp-grc.gc.ca/dpr-rmr/2009- 2010/index-eng.htm 38 Performance rating: Exceeded (more than 100%); Met all (100%); Mostly met (80%-99%); Somewhat met (60%-79%); Not met (less than 60%). 39 While some police forces have the ability to automatically generate queries to the Canadian Firearms Registry Online when querying other systems (such as the Canadian Police Information Centre), the majority of queries are manual queries made directly to the Canadian Firearms Registry. 40 Performance rating: Exceeded (more than 100%); Met all (100%); Mostly met (80%-99%); Somewhat met (60%-79%); Not met (less than 60%). 41 The financial highlights presented within this DPR are intended to serve as a general overview of the RCMP’s financial position and operations. The detailed information is provided in the departmental financial statements, which can be found on the RCMP’s website at http://www.rcmp-grc.gc.ca/dpr-rmr/2009-2010/index-eng.htm 42 All electronic supplementary information tables found in the RCMP’s 2009–2010 Departmental Performance Report can be found on the Treasury Board of Canada Secretariat’s website at: http://www.tbs-sct.gc.ca/dpr-rmr/2009-2010/index-eng.asp 43 Other items of interest in the RCMP’s 2009–2010 Departmental Performance Report can be found on the Royal Canadian Mounted Police’s website at: http://www.rcmp-grc.gc.ca/dpr-rmr/2009-2010/index-eng.htm |