
Treasury Board of Canada Secretariat
www.tbs-sct.gc.ca
Common menu bar links
Breadcrumb Trail
ARCHIVED - National Round Table on the Environment and the Economy - Report
 This page has been archived.
Archived Content
Information identified as archived on the Web is for reference, research or recordkeeping purposes. It has not been altered or updated after the date of archiving. Web pages that are archived on the Web are not subject to the Government of Canada Web Standards. As per the Communications Policy of the Government of Canada, you can request alternate formats on the "Contact Us" page.
Section 3: Supplementary Information
3.1 NRTEE Financial Highlights
| $ thousands | |||
|---|---|---|---|
| % Change | 2010 | 2009 | |
| ASSETS | |||
| Total Assets | 1.2 | 717.3 | 708.7 |
| LIABILITIES | |||
| Total Liabilities | 0.7 | 1,129.5 | 1,121.9 |
| EQUITY | |||
| Total Equity | -0.2 | (412.3) | (413.2) |
| TOTAL | 1.2 | 717.3 | 708.7 |
| $ thousands | |||
|---|---|---|---|
| % Change | 2010 | 2009 | |
| EXPENSES | |||
| Total Expenses | -6.2 | 5,346.8 | 5,699.8 |
| REVENUES | |||
| Total Revenues | -67.2 | 34.7 | 105.9 |
| NET COST OF OPERATIONS | -5.0 | 5,312.1 | 5,593.9 |
3.2 NRTEE Financial Statements
As a departmental corporation listed in Schedule II of the Financial Administration Act, the NRTEE is required to produce an annual report containing its audited financial statements. An electronic version of this report for 2009–2010 may be found on NRTEE’s website at the following link: http://www.nrtee-trnee.ca/eng/publications/annual-reports/annualreport-2009-2010/index-AR-2009-2010-eng.php
Section 4: Other Items of Interest
4.1 NRTEE Stakeholders and Their Expectations
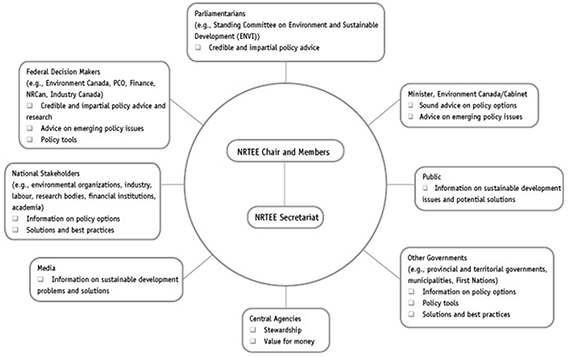
As the stakeholder map in Figure 6 indicates, NRTEE serves a number of stakeholders, including Cabinet and parliamentarians, the Minister of the Environment, federal decision makers, and national stakeholders who have an interest in the environment and sustainable development. The figure summarizes the expectations of each of these stakeholders in relation to the NRTEE.
Figure 6: NRTEE Stakeholders and Their Expectations
4.2 NRTEE Members
NRTEE members meet four times a year to review research, approve reports, and agree on new priorities for action. Members often participate in expert advisory committees and on NRTEE task forces. They bring unique expertise as well as a broader perspective to the Round Table, essential to enriching the NRTEE’s results.
The members (from April 1, 2009 to March 31, 2010) are listed below:
NRTEE Chair
Bob Page
Calgary, Alberta
Janet Benjamin
North Vancouver, British Columbia (to December 8, 2009)
The Honourable
Pauline Browes, P.C.
Toronto, Ontario
Elizabeth Brubaker
Toronto, Ontario
Angus Bruneau
St. John’s, Newfoundland and Labrador
David Chernushenko
Ottawa, Ontario (to November 9, 2009)
Diane Cunningham
London, Ontario (from May 14, 2009)
Anthony Dale
Toronto, Ontario
Francine Dorion
St-Bruno-de-Montarville, Québec
Robert Dubé
Montréal, Québec (to October 12, 2009)
John Hachey
Lachine, Québec (from May 14, 2009)
Timothy Haig
Oakville, Ontario
Christopher Hilkene
Toronto, Ontario
Franklin Holtforster
Ottawa, Ontario (from November 9, 2009)
Mark Jaccard
Vancouver, British Columbia (to November 9, 2009)
Leah Lawrence
Calgary, Alberta (from May 14 to November 13, 2009)
Donald MacKinnon
Toronto, Ontario
Ken McKinnon
Whitehorse, Yukon
Robert Mills
Red Deer, Alberta (from October 1, 2009)
Richard Prokopanko
Vancouver, British Columbia
Wishart Robson
Calgary, Alberta
Robert Slater
Ottawa, Ontario
Robert Sopuck
Sandy Lake, Manitoba (to July 28, 2009)
Biographies and additional information about NRTEE members can be found at http://www.nrtee-trnee.ca/eng/about-us/members/nrtee-members.php.
4.3 NRTEE Contact Information
Jim McLachlan
Director of Corporate Services
344 Slater Street, Suite 200
Ottawa, ON K1R 7Y3
Tel: 613-947-4507
_______________
Footnote
1 Commencing in the 2009-10 Estimates cycle, the resources for the Internal Services program activity are displayed separately from other program activities; they are no longer distributed among the remaining program activities, as was the case in previous Main Estimates. This has affected the comparability of spending and FTE information by program activity between fiscal years.