
Treasury Board of Canada Secretariat
www.tbs-sct.gc.ca
Common menu bar links
Breadcrumb Trail
ARCHIVED - Office of the Privacy Commissioner of Canada - Report
 This page has been archived.
Archived Content
Information identified as archived on the Web is for reference, research or recordkeeping purposes. It has not been altered or updated after the date of archiving. Web pages that are archived on the Web are not subject to the Government of Canada Web Standards. As per the Communications Policy of the Government of Canada, you can request alternate formats on the "Contact Us" page.
Section III: Supplementary Information
This section presents the financial highlights for 2009-2010 and a supplementary information table. Audited financial statements can be found on the OPC website.
3.1 Financial Highlights
| % Change | 2009-2010 ($000) |
2008-2009 ($000) |
|
|---|---|---|---|
| Total Assets | (35%) | 3,411 | 5,259 |
| Total Liabilities | (27%) | 5,172 | 7,110 |
| Total Equity | 5% | (1,761) | (1,851) |
| Total | (35%) | 3,411 | 5,259 |
| % Change | 2009-2010 ($000) |
2008-2009 ($000) |
|
|---|---|---|---|
| Total Expenses | (3%) | 24,808 | 25,474 |
| Net Cost of Operations | (3%) | 24,808 | 25,474 |
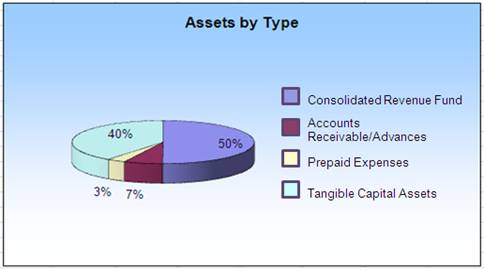
Total assets were $3.411M at the end of 2009-2010, a decrease of $1.848M (35 percent) over the previous year's total assets of $5.259M. Of the total assets, $1.709M (50 percent) were to be received from the Consolidated Revenue Fund. Tangible capital assets represented 40 percent of total assets, while accounts receivable and advances made up 7 percent and prepaid expenses, 3 percent of total assets.
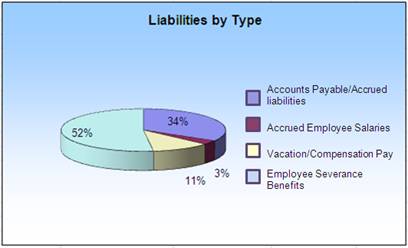
Total liabilities were $5.172M at the end of 2009-2010, a decrease of $1.938M (27 percent) over the previous year's total liabilities of $7.110M. Employee severance benefits represented the largest portion of liabilities, at $2.683M, or 52 percent of the total. Accounts payable and accrued liabilities represented a slightly smaller portion of the total liabilities, at $1.727M, or 34 percent. Vacation/compensation pay and accrued employee salaries accounted for 11 percent and 3 percent of total liabilities, respectively.
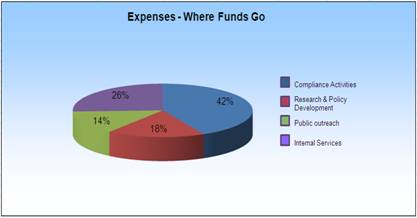
Total expenses for the OPC were $24.808M in 2009-2010. The largest share of the funds, $10.539M, or 42 percent, was spent on compliance activities, while research and policy development represented $4.369M, or 18 percent, of total expenses. Public outreach efforts represented $3.517M of the expenditures, or 14 percent of the total. Internal Services accounted for the remainder of the expenditures, at $6.383M, or 26 percent of the total.
Audited Financial Statements
Information on OPC's audited financial statements can be found at the following link: http://www.priv.gc.ca/information/an-av_e.cfm#contenttop
3.2 Supplementary Information Tables
The OPC has a single supplementary table as follows:
Table 10 - Internal Audit and Evaluation
Approved internal audit and evaluation reports are available on the OPC website: http://www.tbs-sct.gc.ca/dpr-rmr/st-ts-eng.asp.
1 Reference is made to "individuals" in accordance with the legislation.
2 The TBS scale for performance status refers to the proportion of the expected level of performance (as evidenced by either the planned activities and outputs or the indicator and target from the corresponding year's Report on Plans and Priorities) achieved during the fiscal year. The ratings are: exceeded - more than 100 percent; met all - 100 percent; mostly met - 80 to 99 percent; somewhat met - 60 to 79 percent; and not met - less than 60 percent.
3Type is defined as previous (committed to in one of the past two Reports on Plans and Priorities [RPP]); ongoing (committed to at least three fiscal years prior to this RPP), or new (committed to in this RPP).
4This priority, first presented in the 2008-2009 Report on Plans and Priorities with a focus on Canadians only, was broadened in 2009-2010 to also include organizations and institutions.
5In future reports, timeliness of responses will be calculated by the proportion of complaints completed within service standards. In 2009-2010, the OPC completed a major review of its processes for handling inquiries and complaints, and new service standards will be set on that basis in 2010-2011. Until then, this report presents the Office's actual treatment time to close complaints. As well, the OPC is developing a new quality-assurance mechanism for its investigation process, which will complement the timeliness indicator when evaluating the effectiveness of OPC responses to individuals' complaints.
6The audits completed in 2009-2010 were: Audit of the Financial Transactions and Reports Analysis Centre of Canada (FINTRAC), Nov. 17, 2009; Audit of the Passenger Protect Program of Transport Canada, Nov. 17, 2009; Audit of Federal Annual Privacy Reports, Nov. 17, 2009; Audit of Wireless Technology Within Selected Federal Institutions (not yet published at time of writing this report), and Audit of Selected Mortgage Brokers, published June 8, 2010, after this reporting period.
7 At the present time, this indicator measures responsiveness of federal government departments to the OPC advice on their PIAs. In the future, the measure may be broadened to also cover private-sector organizations and other OPC activities.
8 The indicator is about the "reach" to "organizations". The target associated with this indicator, as published in the 2009-2010 RPP, is also used to measure the reach to "individuals" (as the target audience). Therefore, the information presented earlier in this table as it relates to "individuals" is also relevant to this indicator for "organizations". In the 2010-2011 RPP, the OPC has made its measure of reach to organizations more specific.
9 A research project on social network use in the North had also been approved but was then cancelled due to extenuating circumstances experienced by the contracted researcher.
10 In light of the OPC's independence from government, one of the 21 MAF criteria does not apply; it relates to government priority horizontal initiatives.