
Treasury Board of Canada Secretariat
www.tbs-sct.gc.ca
Common menu bar links
Breadcrumb Trail
ARCHIVED - Transport Canada - Report
 This page has been archived.
Archived Content
Information identified as archived on the Web is for reference, research or recordkeeping purposes. It has not been altered or updated after the date of archiving. Web pages that are archived on the Web are not subject to the Government of Canada Web Standards. As per the Communications Policy of the Government of Canada, you can request alternate formats on the "Contact Us" page.
Section III – Supplementary Information
3.1 Financial Highlights
The financial highlights presented within this DPR are intended to serve as a general overview of Transport Canada’s financial position and operations. The department’s financial statements can be found on Transport Canada’s website.
| Condensed Statement of Financial Position At End of Year (March 31, 2010) |
% Change | 2009-2010 | 2008-2009 (Restated) |
|---|---|---|---|
| Total Assets | -2.2 % | 2,875,207 | 2,940,483 |
| Total Liabilities | -4.5 % | 1,853,707 | 1,941,940 |
| Total EQUITY | 2.3 % | 1,021,500 | 998,543 |
| Condensed Statement of Financial Operation At End of Year (March 31, 2010) |
% Change | 2009-2010 | 2008-2009 (Restated) |
|---|---|---|---|
| Total Expenses | -12.2 % | 1,423,175 | 1,621,284 |
| Total Revenues | -7.2 % | 377,226 | 406,311 |
| Net Cost of Operations | -13.9 % | 1,045,949 | 1,214,973 |
Financial Highlights Graphs
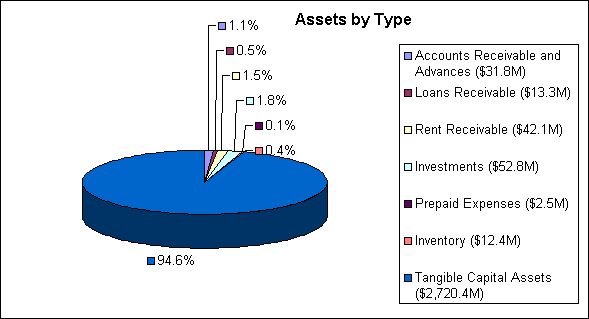
Total assets were $2,875 million at the end of 2009-2010, a decrease of $65 million (2.2 %) over the previous year’s total assets of $2,940 million. Tangible capital assets represented the largest portion of total assets at $2,720.4 million or 94.6 % of total assets.
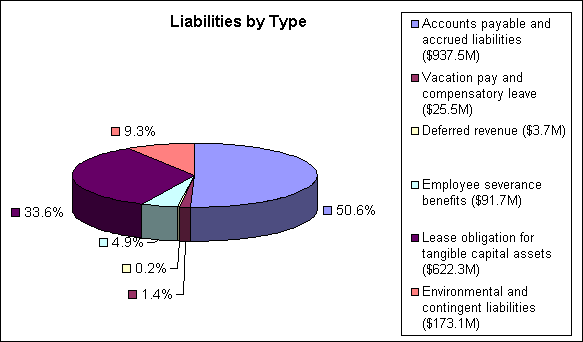
Total liabilities were $1,854 million, a decrease of approximately $88 million (4.5 %) over the previous year’s total liabilities of $1,942 million. Accounts payable represents the largest portion of liabilities at $937.5 million or 50.6 % of total liabilities.
* The Revenues from the Ship-Source Oil Pollution Fund and other programs are earmarked under legislation for specific expense purposes and are not available for Transport Canada spending.
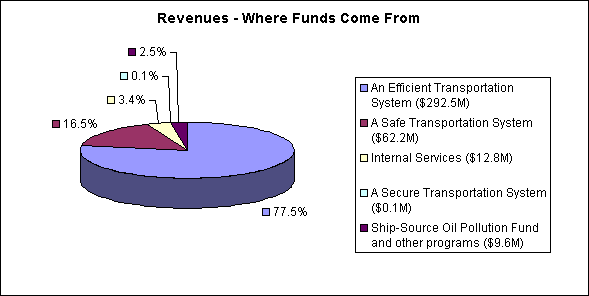
The department’s total revenues amounted to $377 million for 2009-2010. There was a decrease of $29 million (7.2 %) from the previous year’s revenue. Most of Transport Canada’s revenue was derived from the Efficient Transportation System program.
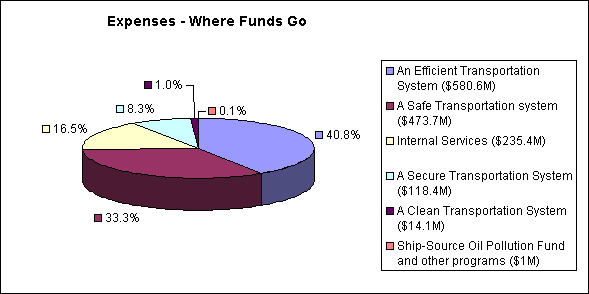
Total expenses for Transport Canada were $1,423 million in 2009-2010. The majority of funds, $1,173 million or 82.4 %, were spent on transportation efficiency, safety and security while other programs represented $251 million or 17.6 % of total expenses.
3.2 Canada’s Economic Action Plan (EAP)
The following tables identify the Transport Canada EAP initiatives, including funding:
| EAP Initiative ($ in 000’s) |
Total EAP Allocations for all years | TBS Authority for 2009-2010 | Actual Spending during 2009-2010 | One or Multi Year |
|---|---|---|---|---|
| Modernizing Federal Laboratories | 14,191 | 4,534 | 4,534 | Multi year |
| Remote Passenger Rail Services | 7,900 | 4,500 | 4,500 | Multi year |
| Rail Safety | 64,238 | 10,787 | 8,849 | Multi year |
| Blue Water Bridge | 13,500 | 2,500 | 1,451 | Multi year |
| Peace Bridge | 1,000 | 800 | 83 | Multi year |
| Remediation of federal contaminated sites | 47,826 | 12,883 | 12,282 | Multi year |
| Security Plans | 2,425 | 2,425 | 2,334 | One year |
| Air Cargo Security Program | 10,326 | 10,326 | 10,278 | One year |
| Promoting Energy Development in Canada’s North [15] | 2,501 | 2,501 | 2,171 | One year |
In addition to funding received directly, three of Transport Canada’s portfolio agencies also received EAP funding, as follows:
| EAP Initiative ($ in 000’s) |
Total EAP Allocations for all years | TBS Authority for 2009-2010 | Actual Spending during 2009-2010 | One or Multi Year |
|---|---|---|---|---|
| via-intercity rail service | 407,000 | 125,000 | 125,000 | Multi year |
| CATSA | 355,762 | 355,762 | 328,570 | One year |
| JCCBI-Champlain Bridge | 212,353 | 13,868 | 12,968 | Multi year |
Information on progress for these initiatives can be found in section II under each program activity. Transport Canada is currently conducting program evaluations of a number of EAP initiatives.
3.3 Summary Tables by Strategic Outcomes and Explanations on Variances
The tables below provide a summary of the performance for each Strategic Outcome (SO) and Internal Services. The departmental Performance Measurement Framework is currently being reviewed to ensure a stronger measurement approach that will provide greater accuracy in the monitoring and reporting of the impact of departmental initiatives.
| Performance Indicators | Targets | 2009-2010 Performance |
|---|---|---|
| Level of productivity of transportation sector | Increase by 2.5 percent to 5 percent relative to 2009 baseline (Productivity Index >113 in 2014) |
Most recent figures available are from the 2008 calendar year. In 2008, the productivity of the transportation business sector increased by 1.2 percent (For-hire trucking was not included as figures are being updated). Due to the economic recession, it is likely that productivity growth was negative in 2009. |
| Cost level in the transportation sector | Growth in unit costs does not exceed 11 percent over a 5-year horizon relative to the 2009 baseline (Cost Index < 111 in 2014) | The unit costs for the same subset above increased by 8.6 percent in 2008. Increased unit costs were mainly due to rising fuel prices. Productivity gains were not enough to offset the approximate 37 percent increase in fuel input prices. |
| Program Activity [16] | Expected Results | Alignment to Government of Canada Outcomes | 2008-2009 Actual Spending |
2009-2010 | |||
|---|---|---|---|---|---|---|---|
| Main Estimates |
Planned Spending |
Total Authorities [17] |
Actual Spending [18] |
||||
| Transportation Marketplace Frameworks | A competitive and financially viable transportation sector through effective transportation marketplace frameworks | A fair and secure marketplace | 11 | 9 | 9 | 11 | 11 |
| Gateways and Corridors | Enhanced level of trade through Canada’s strategic gateways and trade corridors | Strong economic growth | 59 | 659 | 658 | 620 | 156 |
| Transportation Infrastructure | Modern transportation system | Strong economic growth | 3 | 40 | 48 | 79 | 46 |
| Transportation Innovation | An innovative transportation system | An innovative and knowledge-based economy | 9 | 10 | 10 | 14 | 7 |
| Total [6] | 82 | 718 | 725 | 724 | 220 | ||
Information on Variances (between Total Authorities and Actual Spending)
Gateways and Corridors: The $464 million variance was attributed to two main factors. The majority of this variance $394 million occurred under the Gateways and Border Crossings Fund and the Asia-Pacific Gateway and Corridor Initiative Transportation Infrastructure Fund. Funded projects are large and complex and take time to develop and the market conditions of the economic downturn caused construction costs to be lower than anticipated, thus resulting in lower than expected bids on tenders. The remaining variance of $70 million is related to the Windsor Gateway Project and is a consequence of factors such as the length of time required to undertake the necessary due diligence work to properly evaluate land value proposals, delays in commencing some of the necessary studies due to weather conditions and timing of the federal environmental assessment approval.
Transportation Infrastructure: The $33 million variance is due to long negotiations, construction/weather or environmental assessments delays, which have resulted in specific initiatives such as the Outaouais Road Agreement ($5.8 million) and divestiture agreements from the Port Divestiture fund ($17 million) not being finalized in the reporting year. Other variances ($10.2 million) are made up of minor program variances, such as short construction season, delays in major repairs, cancellation of tendering processes, etc.
Transportation Innovation: The $7 million variance is primarily attributed to delays in meeting all conditions related to the terms and conditions of the Security and Prosperity Partnership Contribution program under the Smart Border Action Plan, some delays in the signing and execution of some contribution agreements due to pending environmental approvals, incomplete work on the National Roadside Survey, lengthy federal and provincial negotiations, certain expenditures recorded under Gateways and Corridors as they were part of the Gateway and Border Crossings initiative and the relocation of Transport Development Centre from Montreal to Ottawa.
For the most part, the funds not used in 2009-2010 for these program activities will be carried forward to 2010-2011.
| Performance Indicators | Targets | 2009-2010 Performance |
|---|---|---|
| Level of greenhouse gas emissions from the transportation sector measured in tonnes of CO2 equivalent | Greenhouse gas (GHG) emission levels from the transportation sector reduced consistent with government targets as identified in Turning the Corner | Based on the most recent available information, transportation GHG emissions have remained relatively unchanged in 2008 as compared to 2007 (198 megatonnes (Mt) of CO2 equivalent in 2008 [19] as compared to 199 Mt in 2007). |
| Level of air pollutants produced by the transportation sector | Level of air pollutants from the transportation sector reduced consistent with targets to be established under the Clean Air Agenda | Since 1990 [20], transportation sector air pollution emissions such as fine particulate matter, sulphur oxides, nitrogen oxides and volatile organic compounds, have shown a steady decline mainly due to on-road vehicles regulatory initiatives and vehicle fleet renewal. The most recent available data is from 2007. |
| Program Activity [16] | Expected Results | Alignment to Government of Canada Outcomes | 2008-2009 Actual Spending |
2009-2010 | |||
|---|---|---|---|---|---|---|---|
| Main Estimates |
Planned Spending |
Total Authorities [17] |
Actual Spending [18] |
||||
| Clean Air from Transportation | A transportation system that is less intensive in its emissions of greenhouse gases and air pollutants | A clean and healthy environment | 146 | 33 | 34 | 29 | 19 |
| Clean Water from Transportation |
Canadian waters protected from discharges of transportation pollutants Prevention of the transfer of alien aquatic species into domestic water through ship ballast water |
9 | 6 | 6 | 9 | 10 | |
| Environmental Stewardship of Transportation | Transport Canada aware of and responsive to environmental effects of its activities | 35 | 34 | 44 | 55 | 38 | |
| Total [6] | 190 | 73 | 84 | 93 | 67 | ||
Information on Variances (between Total Authorities and Actual Spending)
Clean Air: The $10 million variance was primarily due to amendments and scope changes under various ecotransport programs in response to the economic downturn and delays in negotiation of some contribution agreements, delays in vehicle acquisitions and in the introduction of new advanced technology vehicles, a less resource-intensive alternative to measure the effects of ecoauto and delays in establishing partnerships with key partners under the ecotransport initiatives.
Clean Water: The $1 million over-expenditure was related to the Aerial Surveillance program used to detect pollution from ships. Funding was allocated to the program to continue surveillance coverage in Newfoundland.
Environmental Stewardship: The $17 million variance is related to the management of environmental remediation projects, the majority of which are managed under the Federal Contaminated Sites Action Plan. Environmental remediation projects are often large and complex and highly influenced by outside conditions such as weather, tendering and uncertainty in actual volumes of contamination. The surplus was primarily due to project delays across the country related to additional site assessments and required environmental approvals, contracting delays and lower contracting bids received for some contracts. In addition, part of the variance is related to 2009-2010 projects that were undertaken in 2008-2009.
For the most part, the funds not used in 2009-2010 for these program activities will be carried forward to 2010-2011.
| Performance Indicators | Targets | 2009-2010 Performance |
|---|---|---|
| Number/rate of accidents or fatalities by mode | Maintain or improve accident/fatality rates by mode, based on each mode’s strategic objectives |
|
| Degree of public confidence in the safety of the transportation system | Maintain or improve public confidence in the safety of transportation, based on the strategic objectives of each mode | No surveys were conducted in 2009-2010; this indicator is currently under review. |
| Program Activity [16] | Expected Results | Alignment to Government of Canada Outcomes | 2008-2009 Actual Spending |
2009-2010 | |||
|---|---|---|---|---|---|---|---|
| Main Estimates |
Planned Spending |
Total Authorities [17] |
Actual Spending [18] |
||||
| Aviation Safety | A safe civil aviation system | Safe and secure Canada | 252 | 238 | 241 | 247 | 231 |
| Marine Safety | A safe marine transportation system | 82 | 74 | 75 | 87 | 82 | |
| Rail Safety | A safe rail transportation system | 30 | 28 | 28 | 43 | 37 | |
| Road Safety | Safe roads | 29 | 36 | 35 | 36 | 30 | |
| Transportation of Dangerous Goods | Public safety during the transportation of dangerous goods | 14 | 14 | 14 | 16 | 14 | |
| Total [6] | 407 | 390 | 393 | 429 | 394 | ||
Information on Variances (between Total Authorities and Actual Spending)
Aviation Safety: The $16 million variance was primarily the result of reduced spending in the Airports Capital Assistance Contribution Program of $9 million. Given that it was the last year of the five-year program, recipients could only submit funding applications for projects that could be completed in one year. In addition, lower than expected bids were received for some of the projects and delays in some projects occurred due to a number of factors, such as poor weather conditions, late tendering and awarding of contracts. Reduced operating budget spending of $5.5 million in the Civil Aviation Program was due to staffing delays and decreased employee travel and training while the Program transitioned to a regulatory oversight program based on Safety Management Systems, decreased costs for Department of Justice and translation services and reduced capital budget spending of $1.5 million due to delays in the contracting process for several capital projects.
Marine Safety: The $5 million variance was primarily the result of reduced spending in salaries for inspectors due to vacant positions ($0.8 million surplus), reduced revenues representing a deficit of $0.4 million due to the decrease in shipping activity, reduced spending in training for inspectors ($0.54 million surplus), reduced spending in legal services ($0.4
million surplus) due to insufficient legal services capacity to meet requirements and reduced spending in the Marine Simulators Contribution Program ($2.3 million surplus), which offers financial assistance for the transfer and modernization of marine training simulators to five provinces (British Columbia, Ontario, Quebec, Nova Scotia and Newfoundland and Labrador) that have Marine
Training Institutes. Some provinces have experienced delays in meeting the requirements to proceed with the transfer. An outstanding $1.4 million was coded to SO3 during the transition period for Security Programs Support. A BAP was prepared to address this internal transfer of funds to SO4.
Rail Safety: The $6 million variance was primarily the result of some delays encountered initiating internal processes and obtaining approvals, as well as staffing some vacant positions. $1 million of this variance was re-profiled to 2011-2012.
Road Safety: The $6 million variance was primarily the result of $4.443 million that was not spent under the National Safety Code contribution program, which expired on March 31, 2009. The development of a Treasury Board submission was delayed. The variance of $1.15 million under ecotransport – National Harmonization Initiative for the Trucking Industry, was due to the lack of uptake from the provinces and territories for this program. There was $0.4 million in capital for asphalt costs at the Motor Vehicle Test Centre in Blainville, Quebec, which will be re-profiled to next year.
Transportation of Dangerous Goods: The $2 million variance was primarily the result of staffing delays and associated decreased employee travel and training, and reduced capital budget spending due to delays in the contracting process for capital projects.
| Performance Indicators | Targets | 2009-2010 Performance |
|---|---|---|
| Level of credibility of Canada’s transportation security internationally | No countries impose special security measures on goods and people arriving from Canada |
The target is being reviewed and the baseline will be established in 2010-2011. Canada, however, is held in a high regard by international partners such as the International Civil Aviation Organization (ICAO) and the International Maritime Organization (IMO) and by its key trading partners including the U.S. Although some adjustments were made during the year to ensure consistency, such as those following the December 25, 2009 aviation security threat, the measures imposed do not impact significantly on people and goods arriving from Canada. |
| Degree of public confidence in the security of the transportation system | Maintain or improve confidence in the security of the transportation systems, based on the strategic objectives of each mode |
While there were no surveys conducted on this indicator by Transport Canada, external surveys have been conducted on the issue of body scanners following the attempted terrorist attack on December 25, 2009 and the introduction of body screening technology at major Canadian airports. An Angus Reid Public Opinion survey regarding body scanners indicates that 74 percent of Canadians are in favour of these new devices. In addition, the Harris Decimal poll demonstrates that Canadians expect the use of these devices will have a positive impact on the security of air travel. |
| Program Activity [16] | Expected Results [21] | Alignment to Government of Canada Outcomes | 2008-2009 Actual Spending |
2009-2010 | |||
|---|---|---|---|---|---|---|---|
| Main Estimates |
Planned Spending |
Total Authorities [17] |
Actual Spending [18] |
||||
| Aviation Security | A secure aviation system | Safe and secure Canada | 65 | 62 | 62 | 73 | 71 |
| Marine Security | A secure marine transportation system | 27 | 29 | 29 | 33 | 32 | |
| Surface and Intermodal Security | Urban transit/Rail transportation (passenger and freight) operators aware of and adopt voluntary and regulatory requirements when latter are in place | 66 | 7 | 11 | 13 | 12 | |
| Total [6] | 158 | 98 | 102 | 119 | 115 | ||
Information on Variances (between Total Authorities and Actual Spending)
Marine Security Program: The $1 million variance is related to the Marine Security Contribution Program, which sunsetted in 2009-2010. Reimbursement for eligible expenses claimed by recipients was less than originally forecast in the Program’s fifth and final year.
Transport Canada’s Aviation Security Program: The $2 million variance is due to additional funding received for Air Cargo and Security Plans.
Surface and Intermodal Security Program: The variance is due to fiscal year 2009-2010 being a transition period as Transport Canada adjusted to a PAA-based approach to managing results. PAA variances were preserved to support PAA alignment and budget normalization for future years.
| ($ millions) | ||||||
| Program Activity [16] | Alignment to Government of Canada Outcomes | 2008-2009 Actual Spending |
2009-2010 | |||
|---|---|---|---|---|---|---|
| Main Estimates |
Planned Spending |
Total Authorities [17] |
Actual Spending [18] |
|||
| Internal Services | Not applicable | 204 | 171 | 172 | 213 | 217 |
| Total | 204 | 171 | 172 | 213 | 217 | |
Information on Variances (between Total Authorities and Actual Spending)
Both the financial and FTE variances are due to internal reallocations within Transport Canada’s new Program Activity Architecture (PAA) structure and additional funding received during the year.
3.4 Program Activity Architecture Crosswalk
| 2008-2009 | 2009-2010 |
|---|---|
|
SO1 [23]: An efficient transportation system that contributes to Canada’s economic growth and trade objectives PA [24] : Transportation Policy Development, Programs and Infrastructure in support of a market-based framework |
SO1: An efficient transportation system PA: Transportation Marketplace Frameworks, Gateways and Corridors, Transportation Infrastructure and Transportation Innovation |
|
SO2: A safe and secure transportation system that contributes to Canada’s social development and security objectives PA: Transportation Safety and Security |
SO3: A safe transportation system PA: Aviation Safety, Marine Safety, Rail Safety, Road Safety, and Transportation of Dangerous Goods |
|
SO4: A secure transportation system PA: Aviation Security, Marine Security, and Surface and Intermodal Security |
|
|
SO3: An environmentally responsible transportation system that contributes to Canada’s sustainable development objectives PA: Sustainable Transportation Development and the Environment |
SO2: A clean transportation system PA: Clean Air from Transportation, Clean Water from Transportation, and Environmental Stewardship of Transportation |
|
Internal Services [25] supporting all four strategic outcomes |
3.5 Risk Analysis
A safe, secure, and clean transportation system is vital to Canada’s economic competitiveness, standard of living and relationships with global trading partners. As part of its responsibilities, Transport Canada must manage several significant risks. Some of the key risks areas are as follows:
The department’s risk-Based Audit Plan demonstrates how Transport Canada is implementing integrated risk management into its operations. Audit, Evaluation and Advisory Services, as part of its annual planning work, conducts risk assessments in which senior management are engaged in a process to assess key risk areas where greater assurance and management oversight may be of value.
The December 25, 2009 security incident and the security planning for the XXI Olympic Winter Games in Vancouver have reinforced certain strategies to Canada’s approach to national security. New technologies, regulatory initiatives, and working with domestic and international partners to ensure harmonization in security approaches are some of the ways that Transport Canada has responded to the threat of terrorism. Moreover, Transport Canada continues to take a proactive approach to security, while keeping security policies from becoming trade barriers and obstacles in this time of economic uncertainty. For example, the department continued to implement the Asia-Pacific Gateway and Corridor Initiative to advance the competitiveness of Canada’s transportation system.
Regarding the Olympic security planning, Transport Canada, in cooperation with other key federal partners including the RCMP, conducted a number of risk assessments. The key risks focused on potential attacks against the transportation system, the use of transportation assets as a weapon and the use of the transportation system to gain access to venues. Based on those risk assessments and RCMP planning priorities, the Department used its regulatory powers, in addition to its strong working relationship with stakeholders, to enhance the security posture of the transportation system. To this end, air restrictions were in place, controlled access and time of day restrictions for the movement and storage of dangerous goods were set up and marine exclusion zones were arranged.
To support the federal government in reducing the impacts of the recession, Transport Canada employed a robust risk management strategy to ensure strong oversight and implementation of Canada’s Economic Action Plan (EAP). Key risks and associated risk mitigation strategies were identified for each EAP initiative as well as for the Department’s overall management of the EAP in its entirety. The risk management strategy was kept current through frequent reviews of the risk profiles and senior executives were engaged in the process of risk mitigation via regular quarterly progress reports to the Departmental Audit Committee (DAC) and the senior executive committee (TMX).
As indicated above, Transport Canada continues to implement measures to reduce the impact of external challenges and risks to its ability to achieve an efficient, clean, safe and secure transportation system for Canadians.
3.6 List of Supplementary Information Tables
The following tables were submitted electronically. The electronic tables can be found
on the Treasury Board Secretariat’s website.
- Sources of respendable and non-respendable revenue
- User fees reporting
- Status Report on Projects operating with specific TB approval
- Status Report on Major Crown/Transformational Projects
- Details on Transfer Payment Programs
- Horizontal Initiatives
- Green Procurement
- Response to Parliamentary Committees and External Audits
- Internal Audits and Evaluations
3.7 Other Items of Interest
A
Advisory Panel’s Review of the Canadian Air Transport Authority Act
Airport Capital Assistance Program
All Aboard: Rail Safety Strategic Plan (2005-2010)
Asia-Pacific Gateway and Corridor Initiative
Automakers Agreement to Reduce GHG Emissions
C
Cabinet Directive on Streamlining Regulation
Canadian Transportation Agency
E
F
G
M
N
Navigable Waters Protection Program
O
Ontario-Quebec Continental Gateway
R
S
T
Transportation in Canada - Overview report (2008)
Transport, Infrastructure and Communities portfolio
Transportation of Dangerous Goods
[1] Operational Priorities focus on ways to improve value for money in the department’s program base to deliver better results for Canadians.
[2] Management Priorities focus on improving a department’s management practices and controls, in such areas as human resources, risk management, real property management and corporate services.
[3] Type definition: Ongoing – committed to at least three fiscal years before the year of this report.
[4] Type definition: New Commitment – newly committed to in the reporting year of the RPP or DPR.
[5] Statutory payments of less than $1 million were not included in this chart.
[6] Due to rounding, columns may not add to the totals shown.
[7] Please visit Transport Canada's website.
[8] Slight rewording from Main Estimates for clarification.
[9] The evaluation will be posted online in 2010-2011.
[10] Angus Reid Public Opinion survey
[11] Harris Decimal poll
[12] The program activity (PA) description for Surface and Intermodal Security has been amended to reflect the end of the Transit-Secure Contribution program on March 31, 2009.
[13] Commencing in 2009-2010 Estimates cycle, the resources for the Internal Services Program Activity are displayed separately from other Program Activities; they are no longer distributed among the remaining Program Activities, as was the case in previous Main Estimates. This has affected the comparability of spending and FTE information by Program Activity between fiscal years.
[14] Management and Oversight includes: Offices of the Minister, Minister of State, Deputy Minister, Associate Deputy Minister, Assistant Deputy Ministers and Regional Directors, Policy (Economic Analysis, Strategic Policy and International and Intergovernmental Relations), Programs (Programs Excellence and Aboriginal Consultations), Audit and
Evaluation, Crown Corporation Governance, Corporate Planning and reporting, Communications and Legal Services.
[15] The department’s role was to respond to the Joint Review Panel’s report on the Mackenzie Gas Project (released December 30, 2009), conduct Aboriginal consultations, and increase inspections, enforcement and outreach activities in the project area. The lead department for this project is Environment Canada.
[16] For program activity descriptions, please access the Main Estimates online.
[17] Total Authorities = Main Estimates + Supplementary Estimates.
[18] Actual Spending is exactly as shown in Public Accounts.
[19] 1990-2008 Greenhouse Gas Emissions Inventory, Environment Canada.
[20] 1985-2007 National CAC Emissions Summary, Environment Canada
[21] Slight rewording for clarification.
[22] The crosswalk detailing the redistribution of financial resources is available on Transport Canada’s website under the Financial Program Activity Crosswalk 2008-2009 and 2009-2010.
[25] Commencing in the 2009-2010 Estimates cycle, the resources for Internal Services program activity are displayed separately from other program activities. They are no longer distributed among the remaining program activities, as was the case in previous Main Estimates. This has affected the comparability of spending and full-time equivalent (FTE) information by program activity between fiscal years.