ARCHIVED - Transport Canada - Report
 This page has been archived.
Archived Content
Information identified as archived on the Web is for reference, research or recordkeeping purposes. It has not been altered or updated after the date of archiving. Web pages that are archived on the Web are not subject to the Government of Canada Web Standards. As per the Communications Policy of the Government of Canada, you can request alternate formats on the "Contact Us" page.
2009-10
Departmental Performance Report
Transport Canada
The original version was signed by
The Honourable Chuck Strahl, P.C., M.P.
Minister of Transport, Infrastructure and Communities
Table of Contents
Section I - Departmental Overview
- 1.1 Summary Information
- 1.2 Departmental Performance
- 1.3 Operational and Management Priorities
- 1.4 Resources
- 1.5 Financial Information
Section II – Analysis of Program Activities by Strategic Outcome
- 2.1 Strategic Outcome: An Efficient Transportation System
- 2.2. Strategic Outcome: A Clean Transportation System
- 2.3 Strategic Outcome: A Safe Transportation System
- 2.4 Strategic Outcome: A Secure Transportation System
- 2.5 Program Activity: Internal Services
Section III – Supplementary Information
- 3.1 Financial Highlights
- 3.2 Canada’s Economic Action Plan (EAP)
- 3.3 Summary Tables by Strategic Outcomes and Explanations on Variances
- 3.4 Program Activity Architecture Crosswalk
- 3.5 Risk Analysis
- 3.6 List of Supplementary Information Tables
- 3.7 Other Items of Interest
Erratum
Please note that a correction was made to both the English and French version of the report (2.1.2 Gateways and Corridors, Performance Status and Summary). The word "increased" has been replaced with the word "contracted".
Minister's Message
 As Canada’s new Minister of the Transport, Infrastructure and Communities (TIC) Portfolio, I am pleased to present the
Departmental Performance Report for 2009-2010.
As Canada’s new Minister of the Transport, Infrastructure and Communities (TIC) Portfolio, I am pleased to present the
Departmental Performance Report for 2009-2010.
Canada entered the global economic crisis with balanced budgets, decreasing debt and taxes, a strong financial sector and robust economic policies. Transport Canada worked with our partners at all levels of government to help successfully implement Canada's Economic Action Plan (EAP), injecting nearly $500 million of stimulus money into the economy. The result is a more modern transportation infrastructure.
The department continues to pursue long-term policy, planning and strategic investments in transportation systems. Our Gateway approach helps Canada respond to evolving global trade opportunities for international commerce. Our work continues on the Asia-Pacific Gateway and Corridor Initiative; gateway strategies for the Atlantic and for Central Canada; and the new Windsor-Detroit bridge crossing, with our United States, Michigan and Ontario partners.
Our transportation safety record remains the envy of our partners worldwide. Our efforts to modernize and harmonize standards, policies, programs and regulations are improving safety across all modes. Foremost among these efforts is the implementation of Safety Management Systems, an innovative approach to managing safety issues before they become accidents by inspiring a stronger safety culture with operators and users.
From a security perspective, the government responded quickly after the December 25th, 2009 attempted terrorist bombing of a Northwest Airlines flight to Detroit. New regulations enhanced the security of the travelling public. The federal government provided $1.5 billion to CATSA and Transport Canada, with another $95.7 million to enhance air cargo security over 5 years. Transport Canada also worked closely with transportation infrastructure owners and operators and our international partners to enhance transportation safety and security across all transportation modes during the 2010 Olympic and Paralympic Winter Games in Vancouver and Whistler.
Transport Canada is actively contributing to a clean transportation system that helps preserve our environment, protects the health of Canadians and furthers our economic prosperity. Transport Canada continued to implement programs under the ecotransport strategy; supported the development of international standards and recommended practices for the aviation and marine modes. The department also protected the marine environment by reducing the pollution of water from transportation sources; and, exercised environmental stewardship of its lands and activities.
Our new Corporate Governance Structure enhances our decision-making and accountability. We support and value our employees through our commitment to Public Service Renewal and best management practices.
I am proud of this department’s achievements on behalf of Canadians.
The original version was signed by
The Honourable Chuck Strahl, P.C., M.P.
Minister of Transport, Infrastructure and Communities
Section I – Departmental Overview
1.1 Summary Information
1.1.1 Raison d’�tre
Transport Canada is responsible for the Government of Canada’s transportation policies and programs. The Canada Transportation Act requires that the department monitor the ongoing health of the national transportation system. As such, while not directly responsible for all aspects or modes of transportation, Transport Canada plays a leadership role in ensuring that all parts of the transportation system work together effectively.
Our Vision: A transportation system in Canada that is recognized worldwide as safe and secure, efficient and environmentally responsible.
The department’s vision of a sustainable transportation system is one that integrates and balances social, economic and environmental objectives. This vision is guided by the following principles:
- highest possible safety and security of life and property – guided by performance-based standards and regulations when necessary;
- efficient movement of people and goods to support economic prosperity and a sustainable quality of life – based on competitive markets and targeted use of regulation and government funding; and
- respect for the environmental legacy of future generations of Canadians – guided by environmental assessment and planning processes in transportation decisions and selective use of regulation and government funding.
1.1.2 Responsibilities
Transport Canada employs 5,416 people at its headquarters and in five regional offices across the country and is part of the Transport, Infrastructure and Communities portfolio. Under this portfolio (Figure 1 below), the Minister of Transport, Infrastructure and Communities heads a complex organizational structure that includes Transport Canada, Infrastructure Canada, three agencies operating at arm’s length from the department, 16 Crown corporations (e.g. VIA Rail, Marine Atlantic Inc.) and over 40 shared-governance organizations (e.g. Port of Montreal, Vancouver International Airport). The Minister is responsible for administering over 60 statutes.
This portfolio brings together key organizations, policies and programs to provide an integrated focus on issues affecting Canada’s transportation system and public infrastructure, including the following:
- Strong national policies to improve Canada’s economy, the environment, safety and security;
- Legislation and smart regulations to protect the public interest;
- Targeted and efficient programs in support of national objectives and results;
- National leadership through extensive networks and partnerships with governments, experts and stakeholders; and
- Knowledge, research and expertise to deliver innovative approaches.
Figure 1
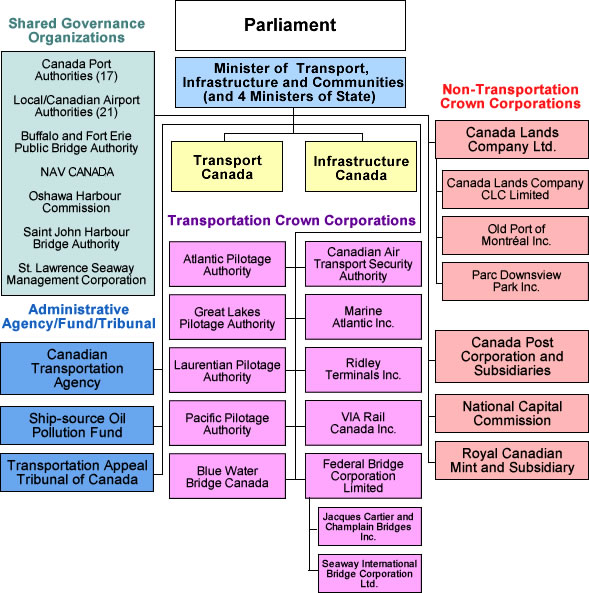
View the text version of the portfolio overview.
1.2 Departmental Performance
The following provides key progress made in fiscal year 2009-2010 with respect to Accomplishments, Program Activity Architecture (PAA), Performance Measurement Framework, and Corporate Integrated Business Plan.
Key 2009-2010 Accomplishments
To support Canada’s Economic Action Plan (EAP), the department employed a focused two-pronged strategy of swift implementation and strong due diligence. Specific steps were taken to ensure that the EAP remained a high priority in the department and that there were no administrative bottlenecks to slow its implementation. As a result, all of the one-year initiatives that received funding for 2009-2010 were completed on time and on budget, and the EAP was delivered with top-quality oversight. Internal audits and assessments of the management controls were also undertaken. The audit findings confirm that the department is indeed well-positioned to continue implementation of the EAP in 2010-2011.
Transport Canada worked with many partners to develop and implement gateway strategies, invest in strategic infrastructure, as well as pursue partnerships in support of the innovation agenda. Progress has been made towards creating a more efficient, reliable and seamless transportation system in Canada. Several international air agreements were completed and steps were taken towards increasing foreign investment in Canadian air carriers. The department also continues to work in collaboration with territorial governments to identify the future transportation needs to support the growing demand in the North over the next 20 years.
Transport Canada also undertook a number of initiatives that contributed to Canada’s environmental objectives. To conserve the natural environment and contribute to a more sustainable transportation system, the department fostered the use of sustainable transportation approaches in communities across the country and encouraged improvements in fuel efficiency and in the reduction of air pollutants and greenhouse gas emissions from the movement of goods and people.
The department also contributed significantly to international dialogue on emissions standards and practices and worked to ensure that international standards within the marine and aviation sectors are considered domestically. Furthermore, the department partnered with industry to test and promote advanced vehicle technologies and contributed to the development of procedures and project agreements to govern environmental assessment and regulatory changes under the Canadian Environmental Assessment Act as an important contribution to the streamlining of federal major project regulatory approvals.
In June 2010, amendments to the Railway Safety Act were tabled in Parliament under Bill C-33, the Safer Railways Act. Nearly $5 million was invested in rail safety initiatives, such as hiring new inspectors to improve regulatory oversight, establishing a rail safety secretariat to improve communications and consultations, purchasing two new railway track assessment vehicles to monitor track safety and funding several research projects. The department also invested over $4 million in 57 grade crossing improvement projects across Canada. The federal review process for applications under the Navigable Waters Protection Program was streamlined through amendments to the Navigable Waters Protection Act (NWPA) and progress was made in advancing Safety Management Systems (SMS) in aviation and rail.
The attempted bombing of Northwest Airlines flight 253 on December 25th, 2009 and the 2010 Olympic and Paralympic Winter Games in Vancouver and Whistler again demonstrated the importance of maintaining and further enhancing the transportation sector’s capabilities to detect, prevent and respond to ongoing security threats. Transportation security is a priority for the department and in support of this, significant investments continue to be made. Most recently, Budget 2009 announced new funding of $355 million to the Canadian Air Transport Security Authority (CATSA) to strengthen and improve the efficiency of airport security screening operations and technology. Transport Canada continued to enhance the Air Cargo Security Program through the development of an enhanced regulatory regime, the assessment and introduction of new screening technology and the strengthening of the department’s relationship with the United States and key international partners.
Transport Canada has aligned its governance with its new PAA, resulting in improved strategic decision-making that also ensures inclusive and horizontal discussions and considerations of policy, programs, and regulatory and management issues.
Transport Canada’s portfolio governance was enhanced through improved coordination and management of the Minister’s portfolio, which now includes 16 Crown corporations, 3 agencies and 2 departments.
Program Activity Architecture (PAA)
The 2009-2010 Report on Plans and Priorities (RPP) detailed Transport Canada’s plans, priorities and expected results against the new Program Activity Architecture (2009-2010 PAA). The new PAA clearly reflects the department’s mandate and vision, and emphasizes the importance of the department’s security mandate as distinct from its safety mandate. The revised Strategic Outcomes and Program Activity Architecture (2009-2010 PAA descriptions) strengthen Transport Canada’s ability to allocate resources, monitor results and realign spending to the highest priority programs (see section 3.4 for PAA Crosswalk). In 2006-2007, the department had over 180 programs that were reduced to 150 in 2007-2008 and redesigned in 2009 to four Strategic Outcomes and 16 Program Activities.
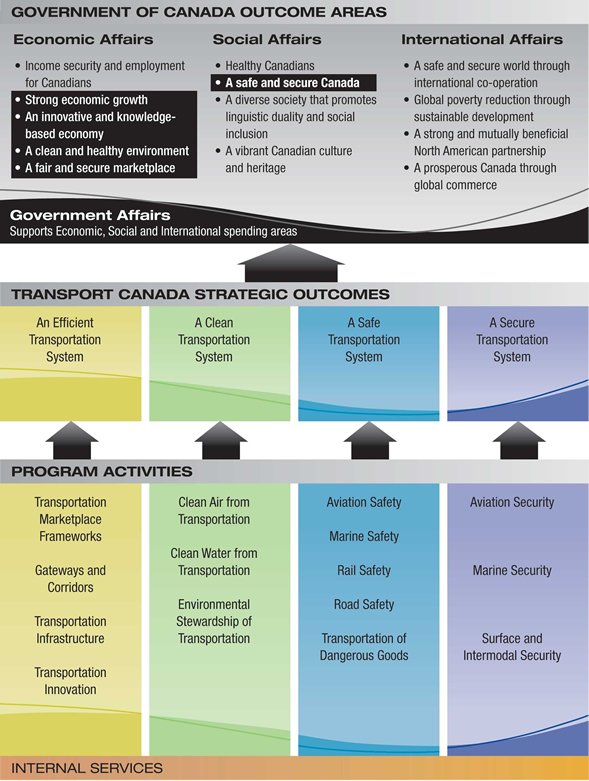
In addition, the new PAA structure to implement the Management, Resources, and Results Structure (MRRS) Policy contributes to the broader Government of Canada outcome areas of strong economic growth, a fair and secure marketplace, an innovative knowledge-based economy, a clean and healthy environment and a safe and secure Canada (Figure 2 below).
Figure 2
Performance Measurement Framework
Transport Canada’s Performance Measurement Framework is under review, including its performance indicators and targets. Preparatory work to review and elaborate the Performance Measurement Framework for all levels of Transport Canada’s PAA commenced in December 2009, through a series of workshops with all Strategic Outcome (SO) planners and many program managers.
Revisions made to the Performance Measurement Framework in February 2011 will be reflected in the 2012-2013 RPP, the goal of which is to have a stable performance measurement framework for the next few years. It is important to note that the 2012-2013 Departmental Performance Report will be the first report to assess performance based on the revised and improved indicators and targets.
Corporate Integrated Business Plan
Transport Canada’s Corporate Integrated Business Plan (IBP) is underway and expected to be completed in Fall 2010. The IBP will link components between Internal Services and Programs that will enable the department to improve program delivery, make adjustments where required in order to meet strategic results, and improve monitoring and reporting on progress.
1.3 Operational and Management Priorities
The 2009-2010 Report on Plans and Priorities (RPP) identified four operational priorities [1] and two management priorities [2]. Transport Canada made significant progress on these priorities, as detailed below.
| Type [3] | Ongoing |
|---|---|
| Status | Met annual commitment |
| Linkages to Strategic outcome and program activity/activities | SO1 An Efficient Transportation System PA 1.1 Transportation Marketplace Frameworks PA 1.2 Gateways and Corridors PA 1.3 Transportation Infrastructure |
2009-2010 Accomplishments
Transportation Infrastructure:
- Under the new streamlined federal approval process, a total of 19 projects worth close to $3.9 billion and over $1.2 billion in federal contributions were announced under the Building Canada Fund. As well, a total of 13 contribution agreements were signed.
- Transport Canada has launched the Northern Transportation Systems Assessment to determine what transportation infrastructure would be required to support the growing demand in the North over the next 20 years.
Gateways and Corridors:
- Significant progress was made on infrastructure investments and in deepening international partnerships under the Asia-Pacific Gateway and Corridor Initiative.
- Transport Canada continued to work with the provinces on developing and implementing the Continental and Atlantic Gateways Strategies.
- In 2009, Canadian and American environmental approvals were granted for the most important infrastructure project in the busiest trade corridor in North America, the new Detroit River International Crossing.
Transportation Marketplace Frameworks:
- Transport Canada signed the Canada-European Union Air Transport Agreement in December 2009.
- The Canada Transportation Act was amended to allow for increased foreign investment in the airline industry and regulations are currently being developed.
- Federal financing was provided to Air Canada as part of a private sector-led loan consortium.
Work in progress
- Discussions continue with the State of Michigan to determine the necessary agreements that will be required between the bi-national partners to ensure the fully coordinated implementation of the Windsor-Detroit crossing system.
- The regulatory amendment process for increased foreign investment in the air sector is underway. The new provisions will be brought into force once regulations are adopted. The Canada Transportation Act will continue to require Canadian majority control of Canadian air carriers.
- In collaboration with the governments of Yukon, the Northwest Territories and Nunavut, work is continuing on the Northern Transportation Systems Assessment.
| Type | Ongoing |
|---|---|
| Status | Met annual commitment |
| Linkages to Strategic outcome and program activity/activities | SO2 A Clean Transportation System PA 2.1 Clean Air Transportation |
2009-2010 Accomplishments
- Transport Canada supported Environment Canada in the development of light-duty motor vehicle emissions standards.
- For the rail sector, the department continued to work toward the development of emissions regulations to align with U.S. regulations.
- Canada acceded to Annex VI of the International Convention for the Prevention of Pollution from ships (MARPOL). The International Maritime Organization formally adopted the North American Emission Control Area proposal submitted by Canada, the United States and France. The Emission Control Area will come into force on August 1, 2012.
- Transport Canada supported international efforts in the aviation and marine sectors to develop approaches, standards and recommended practices for reducing greenhouse gas and air pollutant emissions through the International Civil Aviation Organization (ICAO) and the International Maritime Organization (IMO).
Work in progress
- Transport Canada intends to initiate consultations with key stakeholders toward the development of emissions regulations for the rail sector.
| Type | Ongoing |
|---|---|
| Status | Met annual commitment |
| Linkages to Strategic outcome and program activity/activities | SO3 A Safe Transportation System PA 3.1 Aviation Safety PA 3.2 Marine Safety PA 3.3 Rail Safety PA 3.4 Road Safety |
2009-2010 Accomplishments
- Amendments to the Railway Safety Act were tabled and new funding was obtained to increase oversight and enforcement capacity.
- Transport Canada continued to advance and promote SMS requiring operators to adopt a stronger, systemic safety culture and more accountability.
- The Navigable Waters Protection Act was amended to streamline the approval process, increase the provisions for inspection powers and enforcement, and better service the needs and expectations of Canadians.
Work in progress
- The reform of the regulatory structure of the Canada Shipping Act, 2001, is ongoing. The work to adjust the remaining regulations (approximately 40), which were a carry over from the old Canada Shipping Act, will be completed in the next 5 years.
- Canadian airports are at various phases in the implementation of aviation SMS with an expected completion date in 2012. Larger airports are in the fourth and final phase of implementation, while smaller airports are in the third of four phases of implementation.
- Implementation of aviation SMS for small certificate holders has been delayed to provide additional time to refine procedures, training and guidance material based on inspector and industry stakeholder feedback.
- A review of the full Motor Vehicle Safety Act to assess its efficiency and utility was postponed to allow other, more specific changes to the Act to occur.
- Work continues with stakeholders and jurisdictional partners to develop national strategic plans for 2015 for aviation, rail, road and transportation of dangerous goods, including performance measurement frameworks.
| Type | Ongoing |
|---|---|
| Status | Met annual commitment |
| Linkages to Strategic outcome and program activity/activities | SO4 A Secure Transportation System PA 4.1 Aviation Security |
2009-2010 Accomplishments
- Passenger and non-passenger screening was expanded and enhanced during the 2010 Olympic and Paralympic Winter Games and following the attempted bombing incident of Northwest Airlines flight 253 on Christmas Day 2009. As part of this expansion and enhancement, full-body scanning equipment was introduced.
- Air cargo security measures were introduced as part of a phased approach to set up a secure supply chain for air cargo, which is comprised of a complex network of thousands of businesses and organizations with various responsibilities for the movement and security of air cargo. This includes shippers or originators, freight forwarders and ultimately, air carriers. The new measures included providing requirements for the screening of Improvised Explosive Devices in air cargo and developing the groundwork for Secure Supply Chain regulations.
Work in progress
- Transport Canada will continue to enhance the security of the aviation system through ongoing programs, projects and initiatives such as the Air Cargo Security program, the CATSA Review and other aviation security programs. The department will continue to address areas of immediate concern and work proactively by anticipating issues likely to appear in the intermediate to long term. The effective screening of passengers has been and will remain a high priority, as will the development and application of technologies designed to mitigate certain threats and ensure the safety of the travelling public.
| Type [4] | New Commitment |
|---|---|
| Status | Met annual commitment |
| Linkages to Strategic outcome and program activity/activities | All Strategic Outcomes and Program Activities |
The Transport, Infrastructure and Communities portfolio is comprised of various entities, including Crown corporations, agencies and port and airport authorities (a portfolio overview is in section 1.1 of this document).
2009-2010 Accomplishments
- Transport Canada launched a study to reinforce its coordination of the Minister’s portfolio, which includes 16 Crown corporations, 3 agencies and 2 departments.
- Transport Canada undertook activities to support improved portfolio management, such as the preparation of letters of expectations to the Crown corporations, joint management meetings with Infrastructure Canada and the provision of some administrative services to the agencies.
- Transport Canada provided weekly reports to the Minister’s Office outlining current and upcoming term expiries and vacancies for Governor in Council and ministerial appointees.
- Transport Canada supported the strategic reviews for VIA Rail, CATSA and the National Capital Commission by ensuring there was consistency across the reviews and that the analysis was complete and comprehensive.
Work in progress
- Complete portfolio coordination study and implement recommendations by the end of the 2010-2011 fiscal year.
- Transport Canada will work with the Crown corporations to implement decisions relating to their strategic reviews. Strategic reviews are ongoing and reviews will be conducted for other parts of the portfolio.
| Type | New Commitment |
|---|---|
| Status | Met annual commitment |
| Linkages to Strategic outcome and program activity/activities | All Strategic Outcomes and Program Activities |
2009-2010 Accomplishments
- Transport Canada continued its strong support of the Clerk’s Public Service Renewal Action Plan. All commitments were met and some were exceeded (e.g. post-secondary recruitment exceeded the departmental target by engaging over 100 post-secondary graduates and exceeding employment equity targets).
- Transport Canada’s Integrated Human Resources Plan includes a People Management Strategy that contains medium- to long-term initiatives that span over more than one planning period. All of the initiatives proposed in the Plan address particular human and knowledge capital gaps/needs. Progress was made in 2009-2010 in addressing these gaps (e.g. growth in key occupational groups and in the EX community).
- A Workplace Identification Campaign was also completed to help the department more accurately reflect its workforce diversity profile. Given the above noted success, the Campaign results indicate that Transport Canada has sufficient representation in all four employment designated groups.
Work in progress
- As the Integrated Human Resources Plan and related People Management Strategy are multi-year commitments, initiatives related to Leadership Development and Succession Management, Recruitment and Staffing, Organizational Design and Competencies, Employee Performance Management, Learning and Development, and Wellness, Official Languages and Diversity are ongoing. In 2010-2011, there will be a particular focus on establishing Integrated Business Planning, on completing the Civil Aviation reorganization project, on establishing a knowledge management strategy by promoting existing tools and practices, on renewing the Employee Performance Management program, on supporting managers through managers’ communities and on implementing approved recruitment and development programs.
1.4 Resources
To support its mandate, Transport Canada was assigned the following resources:
| Planned Spending | Total Authorities | Actual Spending |
|---|---|---|
| 1,476 | 1,578 | 1,012 |
| Planned | Actual | Difference |
|---|---|---|
| 5,314 | 5,416 | (102) |
1.5 Financial Information
1.5.1 Expenditure Profile
Figure 1.5.1 shows Transport Canada’s expenditures (planned, authorized and actuals) from 2006-2007 to 2009-2010. The increase in actual spending, from $702 million in 2006-2007 to $1,012 million in 2009-2010, is mostly attributed to the addition of major initiatives within the department over the same period, such as the Asia-Pacific Gateway and Corridor Initiative and the Gateways and Border Crossings Fund. Although an upward trend can be observed over the past four years, actual spending decreased in 2009-2010, primarily due to the completion of the ecoauto Rebate Program.
Further details on the content of the Multi-Year Summary table below can be found in sections 1.5.2 (breakdown by Vote), section II (breakdown by Program Activity) and section III (breakdown of the Economic Action Plan).
1.5.2 Voted and Statutory Items
This table indicates the voted items approved by Parliament through the Main Estimates with its supply bills. The statutory items are displayed for information purposes only.
| Vote # or Statutory Item (S) [5] | Truncated Vote or Statutory Wording | 2007-2008 Actual Spending |
2008-2009 Actual Spending |
2009-2010 Main Estimates |
2009-2010 Actual Spending |
|---|---|---|---|---|---|
| Vote 1 | Operating expenditures | 304 | 357 | 331 | 399 |
| Vote 5 | Capital expenditures | 73 | 66 | 81 | 107 |
| Vote 10 | Grants and contributions | 316 | 443 | 861 | 303 |
| (S) | Contributions to employee benefit plans | 66 | 67 | 66 | 77 |
| (S) | Northumberland Strait Crossing subsidy payment under the Northumberland Strait Crossing Act | 55 | 56 | 58 | 57 |
| (S) | Payments in respect of St. Lawrence Seaway agreements under the Canada Marine Act | 19 | 44 | 48 | 65 |
| (S) | Payments to Canadian National Railway Company in respect of the termination of the collection of tools on the Victoria Bridge, Montreal and for rehabilitation work on the roadway portion of the Bridge | 3 | 3 | 3 | 3 |
| (S) | Spending proceeds from the disposal of surplus Crown assets | 0 | 3 | 0 | 0 |
| Total [6] Department | 836 | 1,040 | 1,448 | 1,012 | |
Total expenditures decreased by $28 million between 2008-2009 and 2009-2010. The main reasons include a decrease in spending on Grants and Contributions by $140 million, which is mostly due to the sunsetting of various programs such as the ecoauto Rebate Program ($120 million) and the Passenger Rail and Transit-Secure Program ($59 million), as well as reduced spending under the Airports Capital Assistance Program ($24.8 million). These decreases are offset by increases in spending in the Gateways and Border Crossings Fund ($32.7 million) and the Port Divestiture Fund ($23.4 million).
Other offsets include the following:
- An increase in operating expenditures of $42 million due to a decrease in offsetting vote-netted revenue of $16 million, mostly related to decreased airport authorities’ lease payments, and an increase in personnel costs as a result of an increase in the number of Full-Time Equivalents supporting the departmental mandate;
- An increase in capital expenditures of $41 million due to the acquisition of land for the new Detroit River International Crossing ($29 million), and increases in various other capital projects; and
- An increase in payments in respect of St. Lawrence Seaway agreements under the Canada Marine Act of $21 million due to lower than anticipated revenues as a result of a decline in traffic. The Government of Canada is obligated to cover any operating deficits for this entity.
Section II – Analysis of Program Activities by Strategic Outcome
2.1 Strategic Outcome: An Efficient Transportation System
In working with many partners, progress has been made towards a more efficient, reliable and seamless transportation system in Canada. Among the department’s many other accomplishments, in December 2009, the Canada-European Union (EU) Comprehensive Air Transport Agreement negotiated under the Blue Sky policy was signed, providing more flexibility for airlines to offer more convenient air services and lower fares for the benefit of Canadians. As well, most of the $2.12 billion in the Gateways and Border Crossings Fund has been committed in support of increased capacity (especially for Canada-U.S. border crossings, including the new crossing for Windsor-Detroit) and efficiency of gateway and corridor infrastructure and promotion of the use of Canada’s gateways and trade corridors to link North American markets with the rest of the world. Major transportation infrastructure and innovation projects were supported to enhance the modernization of the transportation system.
2.1.1 Program Activity: Transportation Marketplace Frameworks
The Transportation Marketplace Frameworks Program Activity encourages transportation efficiency by fostering a competitive and viable transportation sector. Program activities include setting the regimes governing the economic behavior of carriers in all modes of transportation; setting the rules of governance for all transportation infrastructure providers falling under the authority of Parliament; monitoring the transportation system; and representing the interests of Canada in international transportation fora and other international bodies. (Main Estimates)
| 2009-2010 Financial Resources ($ millions) |
2009-2010 Human Resources (FTEs) |
||||
|---|---|---|---|---|---|
| Planned Spending |
Total Authorities |
Actual Spending |
Planned | Actual | Difference |
| 9 | 11 | 11 | 66 | 63 | 3 |
| 2009-2010 Performance | ||
|---|---|---|
| Expected Results |
Performance Indicators |
Targets |
| A competitive and financially viable transportation sector through effective transportation marketplace frameworks | Number of founded Canadian Transportation Agency competitiveness complaints | By 2011, 5 percent reduction in the number of founded Canadian Transportation Agency competitiveness complaints |
| Performance Status and Summary | ||
|
In progress. This indicator speaks to disputes about transportation service, prices, terms and conditions of carriage handled by the Canadian Transportation Agency. Data for 2009-2010 is not available at this time. Based on information available for 2008-2009 and 2007-2008, there is a decrease of approximately 5 percent, which is in line with the 2011 target. |
||
Performance Analysis
Progress was made towards a competitive and financially viable transportation sector through effective transportation marketplace frameworks.
The Canada-European Union (EU) Comprehensive Air Transport Agreement negotiated under the Blue Sky policy was signed in December 2009. It provides more flexibility for airlines to offer more convenient air services and lower fares for the benefit of travellers, shippers, as well as the tourism and business sectors. In addition, bilateral air services agreements were concluded or expanded with Japan, South Korea, South Africa, Cuba, Morocco, Ethiopia, Tunisia, and El Salvador.
Legislative amendments were passed in the Budget Implementation Act, 2009, to allow for a change in foreign ownership limits for Canadian air carriers through regulations. The Canada Transportation Act will continue to require Canadian control of Canadian air carriers. The CTA is currently developing regulations, which are expected to be pre-published before the end of 2010.
Unplanned issues arising from the economic downturn that could potentially cause major disruptions in the air transportation sector to the detriment of the Canadian industry and travellers were addressed jointly with other federal departments. This included the provision of a loan on commercial terms to Air Canada to mitigate its financial difficulties. Air Canada has subsequently taken steps to repay the Crown.
Significant progress was achieved on the rail freight services review. In August 2008, a two-stage review of rail freight services was launched focusing on Canada’s rail-based logistics system, particularly services provided to Canadian shippers and customers. The first stage involved a comprehensive analysis of the nature and extent of problems facing Canada’s rail-based logistics chain. The second stage involved the appointment of the three-member independent panel, who will provide a final report and recommendations to the Minister by the end of 2010.
The Trilateral Working Group on shortsea shipping between Canada, the United States and Mexico, focused on facilitating the integration of the marine mode into the transportation systems of the three nations, and on identifying issues for their joint action. Transport Canada worked with other federal departments to address barriers to the growth of shortsea shipping in Canada.
Lessons Learned
Seeking and continuing effective stakeholder collaboration, outreach, consultation and partnerships is vital to the success, of establishing effective legislative and regulatory frameworks.
Benefits for Canadians
- Improvements in the overall transportation network through strategic legislative changes, international agreements, resolution of issues, innovation and transportation investments that have contributed to an accessible and reliable transportation sector that supports national and international trade and travel.
- Travellers and shippers now have more choice with respect to destinations, flights and routes, more direct services and the potential for lower fares.
2.1.2 Program Activity: Gateways and Corridors
Guided by the National Policy Framework for Strategic Gateways and Trade, the Gateways and Corridors Program Activity aims to support Canada’s international trade and international supply chains by creating more efficient, reliable and seamless trade-related transport systems in Canada. The program sets strategies and frameworks for improving and integrating transportation networks in key regions, fosters partnerships between all levels of government and the private sector, supports and oversees projects that contribute to the increased capacity and efficiency of gateway and corridor infrastructure, develops and puts in place measures that remove impediments to the effective development of Canada’s gateways and corridors and promotes the use of gateways and corridors. (Main Estimates)
| 2009-2010 Financial Resources ($ millions) |
2009-2010 Human Resources (FTEs) |
||||
|---|---|---|---|---|---|
| Planned Spending |
Total Authorities |
Actual Spending |
Planned | Actual | Difference |
| 658 | 621 | 156 | 51 | 85 | (34) |
| 2009-2010 Performance | ||
|---|---|---|
| Expected Results |
Performance Indicators |
Targets |
| An enhanced level of trade through Canada’s strategic gateway and trade corridors | Volume and value of trade | To be determined once baseline trade projection from Department of Foreign Affairs and International Trade or Trade Commission obtained |
| Performance Status and Summary | ||
|
In progress. In the context of the global economic slowdown, Canada’s relatively strong performance can be attributed, in part, to sound economic fundamentals that include improvements to trade-supporting infrastructure and enhanced policies and regulations resulting from the Gateways and Corridors Policy Framework. Although a baseline has not been set, between 2008-2009 and 2009-2010, the value of Canada's international trade contracted by 17.7 percent while the volume of total world trade declined by 23 percent from 2008 to 2009. Measuring the impact of gateway project investments on trade volumes and values is a long-term undertaking that can only be assessed when projects are completed and operational. |
||
Performance Analysis
The Gateways and Corridors Program Activity sets strategies and frameworks for improving and integrating transportation networks in key regions. This was accomplished by refining policy measures to improve the flow of goods between Canada and the rest of the world and enhancing infrastructure at key locations, such as at major border crossings between Canada and the United States, including the new Windsor-Detroit crossing. Activities related to the Asia-Pacific Gateway and Corridor Initiative, the Ontario-Quebec Continental Gateway and Trade Corridor, the Atlantic Gateway and the new Detroit River International Crossing project are all included under this program activity.
Most of the $2.12 billion in the Gateways and Border Crossings Fund has been committed. Significant projects have been announced in support of all three Gateway strategies, including projects to improve the Core National Highway System, major border crossings and key marine ports. These projects will improve the flow of goods and people within Canada and internationally. The federal approval process has been streamlined, which allows federal officials to accelerate the project assessment process. In 2009-2010, six new Gateways and Border Crossings Fund projects were announced, and federal officials negotiated the signature of 10 Contribution Agreements for Gateways and Border Crossings Fund infrastructure projects, with a value of over $358 million.
A series of in-depth analytical studies of the transportation system and economic research in partnership with provincial governments and other transportation stakeholders were funded under the Gateways and Border Crossings Fund. These studies will inform and guide the development of the Ontario-Quebec Continental Gateway and Trade Corridor and the Atlantic Gateway.
Under the Asia-Pacific Gateway and Corridor Initiative, the department has strengthened international partnerships with its Asian partners. This includes collaborative work with China through high-level engagement by ministers and senior officials, which resulted in the signing of a Memorandum of Understanding on Trade Logistics Cooperation and an Action Plan for Gateway Cooperation. In addition, international outreach activities were expanded and Transport Canada played a leading role in the establishment of the Asia-Pacific Economic Cooperation Port Services Network, a new international organization established to bring together senior representatives from Asia-Pacific Economic Cooperation economies and ports.
Several policy oriented non-infrastructure initiatives were also Asia-Pacific Gateway priorities and include the following:
- Gateway Performance Table, which focuses on establishing long-term efficiency and competitiveness of the Asia-Pacific Gateway. Participants met in 2009 to examine specific performance and efficiency issues and to develop recommendations for addressing them.
- APG Skills Table, which focuses on projects that respond to human resources and skills development pressures, in collaboration with Human Resources and Skills Development Canada. Three projects were approved for funding in 2009-2010.
- Value-added Gateway Project, initiated by Transport Canada, advanced through the involvement of other federal departments and the private sector.
- High-level engagement by ministers and senior officials on a number of fronts deepened international partnerships with priority countries under the Asia-Pacific Gateway and Corridor Initiative, particularly with China and Japan.
As of 2009-2010, all Asia-Pacific Gateway and Corridor Initiative infrastructure funding has been fully committed to 48 infrastructure projects totalling approximately $3 billion. In addition, six new contribution agreements were signed, four new projects entered the construction phase and five projects were completed.
The continuing work with partners in the United States, the State of Michigan and the Province of Ontario on the development of the new Windsor-Detroit bridge crossing advanced significantly with the approvals of the environmental assessments in both countries, which has enabled the partnership to proceed with project procurement and construction. To support project implementation, Transport Canada and the State of Michigan issued a Request for Proposals of Interest and received significant positive responses from the private sector expressing interest in participating in a public-private partnership arrangement. As well, an investment grade traffic and revenue forecast was undertaken that concluded there is sufficient traffic to support a new crossing as truck volumes are expected to triple and vehicle volumes to double over the next 30 years. Transport Canada also commenced property acquisition with willing sellers and concluded an agreement with the City of Windsor totalling $34 million that encompasses the majority of the properties needed for construction of the border inspection plaza and bridge.
Economic Action Plan
The Peace Bridge in Fort Erie, Canada’s third busiest commercial crossing with the United States, and the Blue Water Bridge in Sarnia both undertook plans to increase their safety and efficiency. These plans include the addition of new lanes, signage and improved lighting and electrical systems.
Lessons Learned
Implementing major infrastructure programs in partnership with other levels of government and the private sector highlights the value of regular communication with stakeholders and the importance of clear federal requirements with streamlined processes. Large and complex infrastructure programs and projects take time to develop, particularly as strategies evolve. This should be reflected in program/project expectations.
Benefits for Canadians
- In addition to improving the flow of goods between Canada and the rest of the world, gateway and corridor investments and policy measures helped to mitigate the effects of the economic downturn on Canada’s economy.
- Federal leadership on Gateways and Corridors has resulted in significant private-sector collaboration on transportation competitiveness issues and federal investments are supporting and leveraging large private-sector investments.
2.1.3 Program Activity: Transportation Infrastructure
The Transportation Infrastructure Program Activity oversees transportation infrastructure in Canada to improve efficiency and ensure service. It acts as the steward of certain commercial transportation assets operated by third parties on behalf of the federal government (airport authorities, port authorities, federal bridges, VIA Rail, St. Lawrence Seaway, Marine Atlantic Inc.), provides funding for Canada’s strategic transportation infrastructure, targeted to support federal objectives, supports essential services to some remote communities, manages legacy commitments and divests assets and contracts out operations, where needed. (Main Estimates)
| 2009-2010 Financial Resources ($ millions) |
2009-2010 Human Resources (FTEs) |
||||
|---|---|---|---|---|---|
| Planned Spending |
Total Authorities |
Actual Spending |
Planned | Actual | Difference |
| 48 | 79 | 46 | 304 | 300 | 4 |
| 2009-2010 Performance | ||
|---|---|---|
| Expected Results |
Performance Indicators |
Targets |
| Modern transportation system | Average age of transportation infrastructure |
Average age of highways and roads reduced by 0.5 years over 5 years |
| Value of road and highway assets | Value of gross capital stock increased by 2 percent over 5 years, by 2014 | |
| Performance Status and Summary | ||
|
Exceeded. From 2008-2009, the average age of transportation infrastructure decreased from 14.4 years to 13.9 years, a reduction of 0.5 years. The value of gross capital stock at the end of 2009 was $178.5 billion (2002 dollars), an increase of 2.6 percent from $173.9 billion in 2008 (2002 dollars). |
||
Performance Analysis
Significant progress was made to modernize the transportation system. The full effect of the individual infrastructure investments will be measured after projects have been completed.
Under the Building Canada Fund, Transport Canada’s strong partnerships, as well as the streamlining of the approval process, have allowed the department to make progress in each phase of the transportation infrastructure investment process: identification, assessment and management of projects.
To support major transportation projects across Canada, 13 contribution agreements were signed under the Building Canada Fund worth $471.5 million and two were signed under the Canada Strategic Infrastructure Fund worth $11.5 million. As well, approximately $400 million was spent in federal contributions across Canada: $92.2 million under the Building Canada Fund and $310.6 million under the Canada Strategic Infrastructure fund. These projects are administered by Transport Canada on behalf of Infrastructure Canada in accordance to existing Memoranda of Understanding between the two portfolio partners.
Major rehabilitation projects on federal bridges were either underway or received funding during the reporting period.
Transport Canada supported the Federal Bridge Corporation Limited’s corporate plan.
Transport Canada has continued to provide a grant to the British Columbia government for ferry services and also is supporting some ferry services in eastern Canada.
Transport Canada conducted program evaluations of the Ferry and Coastal Passenger and Freight Services Program, the Outaouais Road Agreement Contribution and the Regional and Remote Passenger Rail Services Class Contribution Program. Evaluations are posted on the Transport Canada website.
Economic Action Plan
Jacques Cartier and Champlain Bridges Inc. received $212 million over a 10-year period for the 48-year old Champlain Bridge in Montreal, which is the busiest bridge in Canada. The repair program consists of reinforcing and repairing pre-stressed beams and piers of the bridge and replacing expansion joints and roadway deck repairs, which will extend the life of this infrastructure asset. The bridge repairs planned for 2009-2010 were completed on time and resulted in expenditures of $12.9 million. It is expected that over the 10-year life of the project, 2,600 jobs will be created in the construction, engineering and site supervision fields.
VIA Rail received $407 million of EAP funding over a three-year period for a wide range of projects designed to modernize rail passenger services through improvements to passenger rail infrastructure, locomotives, passenger cars, stations and related facilities. The largest stimulus project, involving the construction of a third mainline track between Toronto and Brockville, initially encountered some delays but construction is now well under way. In addition, Budget 2009 also allocated to Transport Canada a total of $7.9 million in EAP funding for the Regional and Remote Passenger Rail Services Class Contribution Program to support new capital projects of two First Nations railways: Keewatin Railway in Manitoba and Tshiuetin Rail in Quebec and Labrador. Funding has allowed for the completion of rail line upgrades, the construction of a passenger waiting station, and the procurement of passenger car and track maintenance equipment, among other projects.
Lessons Learned
Effective and regular communication with proponents, stakeholders and other federal partners is essential in advancing projects that support the country’s transportation infrastructure.
Benefits for Canadians
- Immediate investments under Canada’s Economic Action Plan, the Building Canada Fund and other infrastructure programs helped to stimulate the economy by creating jobs in the short term and to modernize transportation infrastructure in the long term.
- The public will have access to a more efficient transportation system, including new and refurbished roads and bridges, as well as transit, rail and ferry facilities and equipment.
2.1.4 Program Activity: Transportation Innovation
The Transportation Innovation Program Activity helps to make the Canadian transportation system more competitive by identifying opportunities, entering into research partnerships and developing and implementing forward-looking solutions to the challenges facing the Canadian transportation system. The program sets policy and strategic direction for research and development (R&D); develops, designs, negotiates and manages research programs for breakthrough technologies, including Intelligent Transportation Systems; advances the development and dissemination of scientific knowledge and the application of technology; partners and collaborates with other federal departments, the provinces and territories, the academic community and many other national and international stakeholders here and abroad; and supports skills development for a highly qualified transportation workforce. (Main Estimates)
| 2009-2010 Financial Resources ($ millions) |
2009-2010 Human Resources (FTEs) |
||||
|---|---|---|---|---|---|
| Planned Spending |
Total Authorities |
Actual Spending |
Planned | Actual | Difference |
| 10 | 14 | 7 | 45 | 7 | 38 |
| 2009-2010 Performance | ||
|---|---|---|
| Expected Results |
Performance Indicators |
Targets |
| An innovative transportation system | Number of partnership projects with external stakeholders stimulating innovation – Intelligent Transportation Systems projects | Number to be set according to annual plan |
| Number of partnership projects with external stakeholders stimulating innovation – Research & Development projects | Number to be set according to annual plan |
|
| Performance Status and Summary | ||
|
In Progress. Thirty-two Intelligent Transportation Systems (ITS) projects involving external partners were initiated, are ongoing or were completed in 2009-2010. This compares with 47 projects in 2008-2009. The variance reflects Transport Canada’s capacity and the willingness of external partners to engage in partnership arrangements. A total of 64 R&D projects with external partners were funded in 2009-2010, 39 percent more than in 2008-2009. |
||
Performance Analysis
During 2009-2010, Transport Canada continued to build its capacity and knowledge of mechanisms to improve transportation innovation. The department took action, in conjunction with the provinces, territories and other domestic and international stakeholders, to support innovation in pursuit of a more efficient, clean, safe and secure transportation system.
To focus the department’s efforts, a new set of R&D priorities were developed to reflect government-wide strategic priorities and to support transportation sector innovation in key areas of national interest. Transport Canada’s revised R&D priorities include innovative transportation, sustainable transportation, adaptation to cold and changing climates and accessibility and changing demographics. For example, the department conducted research on advanced technologies for supply chain management, including testing of container tracking and monitoring technologies for the efficient competitive and secure movement of goods along major trade routes. Such R&D projects support the Government of Canada’s broader priorities under the Economic Action Plan and the Global Commerce Strategy by investing in an innovative economy and encouraging practical applications of technology and research excellence.
During 2009-2010, the department invested in new transportation R&D projects to enhance the sector’s ability to demonstrate and deploy new, innovative technologies. Support included investments of $4.6 million in research projects that leveraged an additional $15.4 million from external sources.
The department continued its support for R&D aimed at improving the safety of the transportation system and preserving environmental quality. For example, through its active role on the Railway Research Advisory Board, R&D projects were initiated to address rail safety issues, such as improving safety at grade crossings. (Additional examples)
Highly skilled individuals are the ultimate source of technological innovation and are vital for improving Canada’s transportation system. To support skills development and capacity building, the department actively engaged networks of academics and practitioners of advanced science and research to address climate challenges to Canada’s northern transportation infrastructure. Transport Canada also worked actively to encourage the capacity of Canadian universities to undertake rail-related safety research.
Utilizing information and communication technologies through Intelligent Transportation Systems (ITS) continues to show great promise for addressing transportation issues of concern to Canadians. Transport Canada moved forward on updating the national ITS Architecture for Canada and developing supporting tools. In addition, two Memoranda of Collaboration on ITS, were signed with the U.S. Department of Transportation for collaborating on joint projects, discussing ITS policy and sharing best practices.
As a trading nation, Canada must work with international partners to improve global transportation networks. In May 2009, Canada played a leadership role when it assumed the Presidency of the 2010 International Transport Forum. In this global platform, the Minister of State for Transport and other government representatives joined leaders from business and the research sector to examine transportation topics through an innovation lens. Canada strengthened its international partnerships for the exchange of ideas and best practices on global supply chains, sustainable transportation and urban mobility.
Lessons Learned
Stimulating innovation in Canada’s transportation system will require a sustained effort by many stakeholders. Transport Canada must continue to build its capacity and continue to act to improve innovation outcomes with the tools at its disposal.
Benefits for Canadians
- Improved transportation safety, preserving environmental quality and making trade corridors more secure and efficient through the use of Intelligent Transportation Systems.
- Citizens have access to better information while travelling that improves the safety and efficiency of their trip.
2.2 Strategic Outcome: A Clean Transportation System
The transportation sector is the second largest source of greenhouse gas emissions in Canada, constituting 27 percent of total emissions in 2007; this source is growing rapidly. As for air pollutant emissions from the sector, emissions have fallen significantly since 1990, primarily as a result of vehicle and fuel regulations. However, more action is required to ensure this trend continues and maintains alignment with evolving international and U.S. air pollutant emissions standards.
Working towards a cleaner and healthier environment, Transport Canada encouraged improvements in fuel efficiency, as well as a reduction in air pollutants and greenhouse gas emissions from the movement of goods and people. Among many other accomplishments, Transport Canada continued to support Environment Canada in the development of a common North American light-duty motor vehicle fuel efficiency standard. As well, Canada ratified four international conventions regarding the prevention of pollution from ships. The department also conducted 816 environmental assessments as required by the Canadian Environmental Assessment Act and territorial land claim agreements, identified measures to prevent, minimize, or manage adverse environmental effects of such projects and conducted 73 strategic environmental assessments.
2.2.1 Program Activity: Clean Air from Transportation
Transport Canada’s Clean Air from Transportation Program Activity advances the federal government’s clean air agenda in the transportation sector and complements other federal programs designed to reduce air emissions for the health of Canadians and the environment for generations to come. The program regulates air emissions from the transportation sector, oversees
Transport Canada’s clean air program obligations and commitments, demonstrates and promotes clean transportation technologies, promotes environmentally responsible best practices and behaviours and builds stakeholder knowledge and capacity to reduce air emissions. (Main Estimates)
| 2009-2010 Financial Resources ($ millions) |
2009-2010 Human Resources (FTEs) |
||||
|---|---|---|---|---|---|
| Planned Spending |
Total Authorities |
Actual Spending |
Planned | Actual | Difference |
| 34 | 29 | 19 | 98 | 94 | 4 |
| 2009-2010 Performance | ||
|---|---|---|
| Expected Results |
Performance Indicators |
Targets |
| A transportation system that is less intensive in its emissions of greenhouse gases and air pollutants |
Level of intensity of emissions from freight and passenger transportation, as measured in tonnes of CO2 equivalent:
|
An intensity improvement that is consistent with targets established under the government’s horizontal approach for clean air |
| Performance Status and Summary | ||
|
In progress. Data for 2009-2010 is not available at this time. Based on the most recent available data (2007), emission intensity in the passenger sector declined (139g of CO2e/passenger-km (2007), which can be attributed to increases in energy efficiency in all passenger modes. No data was available for emission intensity levels per passenger trip. Within the freight sector, an increase in emission intensity (87g of CO2e/tonne-km (2007) was noted. |
||
Performance Analysis
Transport Canada continued to support Environment Canada in the development of a common North American light-duty motor vehicle fuel efficiency standard. On April 1, 2009, responsibility for the development of these standards was transferred to Environment Canada from Transport Canada.
Work also continued on proposed locomotive emissions regulations under the Railway Safety Act that will be aligned with U.S. regulations. This work will serve as a basis for preliminary consultations with key stakeholders in 2010-2011.
Transport Canada was a key contributor toward the adoption of the Programme of Action by the International Civil Aviation Organization, which was a significant milestone achieved in addressing emissions from international aviation. The Programme of Action, which is the culmination of years of work to bring countries together in a common decision, set a global fuel efficiency improvement goal of 2 percent per year to 2020.
With respect to international shipping, Transport Canada continued to be actively engaged with the IMO in developing standards and recommended best practices for reducing greenhouse gas emissions and air pollutants caused by ships. The development of an Energy Efficiency Design Index for new ships and the mandatory requirement of a Shipboard Energy Efficiency Management Plan for all ships was ongoing.
In March 2009, Canada and the United States, with support from France on behalf of St-Pierre and Miquelon, submitted a joint proposal to the IMO for an Emission Control Area on the east and west coasts of both countries to set new emission standards that will require vessels to use low sulphur fuels or emission control technology by 2015.
On March 26, 2010, Canada acceded to Annex VI of the International Convention for the Prevention of Pollution from Ships (MARPOL Annex VI). It will set new limits and operational requirements for the prevention of harmful emissions of vessel's exhaust and cargo vapours. The IMO also adopted the North American Emission Control Area, which will limit the sulphur in fuel used onboard vessels operating within 200 miles of the coastal areas of Canada and the United States. Transport Canada has started to develop proposed amendments to the Regulations for the Prevention of Pollution from Ships and for Dangerous Chemicals under the Canada Shipping Act, 2001. These proposed amendments will implement the Canadian portion of the North American Emission Control Area, as well as the revisions to MARPOL Annex VI, by 2012.
Transport Canada has also initiated dialogue with U.S. agencies and the Canadian shipping industry to discuss the development of emission control regulations for ships serving domestic trade within Canada and the United States.
At the domestic level [7], Transport Canada supported the ongoing implementation of the Memorandum of Understanding with the Railway Association of Canada and the Memorandum of Understanding with the Air Transport Association of Canada to reduce emissions in the rail and aviation sectors, respectively. Natural Resources Canada is the lead department with regard to the Memorandum of Understanding between the Government of Canada and the Canadian Automotive Industry Respecting Automobile Greenhouse Gas Emissions.
Transport Canada continued to implement the ecotransport Strategy Programs, which are designed to reduce financial and information barriers to the adoption of clean technologies and best practices that can address the challenges of pollution and greenhouse gas emissions from the movement of goods and people in Canada. The ecotransport Strategy includes the ecomobility Program, the ecofreight Programs and the ecotechnology for Vehicles Program.
Transport Canada conducted a program evaluation of the Urban Transportation Showcase Program (completed in 2009). Evaluations are posted on the Transport Canada website.
Lessons Learned
The North American transportation industry is very integrated. When developing regulations, it is important to consider alignment with Canada’s major trading partners, including the United States, and with international organizations, such as the ICAO and the IMO.
Gathering meaningful data and improving analytical capacity and performance measurement continues to be a challenge. The department will continue to work with stakeholders, including federal, provincial and territorial partners, to improve knowledge-based analysis.
Benefits for Canadians
- The Clean Air from Transportation Program Activity contributed to domestic and international environmental objectives by developing and implementing policies and programs that continued to protect the natural environment and contributed toward a more sustainable transportation system in Canada. For example, work towards domestic regulations to implement the 2008 revisions to MARPOL Annex VI and the Emission Control Area are expected to help reduce air pollution, smog and acid rain, and benefit human health in coastal areas and further inland.
- The ecotransport Strategy Programs have leveraged a $49-million investment in the freight industry for the purchase of over 3,000 items of equipment involving fuel-saving technologies across all modes, leveraged a $9-million investment in green urban transportation practices, helped establish new codes, standards and testing protocols for emerging vehicle technologies and demonstrated the potential of new technologies to lower emissions at ports and airports.
2.2.2 Program Activity: Clean Water from Transportation
Guided by the Canada Shipping Act, 2001, the Arctic Waters Pollution Prevention Act, the Marine Liability Act and
international conventions, the Clean Water from Transportation Program Activity helps to protect the marine environment and the health of Canadians by reducing the pollution of water from transportation sources. The program regulates and monitors the effect of discharges from marine vessels into the marine environment, regulates ballast water and contributes to setting domestic and
international rules that govern limits to liability of marine pollution incidents. (Main Estimates)
| 2009-2010 Financial Resources ($ millions) |
2009-2010 Human Resources (FTEs) |
||||
|---|---|---|---|---|---|
| Planned Spending |
Total Authorities |
Actual Spending |
Planned | Actual | Difference |
| 6 | 9 | 10 | 15 | 14 | 1 |
| 2009-2010 Performance | ||
|---|---|---|
| Expected Results |
Performance Indicators |
Targets |
| Canadian waters protected from discharges of transportation pollutants |
Number of ship-source pollution incidents and number of mystery spills detected per year |
2 percent reduction in ship-source pollution spills annually from the previous year, from the 2003-2004 baseline |
| Transfer of alien aquatic species into domestic water through ship ballast water prevented | Percentage of ships in compliance with reporting rules for ballast water |
95 percent compliance by 2015 – subject to revision once baseline is established |
| Performance Status and Summary | ||
|
In Progress. With the coming into service of new detection technologies, the National Aerial Surveillance Program resulted in a 1.5 percent increase in spills detected. Transport Canada can now detect smaller spills, which previously went undetected. The new detection technologies in place on Transport Canada aircraft will allow for a more detailed examination of suspected spills and lead to a full assessment of the progress made to protect Canadian waters. With increased abilities to detect ship-source pollution spills, comes the need to re-examine current program performance criteria and to take advantage of lessons learned as a result of the U.S. gulf pollution incident. Mostly Met. With respect to the percentage of ships in compliance with reporting rules for ballast water, there is 100 percent compliance in the Great Lakes and St. Lawrence Seaway System and approximately 90 percent in coastal areas. It should be noted that due to the expected coming into force of the Ballast Water Convention, Transport Canada will undertake a review of this performance indicator. |
||
Performance Analysis
Transport Canada activities under the Clean Water from Transportation Program Activity responded to the need for regulation and monitoring of discharges from marine vessels and their effect on the environment.
Canada ratified four international conventions regarding the prevention of pollution from ships. These are the International Convention for the Prevention of Pollution from Ships (MARPOL) Annex IV (sewage) MARPOL, Annex V (prevention of pollution by garbage), International Convention on the Establishment of an International Fund for Compensation for Oil Pollution Damage and International Convention on Civil Liability for Bunker Oil Pollution Damage.
The department also worked towards the ratification of four additional conventions, which are the 2004 International Convention for the Control and Management of Ships’ Ballast Water and Sediments the 2001 International Convention on the Control of Harmful Anti-fouling Systems on Ships the 1988 Protocol to the Convention for the Safety of Life at Sea (tanker safety-pollution prevention) and the 2007 Nairobi International Convention on the Removal of Wrecks.
Transport Canada was actively involved in international fora leading to the revision of the International Convention on Liability and Compensation for Damage in Connection with the Carriage of Hazardous and Noxious Substances by Sea at the IMO, which led to the adoption of the 2010 Protocol to the International Convention on Liability and Compensation for Damage in Connection with the Carriage of Hazardous and Noxious Substances by Sea.
Transport Canada participated in the negotiations that finalized the 2009 Hong Kong International Convention on the Safe and Environmentally Sound Recycling of Ships.
The department advanced improvements to the marine legislative framework as follows:
- On August 1, 2009, amendments to the Arctic Waters Pollution Prevention Act came into force and extended Canada’s jurisdiction to apply its pollution prevention regulations in Arctic waters from 100 nautical miles to 200 nautical miles offshore. The Northern Canada Vessel Traffic Services Zone Regulations were also advanced, bringing mandatory vessel traffic reporting into effect in Canada’s North as of July 1, 2010.
- Amendments to the Marine Liability Act, which received Royal Assent on June 23, 2009, enhanced various aspects of the liability and compensation regimes for maritime transport incidents and clarified rules governing liability of owners and operators.
New instrumentation provided enhanced detection capability under the National Aerial Surveillance Program and has resulted in an increase in spills detected. Furthermore, the addition of a third fixed wing aircraft to Transport Canada’s fleet enabled more effective enforcement of Canada’s domestic pollution legislation. Transport Canada also relies on the public, who reported 21 ship-source spills, some of which are being pursued through the Public Prosecution Service of Canada.
The department continued to regulate and monitor Canada’s Marine Oil Pollution Preparedness and Response regime. This included consultations with industry on the proposed Environmental Response Regulations and Standards and a region-specific Assessment of Proposals Related to Oil Spill Risk for the south coast of Newfoundland.
Transport Canada initiated the development of Ballast Water Control and Management Regulations to prevent invasive species from ships’ ballast water and continued to cooperate with the U.S. Coast Guard and Seaway authorities to inspect all vessels entering the Great Lakes and St. Lawrence Seaway System to ensure compliance. With several U.S. states acting to regulate ballast water, Transport Canada is working with U.S. federal and state agencies to develop compatible rules to control pollution and ballast water from ships operating in the Great Lakes and St. Lawrence Seaway System.
Efforts are also continuing to improve how data is collected and updated to meet national and international reporting requirements.
Lessons Learned
The ability to measure program performance is critical. The Clean Water from Transportation Program’s indicators and targets will be refined.
Benefits for Canadians
The suite of new conventions and improvements in the marine legislative and regulatory framework, combined with Program enhancements, all contribute to the protection of the marine environment and the health of Canadians.
2.2.3 Program Activity: Environmental Stewardship of Transportation
The Environmental Stewardship Program Activity fulfills Transport Canada’s responsibilities in working towards a cleaner and healthier environment for Canadians with regard to its own operations. These responsibilities include developing a departmental Sustainable Development Strategy, managing contaminated sites, fulfilling environmental responsibilities at Transport Canada
owned or operated ports and airports and encouraging environmentally friendly alternatives in Transport Canada’s operations (internal). The program develops and implements policies and programs for Transport Canada’s activities that advance environmental objectives and promote sustainable transportation, provides functional support for environmental assessments, including
major resource projects and promotes compliance with environmental laws, federal government policies and best practices in Transport Canada’s stewardship activities [8]. (Main Estimates)
| 2009-2010 Financial Resources ($ millions) |
2009-2010 Human Resources (FTEs) |
||||
|---|---|---|---|---|---|
| Planned Spending |
Total Authorities |
Actual Spending |
Planned | Actual | Difference |
| 44 | 55 | 38 | 66 | 74 | (8) |
| 2009-2010 Performance | ||
|---|---|---|
| Expected Results |
Performance Indicators |
Targets |
| Transport Canada is aware of and responsive to environmental effects of its activities | Percentage level of compliance with applicable laws, regulations and guidelines | 100 percent compliance with applicable laws, regulations and guidelines |
| Performance Status and Summary | ||
|
Met All. Throughout 2009-2010, Transport Canada was in compliance with applicable environmental legislation, regulations and guidelines and did not receive any contravention notices. |
||
Performance Analysis
Transport Canada continued to fulfill its responsibilities in working towards a cleaner and healthier environment through its environmental stewardship activities.
Transport Canada used its Environmental Management System to ensure environmental stewardship of its operations and lands. Working in collaboration with domestic and international partners, the department promoted the use of environmental best practices in this regard. Transport Canada did not receive any contravention notices. The Environmental Management System contributed to improving the management of Transport Canada operations and lands through targets related to air emissions, land management, non-hazardous waste management, hazardous materials management, drinking water, environmental emergency response, green procurement and wastewater. Transport Canada achieved 100 percent of these targets.
Transport Canada managed contaminated sites in accordance with its departmental Contaminated Sites Management Plan, including the Federal Contaminated Sites Action Plan and the accelerated projects under the Canada Economic Action Plan. In total, Transport Canada undertook 65 assessment projects and 63 remediation projects, which included 33 accelerated assessment projects and 10 accelerated remediation projects.
With respect to environmental assessments, Transport Canada conducted 816 project environmental assessments as required by the Canadian Environmental Assessment Act and territorial land claim agreements, identified measures to prevent, minimize or manage adverse environmental effects of such projects and conducted 73 strategic environmental assessments, including two detailed analyses to identify any potential environmental effects of proposed policies, plans, and programs.
Transport Canada also implemented the Major Projects Management Office principles to improve and streamline the federal regulatory review process for major projects. Transport Canada contributed to the whole-of-government approach and to the development of procedures, guidance and project agreements to govern the environmental assessment and regulatory review of 53 major resource projects (such as mining, oil and gas, pipelines, hydro dams, and nuclear facilities) being coordinated through the Major Projects Management Office. Major Projects Management Office principles were applied to major transportation projects to streamline the regulatory review process while continuing to protect the environment. Transport Canada collaborated with other departments and agencies to contribute to ongoing regulatory improvement initiatives, including regulatory changes under the Canadian Environmental Assessment Act and legislative amendments to the Navigable Waters Protection Act.
Transport Canada concluded the implementation of its departmental 2007-2009 Sustainable Development Strategy [9], which included actions under seven strategic challenge areas focused on urban transportation, commercial freight transportation and marine transportation.
Economic Action Plan
Budget 2009 expanded the Federal Contaminated Sites Action Plan to address contaminated sites where remediation could be accelerated. In 2009-2010, Transport Canada undertook 43 projects worth $12.3 million. For example, work began at the Oshawa Harbour, Fort Nelson Airport, Watson Lake Airport, Edmonton International Airport. This work will continue in 2010-2011.
Lessons Learned
Transport Canada’s Environmental Management System is an effective tool for departmental compliance with environmental legislation. Stronger communication and awareness of the Environmental Management System could increase its effectiveness. A National Environmental Management System Strategy is being developed to further enhance the system’s overall performance.
Consistent efforts within the department and with other departments and agencies have enabled Transport Canada to make a significant contribution to the Major Projects Management Office initiative to deliver federal regulatory approvals in a more efficient manner.
Benefits for Canadians
- Transport Canada conducted its operations and activities in an environmentally sound manner in support of a cleaner environment for Canadians.
- Transport Canada cleaned up federal contaminated sites and reduced exposure of Canadians to potentially harmful environmental contaminants. As well, through activities linked to the remediation of contaminated sites in affected communities (such as in the North), Transport Canada was able to provide economic and employment opportunities for Canadians.
- A whole-of-government project management approach to federal major project reviews supported economic development for Canadians, while ensuring that environmental effects were considered.
2.3 Strategic Outcome: A Safe Transportation System
Throughout 2009-2010, Transport Canada continued to work with industry and stakeholders to improve the safety of the Canadian transportation system through the development and implementation of safety programs, standards, policies and regulations in the marine, rail and air modes, as well as for the safety of motor vehicles and the transportation of dangerous goods.
Despite evident successes in improving safety across the modes, challenges remain. While Safety Management Systems continued to be adopted by industry, internal implementation of the program has highlighted imperfections that are now being addressed. The continuing growth in the size and complexity of the transportation sector necessitates the need to reduce accident rates. Internal processes and planning capabilities, delays encountered in obtaining approvals for capital projects, and contracting and hiring staff also posed challenges.
Despite these challenges, significant progress was made towards expected results.
2.3.1 Program Activity: Aviation Safety
The Aviation Safety Program Activity develops, administers and oversees the policies, regulations and standards necessary for the safe conduct of civil aviation within Canada’s borders in a manner harmonized with the international aviation community. (Main Estimates)
| 2009-2010 Financial Resources ($ millions) |
2009-2010 Human Resources (FTEs) |
||||
|---|---|---|---|---|---|
| Planned Spending |
Total Authorities |
Actual Spending |
Planned | Actual | Difference |
| 241 | 247 | 231 | 1,876 | 1,783 | 93 |
| 2009-2010 Performance | ||
|---|---|---|
| Expected Results |
Performance Indicators |
Targets |
| A safe civil aviation system | Five-year average: number of accidents per 100,000 hours of flight and by type of operation | By 2010, maintain 2002/2007 average: Canadian Aviation Regulations (CAR 705) Airline 0.28*; (CAR 704 ) Commuter 1.15*; (CAR 703 ) Air Taxi 5.47*; (CAR
702) Aerial Work 3.88*; (CAR 604) Private 1.31* |
| Number of accidents for training and recreational flights | By 2010, maintain accident numbers: (CAR 406) Flight Training 29.6*; Recreational Aviation 277.8* (2007 baseline) | |
| Public confidence in aviation safety | Percentage of Canadian public saying air travel is safe or very safe | By 2011, 90 percent of respondents say that air travel is safe or very safe |
| Performance Status and Summary | ||
|
Exceeded, exceeded and indicator under review given the lack of public opinion research conducted during the year. Five year average**: Exceeded targets In 2009, there were 230 aviation accidents in Canada, 2 percent fewer than in 2008. The 2009 aviation accident rate was 5.5 percent per 100,000 hours flown, which is below the 2004-2008 five-year average of 5.9 percent. The 2009 aviation accident rate of 5.5 percent decreased 14 percent when compared to the 2003-2007 five-year average of 6.36 percent. Training and recreational flights**: Exceeded targets In 2009, there were 151 accidents involving recreational aviation, a decrease of 3 percent when compared to the 2003-2007 five-year average. Despite the overall trend in accident rate decrease, there were 51 accidents involving CAR 406 (Flight Training) in 2009, which is an increase of 72 percent when compared to the 2003-2007 five-year average. In all Canadian Aviation Regulations sectors, there were a total of 259 accidents in 2009, a decrease of 7 percent when compared to the 2003-2007 five-year average. |
||
*refers to number of accidents by type of operation
**Source: Transport Canada, adapted from the Transportation Safety Board, preliminary data as of January 18, 2010, estimation of hours flown and Canadian Civil Aircraft Register.
Performance Analysis
The infrastructure supporting the Aviation Safety Management System (SMS) continues to be improved by developing and amending guidance material. Revisions build on lessons learned from inspector feedback and incorporate regional experience in surveillance procedures under the new oversight model. Development is underway for a new surveillance procedure-training program to ensure inspectors have the right tools to do their jobs.
In addition, the department has strengthened its implementation strategy based on input from the Office of the Auditor General. Implementation of SMS for small certificate holders has been delayed to provide additional time to refine procedures, training and guidance material based on inspector and industry stakeholder feedback. Concurrently, the department continues to gain from experience and has now completed SMS assessments on all large operators. Transport Canada’s SMS assessments have shown to be effective and, where necessary, have resulted in enforcement actions being taken.
Canada's role at the leading edge of Aviation Safety positions us as a key participant in the exchange of ideas and best practices internationally with partners such as the U.S. Federal Aviation Administration, the European Aviation Safety Authority and other ICAO member states.
The ability to implement Canada’s Aviation Safety program is supported by Aircraft Services. This service is critical for carrying out Transport Canada’s regional oversight activities.
From a regulatory perspective, the department has promoted greater consultation and improved broad awareness on safety. For example, the Civil Aviation Regulatory Advisory Committee (CARAC) consultation process was streamlined to provide increased efficiencies in its rule-making activities. As a result, a greater number of stakeholders can be reached at one time, permitting the department to address issues effectively. In addition, Aviation Safety participated in a paper reduction exercise that streamlined the regulatory process by changing to electronic submission, which resulted in a 20 percent reduction in paper use.
The proposed plan to amend the Aeronautics Act to incorporate a number of safety related provisions died on the Order Paper.
Transport Canada conducted an evaluation of ACAP and its grants and contributions to the ICAO for the Cooperative Development of Operational Safety and Continuing Airworthiness Program. Evaluations are posted on the Transport Canada website.
Further to the ACAP evaluation, work on the renewal of the program, which contributes to the safety of airport facilities for air carriers and the travelling public, was undertaken.
Lessons Learned
Initially, in its efforts to implement SMS, the department was unclear on the objectives that it was trying to achieve with external stakeholders in implementing a new oversight model. Efforts are ongoing to improve the department’s communication and education approaches via more open dialogue with its partners and stakeholders.
Internally, feedback from inspectors on the ongoing implementation of SMS highlighted the need for updated training in surveillance procedures, as well as clearer staff instructions that outline the procedures to be applied when carrying out oversight activities. New training is planned for 2010-2011.
Benefits for Canadians
- Operations and maintenance organizations covering 95 percent of the revenue-passenger miles flown in Canada are now subject to the SMS regulatory framework. Airports and air navigation service providers are in the process of implementing SMS in four phases. At this stage, no other civil aviation authority in the world has implemented SMS to the same extent. SMS are introduced to prevent incidents and promote safety at all levels. In the SMS culture, safety is an essential element to how a company operates.
- A healthy surveillance program maintains the high level of Operators’ compliance with regulations. It monitors flight crew and air traffic controllers in terms of aptitude and competencies, and certifies that aerodromes and aeronautical products are designed, manufactured, operated and maintained in accordance with the strictest safety standards.
2.3.2 Program Activity: Marine Safety
The Marine Safety Program Activity protects the life and health of Canadians by providing a safe and efficient marine transportation system. This program derives its authority from a number of Acts – the Canada Shipping Act, 2001, the
Navigable Waters Protection Act, the Safe Containers Act, the Pilotage Act, the Coasting Trade Act, and the Arctic Waters Pollution Prevention Act – to develop and enforce a marine safety regulatory framework for domestic and foreign vessels and pleasure craft, enforce international
conventions signed by Canada and protect public right to navigation on Canada’s waterways. (Main Estimates)
| 2009-2010 Financial Resources ($ millions) |
2009-2010 Human Resources (FTEs) |
||||
|---|---|---|---|---|---|
| Planned Spending |
Total Authorities |
Actual Spending |
Planned | Actual | Difference |
| 75 | 87 | 82 | 658 | 679 | (21) |
| 2009-2010 Performance | ||
|---|---|---|
| Expected Results |
Performance Indicators |
Targets |
| A safe marine transportation system |
Rates of accidents/fatalities |
By 2015, 5 percent reduction from 2008 levels |
| Public confidence in the marine transportation system | Percentage of Canadian public reporting confidence in the safety of the marine transportation system | By 2010 to 2015 (based on strategic plan), 90 percent of respondents say that marine safety is safe or very safe |
| Performance Status and Summary | ||
|
Exceeded and indicator under review given the lack of public opinion research conducted during the year. Reduction in rates of accidents/fatalities: Exceeded A steady decline in Canadian vessel accidents since 2003 contributed to the overall reduction of marine accidents in 2009. The decline in marine accidents in 2009 was noted across shipping accidents and accidents aboard ships, with the exception of an increase in groundings. There were 322 Canadian vessel accidents in 2009; a drop from the 377 accidents recorded in 2008. The 14 percent decline in the number of accidents in 2009 over the 2008 levels exceeded the 2009-2010 target of a 5 percent reduction. There were 15 marine fatalities in 2009, which represented a decrease from the 22 fatalities recorded in 2008. The 41 percent reduction exceeds the 5 percent target. |
||
Performance Analysis
In 2009-2010, Marine Safety continued to evolve to meet the new strategic directions for safe marine transportation. These included adopting SMS to better promote a safety culture in the marine industry. This represents a major cultural shift for both Marine Safety and the marine industry that affects all aspects of the marine sector.
Amendments made to the Navigable Waters Protection Act to streamline the approval process for major works received Royal Assent in March 2009 as part of the Budget Implementation Act. The Act now includes provisions for enforcement, a new continuing offence provision and new inspection powers. The results are more efficient and effective administrative, compliance monitoring and enforcement regimes to protect the right to safe public navigation.
Large vessels have been the focus of Marine Safety activity for many years, the benefits of which are represented in an increasingly favourable safety record. Small vessels (e.g. those up to 150 gross tonnage) made up 66 percent of vessels involved in shipping incidents in 2009 and 88 percent of vessels lost. Provisions of the new Canada Shipping Act, 2001, combined with the new Small Vessel Regulations, now give Marine Safety the opportunity to put more focus on small vessel safety.
The timeframes required to amend existing regulations under the repealed Canada Shipping Act, and to have them come in line with the new provisions of the Canada Shipping Act, 2001, have strained the department's legal services when it comes to the implementation of modern oversight initiatives in the marine mode of transportation.
Lessons Learned
SMS, a learning experience in all modes, has tested the Marine Safety Directorate. The Pacific Region pilot project has shown that implementing SMS requirements may challenge certain operators that do not have the necessary expertise to develop and implement a safety management system. During stakeholder consultations, participants cautioned that the mandatory implementation of a systems approach to safety for smaller operators could place a financial burden on these companies. The department will continue to work with industry and all stakeholders to resolve problems with the implementation of SMS.
Benefits for Canadians
- Implementation of SMS aims to reduce the loss of life, incidents and accidents, and pollution by integrating safety into the day-to-day operations of the marine industry.
- Ratification of 11 international maritime conventions enables Canada to fully enforce environmental and safety standards, and complements several government priorities, as well as support the pollution prevention efforts of the provinces, territories and municipalities. These conventions will, among other actions, reduce pollution from sewage and garbage, control air emissions from ships, limit the use of environmentally harmful paints, control ballast water to reduce the transfer of aquatic species into Canadian waters, ensure that sufficient compensation is available for pollution clean-up in the event of an oil spill and enhance certification standards for seafarers.
2.3.3 Program Activity: Rail Safety
Under the authority of the Railway Safety Act, the Rail Safety Program Activity develops, implements and promotes safety policy, regulations, standards and research. The program provides oversight of the rail industry, promotes public safety at crossings and identifies the risks of trespassing. It also provides funds to improve safety at grade crossings. (Main Estimates)
| 2009-2010 Financial Resources ($ millions) |
2009-2010 Human Resources (FTEs) |
||||
|---|---|---|---|---|---|
| Planned Spending |
Total Authorities |
Actual Spending |
Planned | Actual | Difference |
| 28 | 43 | 37 | 168 | 155 | 13 |
| 2009-2010 Performance | ||
|---|---|---|
| Expected Results |
Performance Indicators |
Targets |
| A safe rail transportation system | Number/rates of accidents and fatalities | 5 percent reduction in accident rates based on the five-year average, starting in 2009-2010 |
| Incident rates | 5 percent reduction in incident rates based on the five-year average, starting in 2009-2010 | |
| Level of public confidence | By 2011, 90 percent of respondents say that rail safety is safe or very safe | |
| Performance Status and Summary | ||
|
Exceeded, not met and indicator under review given the lack of public opinion research conducted during the year. Reduction in accident rates: Exceeded The number of train miles decreased considerably in 2009 due to the economic downturn. The accident rate dropped by 10.7 percent as compared to the five-year average (2004-2008). Reduction in incident rates: Not met Although the number of accidents and incidents dropped in 2009, the incident rate at 5.8 percent was still higher than expected as compared to the five-year average (2004-2008). |
||
Performance Analysis
Overall, Rail Safety performed very well in 2009-2010. Rail Safety continued to implement recommendations from the Railway Safety Act Review Advisory Panel and the Standing Committee on Transport, Infrastructure and Communities, particularly in the areas of SMS, the environment, consultations, and information management and technology/research. A Steering Committee comprised of Transport Canada, industry and unions, as well as six joint Transport Canada-industry union working groups developed action plans to implement the recommendations that concern Transport Canada and the rail industry.
On June 4, 2010, legislation to amend the Railway Safety Act was tabled in the House of Commons under Bill C-33, the Safer Railways Act. Seventeen of the Railway Safety Act Review Advisory Panel recommendations and three of the Standing Committee on Transport, Infrastructure and Communities recommendations that required amendments to the Railway Safety Act were part of the tabled legislation.
Transport Canada conducted evaluations of the Grade Crossing Improvement Program and its contributions in support of Operation Lifesaver. Evaluations are posted on the Transport Canada website.
Economic Action Plan
Over five years (2009-2010 to 2013-2014), Budget 2009 provided $39 million to implement important new safety initiatives and legislative amendments and $25 million to increase funding for the Grade Crossing Improvement Program. In 2009-2010, Rail Safety invested nearly $5 million in rail safety initiatives to increase oversight and enforcement capacity and nearly $4 million in grade crossing improvement projects across Canada. Rail Safety also developed a new Strategic Plan looking forward for the next 5 years.
Lessons Learned
While working with industry stakeholders to develop action plans to address the recommendations from the Railway Safety Act Review, it was determined that the SMS guidance material currently in use by the industry was less suited for the smaller short-line railways. During 2009-2010, Rail Safety worked with industry to develop tailored guidance material and tools for the short-line railways and plans to publish the information in Fall 2010.
Benefits for Canadians
- Operation Lifesaver, an education and awareness program sponsored by Transport Canada and its partners, aims to reduce the loss of life, injuries and damage caused by highway/railway crossing collisions and train/pedestrian incidents.
- The Grade Crossing Improvement Program contributes to safety improvements at railway crossings to reduce the risk of crossing collisions.
- Transport Canada Rail Safety Inspectors provide oversight of the rail industry so that legislation, regulations and rules are being enforced, rail crews are competently trained and able to handle emergencies, and rail equipment and infrastructure meet all applicable safety regulations.
2.3.4 Program Activity: Road Safety
Guided by the Motor Vehicle Safety Act and the Motor Vehicle Transport Act, the Road Safety Program Activity develops standards and regulations, provides oversight and engages in public outreach in order to reduce the number of deaths, injuries and social costs caused by motor vehicle use and aims to improve public confidence in the safety of Canada’s road transportation system. (Main Estimates)
The federal and provincial/territorial governments have complementary responsibilities for road safety. Federal responsibilities include defining the hours of service for extra-provincial motor carriers (busing and trucking companies), regulating standards for new vehicles (as well as new child restraints and new replacement tires), regulating the importation of vehicles, investigating complaints pertaining to vehicle defects, and regulating and monitoring vehicle recalls. Provincial responsibilities include establishing and enforcing rules of the road, registration and licensing of vehicles and drivers, and regulating after-market parts and services (not including new replacement tires and child restraints).
| 2009-2010 Financial Resources ($ millions) |
2009-2010 Human Resources (FTEs) |
||||
|---|---|---|---|---|---|
| Planned Spending |
Total Authorities |
Actual Spending |
Planned | Actual | Difference |
| 35 | 36 | 30 | 126 | 98 | 28 |
| 2009-2010 Performance | ||
|---|---|---|
| Expected Results |
Performance Indicators |
Targets |
| Safe roads |
Number/Rates of fatalities and serious injuries |
30 percent reduction based on baseline period (1996-2001) |
| Public confidence in the safety of the road system | Percentage of Canadians that express high confidence | 50 percent have high confidence |
| Performance Status and Summary | ||
|
In progress as monitoring period includes up to the end of 2010, and indicator under review given the lack of public opinion research conducted during the year. Reduction in number/rates of fatalities and serious injuries: In progress The final report on performance is not available as provincial/territorial data will not be provided before the end of 2010. That said, early indicators are that the number of fatalities and serious injuries continue on a downward trend. The number of serious road injuries decreased by 9.4 percent from 14,218 in 2007 to 12,888 in 2008, which is a 22.3 percent reduction based on baseline period. The number of road fatalities decreased by 12.4 percent from 2,761 in 2007 to 2,419 in 2008, which is an 18 percent reduction based on baseline period. |
||
Performance Analysis
Preparations to table amendments to the Motor Vehicle Safety Act to enable the importation of used vehicles from Mexico were completed. On June 8, 2010, Bill S-5 (Ensuring Safe Vehicles Imported from Mexico for Canadians Act) passed in the Senate and was sent to the House for further readings. This Act will amend the Motor Vehicle Safety Act and the Canadian Environmental Protection Act, 1999, to harmonize with North American Free Trade Agreement requirements.
A new safety regulation was published requiring that Electronic Stability Control (ESC) be installed as standard equipment on all light-duty vehicles for sale in Canada, beginning September 1, 2011. ESC is a technology primarily designed to assist drivers in maintaining control of their vehicle in situations such as emergency maneuvers and cornering on slippery surfaces. It is estimated that this regulation could result in a reduction of 225 fatalities and 775 serious injuries, based on 2006 data.
Actions to help achieve the targets of Road Safety Vision 2010 carried out during 2008 by jurisdictions, including Transport Canada, contributed to Canada’s lowest death toll in almost 60 years. Most jurisdictions targeted three key road safety challenges (drinking and driving, non-use of seat belts and speeding) in their three-year action plans. Two of the areas targeted by interventions experienced noteworthy improvements during 2008. These two areas were victims of serious crashes who were unrestrained and speeding.
Also in the reporting period, road safety outreach activities were delivered as planned. These included hosting a day of remembrance for road traffic victims in partnership with other jurisdictions and stakeholders, such as Mothers Against Drunk Driving and the Canadian Automobile Association.
As well, the department led a working group with its partners to develop a draft national road safety strategy, a follow-up to the Road Safety Vision 2010. The Council of Deputy Ministers supported the draft plan in Spring 2010 and the final plan will be reviewed by the Council of Deputy Ministers and tabled at the Council of Ministers of Transportation in Fall 2010.
The department chaired the Human Factors and Motor Carrier Safety Task Force through the Canadian Council of Motor Transport Administrators (CCMTA) and is developing a systematic strategy to target driver behaviours to promote a safety culture in the Canadian motor carrier industry.
Transport Canada continued to ensure that all appropriate measures were being taken to protect the safety of the travelling public and closely monitored the implementation of Toyota’s repair plan.
Transport Canada conducted an evaluation of the Contribution Program in Support of the National Safety Code for Motor Carriers. Evaluations are posted on the Transport Canada website.
Economic Action Plan
In 2009-2010, the federal government committed to an accelerated investment program to provide $250 million over the next two years to modernize federal laboratories. Road users in Canada will benefit from $14.2 million in improvements at Transport Canada’s Motor Vehicle Test Centre (MVTC) in Blainville, Quebec. Transport Canada
completed all the planning work and began construction. The MVTC is a laboratory that specializes in motor vehicle crash testing and environmental testing. It is the only one of its kind in Canada. The project is on schedule for completion in March 2011.
Lessons Learned
Transport Canada’s ability to measure program performance is critical, so refinement of indicators and targets will be undertaken to improve the department’s ability to measure its performance. These indicators will be partially based on the results of the current reviews of the Road Safety Program and the Motor Vehicle Safety Act. The program planning process is also being reviewed with the goal of improving internal planning.
Benefits for Canadians
- Public awareness of road safety issues reduces the rate of collisions and serious injuries as drivers learn and improve their driving skills.
- Reliable safety data helps determine the best ways to reduce the number of road collisions.
- Legislation and regulations enhance safety for motor vehicle drivers and passengers, as well as other road users, such as pedestrians and cyclists.
2.3.5 Program Activity: Transportation of Dangerous Goods
Required by the Transportation of Dangerous Goods Act, 1992, the Transportation of Dangerous Goods (TDG) Program Activity, which is risk-based, develops safety standards and regulations, provides oversight and expert advice with the support of the Canadian Transport Emergency Centre (CANUTEC) on dangerous goods incidents to promote public safety in the transportation of dangerous goods by all modes of transport in Canada, identifies threats to public safety; enforces the Act and its regulations, guides emergency response and limits the effects of incidents involving the transportation of dangerous goods and develops policy and conduct research to enhance safety. (Main Estimates)
| 2009-2010 Financial Resources ($ millions) |
2009-2010 Human Resources (FTEs) |
||||
|---|---|---|---|---|---|
| Planned Spending |
Total Authorities |
Actual Spending |
Planned | Actual | Difference |
| 14 | 16 | 14 | 139 | 115 | 24 |
| 2009-2010 Performance | ||
|---|---|---|
| Expected Results |
Performance Indicators |
Targets |
| Public safety during the transportation of dangerous goods | Number of accidental releases from means of containment during normal conditions of transport | For 2010, zero accidental releases from means of containment during normal conditions of transport |
| Number of deaths or injuries attributed to the dangerous goods | For 2010, zero deaths and for injuries – baseline + 5 percent reduction | |
| Performance Status and Summary | ||
|
Not met and exceeded. Zero accidental releases: Not Met In 2009-2010, 293 accidental releases, subject to Part VIII of the TDG Regulations, were reported. Out of these 293 accidental releases, only three occurred under the normal conditions of transport. TDG is conducting investigations to determine the causes of these accidental releases. TDG does not have full control over the number of accidental releases as external events have a significant influence on the results. Zero deaths and reduction of injuries: Exceeded There were no deaths and only four injuries attributed to the dangerous goods involving reported accidental releases. There was a total reduction of 33 percent in the number of injuries (from 6 in 2008-2009 to 4 in 2009-2010). |
||
Performance Analysis
In 2009-2010, after several years of effort and with the Vancouver 2010 Olympic and Paralympic Games approaching, the Transportation of Dangerous Goods Act, 1992, was amended to enhance certain safety requirements, add security components (including a comprehensive security prevention and response program during the 2010 Winter Olympics), and continue to help secure access to international markets for Canadian manufacturers, producers and distributors.
The amended Act, which came into force on June 16, 2009, remains focused on the prevention of incidents when dangerous goods are imported, handled, offered for transport and transported. The enabling authorities allow Transport Canada to develop policies and regulations to enhance the safety and security of Canadians during the transportation of dangerous goods. Twice a year, the TDG Directorate meets with industry to discuss regulatory amendments with the TDG General Policy Advisory Council.
Transport Canada played an important role in providing expertise and advice on public safety during the transportation of dangerous goods near Olympic venues to the Royal Canadian Mounted Police (RCMP), prior to and during the Vancouver 2010 Winter Olympics. Transport Canada also increased its inspection efforts across Canada, prior to and during the Olympic Games, to perform inspections at manufacturers, distributors and terminals involved in the importing, handling and offering for transport and transportation of dangerous goods.
The department also began updating the TDG Regulations to align them with the safety and security requirements of the amended Act. These amendments also enhance alignment with United Nations and U.S. regulations by addressing legislative gaps and clarifying interpretation issues. Some of the amendments include provisions for compensation for Emergency Response Assistance Plan holders to respond to a security threat at the request of the Minister. Provisions for reporting the loss or theft or other unlawful interference with dangerous goods are also being included to ensure that such incidents are revealed and acted on in order to eliminate or reduce potential security threats.
Lessons Learned
Renewal of partnerships and agreements with different modal groups within Transport Canada, other government departments and provinces and territories, is essential to foster a coherent and uniform transportation of dangerous goods program.
TDG’s data and risk analysis capacity can be improved. The program will continue to work with federal, provincial and territorial partners on improving data gathering, risk analysis and tools to support policy and program development.
Benefits for Canadians
- The renewal and monitoring of the department’s Memoranda Of Understanding and Memoranda Of Agreement with its partners provides for a coherent program, which ensures public safety during the transportation of dangerous goods.
- Reliable safety data and risk analysis improve policy and regulatory decisions in order to protect Canadians’ health, property and environment from accidental releases of the dangerous goods during normal conditions of transport.
2.4 Strategic Outcome: A Secure Transportation System
The attempted bombing of Northwest Airlines flight 253 on December 25, 2009 and the 2010 Olympic and Paralympic Winter Games in Vancouver and Whistler once again demonstrated the importance of maintaining and enhancing the transportation sector’s capabilities to detect, prevent and respond to ongoing threats. Transportation security is a priority for the department and in support of this, significant investments were made over the past decade. Most recently, Budget 2009 announced new funding of $355 million to CATSA to strengthen and improve the efficiency of airport security screening operations and technology. Transport Canada continued to enhance the Air Cargo Security Program through the development of an enhanced regulatory regime, the assessment and introduction of new screening technology and the strengthening of Canada’s relationship with the U.S. and key international partners.
The 2010 Olympic and Paralympic Winter Games in Vancouver and Whistler also provided many challenges but was also an excellent opportunity to work with key partners to ensure the safety and security of the transportation system during such a large-scale undertaking. Specifically, in order to increase the security posture of the federally regulated freight and passenger railways in the lower mainland during the Olympic period, Transport Canada applied security provisions under the Railway Safety Act. The department also successfully applied the security provisions of the newly amended Transportation of Dangerous Goods Act to issue the Vancouver 2010 interim order regarding the transportation of dangerous goods. New Domestic Ferry Regulations were also put in place for the marine sector. To address the unprecedented volume of air traffic at Vancouver International Airport, Transport Canada worked with its partners at nav canada, CATSA, the RCMP and the Canadian Security Intelligence Service to establish a regulatory framework and implement security measures to ensure that aviation security was maintained.
2.4.1 Program Activity: Aviation Security
The Aviation Security Program develops, administers and oversees policies, programs, regulations and standards necessary for a secure Canadian aviation system in a manner harmonized with the international aviation community. (Main Estimates)
| 2009-2010 Financial Resources ($ millions) |
2009-2010 Human Resources (FTEs) |
||||
|---|---|---|---|---|---|
| Planned Spending |
Total Authorities |
Actual Spending |
Planned | Actual | Difference |
| 62 | 73 | 71 | 278 | 316 | (38) |
| 2009-2010 Performance | ||
|---|---|---|
| Expected Results |
Performance Indicators |
Targets |
| A secure aviation system | Composite index of the level of aviation security developed by 2009-2010 | By 2015, Aviation Security is rated high to very high on the index (subject to change once composite index is developed in 2009-2010) |
| Level of credibility of aviation security internationally | Number of adjustments made to the Canadian Aviation Security Regulatory Framework to achieve international acceptance | In 2010, two adjustments or less are made to the Canadian Aviation Security Regulatory Framework to achieve international acceptance |
| Public confidence in the security of the aviation transportation system | Percentage of respondents in a national survey reporting confidence in the security of Canada’s aviation system | In 2010, 90 percent of the Canadian public has high or moderate confidence in the security of Canada’s aviation system |
| Performance Status and Summary | ||
|
Met all, met all, and indicator under review given the lack of public opinion research conducted during the year. Rating on the composite index: Met All (Development) In Progress (Rating) The development of the composite index has been met. The rating of the Composite Index is in progress and data will continue to be collected by the target date of 2015. Number of regulatory adjustments: Met All Regulatory instruments were developed and implemented to support the security plan for the 2010 Olympic and Paralympic Winter Games. Emergency adjustments were made following the attempted bombing incident of Northwest Airlines flight 253 on Christmas Day 2009 to recognize enhanced requirements in the United States and maintain transborder air operations. Other adjustments were made to achieve international acceptance, such as the introduction of full-body scanning technology and enhanced cargo screening. Public confidence: indicator under review given the lack of public opinion research conducted during the year. While there were no surveys conducted on this indicator by Transport Canada, external surveys have been conducted on the issues of body scanners at major Canadian airports. An Angus Reid Public Opinion survey [10] regarding body scanners indicates that 74 percent of Canadians are in favor of these new devices. In addition, a Harris Decimal poll [11] demonstrates that Canadians expect the use of these devices will have a positive effect on the security of air travel. |
||
Performance Analysis
Significant progress was made on developing Transport Canada’s long-term strategy to enhance aviation security. Specific achievements in support of this goal include strengthening CATSA’s financial sustainability, enhancing passenger and baggage screening, launching a comprehensive air cargo security program and developing aviation security plans.
A core air cargo security program was implemented strengthening air cargo screening and the security of the supply chain. Core components of the program include an enhanced regulatory regime, developing and testing screening technologies and processes, and developing and managing a secure supply chain.
Progress was made on the development of Airport Security program regulatory requirements to strengthen aviation security by promoting more comprehensive, coordinated and integrated security at Canadian airports and conducting pilot projects at two Canadian airports.
The government has also established an information-sharing agreement with the RCMP to conduct more extensive criminal background checks of workers with access to secure areas at Canada’s airports.
Economic Action Plan
Canadian Air Transport Security Authority (CATSA): Over the past year, full-body scanners and enhanced multi-view X-ray equipment were purchased and installed in airports across Canada. These highly advanced devices not only boost aviation security but also increase screening efficiency while enhancing Canada’s level of international technological compatibility. The projects related to the installation and operation of screening equipment continues to create jobs. Building on these successes, the government recently announced in Budget 2010 that it will provide $1.5 billion over five years to CATSA and Transport Canada to enhance Canadian aviation security. This funding will both enable CATSA to continue to improve Canada’s air transportation system, as well as invest in new equipment to better align Canada’s system with international security requirements. Additionally, in order to ensure that CATSA continues to fulfill its mandate effectively, the government is conducting a review of the spending, efficiency, effectiveness and structure of this Crown Corporation.
Air Cargo: Funding from the Economic Action Plan (EAP) helped to launch a comprehensive Air Cargo Security Program. In Budget 2010, the government’s recent investment of $95.7 million enhances and further develops Canada’s Air Cargo Security Program. This five-year funding will serve to further protect Canadian air travellers while helping exporters to move cargo in a secure, timely and efficient way, as well as helping solidify Canada’s reputation as a strong partner in combating global terrorism. This program provides for new more stringent regulations, standards, and oversight of Canada’s air cargo system.
Security Plans: Budget 2009 provided funding to support the development of aviation security plans. Transport Canada has accomplished its goal to initiate the development of Airport Security Program requirements and is continuing to work closely with stakeholders to advance this regulatory initiative. A Notice was published in the Canada Gazette, Part I, in March 2010 seeking the public's feedback on proposed regulatory principles for airport security programs and other changes. Throughout fiscal year 2009-2010, Transport Canada engaged the aviation security stakeholder community on regulatory proposals and conducted two pilot projects in partnership with industry.
Lessons Learned
Aviation security continues to be a very changeable, challenging and dynamic environment. The system must continue to evolve into one in which stakeholders fully integrate security into their business practices based on a common understanding of risk and risk acceptance levels. Major events such as the 2010 Olympic and Paralympic Winter Games in Vancouver and Whistler and the attempted bombing incident of Northwest Airlines flight 253 on Christmas Day 2009 re-enforce the fact that while Canada has an effective and healthy system, a philosophy of continuous improvement is very much a necessity to be able to handle what appears to be a steady stream of new and emerging threats. To this end, Transport Canada will do the following:
- Continue to work with CATSA to improve efficiency and effectiveness while maintaining a healthy security posture. Moving toward a performance-based regulatory structure will provide opportunities for both organizations to look at new ways to achieve the desired outcomes by taking advantage of newly available enhanced technology capabilities and processes that may also reduce the effect on the travelling public.
- Work on improving information flows to passengers during and after major security incidents.
- Work with stakeholders to develop and enhance Canada’s ability to share sensitive information and to develop a collaborative strategic response capability to changes in threat and risk.
- Work with aviation stakeholders on the development of an operational performance framework to be able to more effectively measure the progress on continuous improvement.
Benefits for Canadians
- New technology improved and expedited the efficient flow and screening of passengers and their goods and cargo;
- The safe, secure, efficient and effective movement of goods via air transportation, domestically and internationally; and
- Travellers are reassured that they can carry out their business safely and with the least possible effect on their time and privacy while maintaining Canada’s place as an effective partner in the North American and global aviation transportation system.
2.4.2 Program Activity: Marine Security
The Marine Security Program Activity, with partners, enforces the Marine Transportation Security Act to protect Canada and Canadians in a way that respects Canadian values. It safeguards integrity and security and preserves the efficiency of Canada’s marine transportation system against unlawful interference, terrorist attacks or from being used as a means to attack Canada’s allies. (Main Estimates)
| 2009-2010 Financial Resources ($ millions) |
2009-2010 Human Resources (FTEs) |
||||
|---|---|---|---|---|---|
| Planned Spending |
Total Authorities |
Actual Spending |
Planned | Actual | Difference |
| 29 | 33 | 32 | 121 | 151 | (30) |
| 2009-2010 Performance | ||
|---|---|---|
| Expected Results |
Performance Indicators |
Targets |
| A secure marine transportation system | Under development: indicator to be based on the Marine Transportation Security Regulations incidents | Baseline to be established in 2011, reduction of number, frequency and intensity of Marine Transportation Security Regulations incidents by 10 percent by 2015 |
| Level of credibility of marine security internationally | Number of countries imposing special security measures on goods and people arriving from Canada | By 2010, zero countries imposing special security measures on goods and people arriving from Canada |
| Public confidence in the security of the marine transportation system | Percentage of surveyed population reporting confidence in marine security | 90 percent of surveyed population reporting confidence in marine security by 2015 |
| Performance Status and Summary | ||
|
In progress, in progress and indicator under review given the lack of public opinion research conducted during the year. Number / Frequency and Intensity of incidents: In progress Progress has been made on the development of this indicator for 2011-2012. Notwithstanding the department’s performance during the 2010 Olympic and Paralympic Winter Games, as well as handling the October 2009 Ocean Lady incident (during which the Marine Event Response Protocol was activated), these events have demonstrated that the Marine Security Program is capable of detecting, preventing, and responding in an appropriate and coordinated way when Canada’s marine domain is threatened. Number of countries imposing special security measures: In progress This indicator and target are currently under review; however, Canada is held in high regard by international partners, including the IMO and the United States, in terms of marine security regulations and its capacity to deliver an effective domestic Marine Security Program. Canada’s input is regularly sought by other countries and international organizations in terms of best practices, training and advice. For example, in 2009-2010 the department provided Jamaica with support and assistance in setting up a maritime policy framework, and met with officials from Mexico to discuss Canadian operational practices and related policy authorities. Public Confidence: indicator under review given the lack of public opinion research conducted during the year. This indicator and target are currently under review; however, the Marine Security Program intends to collect marine industry feedback through a survey in 2010-2011. |
||
Performance Analysis
In 2009-2010, Transport Canada’s Marine Security Program Activity continued to provide leadership on a number of files. Examples of this work include the promulgation of the Domestic Ferries Security Regulations, which apply to ferry operators with the highest security risk, progress on developing an updated Marine Security Strategy, progress on revising the Marine Transportation Security Regulations and the development and implementation of a risk-based security assessment program.
A Maritime Commerce Resumption Pilot Project was completed successfully in the Pacific Region and the finalization of a national Maritime Commerce Resumption Strategy is on track for 2010-2011. This has helped prepare the maritime community and government officials at all levels to advance Canada’s capability to coordinate and execute a swift, effective recovery in the event of a man-made or natural disaster involving significant disruptions to maritime commerce.
The implementation of the Great Lakes Marine Security Operations Centre (MSOC) has encountered some staffing delays due to the lengthy process required to recruit personnel for this specialized security field. Interim operating capability is expected in Fall 2010. The MSOC will further enhance Canada’s ability to detect, assess and support a response to threats to marine security.
Lessons Learned
Incidents and Emergency Management: In the past, there have been difficulties understanding and coordinating the various marine security roles and responsibilities at the tactical, operational and strategic levels across numerous federal departments. By developing and implementing the Marine Event Response Protocol, now tested in real security incidents, Transport Canada’s Marine Security Program, in partnership with key federal partners, is now better positioned to respond and manage significant marine events through an integrated and coordinated Government of Canada approach.
The Marine Security Contribution Program: This Program, which sunsetted in November 2009, achieved some very positive results with respect to enhancing security at ports, marine facilities and domestic ferries. Marine Security is, however, examining the causal factors that contributed to lapsing of some funding, particularly during the Program’s first two years. These factors, including differences between initial cost estimates and actual costs submitted by industry recipients and other lessons-learned are being shared with the department's Program Excellence Taskforce, which is focused on improving Grants and Contributions management across the portfolio.
Benefits for Canadians
- Improved Detection: Through the implementation of the new integrated Marine Security Operations Centres, as well as the implementation of security clearances for marine transportation workers, Canadians benefit from Transport Canada’s increased ability to help minimize the possibility of the marine system being threatened, attacked or used as a means to attack our allies.
- Security Aligned to Risks: Domestic ferry passengers benefitted from increased security requirements following the implementation of new Domestic Ferries Security Regulations in time for the 2010 Olympic and Paralympic Winter Games.
- Incident Recovery and Response: Through the Maritime Commerce Resumption Pilot Project and the finalization of the integrated Marine Event Response Protocol, Canadians can have greater confidence in Transport Canada’s ability to respond and help industry recover in a swift and coordinated manner in the event of a disaster.
2.4.3 Program Activity: Surface and Intermodal Security
Guided by the Railway Safety Act, the International Bridges and Tunnels Act and the federal government’s transportation security mandate, the Surface and Intermodal Security Program [12] Activity enhances the security of surface and intermodal transportation–mainly rail and urban transit–against direct terrorist attack. Working with partners to protect Canada and Canadians in a way that respects Canadian values and preserves the efficiency of the transportation system, the program provides federal leadership, develops and enforces regulatory and voluntary frameworks (regulations, codes of practice, memoranda of understanding) and provides financial contributions. (Main Estimates)
| 2009-2010 Financial Resources ($ millions) |
2009-2010 Human Resources (FTEs) |
||||
|---|---|---|---|---|---|
| Planned Spending |
Total Authorities |
Actual Spending |
Planned | Actual | Difference |
| 11 | 13 | 12 | 69 | 71 | (2) |
| 2009-2010 Performance | ||
|---|---|---|
| Expected Results |
Performance Indicators |
Targets |
| Urban transit operators aware of and adopt voluntary and regulatory requirements when latter are in place | Percentage of awareness and adoption among category level 1 and 2 operators of voluntary and regulatory requirements | 100 percent awareness among urban transit operators by 2011 |
| By 2011, category 1-80 percent adoption, and category 2-50 percent adoption | ||
| Rail transportation (passenger and freight) operators aware of and adopt voluntary and regulatory requirements (when latter in place) | Percentage of operators that are aware of voluntary frameworks | 100 percent awareness by passenger and freight operators by 2011 |
| Percentage of class 1 railways and selected commuter rail (e.g. AMT, GoTransit, West Coast Express) that adopt voluntary frameworks | 100 percent voluntary adoption by passenger and freight operators by 2011 | |
| Performance Status and Summary | ||
|
All: In Progress. (Note: Targets are for 2011.) Thirty federally regulated railways and 45 urban transit companies submitted security plans to Transport Canada thus, demonstrating that railways are aware of and are in the process of adopting the voluntary framework. The department’s activities have demonstrated the challenges associated with the “awareness element” of the performance indicators in contributing to ensuring a secure surface and intermodal transportation system. As such, indicators are currently under review to ensure their relevancy and that they capture the full scope of the program. |
||
Performance Analysis
In order to increase awareness and adoption of the voluntary framework and regulatory requirements, the Surface and Intermodal Security Program Activity participated in and/or organized different security conferences and workshops, engaged stakeholders in policy and operational consultations and developed security tools and awareness products. As a result, operators are progressively altering their operations to ensure that security considerations are a part of their daily activities and that security concerns are being addressed.
In 2007, Transport Canada and the Railway Association of Canada (RAC) signed an MOU to strengthen railway security. Under this agreement, railway operators who are members of RAC prepare a security plan based on risk assessment, which is provided to the Minister of Transport, Infrastructure and Communities. The first two years of operation of the MOU has focused on operators preparing and submitting security plans. Participating operators also delivered on other important elements covered under this MOU, such as maintaining records, performing exercises and drills, appropriate training and awareness for new employees, and reporting incidents to the Minister as soon as possible.
Initial security assessments were conducted to determine how the railways and selected commuter rail operations are adopting the voluntary frameworks, which opened a dialogue with the industry to identify best practices for implementation.
A security risk assessment of the Prince Rupert-Fort Francis Gateway and Rail Corridor was completed. This assessment will be used to identify opportunities for transportation security improvements.
A policy framework for implementing the security provisions of the International Bridges and Tunnels Act, 2007, is being developed to provide a way forward to enhance the security of Canada’s international bridges and tunnels.
Lessons Learned
- The Program Activity description will be reviewed to ensure that it is not limited to enhancing the security of the surface and intermodal transportation against direct terrorist attack but that it reflects the fact that the program contributes to enhancing the overall security of the surface and intermodal transportation system.
- There is a need to establish a more comprehensive communication and consultation approach to ensure that clear and concise information is being shared with the stakeholders.
- Lessons learned from the Prince Rupert-Fort Francis Gateway and Rail security risk assessment will be used when developing the methodology and approach for conducting other security assessments of Gateways and Trade Corridor.
Benefits for Canadians
- Various projects and initiatives, which include developing a policy framework for international bridges and tunnels security, ongoing oversight activities and improving communication, cooperation and collaboration among surface transportation operators. These have contributed to the goal of enhancing surface and intermodal transportation security.
- The security assessment of the Prince Rupert-Fort Frances Corridor, which helped public and private sector stakeholders identify, confirm and focus on current transportation system security strengths and vulnerabilities. It also contributed to building public and trading partner confidence; improving the efficiency of transportation systems; supporting safe and secure communities; and ensuring that the surface and intermodal transportation system has the ability to resume the efficient movement of peoples and goods following an adverse incident.
- The MOU between Transport Canada and the RAC contributed to ensuring that the Canadian surface transportation system continues to be secure for all citizens and their communities.
2.5 Program Activity: Internal Services
| Internal Services [13] are groups of related activities and resources that are administered to support the needs of programs and other corporate obligations of an organization. | |||||
|---|---|---|---|---|---|
| 2009-2010 Financial Resources ($ millions) |
2009-2010 Human Resources (FTEs) |
||||
| Planned Spending |
Total Authorities |
Actual Spending |
Planned | Actual | Difference |
| 172 | 213 | 217 | 1,235 | 1,410 | (175) |
Performance Analysis
Activities included within Internal Services enable and support program delivery and other corporate obligations within Transport Canada in a variety of ways. These functions are management and oversight [14], communications, legal, human resources management, financial management, information technology, real property, material and acquisition.
In 2009-2010, Internal Services focused on two management priorities: enhancing portfolio governance through integrated management strategies and supporting public service renewal and improving people management (see section 1.3). In addition, many activities and projects were undertaken to better meet the needs of Transport Canada, including a streamlining of Internal Services’ processes and procedures to support timely and effective program delivery under Canada’s Economic Action Plan.
Transport Canada implemented a new governance structure that is more streamlined and aligns with the department’s recently implemented Program Activity Architecture. It integrates strategic decision-making through five business committees that support the Deputy Minister. It also ensures inclusive discussions and considerations of policy and programs, and of regulatory and management issues.
Transport Canada developed a plan to effectively implement new Treasury Board policies (i.e. Internal Control, Transfer Payments, Investment Planning, Financial Management Governance, Stewardship of Financial Management Systems and Management of Projects) to improve its internal control framework. This includes continued capacity building on financial, materiel, and project and risk management in order to strengthen financial management stewardship, oversight, transparency and accountability.
To build on its best practices in grants and contributions management, Transport Canada has created a Program Excellence Taskforce that will oversee the integration and strengthening of the department’s grants and contributions management.
Transport Canada’s Aboriginal Consultation Task Force worked towards the creation of the Aboriginal Consultation Unit and the development of Transport Canada’s Aboriginal Consultation and Accommodation Guidelines and associated training, with the objective of promoting an efficient, effective and consistent process for Aboriginal consultation throughout the department.
Transport Canada tabled its Annual Report to Parliament, which provides an overview of the state of the Canadian transportation system, in addition to important statistical information that is relevant for policy development, planning and program management for the department and other agencies.
The implementation of Transport Canada’s strategic review is proceeding in accordance with plans and in light of the current environment. Savings identified in this Review have been removed from the department’s reference levels. For example, the policing subsidy for Canada’s eight largest airports has been terminated.
Lessons Learned
The Program Activity Architecture introduced Internal Services as an activity that consists of a mix of corporate functions. Through the new governance structure, these functions are now working in closer cooperation, which is serving to improve the value provided by each respective function.
Benefits for Canadians
Internal Services contributes to the efficient and effective delivery of Transport Canada programs by providing support services, expertise and advice to enable informed decision-making.
Section III – Supplementary Information
3.1 Financial Highlights
The financial highlights presented within this DPR are intended to serve as a general overview of Transport Canada’s financial position and operations. The department’s financial statements can be found on Transport Canada’s website.
| Condensed Statement of Financial Position At End of Year (March 31, 2010) |
% Change | 2009-2010 | 2008-2009 (Restated) |
|---|---|---|---|
| Total Assets | -2.2 % | 2,875,207 | 2,940,483 |
| Total Liabilities | -4.5 % | 1,853,707 | 1,941,940 |
| Total EQUITY | 2.3 % | 1,021,500 | 998,543 |
| Condensed Statement of Financial Operation At End of Year (March 31, 2010) |
% Change | 2009-2010 | 2008-2009 (Restated) |
|---|---|---|---|
| Total Expenses | -12.2 % | 1,423,175 | 1,621,284 |
| Total Revenues | -7.2 % | 377,226 | 406,311 |
| Net Cost of Operations | -13.9 % | 1,045,949 | 1,214,973 |
Financial Highlights Graphs
Total assets were $2,875 million at the end of 2009-2010, a decrease of $65 million (2.2 %) over the previous year’s total assets of $2,940 million. Tangible capital assets represented the largest portion of total assets at $2,720.4 million or 94.6 % of total assets.
Total liabilities were $1,854 million, a decrease of approximately $88 million (4.5 %) over the previous year’s total liabilities of $1,942 million. Accounts payable represents the largest portion of liabilities at $937.5 million or 50.6 % of total liabilities.
* The Revenues from the Ship-Source Oil Pollution Fund and other programs are earmarked under legislation for specific expense purposes and are not available for Transport Canada spending.
The department’s total revenues amounted to $377 million for 2009-2010. There was a decrease of $29 million (7.2 %) from the previous year’s revenue. Most of Transport Canada’s revenue was derived from the Efficient Transportation System program.
Total expenses for Transport Canada were $1,423 million in 2009-2010. The majority of funds, $1,173 million or 82.4 %, were spent on transportation efficiency, safety and security while other programs represented $251 million or 17.6 % of total expenses.
3.2 Canada’s Economic Action Plan (EAP)
The following tables identify the Transport Canada EAP initiatives, including funding:
| EAP Initiative ($ in 000’s) |
Total EAP Allocations for all years | TBS Authority for 2009-2010 | Actual Spending during 2009-2010 | One or Multi Year |
|---|---|---|---|---|
| Modernizing Federal Laboratories | 14,191 | 4,534 | 4,534 | Multi year |
| Remote Passenger Rail Services | 7,900 | 4,500 | 4,500 | Multi year |
| Rail Safety | 64,238 | 10,787 | 8,849 | Multi year |
| Blue Water Bridge | 13,500 | 2,500 | 1,451 | Multi year |
| Peace Bridge | 1,000 | 800 | 83 | Multi year |
| Remediation of federal contaminated sites | 47,826 | 12,883 | 12,282 | Multi year |
| Security Plans | 2,425 | 2,425 | 2,334 | One year |
| Air Cargo Security Program | 10,326 | 10,326 | 10,278 | One year |
| Promoting Energy Development in Canada’s North [15] | 2,501 | 2,501 | 2,171 | One year |
In addition to funding received directly, three of Transport Canada’s portfolio agencies also received EAP funding, as follows:
| EAP Initiative ($ in 000’s) |
Total EAP Allocations for all years | TBS Authority for 2009-2010 | Actual Spending during 2009-2010 | One or Multi Year |
|---|---|---|---|---|
| via-intercity rail service | 407,000 | 125,000 | 125,000 | Multi year |
| CATSA | 355,762 | 355,762 | 328,570 | One year |
| JCCBI-Champlain Bridge | 212,353 | 13,868 | 12,968 | Multi year |
Information on progress for these initiatives can be found in section II under each program activity. Transport Canada is currently conducting program evaluations of a number of EAP initiatives.
3.3 Summary Tables by Strategic Outcomes and Explanations on Variances
The tables below provide a summary of the performance for each Strategic Outcome (SO) and Internal Services. The departmental Performance Measurement Framework is currently being reviewed to ensure a stronger measurement approach that will provide greater accuracy in the monitoring and reporting of the impact of departmental initiatives.
| Performance Indicators | Targets | 2009-2010 Performance |
|---|---|---|
| Level of productivity of transportation sector | Increase by 2.5 percent to 5 percent relative to 2009 baseline (Productivity Index >113 in 2014) |
Most recent figures available are from the 2008 calendar year. In 2008, the productivity of the transportation business sector increased by 1.2 percent (For-hire trucking was not included as figures are being updated). Due to the economic recession, it is likely that productivity growth was negative in 2009. |
| Cost level in the transportation sector | Growth in unit costs does not exceed 11 percent over a 5-year horizon relative to the 2009 baseline (Cost Index < 111 in 2014) | The unit costs for the same subset above increased by 8.6 percent in 2008. Increased unit costs were mainly due to rising fuel prices. Productivity gains were not enough to offset the approximate 37 percent increase in fuel input prices. |
| Program Activity [16] | Expected Results | Alignment to Government of Canada Outcomes | 2008-2009 Actual Spending |
2009-2010 | |||
|---|---|---|---|---|---|---|---|
| Main Estimates |
Planned Spending |
Total Authorities [17] |
Actual Spending [18] |
||||
| Transportation Marketplace Frameworks | A competitive and financially viable transportation sector through effective transportation marketplace frameworks | A fair and secure marketplace | 11 | 9 | 9 | 11 | 11 |
| Gateways and Corridors | Enhanced level of trade through Canada’s strategic gateways and trade corridors | Strong economic growth | 59 | 659 | 658 | 620 | 156 |
| Transportation Infrastructure | Modern transportation system | Strong economic growth | 3 | 40 | 48 | 79 | 46 |
| Transportation Innovation | An innovative transportation system | An innovative and knowledge-based economy | 9 | 10 | 10 | 14 | 7 |
| Total [6] | 82 | 718 | 725 | 724 | 220 | ||
Information on Variances (between Total Authorities and Actual Spending)
Gateways and Corridors: The $464 million variance was attributed to two main factors. The majority of this variance $394 million occurred under the Gateways and Border Crossings Fund and the Asia-Pacific Gateway and Corridor Initiative Transportation Infrastructure Fund. Funded projects are large and complex and take time to develop and the market conditions of the economic downturn caused construction costs to be lower than anticipated, thus resulting in lower than expected bids on tenders. The remaining variance of $70 million is related to the Windsor Gateway Project and is a consequence of factors such as the length of time required to undertake the necessary due diligence work to properly evaluate land value proposals, delays in commencing some of the necessary studies due to weather conditions and timing of the federal environmental assessment approval.
Transportation Infrastructure: The $33 million variance is due to long negotiations, construction/weather or environmental assessments delays, which have resulted in specific initiatives such as the Outaouais Road Agreement ($5.8 million) and divestiture agreements from the Port Divestiture fund ($17 million) not being finalized in the reporting year. Other variances ($10.2 million) are made up of minor program variances, such as short construction season, delays in major repairs, cancellation of tendering processes, etc.
Transportation Innovation: The $7 million variance is primarily attributed to delays in meeting all conditions related to the terms and conditions of the Security and Prosperity Partnership Contribution program under the Smart Border Action Plan, some delays in the signing and execution of some contribution agreements due to pending environmental approvals, incomplete work on the National Roadside Survey, lengthy federal and provincial negotiations, certain expenditures recorded under Gateways and Corridors as they were part of the Gateway and Border Crossings initiative and the relocation of Transport Development Centre from Montreal to Ottawa.
For the most part, the funds not used in 2009-2010 for these program activities will be carried forward to 2010-2011.
| Performance Indicators | Targets | 2009-2010 Performance |
|---|---|---|
| Level of greenhouse gas emissions from the transportation sector measured in tonnes of CO2 equivalent | Greenhouse gas (GHG) emission levels from the transportation sector reduced consistent with government targets as identified in Turning the Corner | Based on the most recent available information, transportation GHG emissions have remained relatively unchanged in 2008 as compared to 2007 (198 megatonnes (Mt) of CO2 equivalent in 2008 [19] as compared to 199 Mt in 2007). |
| Level of air pollutants produced by the transportation sector | Level of air pollutants from the transportation sector reduced consistent with targets to be established under the Clean Air Agenda | Since 1990 [20], transportation sector air pollution emissions such as fine particulate matter, sulphur oxides, nitrogen oxides and volatile organic compounds, have shown a steady decline mainly due to on-road vehicles regulatory initiatives and vehicle fleet renewal. The most recent available data is from 2007. |
| Program Activity [16] | Expected Results | Alignment to Government of Canada Outcomes | 2008-2009 Actual Spending |
2009-2010 | |||
|---|---|---|---|---|---|---|---|
| Main Estimates |
Planned Spending |
Total Authorities [17] |
Actual Spending [18] |
||||
| Clean Air from Transportation | A transportation system that is less intensive in its emissions of greenhouse gases and air pollutants | A clean and healthy environment | 146 | 33 | 34 | 29 | 19 |
| Clean Water from Transportation |
Canadian waters protected from discharges of transportation pollutants Prevention of the transfer of alien aquatic species into domestic water through ship ballast water |
9 | 6 | 6 | 9 | 10 | |
| Environmental Stewardship of Transportation | Transport Canada aware of and responsive to environmental effects of its activities | 35 | 34 | 44 | 55 | 38 | |
| Total [6] | 190 | 73 | 84 | 93 | 67 | ||
Information on Variances (between Total Authorities and Actual Spending)
Clean Air: The $10 million variance was primarily due to amendments and scope changes under various ecotransport programs in response to the economic downturn and delays in negotiation of some contribution agreements, delays in vehicle acquisitions and in the introduction of new advanced technology vehicles, a less resource-intensive alternative to measure the effects of ecoauto and delays in establishing partnerships with key partners under the ecotransport initiatives.
Clean Water: The $1 million over-expenditure was related to the Aerial Surveillance program used to detect pollution from ships. Funding was allocated to the program to continue surveillance coverage in Newfoundland.
Environmental Stewardship: The $17 million variance is related to the management of environmental remediation projects, the majority of which are managed under the Federal Contaminated Sites Action Plan. Environmental remediation projects are often large and complex and highly influenced by outside conditions such as weather, tendering and uncertainty in actual volumes of contamination. The surplus was primarily due to project delays across the country related to additional site assessments and required environmental approvals, contracting delays and lower contracting bids received for some contracts. In addition, part of the variance is related to 2009-2010 projects that were undertaken in 2008-2009.
For the most part, the funds not used in 2009-2010 for these program activities will be carried forward to 2010-2011.
| Performance Indicators | Targets | 2009-2010 Performance |
|---|---|---|
| Number/rate of accidents or fatalities by mode | Maintain or improve accident/fatality rates by mode, based on each mode’s strategic objectives |
|
| Degree of public confidence in the safety of the transportation system | Maintain or improve public confidence in the safety of transportation, based on the strategic objectives of each mode | No surveys were conducted in 2009-2010; this indicator is currently under review. |
| Program Activity [16] | Expected Results | Alignment to Government of Canada Outcomes | 2008-2009 Actual Spending |
2009-2010 | |||
|---|---|---|---|---|---|---|---|
| Main Estimates |
Planned Spending |
Total Authorities [17] |
Actual Spending [18] |
||||
| Aviation Safety | A safe civil aviation system | Safe and secure Canada | 252 | 238 | 241 | 247 | 231 |
| Marine Safety | A safe marine transportation system | 82 | 74 | 75 | 87 | 82 | |
| Rail Safety | A safe rail transportation system | 30 | 28 | 28 | 43 | 37 | |
| Road Safety | Safe roads | 29 | 36 | 35 | 36 | 30 | |
| Transportation of Dangerous Goods | Public safety during the transportation of dangerous goods | 14 | 14 | 14 | 16 | 14 | |
| Total [6] | 407 | 390 | 393 | 429 | 394 | ||
Information on Variances (between Total Authorities and Actual Spending)
Aviation Safety: The $16 million variance was primarily the result of reduced spending in the Airports Capital Assistance Contribution Program of $9 million. Given that it was the last year of the five-year program, recipients could only submit funding applications for projects that could be completed in one year. In addition, lower than expected bids were received for some of the projects and delays in some projects occurred due to a number of factors, such as poor weather conditions, late tendering and awarding of contracts. Reduced operating budget spending of $5.5 million in the Civil Aviation Program was due to staffing delays and decreased employee travel and training while the Program transitioned to a regulatory oversight program based on Safety Management Systems, decreased costs for Department of Justice and translation services and reduced capital budget spending of $1.5 million due to delays in the contracting process for several capital projects.
Marine Safety: The $5 million variance was primarily the result of reduced spending in salaries for inspectors due to vacant positions ($0.8 million surplus), reduced revenues representing a deficit of $0.4 million due to the decrease in shipping activity, reduced spending in training for inspectors ($0.54 million surplus), reduced spending in legal services ($0.4
million surplus) due to insufficient legal services capacity to meet requirements and reduced spending in the Marine Simulators Contribution Program ($2.3 million surplus), which offers financial assistance for the transfer and modernization of marine training simulators to five provinces (British Columbia, Ontario, Quebec, Nova Scotia and Newfoundland and Labrador) that have Marine
Training Institutes. Some provinces have experienced delays in meeting the requirements to proceed with the transfer. An outstanding $1.4 million was coded to SO3 during the transition period for Security Programs Support. A BAP was prepared to address this internal transfer of funds to SO4.
Rail Safety: The $6 million variance was primarily the result of some delays encountered initiating internal processes and obtaining approvals, as well as staffing some vacant positions. $1 million of this variance was re-profiled to 2011-2012.
Road Safety: The $6 million variance was primarily the result of $4.443 million that was not spent under the National Safety Code contribution program, which expired on March 31, 2009. The development of a Treasury Board submission was delayed. The variance of $1.15 million under ecotransport – National Harmonization Initiative for the Trucking Industry, was due to the lack of uptake from the provinces and territories for this program. There was $0.4 million in capital for asphalt costs at the Motor Vehicle Test Centre in Blainville, Quebec, which will be re-profiled to next year.
Transportation of Dangerous Goods: The $2 million variance was primarily the result of staffing delays and associated decreased employee travel and training, and reduced capital budget spending due to delays in the contracting process for capital projects.
| Performance Indicators | Targets | 2009-2010 Performance |
|---|---|---|
| Level of credibility of Canada’s transportation security internationally | No countries impose special security measures on goods and people arriving from Canada |
The target is being reviewed and the baseline will be established in 2010-2011. Canada, however, is held in a high regard by international partners such as the International Civil Aviation Organization (ICAO) and the International Maritime Organization (IMO) and by its key trading partners including the U.S. Although some adjustments were made during the year to ensure consistency, such as those following the December 25, 2009 aviation security threat, the measures imposed do not impact significantly on people and goods arriving from Canada. |
| Degree of public confidence in the security of the transportation system | Maintain or improve confidence in the security of the transportation systems, based on the strategic objectives of each mode |
While there were no surveys conducted on this indicator by Transport Canada, external surveys have been conducted on the issue of body scanners following the attempted terrorist attack on December 25, 2009 and the introduction of body screening technology at major Canadian airports. An Angus Reid Public Opinion survey regarding body scanners indicates that 74 percent of Canadians are in favour of these new devices. In addition, the Harris Decimal poll demonstrates that Canadians expect the use of these devices will have a positive impact on the security of air travel. |
| Program Activity [16] | Expected Results [21] | Alignment to Government of Canada Outcomes | 2008-2009 Actual Spending |
2009-2010 | |||
|---|---|---|---|---|---|---|---|
| Main Estimates |
Planned Spending |
Total Authorities [17] |
Actual Spending [18] |
||||
| Aviation Security | A secure aviation system | Safe and secure Canada | 65 | 62 | 62 | 73 | 71 |
| Marine Security | A secure marine transportation system | 27 | 29 | 29 | 33 | 32 | |
| Surface and Intermodal Security | Urban transit/Rail transportation (passenger and freight) operators aware of and adopt voluntary and regulatory requirements when latter are in place | 66 | 7 | 11 | 13 | 12 | |
| Total [6] | 158 | 98 | 102 | 119 | 115 | ||
Information on Variances (between Total Authorities and Actual Spending)
Marine Security Program: The $1 million variance is related to the Marine Security Contribution Program, which sunsetted in 2009-2010. Reimbursement for eligible expenses claimed by recipients was less than originally forecast in the Program’s fifth and final year.
Transport Canada’s Aviation Security Program: The $2 million variance is due to additional funding received for Air Cargo and Security Plans.
Surface and Intermodal Security Program: The variance is due to fiscal year 2009-2010 being a transition period as Transport Canada adjusted to a PAA-based approach to managing results. PAA variances were preserved to support PAA alignment and budget normalization for future years.
| ($ millions) | ||||||
| Program Activity [16] | Alignment to Government of Canada Outcomes | 2008-2009 Actual Spending |
2009-2010 | |||
|---|---|---|---|---|---|---|
| Main Estimates |
Planned Spending |
Total Authorities [17] |
Actual Spending [18] |
|||
| Internal Services | Not applicable | 204 | 171 | 172 | 213 | 217 |
| Total | 204 | 171 | 172 | 213 | 217 | |
Information on Variances (between Total Authorities and Actual Spending)
Both the financial and FTE variances are due to internal reallocations within Transport Canada’s new Program Activity Architecture (PAA) structure and additional funding received during the year.
3.4 Program Activity Architecture Crosswalk
| 2008-2009 | 2009-2010 |
|---|---|
|
SO1 [23]: An efficient transportation system that contributes to Canada’s economic growth and trade objectives PA [24] : Transportation Policy Development, Programs and Infrastructure in support of a market-based framework |
SO1: An efficient transportation system PA: Transportation Marketplace Frameworks, Gateways and Corridors, Transportation Infrastructure and Transportation Innovation |
|
SO2: A safe and secure transportation system that contributes to Canada’s social development and security objectives PA: Transportation Safety and Security |
SO3: A safe transportation system PA: Aviation Safety, Marine Safety, Rail Safety, Road Safety, and Transportation of Dangerous Goods |
|
SO4: A secure transportation system PA: Aviation Security, Marine Security, and Surface and Intermodal Security |
|
|
SO3: An environmentally responsible transportation system that contributes to Canada’s sustainable development objectives PA: Sustainable Transportation Development and the Environment |
SO2: A clean transportation system PA: Clean Air from Transportation, Clean Water from Transportation, and Environmental Stewardship of Transportation |
|
Internal Services [25] supporting all four strategic outcomes |
3.5 Risk Analysis
A safe, secure, and clean transportation system is vital to Canada’s economic competitiveness, standard of living and relationships with global trading partners. As part of its responsibilities, Transport Canada must manage several significant risks. Some of the key risks areas are as follows:
The department’s risk-Based Audit Plan demonstrates how Transport Canada is implementing integrated risk management into its operations. Audit, Evaluation and Advisory Services, as part of its annual planning work, conducts risk assessments in which senior management are engaged in a process to assess key risk areas where greater assurance and management oversight may be of value.
The December 25, 2009 security incident and the security planning for the XXI Olympic Winter Games in Vancouver have reinforced certain strategies to Canada’s approach to national security. New technologies, regulatory initiatives, and working with domestic and international partners to ensure harmonization in security approaches are some of the ways that Transport Canada has responded to the threat of terrorism. Moreover, Transport Canada continues to take a proactive approach to security, while keeping security policies from becoming trade barriers and obstacles in this time of economic uncertainty. For example, the department continued to implement the Asia-Pacific Gateway and Corridor Initiative to advance the competitiveness of Canada’s transportation system.
Regarding the Olympic security planning, Transport Canada, in cooperation with other key federal partners including the RCMP, conducted a number of risk assessments. The key risks focused on potential attacks against the transportation system, the use of transportation assets as a weapon and the use of the transportation system to gain access to venues. Based on those risk assessments and RCMP planning priorities, the Department used its regulatory powers, in addition to its strong working relationship with stakeholders, to enhance the security posture of the transportation system. To this end, air restrictions were in place, controlled access and time of day restrictions for the movement and storage of dangerous goods were set up and marine exclusion zones were arranged.
To support the federal government in reducing the impacts of the recession, Transport Canada employed a robust risk management strategy to ensure strong oversight and implementation of Canada’s Economic Action Plan (EAP). Key risks and associated risk mitigation strategies were identified for each EAP initiative as well as for the Department’s overall management of the EAP in its entirety. The risk management strategy was kept current through frequent reviews of the risk profiles and senior executives were engaged in the process of risk mitigation via regular quarterly progress reports to the Departmental Audit Committee (DAC) and the senior executive committee (TMX).
As indicated above, Transport Canada continues to implement measures to reduce the impact of external challenges and risks to its ability to achieve an efficient, clean, safe and secure transportation system for Canadians.
3.6 List of Supplementary Information Tables
The following tables were submitted electronically. The electronic tables can be found
on the Treasury Board Secretariat’s website.
- Sources of respendable and non-respendable revenue
- User fees reporting
- Status Report on Projects operating with specific TB approval
- Status Report on Major Crown/Transformational Projects
- Details on Transfer Payment Programs
- Horizontal Initiatives
- Green Procurement
- Response to Parliamentary Committees and External Audits
- Internal Audits and Evaluations
3.7 Other Items of Interest
A
Advisory Panel’s Review of the Canadian Air Transport Authority Act
Airport Capital Assistance Program
All Aboard: Rail Safety Strategic Plan (2005-2010)
Asia-Pacific Gateway and Corridor Initiative
Automakers Agreement to Reduce GHG Emissions
C
Cabinet Directive on Streamlining Regulation
Canadian Transportation Agency
E
F
G
M
N
Navigable Waters Protection Program
O
Ontario-Quebec Continental Gateway
R
S
T
Transportation in Canada - Overview report (2008)
Transport, Infrastructure and Communities portfolio
Transportation of Dangerous Goods
[1] Operational Priorities focus on ways to improve value for money in the department’s program base to deliver better results for Canadians.
[2] Management Priorities focus on improving a department’s management practices and controls, in such areas as human resources, risk management, real property management and corporate services.
[3] Type definition: Ongoing – committed to at least three fiscal years before the year of this report.
[4] Type definition: New Commitment – newly committed to in the reporting year of the RPP or DPR.
[5] Statutory payments of less than $1 million were not included in this chart.
[6] Due to rounding, columns may not add to the totals shown.
[7] Please visit Transport Canada's website.
[8] Slight rewording from Main Estimates for clarification.
[9] The evaluation will be posted online in 2010-2011.
[10] Angus Reid Public Opinion survey
[11] Harris Decimal poll
[12] The program activity (PA) description for Surface and Intermodal Security has been amended to reflect the end of the Transit-Secure Contribution program on March 31, 2009.
[13] Commencing in 2009-2010 Estimates cycle, the resources for the Internal Services Program Activity are displayed separately from other Program Activities; they are no longer distributed among the remaining Program Activities, as was the case in previous Main Estimates. This has affected the comparability of spending and FTE information by Program Activity between fiscal years.
[14] Management and Oversight includes: Offices of the Minister, Minister of State, Deputy Minister, Associate Deputy Minister, Assistant Deputy Ministers and Regional Directors, Policy (Economic Analysis, Strategic Policy and International and Intergovernmental Relations), Programs (Programs Excellence and Aboriginal Consultations), Audit and
Evaluation, Crown Corporation Governance, Corporate Planning and reporting, Communications and Legal Services.
[15] The department’s role was to respond to the Joint Review Panel’s report on the Mackenzie Gas Project (released December 30, 2009), conduct Aboriginal consultations, and increase inspections, enforcement and outreach activities in the project area. The lead department for this project is Environment Canada.
[16] For program activity descriptions, please access the Main Estimates online.
[17] Total Authorities = Main Estimates + Supplementary Estimates.
[18] Actual Spending is exactly as shown in Public Accounts.
[19] 1990-2008 Greenhouse Gas Emissions Inventory, Environment Canada.
[20] 1985-2007 National CAC Emissions Summary, Environment Canada
[21] Slight rewording for clarification.
[22] The crosswalk detailing the redistribution of financial resources is available on Transport Canada’s website under the Financial Program Activity Crosswalk 2008-2009 and 2009-2010.
[25] Commencing in the 2009-2010 Estimates cycle, the resources for Internal Services program activity are displayed separately from other program activities. They are no longer distributed among the remaining program activities, as was the case in previous Main Estimates. This has affected the comparability of spending and full-time equivalent (FTE) information by program activity between fiscal years.