
Treasury Board of Canada Secretariat
www.tbs-sct.gc.ca
Common menu bar links
Breadcrumb Trail
ARCHIVED - Economic Development Agency of Canada for the Regions of Quebec - Report
 This page has been archived.
Archived Content
Information identified as archived on the Web is for reference, research or recordkeeping purposes. It has not been altered or updated after the date of archiving. Web pages that are archived on the Web are not subject to the Government of Canada Web Standards. As per the Communications Policy of the Government of Canada, you can request alternate formats on the "Contact Us" page.
3 Additional information
3.1 Significant financial data
The financial highlights presented in this report are intended to provide a general overview of the Agency’s operations and financial situation. Detailed Financial Statements40 are to be found on the Agency’s Web site.
The actual expenditures presented in the preceding tables were prepared on a cash basis, while the financial highlights that follow were prepared on an accrual basis. Tables reconciling these two accounting methods are presented in the Notes to the Agency’s Financial Statements.
Summary financial information as at March 31, 2010
| (in thousands of dollars) | Percentage variance | 2008–09 | 2009–10 |
|---|---|---|---|
| Condensed statement of financial position for the period ending March 31, 2010 |
|||
| Assets | |||
| Total assets | 13% | 152,335 | 172,366 |
| TOTAL | 13% | 152,335 | 172,366 |
| Liabilities | |||
| Total liabilities41 | 67% | 53,825 | 88,802 |
| Equity | |||
| Total equity42 | (16%) | 98,510 | 83,564 |
| TOTAL | 13% | 152,335 | 172,366 |
| Condensed statement of financial operations for the period ending March 31, 2010 |
|||
| Expenditures | |||
| Total expenditures | 31% | 264,970 | 346,605 |
| Revenue | |||
| Total revenues | 9% | 822 | 895 |
| Net operating cost | 31% | 264,148 | 345,710 |
3.2 Financial highlights
For the period ending March 31, 2010
ASSETS
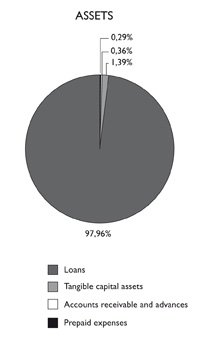
- Total assets stood at $172.4 million at the close of 2009-2010, up 13% from 2008-2009.
- Loans accounted for 98% of the Agency’s assets, or $168.9 million.
- Accounts receivable represented 0.4% of total assets, as against 0.3% for prepaid expenses and 1.4% for tangible capital assets.
LIABILITIES
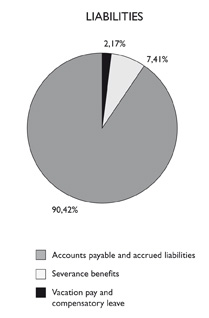
- Total liabilities amounted to $88.8 million at the close of 2009-2010, up 65% from 2008-2009.
- Accounts payable accounted for the majority (90.4%) of liabilities, at $80.3 million.
- Vacation pay and compensatory leave stood at $1.9 million, and severance benefits at $6.6 million.
REVENUES
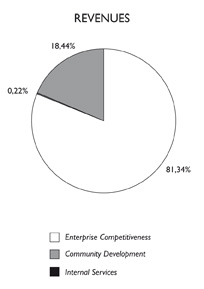
- Total revenues amounted to $895,000 in 2009-2010.
- Revenues consisted of interest ($639,000) and repayments above 100% on conditionally repayable and unconditionally repayable contributions.
EXPENSES
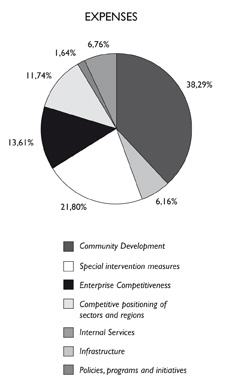
- Total expenses amounted to $346.6 million in 2009-2010.
- Expenses consist primarily of non-repayable and conditionally repayable contributions (totalling $248.9 million).
- The majority of funds ($132.7 million) were used for development of Canada’s communities.
The remaining funds broke down as follows: - Infrastructure: $21.4 million
- Special intervention measures: $75.5 million
- Enterprise Competitiveness: $47.2 million
- Competitive positioning of sectors and regions: $40.7 million
- Policies, programs and initiatives: $5.7 million
- Internal Services: $23.4 million.
3.3 List of additional tables
Table: Sources of Non-respendable Revenue
The table illustrates revenue and provides a historical perspective. Revenue consists primarily of repayments of the repayable contributions awarded by the Agency.
Table: Report on User Fees
The table presents user fee revenue and costs.
Table: Details of Transfer Payment Programs (TPPs)
The table illustrates the results of TPPs in relation to commitments and planned results as set out in the 2009-2010 RPP where the amount of the transfer exceeds $5 million.
Table: Green Procurement
The table summarizes the initiatives and results attained by the Agency with respect to the integration of environmental performance considerations in procurement decision-making processes. Green procurement goals and results attained are also presented.
Table: Response to Parliamentary Committees and to External Audits
The table lists responses given to Parliamentary Committee reports, Auditor General of Canada reports and external audits concerning Agency activities in 2009-2010.
Table: Internal Audits 2009-2010
The table lists internal audit reports.
Table: Evaluations 2009-2010
The table lists evaluation reports.
3.4 Appendices
Appendix 1: Results of the Agency’s annual customer satisfaction survey
Appendix 2: Agency performance measurement methodology
Appendix 3: Technical notes on performance data in the results tables
Appendix 4: List of acronyms
Appendix 5: Agency Business Offices
Appendix 6: Resource-person and statute administered
Notes :
1 The Community Adjustment Fund, an initiative stemming from CEAP, is implemented through the Agency’s regular programs, Community Diversification and Business and Regional Growth.
2 In the 2009-2010 RPP, the Agency used the following three strategic outcomes:
- dynamic and revitalized communities that have a better socio-economic outlook and are developing their economic activity base
- presence of conditions conducive to sustainable growth and the competitive positioning of SMEs and regions
- policies, programs and cooperative actions that strengthen the economy of Quebec regions.
3 The Special infrastructure-dedicated programs program subactivity includes measures associated with CEAP, including the Recreational Infrastructure Canada program and the Contribution program to supply the Municipality of Shannon with drinking water.
4 The CAF comes under the Community adjustment to economic shocks program subactivity.
5 The leverage effect presented in this Report, as calculated by the Agency, compares financial assistance approved by the Agency with funding from the promoter and other funding sources. The leverage effect excludes funding associated with CEAP and the Infrastructure program activity.
6 Despite the economic context in 2009-2010, the Agency achieved a leverage effect comparable to the previous year. In 2008-2009, the leverage effect had been 2.64 for strategic outcome #1 and 2.71 for strategic outcome #2.
7 This result is taken from the Annual Customer Satisfaction Survey of the Economic Development Agency of Canada for the Regions of Quebec conducted by the Agency in winter 2010.
8 All the amounts presented in this table exclude services received without charge, except for the 2008-2009 actual expenditures column, where they represent $5.8 million. This affects the comparability of actual expenditures between 2008-2009 and 2009-2010.
9 Main Estimates are tabled in Parliament prior to the start of the fiscal year. Planned spending comprises the Main Estimates as well as additional authorities at the time of publication of the Report on Plans and Priorities. Total authorities therefore represent Main Estimates plus Supplementary Estimates for the year ending March 31, 2010. The Agency’s total actual expenditures must not exceed total authorities, but variations at the program activity level are possible.
10 For the 2009-2010 and subsequent Estimates cycles, resources allocated to Internal Services will be shown separately from those for other program activities, and will no longer be broken down among other program activities, as was the case in the latest Main Estimates. This change has an impact on the comparability of expenditures and information concerning FTEs for each program activity and fiscal year.
11 Priorities previously committed to are those established during the one or two fiscal years immediately prior to 2009-2010, whereas new priorities were established during 2009-2010.
12 In this Departmental Performance Report (DPR), a performance index is associated with each priority and with each performance indicator linked to program activities. The performance evaluation scale consists of the following levels: Exceeded expectations; Met all expectations; Mostly met expectations; Somewhat met expectations and Not met expectations and is defined by the Treasury Board of Canada Secretariat. The definitions are presented in Appendix 3 of the DPR: www.dec-ced.gc.ca/eng/publications/agency/rmr.html.
13 The amount of approved commitments excludes commitments associated with CEAP.
14 Idem
15 www.infoentrepreneurs.org/en/
16 www.ressourcesentreprises.org/Home.aspx
17 In the 2009-2010 RPP, no objective was identified for certain performance indicators, while objectives were set for most of the performance indicators presented in the 2010-2011 RPP.
18 The results presented concerning jobs created and maintained are taken from statements by promoters.
19 The results presented concerning tourism are taken from: Le tourisme en chiffres – Édition 2010 http://www.tourisme.gouv.qc.ca/publications/publication.php?id=209&categorie=50. They correspond to the latest results available on tourism, and cover 2008.
20 www.dec-ced.gc.ca/eng/programs/diversification/diversification.html
21 www.dec-ced.gc.ca/eng/programs/cfp/cfp.html
22 These performance data concern solely the Infrastructure Canada Program (ICP) and are associated with the agreement with the Government of Quebec. While all the objectives were attained prior to 2009-2010, it was deemed appropriate to present the ICP results, since the agreement terminates on March 31, 2011.
23 This was the Canada-Quebec Infrastructure Program Agreement: www.dec-ced.gc.ca/eng/programs/infrastructure/infrastructure.html
24 www.infc.gc.ca/infc-eng.html
25 www.dec-ced.gc.ca/eng/programs/infrastructure/ricpa.html
26 www.dec-ced.gc.ca/eng/programs/caf/caf.html
27 The decline in the number of strategic enterprises created or expanding, compared with 2008-2009, is attributable to the fact that in 2008-2009 the Agency funded an incubator involving a large number of projects. This incubator is now funded by the Agency under another component.
28 The results presented concerning job creation are taken from statements by promoters.
29 www.dec-ced.gc.ca/eng/programs/growth/growth.html
30 www.dec-ced.gc.ca/eng/agency/business-contact/contact.html
31 Investment in applied research projects includes investment from the Agency and other funding sources.
32 The results presented concerning jobs created and maintained in Quebec stemming from foreign direct investment are taken from: Montréal International, 2009 Activity Report: A winning partnership, p.8.
33 Ibid, p.13
34 Available on the CBOC Web site: www.conferenceboard.ca/ITIC/research.aspx
35 Available on the Metropolis Web site: im.metropolis.net/frameset_e.html
36 Available on the Université Laval Web site: www.rqsi.ulaval.ca/fr/bulletin.php
37 Presentations available on the Réseau de chercheurs Entrepreneuriat Web site: www.entrepreneuriat.auf.org/article.php3?id_article=187, and report available on the Research Institute for SMEs Web site: https://oraprdnt.uqtr.uquebec.ca/pls/public/gscw031?owa_no_site=862&owa_no_fiche=51&owa_apercu=N&owa_imprimable=N&owa_bottin=
38 www.dec-ced.gc.ca/eng/programs/forest/index.html
39 www.dec-ced.gc.ca/eng/programs/applying/cruise.html
40 www.dec-ced.gc.ca/eng/publications/agency/rmr.html
41 The increase in liabilities is primarily attributable to year-end payables ($54.5 million as at March 31, 2010 and $27.4 million as at March 31, 2009).
42 The total decrease in equity compared with last year is primarily attributable to the increase in operating costs and the smaller change in net position in the Consolidated Revenue Fund during 2009-2010.