ARCHIVED - Economic Development Agency of Canada for the Regions of Quebec - Report
 This page has been archived.
Archived Content
Information identified as archived on the Web is for reference, research or recordkeeping purposes. It has not been altered or updated after the date of archiving. Web pages that are archived on the Web are not subject to the Government of Canada Web Standards. As per the Communications Policy of the Government of Canada, you can request alternate formats on the "Contact Us" page.
2009-10
Departmental Performance Report
Economic Development Agency of Canada for the Regions of Quebec
The original version was signed by
The Honourable Christian Paradis
Minister of Natural Resources and Minister responsible for the Economic Development Agency of Canada for the Regions of Quebec
Table of contents
Message from the Minister responsible for the Agency
Message from the Minister of State for the Agency
2 Analysis of Program Activities by Strategic Outcome
 Message from the Minister responsible for the Agency
Following a year marked by hard economic times in all regions of Canada, I am pleased to sign this Departmental Performance Report, which presents the achievements of the Economic Development Agency of Canada for the Regions of Quebec.
The Government of Canada has adopted a proactive approach to combating the recession. The outcome of this is that Canada has been the least affected of any of the industrialized countries, while targeting and executing promising initiatives that will benefit future generations. It has invested additional effort in coming to the assistance of the hardest hit sectors, paying special attention to communities depending on a single industry. It has also continued to promote employment and growth with a view to supporting Canadian families.
Recognizing the importance of economic development agencies in helping communities and SMEs across the country, the Government of Canada set up two new agencies in 2009. The goal of this federal presence is to ensure that all regions of Canada can participate in the nation’s growth.
The Economic Development Agency of Canada for the Regions of Quebec, like the other economic development agencies, has sent a clear signal to business circles that it intends to continue supporting SMEs’ efforts. It has supported growth generating projects focussing on entrepreneurship, development and innovation— activities which are at the core of community and regional vitality, outreach and prosperity.
Despite the economic downturn, the government has stayed the course with regard to its original commitments, as stated in its Advantage Canada economic plan. Investing in research, innovation and market development is our core priority, and will enable Canadian enterprises to grasp new business opportunities.
The original version is signed by
Christian Paradis
Minister of Natural Resources and Minister responsible for the Economic Development Agency of Canada for the Regions of Quebec
 Message from the Minister of State for the Agency
I am proud to submit to Parliament the Departmental Performance Report of the Economic Development Agency of Canada for the Regions of Quebec for the period ending March 31, 2010.
As you read this Report, you will observe once again the timeliness and efficiency with which the Agency has implemented measures and programs that have helped communities and SMEs come to grips with the recent global economic crisis.
I am pleased to point out that as of March 31, 2010, in addition to the projects in line with Canada’s Economic Action Plan (CEAP), the Agency has supported the startup and continuation of 1,170 development projects. On average, each dollar invested by the Agency has led to $2.59 in investment by promoters and other funding sources.
In addition to its regular programming, the Agency has implemented ad-hoc initiatives in support of the communities and sectors hardest hit by the crisis. On that front, the Community Adjustment Fund and the Recreational Infrastructure Canada program, which stem from CEAP, have generated tangible results for Quebec communities. Forest communities have also been central to the Agency’s concerns and action, with the Agency signing agreements with the Government of Quebec and providing financial assistance to foster the creation and maintenance of jobs within those communities.
The economic crisis has had a major impact on several regions and sectors of activity. This Report, which presents the Agency’s performance over the past year, clearly shows the tangible effort and the measures implemented by the Government of Canada to help the hardest hit regions and communities get through these difficult times.
With an economic recovery on the horizon, the Agency has to continue its efforts to enable Quebec enterprises to take advantage of business opportunities and to allow communities to pursue their development.
The original version is signed by
Denis Lebel
Minister of State for the Economic Development Agency of Canada for the Regions of Quebec
1 Agency Overview
1.1 Summary information
1.1.1 Raison d’être
Object
Under its Act, which came into effect on October 5, 2005, the object of the Agency is to promote the long-term economic development of the regions of Quebec by giving special attention to those where slow economic growth is prevalent or opportunities for productive employment are inadequate. In carrying out its object, the Agency shall take such measures as will promote cooperation and complementarity with Quebec and communities in Quebec.
Vision
In the long term, Quebec’s regions and communities will have increased their development capabilities, dynamism and prosperity in a lasting and significant manner for the benefit of their citizens.
1.1.2 The Agency in action
The Agency’s aim is to increase the vitality of communities and strengthen the competitiveness of Quebec’s enterprises and regions. Through its 14 business offices and its advisors, it covers all areas of Quebec, working primarily with small and medium-sized enterprises (SMEs) and non-profit organizations (NPOs). The Agency provides consulting services, information services, financial assistance, analyses, and referral services to other government departments and agencies. It also acts with communities as an integral player in the mobilization, recovery or development of a given sector or targeted geographical area.
Regular programs:
- Community Diversification
- Business and Regional Growth
- Regional Development Research
Canada-wide program implemented in Quebec by the Agency:
- Community Futures Program (CFP)
Canada’s Economic Action Plan (CEAP) dedicated programs:1
- Recreational Infrastructure Canada (RInC)
- Contribution program to supply the Municipality of Shannon with drinking water
Furthermore, CEAP, tabled on January 27, 2009, provided the Agency with additional funding for Fiscal years 2009-2010 and 2010-2011. Used as an economic stimulus, this funding is intended to create employment opportunities and implement adjustment measures in communities affected by the economic downturn. In particular, CEAP includes the Recreational Infrastructure Canada program and the Community Adjustment Fund (CAF) initiative.
1.2 Strategic outcome and Program Activity Architecture (PAA)
Since April 1, 2010, the Agency’s PAA has combined its three strategic outcomes in a single one.2 This change was made purely for the purpose of clarification, and has no impact on the nature of its program activities. Thus, the framework of activities and related subactivities remains unchanged from the framework presented in the Report on Plans and Priorities (RPP) 2009-2010. Further information on the Agency's strategic outcome is given in Section 2.
| Strategic outcome | Program activities | Program subactivities | Internal Services |
|---|---|---|---|
| A competitive and diversified economy for the regions of Quebec | Community Development |
|
Government and management support Resource management services Asset management services |
| Infrastructure |
|
||
| Special intervention measures |
|
||
| Enterprise Competitiveness |
|
||
| Competitive positioning of sectors and regions |
|
||
| Policies, programs and initiatives |
|
1.3 Performance summary
This section provides an overview of planned and actual financial resources (grants and contributions, and operations) and human resources expressed as full-time equivalents (FTEs), along with a summary table portraying the Agency’s performance in 2009-2010.
| Financial resources for 2009-2010 (in thousands of dollars) |
||
|---|---|---|
| Planned spending | Total authorities | Actual expenditures |
| 305,392 | 445,134 | 398,055 |
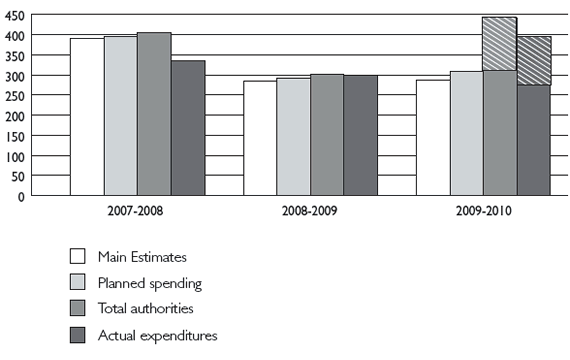
The variance between Planned spending and Total authorities is primarily attributable to the addition of funding for intervention under Canada’s Economic Action Plan, with a view to supporting the Canadian economy through the economic downturn.
The Agency made most of the expenditures authorized. More specifically, of the $132.3 million authorized under CEAP, $113.1 million was used, or 85.5%. The balance of these funds was carried forward to 2010-2011.
| Human resources for 2009-2010 (full-time equivalents) |
||
|---|---|---|
| Planned resources | Actual resources | Variance |
| 411 | 426 | 15 |
The variance of 15 FTEs primarily represents additional temporary resources hired in order to deliver CEAP.
Strategic outcome: A competitive and diversified economy for the regions of Quebec
| Performance indicators | Five-year target (from 2007-2008 to 2011-2012) | Performance 2009-2010 |
|---|---|---|
|
Indicator of the competitiveness and diversification level of Quebec regions Direct, indirect and induced impacts in terms of jobs and wealth generated |
The competitiveness and economic diversification of Quebec regions are maintained or increased. |
The Agency contributed to maintaining the vitality of 30 communities by helping them mobilize, create a plan and implement development and diversification initiatives; by strengthening the tourism offering; and by supporting the creation, development and maintenance of 407 SMEs. The Agency contributed to the competitiveness of SMEs and regions through the sales growth observed in 153 SMEs assisted; through the enhancement of 201 SMEs’ productivity; and through the creation and expansion of 98 innovative enterprises. The Agency developed its ability to cater to the needs of regions, communities and SMEs through development of policies geared to the needs of regions and enterprises; through the signing of research collaboration agreements; through the staging of awareness-raising activities concerning the Industrial and Regional Benefits Policy in Quebec; and through increased collaboration with the Government of Quebec. The Agency contributed to creating employment opportunities and implementing adjustment measures in communities affected by the economic downturn, in particular through the Community Adjustment Fund and the Recreational Infrastructure Canada program. Leverage effect:5 $1 from the Agency = $2.59 in investment by the promoter and other funding sources.6 Incentive aspect of financial assistance: Of promoters, 82.6%7 stated that without the assistance from the Agency, it would not have been possible to carry out the planned activities or carry through their project. Level of satisfaction: Of promoters, 93.1% stated that they were satisfied or very satisfied with the quality of the Agency’s service. |
(in thousands of dollars) Program activities |
2008-2009 Actual expenditures | 2009-20108,9 | Link to Government of Canada performance | |||
|---|---|---|---|---|---|---|
| Main estimates | Planned spending | Total authorities | Actual expenditures | |||
| Community Development | 145,906 | 120,972 | 138,936 | 140,736 | 140,750 | Strong economic growth |
| Infrastructure | 53,607 | 45,588 | 45,588 | 73,401 | 20,982 | Strong economic growth |
| Special intervention measures | --- | --- | --- | 100,115 | 99,482 | Strong economic growth |
| Enterprise Competitiveness | 56,466 | 71,961 | 71,961 | 73,839 | 69,847 | Strong economic growth |
| Competitive positioning of sectors and regions | 37,038 | 22,842 | 22,842 | 24,906 | 37,529 | Strong economic growth |
| Policies, programs and initiatives | 6,230 | 5,689 | 5,689 | 5,689 | 5,611 | Strong economic growth |
| Internal Services10 | --- | 20,376 | 20,376 | 26,448 | 23,854 | |
| Total | 299,247 | 287,428 | 305,392 | 445,134 | 398,055 | |
The difference between total planned spending and total actual expenditures is primarily attributable to additional funding under Canada’s Economic Action Plan. CEAP was voted and special intervention measures were developed in order to stimulate the economy. These activities will be continued in 2010-2011.
1.4 Contribution of priorities to strategic outcome
The Agency achieved its five priorities for 2009-2010: three program priorities, and two management priorities.
| Program priorities | Type of priority11 | Progress made12 | Links to program activities |
|---|---|---|---|
| Accelerate regions’ and communities’ adjustment to the new economic context | Previously committed to |
Met all expectations
|
Community Development The implementation in 2009-2010 of measures to ease the terms and conditions of the Community Diversification program has contributed to achieving the priority. |
| Reinforce the performance of innovative, competitive SMEs | Previously committed to |
Met all expectations
|
Enterprise Competitiveness The implementation in 2009-2010 of measures to ease the terms and conditions of the Business and Regional Growth program has contributed to achieving the priority. |
| Implement the Regional Development Research program | New |
Met all expectations
|
Policies, programs and initiatives |
| Continue implementing the Departmental plan for enhancing program effectiveness | Previously committed to |
Mostly met expectations
|
Internal Services The evaluation of implementation of the Community Diversification and Business and Regional Growth programs recommends the Agency complete the planned risk-oriented initiatives and convey progress to employees. |
| Reinforce Departmental performanceand risk-based monitoring, analysis and decision making | Previously committed to |
Met all expectations
|
Internal services The evaluation of the Management Accountability Framework – Round VII mentions that the Agency should continue taking risk into account in decision-making processes. |
1.5 Risk analysis
The Agency’s intervention in relation to Quebec’s enterprises, regions and communities took place against the backdrop of an economic downturn. Indeed, 2009-2010 was characterized by lower projections for economic growth in Quebec and in Canada as a whole. Several external factors, such as the U.S. recession, disruption of global financial markets and tighter credit affected, to different degrees, a number of sectors which form the backbone of the economies of Quebec’s regions. These conditions meant there was weaker export demand, a contracting labour market and declining household consumption.
More specifically, Quebec’s gross domestic product fell back by 1.3% in 2009, following a 1.3% increase in 2008. International commodity exports shrank by 14.1% over the same period. The unemployment rate rose by 1.3%, moving up from 7.2% to 8.5%, and 37,500 jobs were lost.
This economic context made it harder for the Agency to achieve results. It had to ensure that it continued to cater adequately to the needs of Quebec’s enterprises and regions, at a time when SMEs were being more cautious in their investment decisions.
To mitigate the risk associated with the economic context, the Agency eased its operating guidelines concerning the terms and conditions of its two main programs so as to make them more accessible for SMEs and communities.
The Agency was also a key player in the implementation in Quebec of the initiatives associated with Canada’s Economic Action Plan. It devoted considerable effort to placing rapidly at the disposal of enterprises and regions funding sources available through the Community Adjustment Fund and the Recreational Infrastructure Canada program. These two initiatives, which will be continued in 2010-2011, are aimed at mitigating the impact of the economic downturn in the short term by contributing to the creation and maintenance of employment.
1.6 Expenditure profile
The Agency’s actual expenditures (including operating expenditures) for 2009-2010 stood at $398.1 million, or $285.0 million for regular programming and $113.1 million for Canada’s Economic Action Plan.
The Agency’s actual expenditures amounted to $342.0 million in grants and contributions, including $235.2 million for regular programs and $106.8 million for CEAP. The increase in grant and contribution expenditures since 2008-2009 is primarily attributable to CEAP, which aims to support the Canadian economy through the economic downturn.
The figure below shows the Agency’s spending trend over the past three years. The hatched segments of the two rightmost columns, for 2009-2010, represent the portion of total authorities and actual expenditures attributable to CEAP.
Departmental Spending Trend
(in millions of dollars)
Canada’s Economic Action Plan
The 2009 federal budget allocated $312.9 million in funding to the Agency over two years, in support of Canada’s Economic Action Plan. In 2009-2010, total authorities associated with CEAP amounted to $132.3 million, whereas actual expenditures were some $113.1 million.
The Agency received, in Budget 2009, $210.9 million in funding over two years for the CAF. In 2009-2010, the Agency spent $99.5 million for that economic stimulus initiative, which is intended to mitigate the impact of the economic downturn in the short term by contributing to the creation and maintenance of employment, while responding to the challenges of transition and community adjustment.
The Recreational Infrastructure Canada program is a Canada-wide initiative aimed at contributing to mitigating the impact of the global recession by increasing the total value of construction activities associated with recreational infrastructure. The goal of projects funded by this program is primarily to modernize, repair, replace or expand existing recreational infrastructure, such as swimming pools, arenas and sports fields. Under CEAP, $80.4 million in funding over two years was allocated to the Agency for RInC. Actual expenditures associated with this initiative in 2009-2010 were some $2.1 million. The Agency plans to spend $77.9 million in 2010-2011 (total authorities).
In 2009-2010, the Agency also paid out $6.4 million for the Contribution program to supply the Municipality of Shannon with drinking water; $3.2 million for the Pavillon de l’éducation physique et des sports (PEPS) of Université Laval (sports and physical education facility); and $1.9 million for Info entrepreneurs15 in Montréal and Ressources Entreprises16 in Québec, the two Canada Business Network (CBN) Service Centres for Quebec.
1.7 Voted and statutory items
| (in thousands of dollars) | 2007-2008 | 2008-2009 | 2009-2010 | |||
|---|---|---|---|---|---|---|
| Vote or statutory item (S) | Truncated vote or statutory wording | Actual expenditures | Actual expenditures | Main Estimates | Actual expenditures | |
| 1 | Operating expenditures | 45,663 | 45,955 | 41,880 | 49,872 | |
| 5 | Grants and contributions | 285,784 | 242,518 | 240,435 | 246,245 | |
| (S) | Grants and contributions (CAF) | --- | --- | --- | 95,749 | |
| (S) | Contribution to employee benefit plans | 4,934 | 4,922 | 5,113 | 6,162 | |
| (S) | Minister for the Economic Development Agency of Canada for the Regions of Quebec – Salary and motor car allowance | --- | 24 | --- | 2 | |
| (S) | Spending of proceeds from disposal of surplus Crown assets | 4 | 2 | --- | 25 | |
| Total | 336,385 | 293,421 | 287,428 | 398,055 | ||
Total grant and contribution expenditures (Vote 5) are much the same as in 2008-2009; however, spending variations occurred at the program activity level.
The main variance is attributable to the addition of funds associated with CEAP in 2009-2010, which terminates March 31, 2011. The impact of this addition is also reflected in the higher operating expenditures.
2 Analysis of Program Activities by Strategic Outcome
This section provides information on the Agency’s strategic outcome, challengesand program activities.
2.1 Strategic outcome: A competitive and diversified economy for the regions of Quebec
This strategic outcome reflects the object of the Act establishing the Economic Development Agency of Canada for the Regions of Quebec: to promote the development and diversification of the economy of the regions of Quebec. This single strategic outcome, compared with the three strategic outcomes presented in the RPP 2009-2010, provides for better integration between development of communities and competitiveness of enterprises and regions.
The Agency’s contributions to Quebec communities and SMEs generated a leverage effect of 2.59. The $721.4 million in multiyear financial assistance approved led to $1.87 billion in investment from promoters and other funding sources.
2.1.1 Challenges associated with the strategic outcome
For communities
Several regions or communities whose economy is traditionally based on natural resources and which are generally far from the major markets are having difficulty diversifying their economic base. Owing to their heavy economic dependency on a small number of industries or sectors, these communities are often hardest hit in the event of a crisis. The global economic downturn has led to even greater adjustment difficulties for communities posting slow economic growth, and those dependent on traditional economic sectors or the manufacturing sector.
In this context, the Agency pursues its object of helping Quebec communities posting slow economic growth increase their development capability and dynamism. The Agency thus supports these communities so they have economic adjustment capability. It also provides support for the emergence of new entrepreneurs and development of local and regional enterprises, while supporting the tourism sector. The Agency also intervenes financially in communities to renew and construct infrastructure associated with drinking water and local transportation, for instance, as well as cultural, sports and tourism infrastructure, to improve citizens’ quality of life.
For SMEs
Enterprises and regions operate in a context featuring a strong process of economic integration in which several emerging economies are present. Combined with the growing pace of technological progress, this generates multiple opportunities (access to new markets and new ideas) but also brings substantial adjustments (redeployment of workers, new business models). It is through an increase in the competitiveness of SMEs and regions that wealth and employment will be created.
The economic downturn has had and continues to have a negative impact on the growth and competitive positioning of SMEs and regions. In that context, the Agency is continuing its work with economic development agents and pursuing its efforts to help enterprises and regions take advantage of the fragile economic recovery.
2.1.2 Program activities in line with the strategic outcome
In line with its strategic outcome, the Agency intervenes in six areas of activity:
- Community Development
- Infrastructure
- Special intervention measures
- Enterprise Competitiveness
- Competitive positioning of sectors and regions
- Policies, programs and initiatives
These program activities are implemented in the form of financial assistance accessible through the 14 business offices, which also provide consulting and information services, and an Infrastructure Branch. In addition, to support the development and implementation of policies and programs, the Agency analyses the needs of Quebec regions and communities with respect to regional economic development, in conjunction with its federal and Government of Quebec partners. This strategic outcome contributes to attainment of one of the outcomes targeted by the Government of Canada: strong economic growth.
2.2 Program activities
The following subsection presents all program activities along with the initiatives specific to Canada's Economic Action Plan.
2.2.1 Program activity: Community Development
| 2009-2010 | |||||
|---|---|---|---|---|---|
| Financial resources (in thousands of dollars) |
Human resources (full-time equivalents) |
||||
| Planned spending | Total authorities | Actual expenditures | Planned resources | Actual resources | Variance |
| 138,936 | 140,736 | 140,750 | 118 | 100 | (18) |
Actual expenditures in Fiscal Year 2009-2010 were slightly higher (1.3%) than planned spending. This represents minimal financial variance within the framework of normal management of operations.
| Expected results | Performance indicators | Objectives17 | Status of performance | Summary of performance |
|---|---|---|---|---|
| Communities are pursuing a development vision and implementing resulting initiatives. | Number of communities that have mobilized, established development or diversification plans and implemented development or diversification initiatives. | 30 | Met all expectations | 30 |
| Number of mobilization or joint action activities | No objective set | N/A | 273 activities which mobilized 1,635 participants | |
| Enterprises are contributing to community economic growth and maintenance. | Proportion of SMEs assisted that maintained or increased their sales | 70% | Exceeded expectations | 73% |
| Number of enterprises created and developed | No objective set | N/A | 165 | |
| Number of enterprises maintained | No objective set | N/A | 48 | |
| Number of jobs created and maintained18 | No objective set | N/A | 2,053 | |
| Communities are recognized for their distinctiveness, brand image and outreach. | Value of investment in community facilities | $100 million | Mostly met expectations | $83.7 million |
| Increase in number of tourists from outside Quebec | No objective set | N/A | (386,000)19 |
Program activity summary
A community’s vitality depends on its ability to develop by building on its own assets. The Agency promotes the dynamism of Quebec’s communities by helping them maintain and develop their economic activity base.
The economic downturn, brought on among other things by the higher Canadian dollar, tighter credit for SMEs and declining North American demand, affected all Quebec regions and the different sectors of economy activity. Thus, numerous communities in outlying regions whose economies are heavily dependent on natural resources were especially hard hit by this slowdown. For instance, the forestry sector, which has experienced various difficulties in the past few years, saw demand for wood and newsprint products plummet, translating into the loss of 34,000 direct jobs between October 2008 and April 2010. Other communities in the central regions saw their exports of manufactured products decline, also leading to numerous job losses.
In view of this special economic context, the Agency’s action aimed to focus on displaying the potential of those regions so as to help them diversify and cope with the economic downturn.
The objectives pursued by the Community Development program activity were:
- community mobilization: fostering communities’ development and increasing their mobilization by drawing up visions and projects or local and regional scope
- local development: assisting communities through support for entrepreneurship and through creation or maintenance of viable enterprises
- attractive communities: increasing communities’ capability to attract tourists.
The Agency provided direct support to SMEs and NPOs through two grant and contribution programs: the Community Diversification20 program and the Community Futures Program21.
Canada’s Economic Action Plan initiative
Initiative: Pavillon de l’éducation physique et des sports (PEPS) of Université Laval
| 2009-2010 | |||||
|---|---|---|---|---|---|
| Financial resources (in thousands of dollars) |
Human resources (full-time equivalents) |
||||
| Planned spending | Total authorities | Actual expenditures | Planned resources | Actual resources | Variance |
| --- | 3,750 | 3,223 | --- | --- | --- |
As the PEPS project was initiated during the year, no spending was planned at the start of 2009-2010.
Under CEAP, the Agency provided Université Laval with $4.5 million in funding for its Pavillon de l’éducation physique et des sports (sports and physical education facility), of which $3.2 million was paid out in 2009-2010. This funding will help increase hosting capacity at major events and make it possible to provide broader sports programming.
Benefits for Canadians
This program activity enables Quebec regions and communities to maintain and develop their economic activity base. This is all the more crucial since the recent economic downturn had generated a negative impact on communities' vitality, witness the increase in the number of vulnerable communities, the closing of SMEs of local and regional scope, and the drop in the number of tourists from outside Quebec. Consequently, action by the Agency that fosters an increase in these communities’ vitality contributes to stronger economic growth in Quebec and in Canada as a whole.
Performance analysis
In addition to the performance presented in the above table, this section of the report contains a more comprehensive analysis of the results associated with the Community Development program activity.
The total value of the 599 projects under this program activity in 2009-2010 amounted to $1.4 billion. A total of $402.7 million came from the Agency on a multiyear basis, so the leverage effect was 2.47. In other words, for each dollar invested by the Agency, $2.47 was invested by the promoter and other funding sources. Despite the economic context of 2009-2010, the Agency presented a leverage effect comparable to the 2.64 posted in 2008-2009.
Overall, the Agency’s performance in 2009-2010 meets expectations. Communities have mobilized, created development and diversification plans and implemented initiatives in that regard.
Among the communities supported by the Agency:
Diversification of the economy of Valleyfield
- Description: Following the announcement of the closure of the Goodyear plant, and the accompanying loss of hundreds of jobs, a recovery plan was drawn up for the economic diversification of the Valleyfield community.
- Agency contribution: Financial assistance of $3.2 million out of a total cost of $27 million. The Agency took part in the activities of the recovery committee and provided financial support for 10 or so projects.
- Main results: The projects led to the startup and modernization of enterprises in the community, reinforcement of its economy and creation of 116 jobs.
Despite the backdrop of an economic downturn in 2009-2010, 73% of the SMEs assisted by the Agency have maintained or increased their sales—the same level as in 2008-2009. Moreover, 2,053 jobs were created or maintained within the SMEs receiving assistance.
Under the Community Futures Program, the Agency provided financial support for local and regional development agencies: the 57 Community Futures Development Corporations (CFDCs) located in designated rural regions, the 14 Community Economic Development Corporations located in disadvantaged urban areas and the 10 Business Development Centres located in peri-urban areas. In 2009-2010, the Agency spent $42.6 million to support these organizations. Of that amount, $16.6 million went to the Business Support Fund, which facilitated access to funding and services for enterprises in the manufacturing, tourism, and strategic and technological tertiary sectors in regions outside Quebec’s major urban centres.
As of March 31, 2010, CFDCs had achieved the following results through their current projects:
- a total of $136.4 million invested in startup enterprises
- 1,173 jobs created in the 353 enterprises created
- 7,794 jobs created and maintained in the 976 expanding enterprises
- 2,465 enterprises in acquisition, recovery, expansion or modernization received guidance services.
In all, 83.7% (or $83.7 million out of the planned $100 million) of investment planned for 2009-2010 in community facilities was made, mostly met expectations. Expenditures depend on the progress of projects, and the status of a large-scale project can affect investment made during the year.
Lessons learned
The economic downturn of the past year has had an impact on the Agency’s ability to fulfil its mandate and attain its expected results. To mitigate the impact of the unfavourable economic situation, the Agency implemented in 2009-2010 measures to ease the terms and conditions of the Community Diversification program. These changes led to a broadening of the target clientele, activities and eligible expenditures. As a result, the Agency was able to respond more effectively to the needs of enterprises and communities.
2.2.2 Program activity: Infrastructure
| 2009-2010 | |||||
|---|---|---|---|---|---|
| Financial resources (in thousands of dollars) |
Human resources (full-time equivalents) |
||||
| Planned spending | Total authorities | Actual expenditures | Planned resources | Actual resources | Variance |
| 45,588 | 73,401 | 20,982 | 14 | 10 | (4) |
Actual expenditures in Fiscal Year 2009-2010 were 54% lower than planned spending. Actual expenditures depend on the progress of infrastructure projects. Under agreements signed with the Government of Canada, the Government of Quebec is the implementing authority for most infrastructure programs.
| Expected results | Performance indicators | Objectives | Performance status | Performance summary22 |
|---|---|---|---|---|
| Rural and urban communities have quality public infrastructure. | Municipalities have quality drinking water available. | As per agreement with the Government of Quebec | Met all expectations |
3,873 households have access to a municipal water supply. 549,744 households have access to a municipal water supply providing higher quality drinking water. 19,063 additional households have access to a municipal wastewater collection and treatment system. 847,788 households have access to a municipal wastewater collection system providing higher quality treatment. |
| Municipalities benefit from safe transportation infrastructure. | As per agreement with the Government of Quebec | Met all expectations | 262 municipalities benefit from the establishment or upgrading of transportation infrastructure. | |
| Maintenance and renewal of assets improve communities’ economic activity base. | As per agreement with the Government of Quebec | Met all expectations | 90 municipalities benefit from the maintenance or upgrading of sports, recreational or cultural facilities. |
Program activity summary
The quality of community infrastructure has an impact on the quality of life of citizens. Quality infrastructure enables communities to attract and retain enterprises and workers that will secure their economic and social future. It also makes the movement of people and goods more efficient and safer.
In this spirit, an agreement with the Government of Quebec, signed in 2000 and in effect until March 31, 2011, led to implementation of the Infrastructure Canada Program.23 The ICP is aimed at the repair, replacement or construction of infrastructure, and includes three components: drinking water and wastewater infrastructure, local transportation infrastructure, and projects with urban or regional economic impacts. The Agency paid out $12.0 million for the ICP in 2009-2010, and is the program manager with full responsibility for the program, while the Government of Quebec is the implementing authority for the program.
The Agency also partners with Infrastructure Canada in delivering the Municipal Rural Infrastructure Fund, the Building Canada Fund and the Canadian Strategic Infrastructure Fund. Infrastructure Canada will report on the activities and results associated with these funds in its own Departmental Performance Report.24
Canada’s Economic Action Plan initiatives
Initiative: Recreational Infrastructure Canada Program
| 2009-2010 | |||||
|---|---|---|---|---|---|
| Financial resources (in thousands of dollars) |
Human resources (full-time equivalents) |
||||
| Planned spending | Total authorities | Actual expenditures | Planned resources | Actual resources | Variance |
| --- | 20,154 | 2,118 | --- | 7 | 7 |
Since the RInC was initiated during the year, no spending was planned at the start of 2009-2010. Actual expenditures are lower than total authorities; nevertheless, the unspent part of the funding was carried forward to 2010-2011. The Agency plans to spend $77.9 million in 2010-2011 (total authorities).
Announced in January 2009 and administered by the Agency, the RInC,25 is an initiative under Canada’s Economic Action Plan to provide economic stimulus in the short term. This two-year financial contribution program will lead to renovation of recreational infrastructure. The program is intended to increase construction activities for recreational infrastructure and create jobs.
The Agency administers the program jointly with two Government of Quebec departments: the ministère de l’Éducation, du Loisir et du Sport and the ministère des Affaires municipales, des Régions et de l’Occupation du territoire. These two departments are the program’s lead players for all funding applications other than those from First Nations, which are handled through the Agency.
Initiative: Contribution Program to Supply the Municipality of Shannon with Drinking Water
| 2009-2010 | |||||
|---|---|---|---|---|---|
| Financial resources (in thousands of dollars) |
Human resources (full-time equivalents) |
||||
| Planned spending | Total authorities | Actual expenditures | Planned resources | Actual resources | Variance |
| --- | 6,437 | 6,437 | --- | --- | --- |
Since the Contribution program to supply the Municipality of Shannon with drinking water was initiated during the year, no spending was planned at the start of 2009-2010.
The Contribution program to supply the Municipality of Shannon with drinking water, a CEAP initiative, enabled the municipality of Shannon to obtain a non-repayable financial contribution of $13.3 million for the establishment of a drinking water system supplied from a groundwater source and construction of a reservoir and a pumping station. Of that amount, $6.4 million was paid out in 2009-2010.
Benefits for Canadians
The ICP enables many Canadian communities to:
- enhance the quality of the environment
- support long-term economic growth
- upgrade community infrastructure
- build 21st-century infrastructure through best technologies and practices and new approaches.
RInC targets the modernization and renovation of recreational facilities with a view to providing communities with service infrastructure that can contribute, among other things, to their community, cultural, economic, sports or tourism growth.
The Contribution program to supply the Municipality of Shannon with drinking water will enable the 700 households in the municipality of Shannon to have access to a quality drinking water system.
Performance analysis
ICP projects approved since the start of the program have enabled 3,873 households that previously had no access to drinking water to have access through a municipal water supply; 549,744 households to have access to a municipal water supply providing higher quality drinking water; 19,063 households that previously had no access to a municipal wastewater collection and treatment system to have access; and 847,788 households to have access to a municipal wastewater collection system providing better treatment. They have also enabled 262 communities to benefit from upgraded local transportation infrastructure and a further 90 communities to benefit from upgrading of sports, recreational and cultural facilities. Finally, the projects have created 880 permanent direct jobs. The end-of-program evaluation for the ICP will provide information on project results.
Under CEAP, a total of 204 projects aimed at increasing construction activities associated with recreational infrastructure were approved and are in startup phase. Federal contributions represent a quarter of the total cost of the projects, amounting to $295.6 million as of March 31, 2010.
Among RInC projects contributing to a community’s economic and sports growth:
Lambton – arena refit and expansion
- Description: Fitting out of new dressing rooms and sanitary facilities in the Lambton arena, in Estrie, in partnership with the municipality of Lambton and the Government of Quebec.
- Agency contribution: $141,785 committed by the Agency out of a total cost of more than $425,000.
- Main results: Hosting of larger-scale hockey tournaments.
The first phase of the Contribution program to supply the Municipality of Shannon with drinking water ($6.4 million for construction and fitting up of the pumping station, wells, reservoir and aqueduct) was concluded on March 31, 2010. Phase II ($6.9 million for construction of the aqueduct along Highway 369 and commissioning) will complete the project in 2010-2011.
Lessons learned
Budget 2009 provided for the acceleration and expansion of Government of Canada investment in infrastructure. The Agency assumed responsibility for delivering the Recreational Infrastructure Canada program through an agreement with the Government of Quebec, as well as fulfilling its responsibilities with respect to other infrastructure programs, in particular the ICP.
2.2.3 Program activity: Special intervention measures
Program activity summary
Special intervention measures come to the assistance of communities and regions facing significant economic shocks or natural disasters. The Agency does not have funds devoted to this program activity.
This program activity has two goals:
- Community adjustment to economic shocks: facilitate the identification and implementation of development and diversification opportunities in communities hit by significant job losses. The Agency assists communities and regions facing major economic shocks.
- Community adjustment to natural disasters: facilitate the adjustment of communities facing natural disasters.
Canada’s Economic Action Plan initiative
Initiative: Community Adjustment Fund
| 2009-2010 | |||||
|---|---|---|---|---|---|
| Financial resources (in thousands of dollars) |
Human resources (full-time equivalents) |
||||
| Planned spending | Total authorities | Actual expenditures | Planned resources | Actual resources | Variance |
| --- | 100,115 | 99,482 | --- | 30 | 30 |
Since the CAF was initiated during the year, no spending was planned at the start of 2009-2010.
The 2009 federal budget gave the Agency $210.9 million in funding over two years, in support of CEAP, under the Community Adjustment Fund.26 Of that amount, $99.5 million was spent in 2009-2010, and the Agency plans to spend $111.4 million in 2010-2011 (total authorities). The CAF is an economic stimulus initiative aimed at mitigating the impact of the economic downturn in the short term by contributing to the creation and maintenance of jobs, while meeting challenges with respect to transition and community adjustment. This initiative terminates on March 31, 2011.
The CAF was implemented through the existing programs, Community Diversification and Business and Regional Growth. Two means were used: direct contributions to enterprises’ and NPOs’ projects, and agreements with the Government of Quebec. These two means led to the rapid creation and the maintenance of jobs in communities hard hit by the economic downturn.
Benefits for Canadians
The CAF primarily targets non-urban regions where employment opportunities are more limited in an economic downturn. So this Fund will help create, by the end of the initiative, temporary and permanent job opportunities and help Quebec regions get through the economic slowdown.
Performance analysis
On the one hand, delivery of the CAF was effected by the Agency, directly with promoters, through the existing programs, Community Diversification and Business and Regional Growth. A total of 199 projects were approved, generating $278.7 million in investment in enterprises and communities. To date, the Agency’s financial support has helped maintain or develop 133 enterprises in 123 communities, which have thus increased or improved their development opportunities.
Among projects supported targeting job creation and maintenance:
Drummondville Economic Development Authority
- Description: Construction of a second industrial incubator on the site of the Maison de l’industrie in Drummondville that can accommodate seven new manufacturing or technological enterprises.
- Agency contribution: $500,000
- Main results: Will lead to the creation of 15 jobs.
On the other hand, seven agreements were signed with the Government of Quebec. These Canada-Quebec Agreements – Job Creation Initiatives have led to the creation and maintenance of jobs through silvicultural operations carried out in public and private forests and restoration of bridges and culverts on forest multi-use roads in the different regions of Quebec, thus:
- Six agreements were entered into to perform silviculture work for the period 2009-2011, particularly for the rehabilitation of poorly regenerated areas, rehabilitation of hardwood forests and intensive silviculture operations. The projects implemented through these agreements were the subject of consultation among local stakeholders. The joint contribution of the Government of Canada and the Government of Quebec amounts to $200 million over two years, including $100 million from the Agency. Of this amount, the Agency paid out $59 million in 2009-2010.
- Another agreement was signed to perform restoration work on watercourse crossings on forest multi-use roads on Quebec public lands. Their condition limits access to regional resort infrastructure and hampers the practice of outdoor activities. Several Quebec regions are benefitting from this joint funding, amounting to $30 million over two years, $15 million of it from the Agency. Of this amount, the Agency paid out $4.4 million in 2009-2010.
Lessons learned
Back in spring 2009, the Agency set up the CAF through the existing Community Diversification and Business and Regional Growth programs. This made it possible to facilitate the processing of funding applications, thus accelerating the process of awarding funding to communities and SMEs. CAF criteria and terms and conditions (level of assistance, and eligible expenditures and clientele) were also developed so that the initiative could be more easily accessible for Quebec communities and SMEs, with a view to helping the regions of Quebec get through the economic downturn.
2.2.4 Program activity: Enterprise Competitiveness
| 2009-2010 | |||||
|---|---|---|---|---|---|
| Financial resources (in thousands of dollars) |
Human resources (full-time equivalents) |
||||
| Planned spending | Total authorities | Actual expenditures | Planned resources | Actual resources | Variance |
| 71,961 | 73,839 | 69,847 | 53 | 46 | (7) |
Actual expenditures in Fiscal Year 2009-2010 were slightly lower (-2.9%) than planned spending. This represents minimal financial variance within the framework of normal management of operations.
| Expected results | Performance indicators | Objectives | Performance status | Performance summary |
|---|---|---|---|---|
| Assisted enterprises are using their strategic capabilities. | Proportion of SMEs assisted having maintained or increased their sales. | 70% | Mostly met expectations | 67% |
| Number of enterprises which have improved their value chain management or integrated a value chain. | 140 | Exceeded expectations | 201 | |
| Average increase in foreign sales | No objective set | N/A | $1,036,747 | |
| Products and services derived from Research and development R&D are being commercialized. | Average increase in sales of products and services derived from R&D | No objective set | N/A | $571,160 |
| New enterprises and strategic capital investments are consolidating the economic base of the regions. | Number of innovative enterprises created or expanding | No objective set | N/A | 9827 |
| Number of created jobs28 | No objective set | N/A | 607 |
Program activity summary
This program activity enables enterprises to improve their performance and become more competitive by increasing their productivity, revenue earned and job levels, thus contributing to creating conditions conducive to sustainable growth.
In 2009-2010, the Agency’s financial support with respect to competitiveness was aimed at helping enterprises deal with the U.S. and global economic slowdown and the climate of economic uncertainty (tighter credit and lower corporate profits) in order to lessen their impact on enterprises’ exports and productivity.
On top of the difficulties associated with the recent economic situation, which tends to have a greater impact on enterprises involved in innovation and exports, enterprises still face the challenges associated with globalization, low productivity and insufficient innovation. These issues are taken into account by the Agency in its support for SMEs’ competitiveness. Quebec productivity still lags behind the productivity of Canada and the majority of Organisation for Economic Cooperation and Development countries, whence the need to pursue efforts with respect to investment in machinery and equipment. Moreover, Quebec enterprises, while relatively active in R&D, have difficulty commercializing their innovations—this is particularly the case with SMEs.
In the current economic environment, competitiveness depends on enterprises’ ability to innovate with respect to products and processes and makes it also necessary to integrate with distributors’ and manufacturers’ global networks.
To support the competitive of enterprises (SMEs), the Agency has two goals:
- development of enterprises’ capabilities – by improving SMEs’ capabilities with respect to management, innovation, adoption of advanced technology, market development, and integration with globalized production chains
- development of strategic enterprises – by supporting the establishment and first phases of expansion of enterprises in economic activities deemed strategic for a region’s development so as to consolidate its economic base.
This program activity primarily targets SMEs and NPOs, and is implemented through the Business and Regional Growth grant and contribution program.29
Canada’s Economic Action Plan initiative
Initiative: Canada Business Network (CBN)
| 2009-2010 | |||||
|---|---|---|---|---|---|
| Financial resources (in thousands of dollars) |
Human resources (full-time equivalents) |
||||
| Planned spending | Total authorities | Actual expenditures | Planned resources | Actual resources | Variance |
| --- | 1,875 | 1,875 | --- | --- | --- |
Since the CBN was initiated during the year through CEAP, no spending was planned at the start of 2009-2010.
Under CEAP, the Agency planned $3.8 million in funding, of which $1.9 million was paid out in 2009-2010, to the two Canada Business Network Service Centres in Quebec: Info entrepreneurs in Montréal, and Ressources Entreprises in Québec. These service centres provide business information and referral services to guide entrepreneurs toward specialized resources.
Benefits for Canadians
Better productivity, increased innovation capability and enhanced commercialization of innovation increase enterprises’ performance and competitive advantages and foster the establishment of innovative enterprises. Increases in corporate revenues and the number of jobs contribute to the presence of conditions conducive to enterprises’ sustainable growth. SMEs’ enhanced competitiveness thereby contributes to strengthening economic growth.
Performance analysis
In addition to the performance presented in the above table, this section of the report contains a more comprehensive analysis of the results associated with the Enterprise Competitiveness program activity.
The total value of the 485 projects under this program activity amounted to $799.3 million. About a quarter ($187.6 million) of this amount came from the Agency’s contributions, so the leverage effect was 3.26. In other words, for each dollar invested by the Agency in 2009-2010, $3.26 was invested by the promoter and other funding sources. Despite the economic context in 2009-2010, the Agency presented a leverage effect slightly higher than the previous year’s level of 3.06.
The Agency funded regional export promotion organizations (ORPEXs) to the tune of some $2 million. Each year, more than 1,000 SMEs benefit from the activities and services provided by the 14 ORPEXs, whose mandate is to help enterprises prepare, plan and undertake an export process in order to increase their foreign sales. Their service offering contributes to the development and enhancement of SMEs’ market development capability, so they can take advantage of business opportunities available on foreign markets. Moreover, 122 SMEs receiving assistance from ORPEXs became exporting SMEs in 2009-2010.
By means of its financial support for innovation management, the Agency aims to enable enterprises to increase or improve their innovation capability. Through a $17.7-million contribution from the Agency to 22 enterprises, those enterprises were able to invest a total of $37.8 million in equipment, technology and processes.
Among the strategic enterprises supported exhibiting innovation capability:
Cycles Devinci inc.
- Description: Enterprise specializing in the design and manufacture of bicycle frames, presenting a need to modify its production line in order to manufacture a new bicycle stemming from its research and innovation work—the Bixi self-serve city bike.
- Agency contribution: Accompaniment of the client and financial support of $131,500 out of a total cost of $363,000, in particular for purchase of equipment and organization of an assembly line.
- Main results: The promoter estimates that 10 jobs will be created.
The Agency also organized two Business Contact30 events, in the Côte-Nord and Outaouais regions. These events are aimed at raising awareness and providing information and details concerning business startup and growth, innovation, productivity, exports, and the strategic issues specific to each of the regions. In all, 357 entrepreneurs and economic agents took part in these events.
Also, to provide enterprises with an ongoing information service, the Agency provides financial support for Canada Business Service Centres which answered 25,811 information requests, of which 3,911 directly at the counter and 16,844 by telephone.
Lessons learned
The economic downturn of the past year has had an impact on the Agency's ability to fulfil its mandate and attain its expected results. To mitigate the impact of the unfavourable economic situation, the Agency implemented measures in 2009-2010 to ease the terms and conditions of the Business and Regional Growth program. These changes led to a broadening of the target clientele, activities and eligible expenditures. As a result, the Agency was able to respond more effectively to the needs of enterprises and communities.
2.2.5 Program activity: Competitive positioning of sectors and regions
| 2009-2010 | |||||
|---|---|---|---|---|---|
| Financial resources (in thousands of dollars) |
Human resources (full-time equivalents) |
||||
| Planned spending | Total authorities | Actual expenditures | Planned resources | Actual resources | Variance |
| 22,842 | 24,906 | 37,529 | 36 | 30 | (6) |
Actual expenditures for Fiscal Year 2009-2010 were 64.3% higher than planned spending. In the context of an economic downturn, the Agency successfully adapted by redirecting resources to projects presenting attractive business opportunities in order to revive the international competitiveness of sectors and regions. This choice was in line with the Government of Canada’s priorities, in that it contributed to the economy of the future.
| Expected results | Performance indicators | Objectives | Performance status | Performance summary |
|---|---|---|---|---|
| Competitiveness poles are being developed and consolidated. | Number of enterprises networked or taking part in networks | No objective set | N/A | 1,027 |
| Clusters or networks of enterprises in the same sector or region are better structured. | Investment31 in applied research projects | No objective set | N/A | $95.8 million |
| The innovation commercialization process is generating medium- and long-range economic and social spinoffs. | Number of technology transfers | No objective set | N/A | 542 |
| Competitive regions are attracting foreign direct investment and international organizations. | Jobs created and maintained in Quebec as a result of foreign direct investment32 | No objective set | N/A | 2,907 |
| Number of new international organizations established in Montréal33 | No objective set | N/A |
2 |
Program activity summary
This program activity is intended primarily for SMEs and NPOs, and is supported by the Business and Regional Growth grant and contribution program.
Enterprises and regions have operated in a context featuring an economic downturn and a strong process of economic integration in which the growing presence of emerging economies (e.g. China, India, etc.) is seen. Combined with the growing pace of technological progress, this generates multiple opportunities (access to new markets and new ideas) but also brings substantial adjustments (redeployment of workers, new business models). It is through an increase in the competitiveness of SMEs and regions that the negative impact of this context on the creation of wealth and employment will be reduced.
The two objectives targeted by this program activity are:
- To develop competitive regional poles and national- and international-calibre poles of excellence. To achieve this, the Agency supports innovation and networking of knowledge players; it supports development of a critical mass of knowledge in sectors and regions; and it encourages technology enhancement and transfer.
- To enhance the international competitiveness of Quebec regions. To achieve this, the Agency supports the integrated promotion of locational factors, attraction of foreign direct investment, and reinvestment by foreign firms already established in Quebec.
Benefits for Canadians
This program activity aims to improve regions’ international competitiveness by displaying their knowledge and competitive advantages on the international stage.
Performance analysis
In addition to the performance presented in the above table, this section of the report contains a more comprehensive analysis of the results associated with the Competitive positioning of sectors and regions program activity.
The total value of the 86 projects under this program activity in 2009-2010 amounted to $395.1 million. Of this amount, $131.2 million came from financial assistance from the Agency, so the leverage effect was 2.01. In other words, for each dollar invested by the Agency, $2.01 was invested by the promoter and other funding sources. Despite the economic context, the leverage effect in 2009-2010 was quite similar to the 2.29 posted in 2008-2009.
The international competitiveness of sectors and regions is developed in particular through the intensification of productive links among knowledge institutions, major corporations, PMEs, suppliers of capital and organizations that encourage innovation. The Agency provided financial support to the tune of $5.1 million, as of March 31, 2010, for 16 projects fostering the establishment of business networks or sectoral clusters—or 10 projects more than in 2008-2009. For instance, the Agency supported the Aéro Montréal aerospace cluster and the Quebec Aerospace Association (AQA-SME). A total of 1,027 enterprises have networked or taken part in networks. The Agency’s support thus encouraged the structuring of clusters and networks to help enhance SMEs’ performance and facilitate their adjustment.
The Agency also supported technology transfer projects aimed at improving a sector’s competitive positioning on international markets. Among those projects:
Technocentre éolien (Wind Energy TechnoCentre)
- Description: Acquisition and installation of two wind turbines and a wind-diesel test cell.
- Agency contribution: The Agency has supported the TechnoCentre éolien through different projects. One of these involved the purchase of equipment; the Agency’s contribution amounted to $6.5 million out of a total cost of $20.5 million.
- Main results: Completion of 15 R&D and technology transfer projects.
Lessons learned
In the context of the economic downturn of the past year, the Agency successfully increased its efforts to support projects presenting strong potential for intensification of productive links among innovation players and for promotion of regions, thus contributing to the economy of the future.
2.2.6 Program activity: Policies, programs and initiatives
| 2009-2010 | |||||
|---|---|---|---|---|---|
| Financial resources (in thousands of dollars) |
Human resources (full-time equivalents) |
||||
| Planned spending | Total authorities | Actual expenditures | Planned resources | Actual resources | Variance |
| 5,689 | 5,689 | 5,611 | 48 | 49 | 1 |
Actual expenditures for Fiscal Year 2009-2010 were 1.4% lower than planned spending. This represents minimal financial variance within the framework of normal management of operations.
The Policies, programs and initiatives program activity is primarily aimed at ensuring that Quebec communities and regions benefit from adapted, coherent and effective federal action (policies, programs and initiatives) that generates socio-economic spinoffs, and that they can grasp development opportunities.
| Expected results | Performance indicators | Objectives | Performance status and summary |
|---|---|---|---|
| Quebec communities and regions as well as organizations and development agents have knowledge to understand new development trends, issues and challenges and are made aware of federal government priorities, programs and initiatives with respect to regional economic development. | Extent to which policy analysis and policy research projects are helpful. | Production and dissemination of knowledge on regional economic development issues, problems and best practices |
Met all expectations Participation by the Agency in three research collaboration agreements:
Holding of two round tables on SMEs and globalization organized by the Agency37 Conduct of nine missions, tours or awareness days, in which 149 enterprises took part, as part of the implementation of the Industrial and Regional Benefits Policy in Quebec Launch and implementation of the Regional Development Study Program. |
| Policies, programs and initiatives are being developed on the basis of analyses on the challenges, opportunities, best approaches and emerging approaches in regional economic development. | Nature of tools and means used to support regional economic development | Articulation and deployment of tools and means to support regional economic development |
Met all expectations Conception of a support measure for diversification of communities affected by the forestry crisis Development of an intervention and support strategy with respect to the Canadian Grand Prix in Montréal Development of an aid program for the municipality of Shannon Obtaining of permanent funding for continued support for Quebec’s vulnerable communities so as to make them stronger and help them and SMEs become more competitive |
| The Agency has developed collaborative action with other federal government bodies and explored cooperative action with non-federal government organizations and development agents. | Nature of Agency collaboration with government agencies and development agents | Influence and cooperation with partners |
Met all expectations Increased cooperation with the Government of Quebec with respect to implementation of the CAF and the RInC Alignment and joint action with federal partners and the Government of Quebec concerning the forestry crisis Alignment and joint action with the other regional development agencies for renewal of the CFP Deployment of the Support initiative for development of international cruises in conjunction with the provincial and federal governments and local stakeholders Contribution from the Agency to deployment of a broadband telecommunications network in James Bay in alignment and consultation with the Government of Quebec |
Program activity summary
This program activity gives Quebec regions and communities the opportunity to benefit from federal action which, in particular, helps create and disseminate knowledge with respect to regional economic development that is useful for development stakeholders, and helps grasp business opportunities.
This program activity targeted three goals:
- analysis and research: help development stakeholders have overarching facts and data available to them to inform their reflection and facilitate their decision-making with respect to development trends, challenges and issues
- policies and programs: meet the needs of Quebec communities and regions by drawing up policy directions, programs, initiatives, policies and guidelines that are adapted and coherent
- representation, influence and collaboration: enable Quebec regions and communities to take advantage of action that influences government policy directions or decisions with respect to regional economic development so that they are more closely geared to the specific realities of the regions; ensure coherent, effective, concerted action with federal and other partners when issues, needs or opportunities arise.
Benefits for Canadians
Through its ongoing efforts with respect to analysis and research, development of policies and programs, representation, influence and collaboration, the Agency contributes to influencing the policies, programs and initiatives promoted by the federal government so that they more closely reflect the realities and needs of Quebec regions and are more effective. Adapted, coherent, effective federal action stimulates the economic activity of communities and regions, and support for SMEs enables them to develop and create wealth locally, thus fostering strong economic growth.
Performance analysis
Collaboration with federal partners has ensured that the realities of Quebec regions are reflected in the design and implementation of programs and initiatives. This was the case with the Community Adjustment Fund, a CEAP initiative. Moreover, the Agency was very active on the public policy front, notably through the design and development of a support measure involving $100 million over three years aimed at the diversification of communities affected by the forestry crisis: the Temporary Initiative for the Strengthening of Quebec’s Forest Economies.38
Collaboration with the Government of Quebec leads to complementary action from both levels of government, when warranted. A first example of this collaboration was the joint promotion of Quebec sectors (e.g. transportation equipment, marine industry, electrical and electronic components, and aerospace) and enterprises in the context of large-scale federal government projects to maximize industrial spinoffs in Quebec. The Agency’s initiative to support International cruise development39 on the St. Lawrence and Saguenay rivers is a second example of collaboration. This initiative is in line with and complementary to the Government of Quebec’s strategy, and follows consultations with the communities concerned.
Lessons learned
In the area of representation, influence and collaboration, it is personal contacts with partners and implementing authorities that generate the most results. The Agency therefore raised its profile at events (trade fairs, conferences, etc.) where major government projects are discussed. As part of the implementation of the Industrial and Regional Benefits Policy in Quebec, the Agency also organized missions, tours and awareness days, in which 149 enterprises took part.
2.2.7 Program activity: Internal Services
This program activity supports the achievement of the Agency’s strategic outcome.
| 2009-2010 | |||||
|---|---|---|---|---|---|
| Financial resources (in thousands of dollars) |
Human resources (full-time equivalents) |
||||
| Planned spending | Total authorities | Actual expenditures | Planned resources | Actual resources | Variance |
| 20,376 | 26,448 | 23,854 | 142 | 161 | 19 |
Actual expenditures in Fiscal Year 2009-2010 were 17.1% higher than planned spending. New collective agreements and deferral of the budget surplus largely explain the financial variance. Additional expenditures were also made during the year to meet the needs generated by implementation of the CEAP initiatives.
Internal Services are groups of related activities and resources that are administered to meet the needs of programs and other general corporate obligations. They include only those activities and resources that apply across an organization and not those provided solely to a program.
For the Agency, these groups are:
-
Governance and management support, which includes the following services:
- Management and monitoring
- Communications
- Legal Services
-
Resource management services, which include the following services:
- Human resources management
- Financial management
- Information management
- Information technology
- Other administrative services
-
Asset management services, which include the following services:
- Real property
- Materiel
- Acquisitions.
Management and monitoring services include the Agency’s internal audit and evaluation services. The Agency’s Departmental Audit Committee held several meetings in 2009-2010, allowing for discussions on a range of issues in the areas of risk management, internal control and governance. Committee members gained a high level of assurance that, overall, the appropriate mechanisms were in place on those fronts, in particular through the work performed on internal audit and reporting activities.
In 2009-2010, the members of the Departmental Evaluation Committee discussed evaluation-related issues and approved different evaluation frameworks and reports. To ensure that recommendations from evaluations are taken into account, the committee approved an action plan monitoring process and was informed of the first tracking results. This procedure contributes to enhancing implementation of the Agency’s programs, and to their effectiveness and efficiency.
3 Additional information
3.1 Significant financial data
The financial highlights presented in this report are intended to provide a general overview of the Agency’s operations and financial situation. Detailed Financial Statements40 are to be found on the Agency’s Web site.
The actual expenditures presented in the preceding tables were prepared on a cash basis, while the financial highlights that follow were prepared on an accrual basis. Tables reconciling these two accounting methods are presented in the Notes to the Agency’s Financial Statements.
Summary financial information as at March 31, 2010
| (in thousands of dollars) | Percentage variance | 2008–09 | 2009–10 |
|---|---|---|---|
| Condensed statement of financial position for the period ending March 31, 2010 |
|||
| Assets | |||
| Total assets | 13% | 152,335 | 172,366 |
| TOTAL | 13% | 152,335 | 172,366 |
| Liabilities | |||
| Total liabilities41 | 67% | 53,825 | 88,802 |
| Equity | |||
| Total equity42 | (16%) | 98,510 | 83,564 |
| TOTAL | 13% | 152,335 | 172,366 |
| Condensed statement of financial operations for the period ending March 31, 2010 |
|||
| Expenditures | |||
| Total expenditures | 31% | 264,970 | 346,605 |
| Revenue | |||
| Total revenues | 9% | 822 | 895 |
| Net operating cost | 31% | 264,148 | 345,710 |
3.2 Financial highlights
For the period ending March 31, 2010
ASSETS
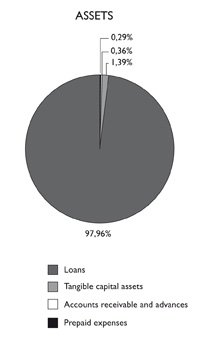
- Total assets stood at $172.4 million at the close of 2009-2010, up 13% from 2008-2009.
- Loans accounted for 98% of the Agency’s assets, or $168.9 million.
- Accounts receivable represented 0.4% of total assets, as against 0.3% for prepaid expenses and 1.4% for tangible capital assets.
LIABILITIES
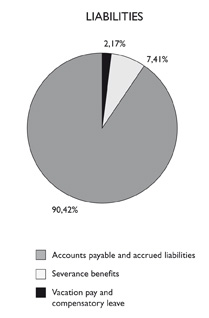
- Total liabilities amounted to $88.8 million at the close of 2009-2010, up 65% from 2008-2009.
- Accounts payable accounted for the majority (90.4%) of liabilities, at $80.3 million.
- Vacation pay and compensatory leave stood at $1.9 million, and severance benefits at $6.6 million.
REVENUES
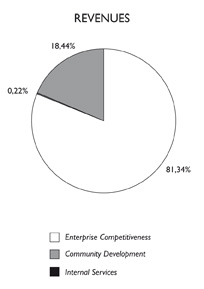
- Total revenues amounted to $895,000 in 2009-2010.
- Revenues consisted of interest ($639,000) and repayments above 100% on conditionally repayable and unconditionally repayable contributions.
EXPENSES
- Total expenses amounted to $346.6 million in 2009-2010.
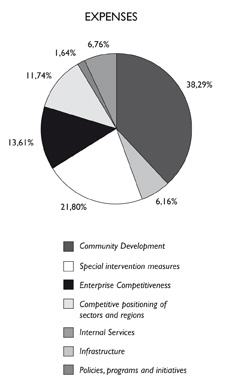
- Expenses consist primarily of non-repayable and conditionally repayable contributions (totalling $248.9 million).
- The majority of funds ($132.7 million) were used for development of Canada’s communities.
The remaining funds broke down as follows: - Infrastructure: $21.4 million
- Special intervention measures: $75.5 million
- Enterprise Competitiveness: $47.2 million
- Competitive positioning of sectors and regions: $40.7 million
- Policies, programs and initiatives: $5.7 million
- Internal Services: $23.4 million.
3.3 List of additional tables
Table: Sources of Non-respendable Revenue
The table illustrates revenue and provides a historical perspective. Revenue consists primarily of repayments of the repayable contributions awarded by the Agency.
Table: Report on User Fees
The table presents user fee revenue and costs.
Table: Details of Transfer Payment Programs (TPPs)
The table illustrates the results of TPPs in relation to commitments and planned results as set out in the 2009-2010 RPP where the amount of the transfer exceeds $5 million.
Table: Green Procurement
The table summarizes the initiatives and results attained by the Agency with respect to the integration of environmental performance considerations in procurement decision-making processes. Green procurement goals and results attained are also presented.
Table: Response to Parliamentary Committees and to External Audits
The table lists responses given to Parliamentary Committee reports, Auditor General of Canada reports and external audits concerning Agency activities in 2009-2010.
Table: Internal Audits 2009-2010
The table lists internal audit reports.
Table: Evaluations 2009-2010
The table lists evaluation reports.
3.4 Appendices
Appendix 1: Results of the Agency’s annual customer satisfaction survey
Appendix 2: Agency performance measurement methodology
Appendix 3: Technical notes on performance data in the results tables
Appendix 4: List of acronyms
Appendix 5: Agency Business Offices
Appendix 6: Resource-person and statute administered
Notes :
1 The Community Adjustment Fund, an initiative stemming from CEAP, is implemented through the Agency’s regular programs, Community Diversification and Business and Regional Growth.
2 In the 2009-2010 RPP, the Agency used the following three strategic outcomes:
- dynamic and revitalized communities that have a better socio-economic outlook and are developing their economic activity base
- presence of conditions conducive to sustainable growth and the competitive positioning of SMEs and regions
- policies, programs and cooperative actions that strengthen the economy of Quebec regions.
3 The Special infrastructure-dedicated programs program subactivity includes measures associated with CEAP, including the Recreational Infrastructure Canada program and the Contribution program to supply the Municipality of Shannon with drinking water.
4 The CAF comes under the Community adjustment to economic shocks program subactivity.
5 The leverage effect presented in this Report, as calculated by the Agency, compares financial assistance approved by the Agency with funding from the promoter and other funding sources. The leverage effect excludes funding associated with CEAP and the Infrastructure program activity.
6 Despite the economic context in 2009-2010, the Agency achieved a leverage effect comparable to the previous year. In 2008-2009, the leverage effect had been 2.64 for strategic outcome #1 and 2.71 for strategic outcome #2.
7 This result is taken from the Annual Customer Satisfaction Survey of the Economic Development Agency of Canada for the Regions of Quebec conducted by the Agency in winter 2010.
8 All the amounts presented in this table exclude services received without charge, except for the 2008-2009 actual expenditures column, where they represent $5.8 million. This affects the comparability of actual expenditures between 2008-2009 and 2009-2010.
9 Main Estimates are tabled in Parliament prior to the start of the fiscal year. Planned spending comprises the Main Estimates as well as additional authorities at the time of publication of the Report on Plans and Priorities. Total authorities therefore represent Main Estimates plus Supplementary Estimates for the year ending March 31, 2010. The Agency’s total actual expenditures must not exceed total authorities, but variations at the program activity level are possible.
10 For the 2009-2010 and subsequent Estimates cycles, resources allocated to Internal Services will be shown separately from those for other program activities, and will no longer be broken down among other program activities, as was the case in the latest Main Estimates. This change has an impact on the comparability of expenditures and information concerning FTEs for each program activity and fiscal year.
11 Priorities previously committed to are those established during the one or two fiscal years immediately prior to 2009-2010, whereas new priorities were established during 2009-2010.
12 In this Departmental Performance Report (DPR), a performance index is associated with each priority and with each performance indicator linked to program activities. The performance evaluation scale consists of the following levels: Exceeded expectations; Met all expectations; Mostly met expectations; Somewhat met expectations and Not met expectations and is defined by the Treasury Board of Canada Secretariat. The definitions are presented in Appendix 3 of the DPR: www.dec-ced.gc.ca/eng/publications/agency/rmr.html.
13 The amount of approved commitments excludes commitments associated with CEAP.
14 Idem
15 www.infoentrepreneurs.org/en/
16 www.ressourcesentreprises.org/Home.aspx
17 In the 2009-2010 RPP, no objective was identified for certain performance indicators, while objectives were set for most of the performance indicators presented in the 2010-2011 RPP.
18 The results presented concerning jobs created and maintained are taken from statements by promoters.
19 The results presented concerning tourism are taken from: Le tourisme en chiffres – Édition 2010 http://www.tourisme.gouv.qc.ca/publications/publication.php?id=209&categorie=50. They correspond to the latest results available on tourism, and cover 2008.
20 www.dec-ced.gc.ca/eng/programs/diversification/diversification.html
21 www.dec-ced.gc.ca/eng/programs/cfp/cfp.html
22 These performance data concern solely the Infrastructure Canada Program (ICP) and are associated with the agreement with the Government of Quebec. While all the objectives were attained prior to 2009-2010, it was deemed appropriate to present the ICP results, since the agreement terminates on March 31, 2011.
23 This was the Canada-Quebec Infrastructure Program Agreement: www.dec-ced.gc.ca/eng/programs/infrastructure/infrastructure.html
24 www.infc.gc.ca/infc-eng.html
25 www.dec-ced.gc.ca/eng/programs/infrastructure/ricpa.html
26 www.dec-ced.gc.ca/eng/programs/caf/caf.html
27 The decline in the number of strategic enterprises created or expanding, compared with 2008-2009, is attributable to the fact that in 2008-2009 the Agency funded an incubator involving a large number of projects. This incubator is now funded by the Agency under another component.
28 The results presented concerning job creation are taken from statements by promoters.
29 www.dec-ced.gc.ca/eng/programs/growth/growth.html
30 www.dec-ced.gc.ca/eng/agency/business-contact/contact.html
31 Investment in applied research projects includes investment from the Agency and other funding sources.
32 The results presented concerning jobs created and maintained in Quebec stemming from foreign direct investment are taken from: Montréal International, 2009 Activity Report: A winning partnership, p.8.
33 Ibid, p.13
34 Available on the CBOC Web site: www.conferenceboard.ca/ITIC/research.aspx
35 Available on the Metropolis Web site: im.metropolis.net/frameset_e.html
36 Available on the Université Laval Web site: www.rqsi.ulaval.ca/fr/bulletin.php
37 Presentations available on the Réseau de chercheurs Entrepreneuriat Web site: www.entrepreneuriat.auf.org/article.php3?id_article=187, and report available on the Research Institute for SMEs Web site: https://oraprdnt.uqtr.uquebec.ca/pls/public/gscw031?owa_no_site=862&owa_no_fiche=51&owa_apercu=N&owa_imprimable=N&owa_bottin=
38 www.dec-ced.gc.ca/eng/programs/forest/index.html
39 www.dec-ced.gc.ca/eng/programs/applying/cruise.html
40 www.dec-ced.gc.ca/eng/publications/agency/rmr.html
41 The increase in liabilities is primarily attributable to year-end payables ($54.5 million as at March 31, 2010 and $27.4 million as at March 31, 2009).
42 The total decrease in equity compared with last year is primarily attributable to the increase in operating costs and the smaller change in net position in the Consolidated Revenue Fund during 2009-2010.