
Treasury Board of Canada Secretariat
www.tbs-sct.gc.ca
Common menu bar links
Breadcrumb Trail
ARCHIVED - Financial Transactions and Reports Analysis Centre of Canada - Report
 This page has been archived.
Archived Content
Information identified as archived on the Web is for reference, research or recordkeeping purposes. It has not been altered or updated after the date of archiving. Web pages that are archived on the Web are not subject to the Government of Canada Web Standards. As per the Communications Policy of the Government of Canada, you can request alternate formats on the "Contact Us" page.
Section III – Supplementary Information
Financial Highlights
| Condensed Statement of Financial Position At end of Fiscal Year (March 31, 2010) |
% Change | 2008–09 | 2009–10 |
|---|---|---|---|
| Assets | |||
| Accounts Receivables and Advances | 80.8% | 311 | 172 |
| Prepaid Expenses | -38.0% | 546 | 881 |
| Tangible Capital Assets | -6.2% | 16,923 | 18,038 |
| Total Assets | -6.9% | 17,780 | 19,091 |
| Total | -6.9% | 17,780 | 19,091 |
| Liabilities | |||
| Accounts Payables and accrued liabilities | -32.1% | 3,999 | 5,886 |
| Vacation pay and compensatory leave | -2.4% | 995 | 1,019 |
| Employee severance benefits | 13.2% | 6,268 | 5,539 |
| Total Liabilities | -9.5% | 11,262 | 12,444 |
| Equity | -1.9% | 6,518 | 6,647 |
| Total Equity | -1.9% | 6,518 | 6,647 |
| Total | -6.9% | 17,780 | 19,091 |
| Condensed Statement of Financial Operations At end of Fiscal Year (March 31, 2010) |
% Change | 2008–09 | 2009–10 |
|---|---|---|---|
| Expenses | |||
| Contribution | 16.7% | 1,400 | 1,200 |
| Operating Expenses | 0.2% | 52,919 | 52,839 |
| Total Expenses | 0.5% | 54,319 | 54,039 |
| Revenues | |||
| Revenues not available for spending | - | 178 | - |
| Total Revenues | - | 178 | - |
| Net Cost of Operations | 0.2% | 54,141 | 54,039 |
Financial Highlights Charts/Graphs
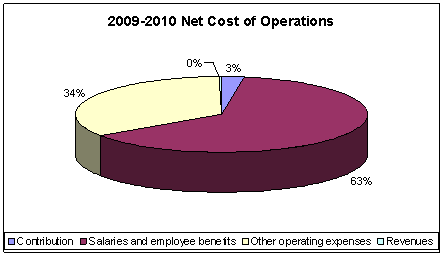
The net cost of operations for fiscal year 2009-10 was $54.1M, an increase of 0.2% over the previous year's net cost of operation of $54M. Salaries and employee benefits, in the amount of $34.3M, represent the largest portion with 63% of the total cost. Other operating expenses, in the amount of $18.6M detailed in the chart below, represent 34% of the total cost. The Contribution for the establishment of the Egmont Group Secretariat totalling $1.4M in 2009-10, represents 3% of the net cost of operations. Finally, Revenues not available for spending in the amount of $177,930 represents a minimal percentage of total net cost of operations.
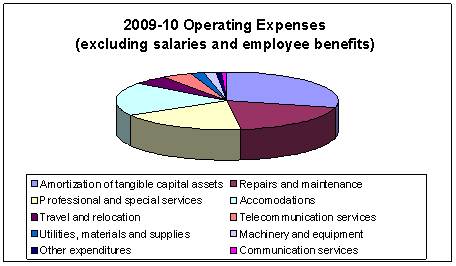
Operating expenses, excluding salaries and employee benefits, totalled $18.6M in fiscal year 2009-2010. The largest share of expenses were the amortization of tangible capital assets ($5.3M), professional and special services ($3.5M), accommodations ($3.4M), repair and maintenance ($3.1M). Other significant costs were travel and relocation, telecommunication services, utilities, material and supplies, machinery and equipment, communication services and other expenditures.
Financial Statements
http://www.fintrac-canafe.gc.ca/publications/reports-rapports-eng.asp#4
List of Supplementary Information Tables
The following supplementary information tables to the 2009-10 Departmental Performance Report can be found on the Treasury Board of Canada Secretariat's website at: http://www.tbs-sct.gc.ca/dpr-rmr/st-ts-eng.asp.
- Sources of Respendable and Non-Respendable Revenue
- Horizontal Initiatives
- Response to Parliamentary Committees and External Audits
- Internal Audits and Evaluations
1 Commencing in the 2009-10 Estimates cycle, the resources for Program Activity: Internal Service is displayed separately from other program activities; they are no longer distributed among the remaining program activities, as was the case in previous Main Estimates. This has affected the comparability of spending and FTE information by Program Activity between fiscal years.