
Treasury Board of Canada Secretariat
www.tbs-sct.gc.ca
Common menu bar links
Breadcrumb Trail
ARCHIVED - Canada School of Public Service - Report
 This page has been archived.
Archived Content
Information identified as archived on the Web is for reference, research or recordkeeping purposes. It has not been altered or updated after the date of archiving. Web pages that are archived on the Web are not subject to the Government of Canada Web Standards. As per the Communications Policy of the Government of Canada, you can request alternate formats on the "Contact Us" page.
Section III - Supplementary Information
Financial Highlights
| Condensed Statement of Financial Position At End of Year (March 31, 2010) |
% Change | 2009-10 | 2008-09 |
|---|---|---|---|
| Financial assets | 25% | 2,080 | 1,664 |
| Non-financial assets | 141% | 8,0 | 3,326 |
| total assets | 102% | 10,089 | 4,990 |
| Liabilities | 1% | 32,092 | 31,818 |
| Equity | -18% | (22,003) | (26,828) |
|
|
|||
| total | 102% | 10,089 | 4,990 |
| Condensed Statement of Financial Operations At End of Year (March 31, 2010) |
% Change | 2009-10 | 2008-09 |
|---|---|---|---|
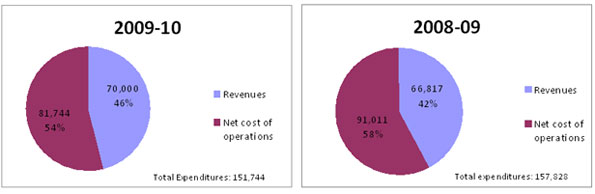
| Total Expenses | -4% | 157,744 | 157,828 |
| Total Revenues | 5% | 70,000 | 66,817 |
|
|
|||
| net cost of operations | -10% | 81,744 | 91,011 |
Financial Highlights Chart/Graphs
Financial Statements
The financial highlights presented within this Departmental Performance Report are intended to serve as a general overview of the School's financial position. More information is available on the School's website at: http://www.csps-efpc.gc.ca/aut/cdo/index-eng.asp.
List of Supplementary Information Tables
The following tables are located on the Treasury Board Secretariat website:
- Sources of Respendable Revenue
- User Fees
- Status Report on Projects operating with specific Treasury Board Approval
- Green Procurement
- Response to Parliamentary Committees and External Audits
- Internal Audits and Evaluations
Other Items of Interest
[1] Due to a change in methodology, data related to this performance target was collected from April to December 2009 only. The performance results reflected above have been calculated using this time period.
[2] Commencing in the 2009-10 Estimates cycle, the resources for Program Activity: Internal Service is displayed separately from other program activities; they are no longer distributed among the remaining program activities, as was the case in previous Main Estimates. This has affected the comparability of spending and full-time employees information by Program Activity between fiscal years.
[3] Exceeded: More than 100 per cent of the expected level of performance (as evidenced by the indicator and target or planned activities and outputs) for the expected result or priority identified in the Report on Plans and Priorities ( RPP) was achieved during the year.
Met All: 100 per cent of the expected level of performance (as evidenced by the indicator and target or planned activities and expected outputs) for the expected result or priority identified in the RPP was achieved during the year.
Mostly Met: 80 to 99 per cent of the expected level of performance (as evidenced by the indicator and target or planned activities and expected outputs) for the expected result / priority identified in the RPP was achieved during the year. Somewhat Met: 60 to 79 per cent of the
expected level of performance (as evidenced by the indicator and target or planned activities and outputs) for the expected result or priority identified in the RPP was achieved during the year.
Not Met: Less than 60 per cent of the expected level of performance (as evidenced by the indicator and target or planned activities and outputs) for the expected result or priority identified in the RPP was achieved during the year.
[4] Due to a change in methodology, data related to this performance target was collected from April to December 2009 only. The performance results reflected above have been calculated using this time period.
[5] Data include calendar courses as well as courses offered under Memoranda of Understanding.
[6] Due to a change in methodology, data related to this performance target was collected from April to December 2009 only. The performance results reflected above have been calculated using this time period.
[7] These groups are: Management and Oversight Services; Communications Services; Legal Services; Human Resources Management Services; Financial Management Services; Information Management Services; Information Technology Services; Real Property Services; Materiel Services; Acquisition Services; and Travel and Other Administrative Services.