
Treasury Board of Canada Secretariat
www.tbs-sct.gc.ca
Common menu bar links
Breadcrumb Trail
ARCHIVED - Canada Border Services Agency - Report
 This page has been archived.
Archived Content
Information identified as archived on the Web is for reference, research or recordkeeping purposes. It has not been altered or updated after the date of archiving. Web pages that are archived on the Web are not subject to the Government of Canada Web Standards. As per the Communications Policy of the Government of Canada, you can request alternate formats on the "Contact Us" page.
Section III: Supplementary Information
Financial Highlights
For financial reporting purposes, the activities of the Agency have been divided into two sets of financial statements: Agency Activities and Administered Activities. The financial statements for Agency Activities include those operational revenues and expenses that are managed by the Agency and utilized in running the organization. The financial statements for Administered Activities include those revenues and expenses that are administered for entities other than the Agency (e.g. the federal government, a province or territory, or another group or organization). The purpose of this distinction is to more accurately represent the actual cost of Agency operations from those revenues that are administered on behalf of the Government of Canada.
Comparative figures have been reclassified to conform to the current year's presentation. The 2008-09 amounts have been restated to exclude Agency Administered Activities. Furthermore, amounts payable to and receivable from Agency Administered Activities were eliminated upon consolidation in 2008-09. These have been subsequently included in the restated 2008-09 amounts for comparative purposes.
| Condensed Statement of Financial Position As at March 31, 2010 | Percent Change % | 2009-10 | 2008-09 |
|---|---|---|---|
| Financial assets | 13.9 | 12,855 | 11,291 |
| Non-financial assets | 7.3 | 419,727 | 391,076 |
| Total Assets | 7.5 | 432,582 | 402,367 |
| Total Liabilities | -13.2 | 416,201 | 479,688 |
| Total Equity | - | 16,381 | -77,321 |
| Total | 7.5 | 432,582 | 402,367 |
| Condensed Statement of Financial Operations For the year ending March 31, 2010 |
Percent Change % | 2009-10 | 2008-09 |
|---|---|---|---|
| Total Expenses | 0.5 | 1,808,618 | 1,799,053 |
| Total Revenues | 8.2 | 25,894 | 28,202 |
| Net Cost of Operations | 0.7 | 1,782,724 | 1,770,851 |
Financial Highlights Charts
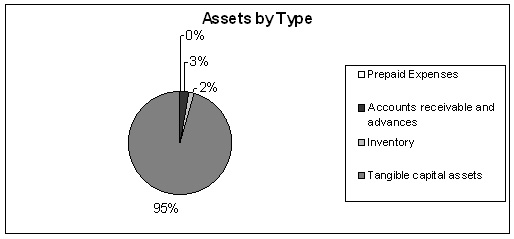
The CBSA's total assets were $433 million at the end of 2009-10, an increase of $31 million (7.5 percent) over the total assets of $402 million for 2008-09. Non-financial assets (prepaid expenses, inventory and tangible capital assets) represent the largest portion at $420 million (97 percent) of total assets.
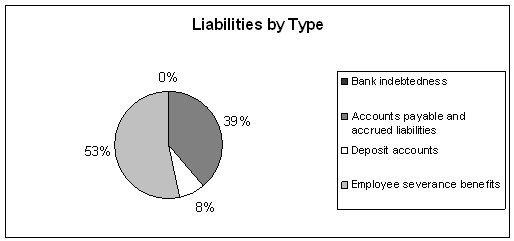
The CBSA's total liabilities were $416 million at the end of 2009-10, a decrease of $64 million (13 percent) over the total liabilities of $480 million for 2008-09. Employee severance benefits represent the largest portion of liabilities at $223 million (54 percent) of total liabilities.
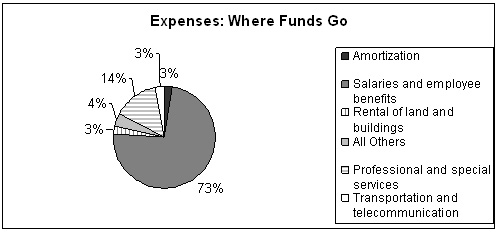
The CBSA's total expenses were $1.809 billion for 2009-10, an increase of $10 million (0.5 percent) over the total expenses of $1.799 billion for 2008-09. Most of the funds, $1.314 billion (73 percent), were spent on salaries and employee benefits.
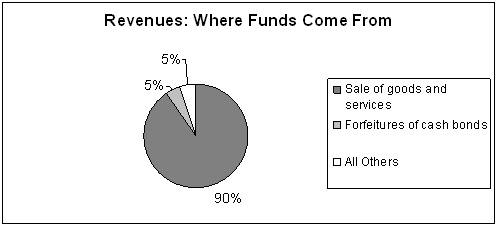
The CBSA's total revenues were $26 million for 2009-10, a decrease of $2 million (8 percent) over the total revenues of $28 million for 2008-09. Most of the revenues, $23 million (90 percent), were generated from the sale of goods and services.
Financial Statements
The CBSA's financial statements are available on the Agency's website.
Supplementary Information Tables
The following tables are available on the Treasury Board of Canada Secretariat's website.
- Sources of Respendable and Non-Respendable Revenue
- User Fees Reporting
- Status Report on Projects Operating with Specific Treasury Board Approval
- Status Report on Major Crown/Transformational Projects
- Horizontal Initiatives
- Green Procurement
- Response to Parliamentary Committees and External Audits
- Internal Audits and Evaluations
Information and Contacts
To contact the CBSA and for more information on its activities, please visit the Agency's website. Links to other websites of interest are provided below.
- Canada Revenue Agency website
- Canadian Food Inspection Agency website
- Canadian Security Intelligence Service website
- Citizenship and Immigration Canada website
- Department of Finance Canada website
- Foreign Affairs and International Trade Canada website
- Health Canada website
- Public Safety Canada website
- Royal Canadian Mounted Police website
- Transport Canada website