
Treasury Board of Canada Secretariat
www.tbs-sct.gc.ca
Common menu bar links
Breadcrumb Trail
ARCHIVED - Public Health Agency of Canada - Report
 This page has been archived.
Archived Content
Information identified as archived on the Web is for reference, research or recordkeeping purposes. It has not been altered or updated after the date of archiving. Web pages that are archived on the Web are not subject to the Government of Canada Web Standards. As per the Communications Policy of the Government of Canada, you can request alternate formats on the "Contact Us" page.
Section III – Supplementary Information
3.1 Financial Highlights
| Condensed Statement of Financial Position for the year ended March 31 | % Change | 2008–09 | 2009–10 |
|---|---|---|---|
| Assets | 69% | 159,318,798 | 268,825,486 |
| Liabilities | 70% | 143,571,401 | 243,384,631 |
| Equity | 62% | (15,747,397) | (25,440,855) |
| Total | 69% | 159,318,798 | 268,825,486 |
| Condensed Statement of Financial Operations for the year ended March 31 | % Change | 2008–09 | 2009–10 | 2009-10 Forecast |
|---|---|---|---|---|
| Expenses | 58% | 602,978,580 | 950,175,886 | 690,481,000 |
| Revenues | 5% | 283,746 | 297,548 | 540,000 |
| Net Cost of Operations | 58% | 602,694,834 | 949,878,338 | 689,941,000 |
Note: The condensed statement of financial position has been adjusted due to the Agency's adoption of Treasury Board accounting standard TBAS 1.2.
| Total assets were $268.8 M, an increase of 69% ($109.5M) over the previous year's total of $159.3M. Due from Consolidated Revenue Fund represented $187.5M (70%); accounts receivable and advances represented $3.5M (1%); and tangible capital assets represented $77.8M (29%) of total assets. | 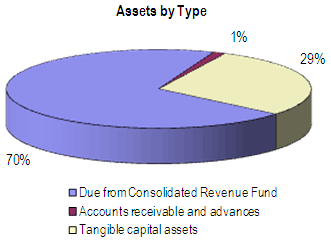 [D] |
 [D] |
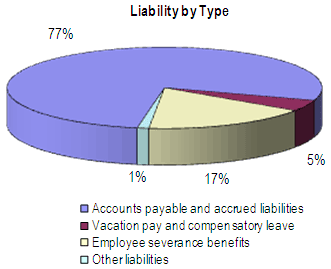
Total liabilities were $243.4M, an increase of 70% ($99.8M) over the previous year's total of $143.6M. Accounts payable and accrued liabilities represented $188.0M (77%); vacation pay and compensatory leave represented $10.9M (5%); employee severance benefits represented $41.6M (17%); and other liabilities represented $2.9M (1%) of total liabilities. |
| Total expenses for the Agency were $950.2M. The Agency spent $182.6M (19%) on Health Promotion; $48.6M (5%) on Chronic Disease Prevention and Control; $531.2M (56%) on Infectious Disease Prevention and Control; $39.7M (4%) on Emergency Preparedness and Response; $36.5M (4%) on Strengthen Public Health Capacity and $111.6M (12%) on Internal Services. | 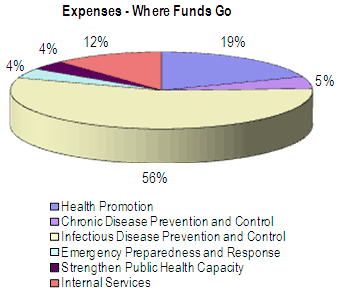 [D] |
 [D] |
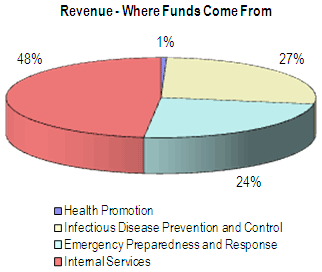
The Agency receives most of its funding through annual Parliamentary appropriations although some revenue is generated from program activities. All cash received by the Agency is deposited to the Consolidated Revenue Fund (CRF) and all cash disbursements made by the Agency are paid from the CRF. The Agency's total revenue was $297,500 of which $53,900 is respendable. |
Financial Statements
The Agency's 2009-10 Financial Statements are available online at ![]() http://www.phac-aspc.gc.ca/dpr-rmr/2009-2010/index-eng.php.
http://www.phac-aspc.gc.ca/dpr-rmr/2009-2010/index-eng.php.
3.2 List of Tables
The following tables are located on the Treasury Board Secretariat Web site at ![]() http://www.tbs-sct.gc.ca/dpr-rmr/2009-2010/inst/ahs/st-tstb-eng.asp:
http://www.tbs-sct.gc.ca/dpr-rmr/2009-2010/inst/ahs/st-tstb-eng.asp:
- Sources of Respendable and Non-Respendable Revenue
- User Fees Reporting
- Details on Transfer Payment Programs (TPPs)
- Horizontal Initiatives
- Green Procurement
- Response to Parliamentary Committees and External Audits
- Internal Audits and Evaluations
[Footnotes]
1 World Health Organization. Healthy life expectancy (HALE) at birth (years) Available from: ![]() http://www.who.int/whosis/indicators/2007HALE0/en/
[Accessed May 20, 2010.]
http://www.who.int/whosis/indicators/2007HALE0/en/
[Accessed May 20, 2010.]
2 Statistics Canada. CANSIM Table 102-0121 and Catalogue no. 82-221-X.
3 World Health Organization. World Health Statistics 2010,
Table 1. ![]() http://www.who.int/whosis/whostat/EN_WHS10_Full.pdf
http://www.who.int/whosis/whostat/EN_WHS10_Full.pdf
4 World Health Organization. The World Health Report 2004,
Annex Table 4. ![]() http://www.who.int/whr/2004/annex/en/index.html
http://www.who.int/whr/2004/annex/en/index.html
5 Statistics Canada. 37b-HLT: health adjusted life expectancy (HALE) by income. In: Comparable health indicators—Canada, provinces and
territories. Ottawa: Statistics Canada; 2001. Catalogue 82-401-XIE. Available from: ![]() http://www.statcan.gc.ca/pub/82-401-x/2002000/4064312-eng.htm#2.
http://www.statcan.gc.ca/pub/82-401-x/2002000/4064312-eng.htm#2.
6 A public health surveillance system under development and funded by Canada Health Infoway.
7 1500 mg/day is considered adequate for good health in adults.
The tolerable upper intake level is 2300 mg/day.
![]() http://www.hc-sc.gc.ca/hl-vs/iyh-vsv/food-aliment/sodium-eng.php.
http://www.hc-sc.gc.ca/hl-vs/iyh-vsv/food-aliment/sodium-eng.php.
8 This number is consistent with previous years. Healthy Living Fund participants increased from 104,300 in the first six months of 2007-08 to 137,084 in 2009-10.
9 This number is exclusive of 123 projects in Quebec that do not complete participant surveys.
10 Aboriginal Head Start Association of British Columbia (AHSABC).
Our Food, Our Stories–Celebrating Our Gifts from the Creator. 2009. Copies of this book are available from AHSABC
at 250-858-4543 or ![]() www.ahsabc.com.
www.ahsabc.com.
11 Investing in Prevention – The Economic Perspective Key
Findings from a Survey of the Recent Evidence, ![]() http://www.phac-aspc.gc.ca/ph-sp/new-neuf-eng.php.
http://www.phac-aspc.gc.ca/ph-sp/new-neuf-eng.php.
12 Audit of Health Promotion Programs, Public Health
Agency of Canada Internal Audit. ![]() http://www.phac-aspc.gc.ca/about_apropos/audit/reports09-eng.php#hpp.
http://www.phac-aspc.gc.ca/about_apropos/audit/reports09-eng.php#hpp.
13 Youth Engagement and Health Outcomes: Is there a Link?,
![]() http://www.engagementcentre.ca/files/litreview1_web_e.pdf.
http://www.engagementcentre.ca/files/litreview1_web_e.pdf.
14 Public Health Agency of Canada. Report from the National Diabetes Surveillance System: Diabetes in Canada, 2009, p. 2. Available online. [Accessed June 7, 2010.]
15 Public Health Agency of Canada.
![]() Cancer Incidence over Time – All Cancer Sites including In Situ for Bladder, Both Sexes Combined, All Ages, Canada, 1992-2006.
Cancer Surveillance On-Line. [Accessed May 12, 2010.]
Cancer Incidence over Time – All Cancer Sites including In Situ for Bladder, Both Sexes Combined, All Ages, Canada, 1992-2006.
Cancer Surveillance On-Line. [Accessed May 12, 2010.]
16 Health Canada. ![]() Canadian Tobacco Use Monitoring Survey (CTUMS), Smoking Prevalence 1999-2009: Annual, 2008. Health Concerns, Tobacco,
Tobacco Use Statistics. [Accessed August 4, 2010.]
Canadian Tobacco Use Monitoring Survey (CTUMS), Smoking Prevalence 1999-2009: Annual, 2008. Health Concerns, Tobacco,
Tobacco Use Statistics. [Accessed August 4, 2010.]
17 The self-reported prevalence of obesity (18% in 2009) obesity is known to be an underestimate of obesity rates. Correcting for this bias, the prevalence of obesity in 2009 is approximately 24 percent.
18 Public Health Agency of Canada. Chronic Disease Official Statistics Pilot. Health Status Indicators - Risk Factor Prevalences – Internal Database. Surveillance Division, Centre for Chronic Disease Prevention and Control. [Accessed August 4, 2010.]
19 1500 mg/day is considered adequate for good health in adults.
The tolerable upper intake level is 2300 mg/day. ![]() http://www.hc-sc.gc.ca/hl-vs/iyh-vsv/food-aliment/sodium-eng.php.
http://www.hc-sc.gc.ca/hl-vs/iyh-vsv/food-aliment/sodium-eng.php.
20 Chung M, Balk EM, Brendel M, Ip S, Lau J, Lee J, et al. Vitamin D and Calcium: A Systematic Review of Health Outcomes. Evidence Report No. 183 (Prepared by the Tufts Evidence-based Practice Centre under Contract No. HHSA 290-2007-10055-I) AHRQ Publication No. 09-E015. Rockville, MD: Agency for Healthcare Research and Quality. 2009.
21 NCDnet is a platform for collaboration among WHO member states and other international partners committed to the fight against chronic diseases.
22 Public Health Agency of Canada. Evaluation of the Canadian Diabetes Strategy – Final Report. Rick Wilson Consulting Inc., 2004: 5. While reference is made to evaluation findings in 2004, there is continued need to ensure these lessons are incorporated into current practices within PHAC for examining the impacts of community-based programming.
23 Public Health Agency of Canada. Integrated Strategy on Healthy Living and Chronic Disease: Formative Evaluation of Diabetes Community-Based Programming – Evaluation Report. JLS Management Consulting Inc. Public Health Agency of Canada, Chronic Disease Prevention Division. 2009: 36.
24 “So much sharing”: Evaluation of the capacity building component of the Canadian Breast Cancer Initiative, Final Evaluation Report, March 8, 2008.
25 It is important to note that having an increase in reported rates/incidence can also be an indication of improved surveillance, heightened awareness, etc.
26 Source: ![]() http://www.phac-aspc.gc.ca/sti-its-surv-epi/index-eng.php.
http://www.phac-aspc.gc.ca/sti-its-surv-epi/index-eng.php.
27 Source: ![]() http://www.phac-aspc.gc.ca/hep/index-eng.php.
http://www.phac-aspc.gc.ca/hep/index-eng.php.
1) Brief Report Hepatitis B Infection in Canada; and
2) Epidemiology of Acute Hepatitis C Infection in Canada.
28 ![]() http://www.phac-aspc.gc.ca/aids-sida/publication/survreport/estimat08-eng.php.
http://www.phac-aspc.gc.ca/aids-sida/publication/survreport/estimat08-eng.php.
29 Preliminary results from the CNISP (2009) and Gravel D,Taylor B, Ofner M, Johnston L, Loeb M, Roth VR, et al.Point prevalence survey for healthcare-associated infections within Canadian adult acute-care hospital, Journal of Hospital Infection. 2007; 66: 243-248.
30 Source: PHAC pH1N1 Infection Control Research Plan (Feb. 2, 2010), presented to the pH1N1 Infection Control Research WG on Feb. 4, 2010.
31 Preparedness and capacity to respond to chemical, biological, and radio nuclear threats (CBRN), and the Agency's support to F/P/T/international/NGO partners to enhance skills and capacity, and to strengthen information sharing, communication, clarity of roles and responsibilities, and collaborative preparedness and response to public health emergencies.
32 A high-level weekly overview of public health activities affecting Canadians, emerging trends and available resources.
33 The Agency's 2009-10 RPP does not include performance indicators for the Internal Services program activity. The performance indicators included above were published in the 2010-11 RPP and reported on as best possible in this 2009-10 DPR.
34 Information Commissioner of Canada. Maximizing Compliance
for Greater Transparency![]() http://www.infocom.gc.ca/eng/rp-pr_ar-ra.aspx [Accessed June
11, 2010.]
http://www.infocom.gc.ca/eng/rp-pr_ar-ra.aspx [Accessed June
11, 2010.]
35 The RPP 2010-11 commitment is to “increase or maintain workforce availability estimates based on April 1, 2009 baseline numbers.” The percentage growth targets are still under development.