
Treasury Board of Canada Secretariat
www.tbs-sct.gc.ca
Common menu bar links
Breadcrumb Trail
ARCHIVED - Atlantic Canada Opportunities Agency - Report
 This page has been archived.
Archived Content
Information identified as archived on the Web is for reference, research or recordkeeping purposes. It has not been altered or updated after the date of archiving. Web pages that are archived on the Web are not subject to the Government of Canada Web Standards. As per the Communications Policy of the Government of Canada, you can request alternate formats on the "Contact Us" page.
Section 3 : Supplementary Information
3.1 Financial Highlights
The financial highlights presented within this Departmental Performance Report are intended to serve as a general overview of ACOA’s financial position and operations. Financial statements are prepared in accordance with accrual accounting principles and the updated Treasury Board Accounting Standards 1.2. The unaudited supplementary information presented in the financial tables in this report was prepared on a modified cash basis of accounting in order to be consistent with appropriations-based reporting. The Agency’s financial statements can be found on ACOA’s website.
| Financial Highlights | |||
|---|---|---|---|
| % Change | 2010 ($000) |
2009 ($000) |
|
| Condensed Statement of Financial Position (Unaudited) At End of Year (March 31) |
|||
| Assets | |||
| Financial assets | 4% | 314,250 | 294,820 |
| Non-financial assets | (-27%) | 14,513 | 19,965 |
| Total ASSETS | 4% | 328,763 | 314,785 |
| Liabilities | 27% | 116,477 | 91,593 |
| Equity | (-5%) | 212,286 | 223,192 |
| Total LIABILITIES and EQUITY | 4% | 328,763 | 314,785 |
| Condensed Statement of Operations (Unaudited) For the Year (ended March 31): |
|||
|---|---|---|---|
| Expenses | 29% | 384,689 | 297,873 |
| Revenues | (-17%) | 9,231 | 11,074 |
| Net Cost of Operations | 31% | 375,458 | 286,799 |
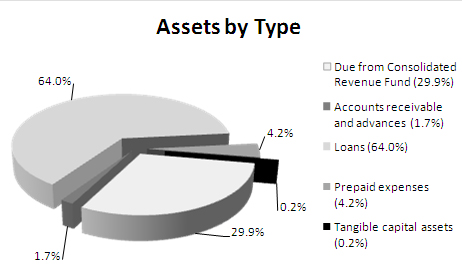
Assets have increased by $13.9 million compared to 2008-2009. Funds due from the Consolidated Revenue Fund increased by $24.4 million (33%) from the previous year. The primary reason for this increase is that accrued liabilities increased by $21.2 million. This is largely due to the CAF and the RInC program, which are part of CEAP.
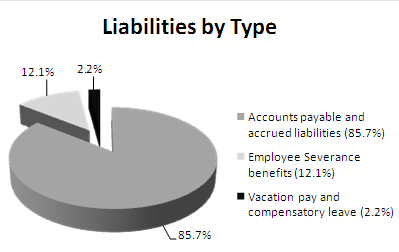
Total liabilities at the end of 2009-2010 were $116.4 million, an increase of $24.4 million (27%) over the previous year’s total liabilities of $91.6 million. This increase relates to accrued liabilities for programs in CEAP as explained above. Accounts payable represent the largest portion of liabilities, at $99.9 million (86% of total liabilities).
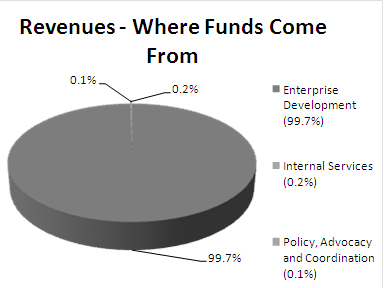
The Agency’s total revenues for 2009-2010 amounted to $9 million, which remained fairly constant from the previous year’s revenue. Almost all of ACOA’s revenue was derived from repayable contributions from activity undertaken to support the Enterprise Development program activity. All the other levels of revenue were marginal for 2009-2010.
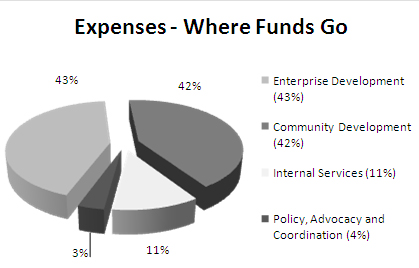
Total expenses for ACOA were $384.7 million in 2009-2010. Of this amount, $165.8 million (43%) was spent in Enterprise Development, while Community Development represented $161.8 million (42%). Policy, Advocacy and Coordination utilized $13.2 million (4%), and Internal Services represented $43.7 million (11%).
3.2 Supplementary Information Tables
The following supplementary information can be found on the website of the Treasury Board of Canada Secretariat.
- Details of Transfer Payment Programs
- Evaluations and Internal Audits
- Green Procurement
- Horizontal Initiatives
- Response to Parliamentary Committees and External Audits
- Sources of Non-respendable Revenue
3.3 Other Items of Interest
Information on ACOA’s organizational structure is available on the Agency’s website.
Descriptions of the performance status ratings used throughout this report can be found on the Agency’s website.
The following additional reports are available on ACOA’s website.
- Atlantic Canada’s 2009-2010 Economic Overview and Provincial Economic Profiles
- BDP Repayable Contributions Portfolio
- Information on sub-activities of ACOA’s Program Activity Architecture
- Innovation
- Entrepreneurship and Business Skills Development
- Trade
- Investment
- Financing Continuum
- Community Mobilization
- Community-based Business Development
- Community Investment
- Infrastructure Programming
- Policy
- Advocacy
- Coordination
[Footnotes]
1 Types are defined as:
- New (newly committed to for fiscal year 2009-2010)
- Previously committed to (committed to one or two fiscal years earlier, i.e. 2007-2008 or 2008-2009)
- Ongoing (committed to at least three fiscal years earlier, i.e. 2006-2007 or earlier)
2 Types are defined as:
- New (newly committed to for fiscal year 2009-2010)
- Previously committed to (committed to one or two fiscal years earlier, i.e. 2007-2008 or 2008-2009)
- Ongoing (committed to at least three fiscal years earlier, i.e. 2006-2007 or earlier)
3 Calculation generated using data from Statistics Canada, National Economic Accounts-CANSIM Table 383-0010 and Table 379-0025.
4 In 2007-2008 and 2008-2009 the resources for the program activity Internal Services were distributed among the other three program activities. However, beginning with the 2009-2010 estimates cycle, Internal Services resources are displayed separately from the other three program activities. This reduces the ability to compare program activity spending between fiscal years.
5 There was no planned spending reported because the CEAP initiatives announcements (in Budget 2009) were made after publication of the 2009-2010 Report on Plans and Priorities.
6 Includes employee benefit costs (CAF $0.6 million, RInC $0.2 million, Canada Business Network $0.3 million).
7 The variance is largely attributable to the Atlantic Innovation Fund (AIF), where actual AIF spending was less than total authorities by $12.2 million. This was due to spending on projects not flowing as anticipated.
8 Business Special Surveys and Technology Statistics Division, Statistics Canada, March 2010.
9 Impact Evaluation of the Atlantic Canada Opportunities Agency Innovation Program Sub-activity, Final Report, ACOA Evaluation Unit, January 19, 2010.
10 Between 2000 and 2005, 93% of jobs created by firms in Atlantic Canada were attributed to small businesses. Calculation generated using data from Statistics Canada Longitudinal Employment Analysis Program.
11 This performance indicator is currently under review.
12 There was no planned spending reported because the CEAP initiatives announcements (in Budget 2009) were made after publication of the 2009-2010 Report on Plans and Priorities.
13 There was no planned spending reported because the CEAP initiatives announcements (in Budget 2009) were made after publication of the 2009-2010 Report on Plans and Priorities.
14 The variance was mainly attributable to increased demand in the BDP.
15 Evaluation of the ACOA Community Investment, Community Development Resources, Official Language Minority Communities and Aboriginal Communities Program Sub-activities, ACOA, December 3, 2009.
16 Evaluation of the Community Futures Program in Atlantic Canada Final Report, ACOA, June 2009
17 Audit of the Community Futures Program, Final Report, ACOA, December 2009.
18 Evaluation of the Atlantic Canada Opportunities Agency Community Investment, Community Development Resources, Official Language Minority Communities and Aboriginal Communities Program Sub-Activities, ACOA, December 3, 2009; and
Evaluation of the Community Futures Program in Atlantic Canada, ACOA, June 2009.
19 While most of the CAF projects are allocated to the program activity Community Development, nine projects worth $6 million were captured in the Enterprise Development program activity (see Section 2.1.1) due to their commercial nature. Nevertheless, these results are included in the CAF section within Community Development.
20 There was no planned spending reported because the CEAP initiatives announcements (in Budget 2009) were made after publication of the 2009-2010 Report on Plans and Priorities.
21 There was no planned spending reported because the CEAP initiatives announcements (in Budget 2009) were made after publication of the 2009-2010 Report on Plans and Priorities.
22 Once finalized, the evaluation will be available at http://www.acoa-apeca.gc.ca/English/Accountability/AuditsAndEvaluations/Pages/Evaluations.aspx