
Treasury Board of Canada Secretariat
www.tbs-sct.gc.ca
Common menu bar links
Breadcrumb Trail
ARCHIVED - Canada School of Public Service
 This page has been archived.
Archived Content
Information identified as archived on the Web is for reference, research or recordkeeping purposes. It has not been altered or updated after the date of archiving. Web pages that are archived on the Web are not subject to the Government of Canada Web Standards. As per the Communications Policy of the Government of Canada, you can request alternate formats on the "Contact Us" page.
Section III � Supplementary Information
Financial Highlights
The financial highlights presented within this Departmental Performance Report
are intended to serve as a general overview of the Canada School's financial position and operations. A more detailed
financial statement can be found on the Canada School's website at:
http://www.csps-efpc.gc.ca/aut/cdo/index-eng.asp.
| Condensed Statement of Financial Position At End of Year (March 31, 2009) |
% Change | 2009 | 2008 |
|---|---|---|---|
| Financial assets | -70% | 1,664 | 5,581 |
| Non-financial assets | 9% | 3,326 | 3,061 |
| Total Assets | -42% | 4,990 | 8,642 |
| Liabilities | 8% | 31,818 | 29,596 |
| Equity | 28% | (26,828) | (20,954) |
| TOTAL | -42% | 4,990 | 8,642 |
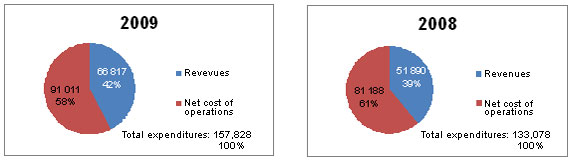
| Condensed Statement of Financial Operations At End of Year (March 31, 2009) |
% Change | 2009 | 2008 |
|---|---|---|---|
| Total Expenses | 19% | 157,828 | 133,078 |
| Total Revenues | 29% | 66,817 | 51,890 |
| Net Cost of Operations | 12% | 91,011 | 81,188 |
The decrease in financial assets is due to a $3.9 million reduction in accounts receivable. This is a direct result of improvements made throughout the year regarding the collection process and increased efforts on releasing invoices in a timely manner through the Learner and Registration Management System.
Financial Highlights Chart
List of Supplementary Information Tables
The following tables are located on the Treasury Board Secretariat website:
- Sources of Respendable and Non-Respendable Revenue
- User Fees
- Details on Project Spending
- Green Procurement
- Response to Parliamentary Committees and External Audits
- Internal Audits
- Evaluations
Other Items of Interest
- 2001-2006 Canada School of Public Service Report to Parliament
- Addendum to Five Year Report to Parliament
- 2008-09 Report on Plans and Priorities
- The Canada School of Public Service Act
- Public Service Modernization Act
1 The increase from Planned Spending to Total Authorities is mainly due to an increase in revenues, respendable revenues, operating budget carry forward and compensation for salary adjustments. The difference between Total Authorities and Actual Spending is made up of respendable revenues to be used in fiscal year 2009-10 according to section 18(2) of the Canada School of Public Service Act, operating budget carry forward and an amount set aside for the employee benefit plan.
2 The increase from Planned Spending to Total Authorities is mainly due to an increase in revenues, respendable revenues, operating budget carry forward and compensation for salary adjustments. The difference between Total Authorities and Actual Spending is made up of respendable revenues to be used in fiscal year 2009-10 according to section 18(2) of the Canada School of Public Service Act, operating budget carry forward and an amount set aside for the employee benefit plan.
3 Pursuant to section 18(2) of the CSPS Act.
4 The increase from Planned Spending to Total Authorities is mainly due to an increase in revenues, respendable revenues, operating budget carry forward and compensation for salary adjustments. The difference between Total Authorities and Actual Spending is made up of respendable revenues to be used in fiscal year 2009-10 according to section 18(2) of the Canada School of Public Service Act, operating budget carry forward and an amount set aside for the employee benefit plan.
5 The increase over this period is due to the growth in course offerings (over 20 percent) and in learner enrolments (over 40 percent) and to the change of official languages courses funded by Treasury Board to courses generating statutory revenue.
6 Indicates expenditures the Department is required to make that do not require an appropriation act.
7 The Total Actual spending can be found in the departmental performance reports for fiscal years 2006-07 and 2007-08 and in the public accounts for fiscal year 2008-09.
8 The actual spending increased due to revenue increase from fiscal year 2007-08 to fiscal year 2008-09.
9 The Canada School of Public Service collects data on learner satisfaction (Level 1 evaluations) for all learning activities. Level 1 evaluations include questions on intent to apply knowledge gained. Ability to apply and actual application are measured at higher levels of evaluation (Level 3 and Program Evaluations), which are only conducted on selected applicable learning activities as per the Evaluation Plan.
10 This is an estimate due to the fact that teachers providing open sessions or informal learning do not always have adequate tools or time to keep an accurate count of attendance. There are plans to implement new tools which will allow for more systematic attendance records in future years.
11 This is based on the calculation of approximately 43,800 hours of instruction divided by 7 hours per day.
12 The increase in FTEs was due to doubling the number of courses offered from 2007-08 and increasing the number of learning days from approximately 13, 500 days to over 22, 000.