
Treasury Board of Canada Secretariat
www.tbs-sct.gc.ca
Common menu bar links
Breadcrumb Trail
ARCHIVED - Agriculture and Agri-Food Canada
 This page has been archived.
Archived Content
Information identified as archived on the Web is for reference, research or recordkeeping purposes. It has not been altered or updated after the date of archiving. Web pages that are archived on the Web are not subject to the Government of Canada Web Standards. As per the Communications Policy of the Government of Canada, you can request alternate formats on the "Contact Us" page.
Minister's Message

Canadian agriculture is the backbone of our great country. The security and stability of our food supply and our rural communities all start with strong, vibrant farms. As Minister, I am proud to belong to a Government that always puts Farmers First in all of our agricultural policies
As our country comes to grips with the global economic downturn, Canada needs an innovative, competitive and profitable agricultural sector more than ever. It’s the third-largest contributor to our GDP, employs one in eight Canadians and contributes more than $13.1 billion to our trade surplus.
Like many other Canadians, farmers face major challenges due to the economic situation. As a Government, we are striving to address the agricultural sector’s short-term challenges, while improving its long-term prospects for growth and success. We recognize agriculture runs on solid planning, credit and cash flow.
I am proud of how my department, Agriculture and Agri-Food Canada, stepped up to the plate for Canada's agricultural industry in 2008-09. Over the past year, we completed agreements with all provinces and two territories under the new Growing Forward policy framework for agriculture. The federal government is investing $1.8 billion over five years in non-business risk management programs for farmers, which target their unique needs and help them compete through greater support for innovation and the environment.
As part of Growing Forward, we launched a new set of programs to help farmers better manage their business risks. These programs delivered $1 billion in much-needed assistance to our livestock producers. We also delivered $454 million to livestock producers through emergency cash advances. Our flexible, responsive business risk management programming delivered for farm families hit by unforeseen disasters across the country.
A healthy and growing export market for our world-class agricultural products creates opportunities for farmers and jobs for Canadians. Last year, agricultural and food exports reached $42.8 billion, a 21-per-cent increase from 2007. We worked hard in 2008-09 to grow market opportunities for farmers and processors. I led several successful trade missions to the Middle East, Asia and South America. We were able to expand access for Canadian products, including beef. Canada will continue to urge our trading partners to pursue trade that is based on rules and rooted in science.
Our farmers know that good environmental stewardship is good business. In the past year, we worked with producers to improve conservation of air, water, soils, and biodiversity. Through our balanced approach to biofuels programming, we helped producers grow their businesses and help the environment, while safeguarding food security.
The Government knows that science is key to helping our economy and our agricultural industry compete. AAFC is a respected national leader in science and technology. In 2008-09, we strengthened that reputation, working together with industry to develop new markets for our farmers.
This year, the Government took further action for farmers and the agricultural sector through Canada's Economic Action Plan. The plan committed $500 million to the Agricultural Flexibility Fund, which will help the sector adapt to pressures, improve its competitiveness and maximize market opportunities. The plan also improved access to credit for farmers and co-operatives, with up to $1 billion in loan guarantees. Further, it is helping livestock producers get their product to market, with a $50-million program to improve efficiency and competitiveness in Canadian slaughter facilities.
All of our initiatives and programs are designed to work together to help put the Canadian agriculture and agri-food sector in a stronger position. Our accomplishments for agriculture in 2008-09 have been a team effort. Despite current economic challenges, I know I can depend on my portfolio team in agriculture to do its part to achieve a stronger and more dynamic agricultural sector for the prosperity of all Canadians.
These portfolio organizations - Agriculture and Agri-Food Canada, the Canadian Food Inspection Agency, Farm Credit Canada, the Canadian Grain Commission, the Canadian Dairy Commission, the National Farm Products Council, and the Canada Agricultural Review Tribunal - have different jobs to do in supporting me as Minister. What they have in common is a sense of commitment to make our sector the best it can be.
As a government, we are striving to address the agriculture sector's short-term challenges, while improving its long-term prospects for growth and success.
The Honourable Gerry Ritz, P.C., M.P.
Minister of Agriculture and Agri-Food and
Minister for the Canadian Wheat Board
Section I: Departmental Overview
Raison d'�tre
Agriculture and Agri-Food Canada (AAFC) is an economic and science-based department that supports the agriculture, agri-food and agri-based products sector to help ensure maximum benefits to Canadian citizens. This sector is national in scope, remarkably diverse, and consists of large, medium and small enterprises. Its value chain begins at the farm-gate and ends at the consumer plate. The sector provides both food and non-food commodities, relying upon cutting-edge technologies. In 2008, it accounted for eight per cent of Canada’s GDP, $147.6 billion in consumer sales, $42.8 billion in exports (including seafood products) and almost $13.1 billion of this country’s trade surplus.
AAFC works to ensure the agriculture and agri-food industry is able to compete in international and domestic markets to derive economic returns to the sector and the Canadian economy as a whole. Through its work, the department strives to help the industry maximize its long-term profitability and competitiveness, while respecting the environment.
Responsibilities
AAFC provides information, research and technology, and policies and programs to help Canada's agriculture, agri-food and agri-based products sector increase its environmental sustainability, compete in markets at home and abroad, manage risk, and embrace innovation. Created in 1868, the department today maintains offices, laboratories and other facilities from coast to coast.
The activities of the department extend from the farmer to the consumer, through all phases of production, processing and marketing of agriculture and agri-food products.
The department derives its mandate from the Department of Agriculture and Agri-Food Act, and also administers other Acts for which the Minister is responsible. A full list of these Acts is available.
AAFC provides leadership and co-ordinates the rural dimension of federal policies and programs through the Canada's Rural Partnership. It promotes economic growth and social development through co-operatives.
The department ensures co-ordinated policy and program development and effective co-operation in meeting challenges on key cross-portfolio issues by working collaboratively with other organizations within the Agriculture and Agri-Food portfolio: the Canadian Dairy Commission; the Canadian Food Inspection Agency; the Canadian Grain Commission; Farm Credit Canada; the Canada Agricultural Review Tribunal; and the National Farm Products Council. The department also includes a special operating agency, the Canadian Pari-Mutuel Agency, which regulates and supervises betting on horse-racing.
More information on these portfolio organizations is available.
In addition, the department supports the Minister in his role as Minister for the Canadian Wheat Board.
Strategic Outcomes and Program Activity Architecture
Strategic Outcomes
To effectively pursue its mandate, AAFC worked to achieve the following three Strategic Outcomes in 2008-09:
- Security of the Food System - A secure and sustainable agriculture and agri-food system that provides safe and reliable food to meet the needs and preferences of consumers;
- Health of the Environment - An agriculture and agri-food sector that uses environmental resources in a manner that ensures their sustainability for present and future generations; and
- Innovation for Growth - An innovative agriculture and agri-food sector that develops food and other agriculture-related products and services to capture opportunities in diversified domestic and global markets.
Program Activity Architecture
The chart below displays the program activities and program sub-activities that comprised AAFC’s Program Activity Architecture (PAA) for 2008-09. The PAA reflects how the department allocated and managed its resources and made progress toward its Strategic Outcomes.
AAFC's 2008-09 Program Activity Architecture*
| 1. Security of the Food System | 2. Health of the Environment | 3. Innovation for Growth |
|---|---|---|
| 1.1 Business Risk Management | 2.1 Environment | 3.1 Innovation and Renewal |
| 1.1.1 Margin-based Programs | 2.1.1 Direct On-Farm Programming | 3.1.1 Science Policy and Coordination |
| 1.1.2 Net Income Stabilization Account and Other Business Risk Management Programs | 2.1.2 Pest Management Programs | 3.1.2 Agriculture Transformation Programs |
| 1.1.3 Disaster Programs | 2.1.3 Environmental Health Science | 3.1.3 Renewal Programs |
| 1.1.4 Insurance Programs | 2.1.4 National Land and Water Information Service | 3.1.4 Sustainable Production Systems |
| 1.1.5 Financial Guarantee Programs | 2.1.5 Land and Water Stewardship | 3.1.5 Bioproducts and Bioprocesses |
| 1.1.6 AgriInvest | 2.1.6 Community Pastures Program | 3.1.6 Office of Intellectual Property and Commercialization |
| 1.2 Food Safety and Food Quality | 3.1.7 Matching Investment Initiative | |
| 1.2.1 Food Safety and Food Quality Programs | 3.2 Rural and Co-operatives Secretariats | |
| 1.2.2 Food Safety and Food Quality Science | 3.2.1 Rural | |
| 1.3 Markets and International | 3.2.2 Co-operatives | |
| 1.3.1 International Trade Agreements | 3.3 Canadian Pari-Mutuel Agency | |
| 1.3.2 Canadian Agriculture and Food International Program | ||
| 1.3.3 International Science Cooperation | ||
| 1.3.4 Technical Trade | ||
| 1.3.5 International Capacity Building | ||
| 1.3.6 Sector Development and Analysis | ||
| 1.3.7 Branding Management / Value Chain Round Tables | ||
| 1.3.8 Market Access and Market Development | ||
| 1.3.9 Trade Disputes | ||
| 1.3.10 Regional Operations | ||
| 1.4 National Farm Products Council |
* AAFC has created a new PAA for 2009-10 to reflect more clearly the department's mandate and vision. The 2009-10 PAA also captures AAFC's new policy framework, Growing Forward. AAFC will report against the new PAA in the 2009-10 Departmental Performance Report, as it has in the 2009-10 Report on Plans and Priorities.
Summary of Performance
| Planned Spending | Total Authorities | Actual Spending |
|---|---|---|
| 3,194.3 | 2,766.5 | 2,585.7 |
| Planned | Actual FTEs1 | Difference |
|---|---|---|
| 6,705 | 6,385 | (320) |
Performance Summary
The following tables provide a summary of actual performance and planned and actual spending for each of AAFC’s three Strategic Outcomes. (Please refer to footnotes following the last, summary table.)
| Strategic Outcome 1: Security of the Food System | ||
| Performance Indicators | Targets | 2008-09 Performance |
|---|---|---|
| Current year producers' net market income (NMI) plus BRM program payments compared to the previous five-year average NMI plus BRM payments for the sector | 85% of the previous five-year NMI plus BRM payments | Using the most recent data for 2007, these programs and other BRM related programs contributed to bring net market income for 2007 to a level exceeding 80% of the previous five-year average net market income, including BRM payments. |
| Total exports of agricultural, food and seafood products | $35 billion by March 31, 2013 | The value of agriculture, agri-food and seafood exports increased to $42.8 billion in 2008, exceeding the target of $35 billion. |
| Number of national organizations participating in on-farm implementation | 9 organizations by March 31, 2009 | The Canadian Food Safety and Quality Program is driven by client demand. Last year, 8 national producer organizations, representing about 112,000 farm operations, requested funding in 2008-09 to implement on-farm food safety systems. |
| Program Activity | 2007-08 Actual Spending ($ millions) - Net |
2008-09 ($ millions) - Net | Alignment to Government of Canada Outcomes | |||
|---|---|---|---|---|---|---|
| Main Estimates2 | Planned Spending3 | Total Authorities4 | Actual Spending5 | |||
| Business Risk Management | 2,223.6 | 1,758.1 | 2,080.3 | 1,411.2 | 1,362.2 | Strong Economic Growth |
| Food Safety and Food Quality | 113.3 | 61.6 | 97.2 | 106.2 | 75.9 | Strong Economic Growth |
| Markets and International6 | 80.5 | 96.3 | 127.7 | 122.8 | 111.1 | Strong Economic Growth and Prosperous Canada Through Global Commerce |
| National Farm Products Council | 3.7 | 5.0 | 5.3 | 6.2 | 6.1 | Strong Economic Growth |
| Total (Net) | 2,421.2 | 1,921.0 | 2,310.5 | 1,646.5 | 1,555.2 | |
| Strategic Outcome 2: Health of the Environment | ||
| Performance Indicators | Targets Each index to have an improving trend by 2014 |
2008-09 Performance |
|---|---|---|
| Soil Quality Agri-Environmental Index |
81 by March 31, 2030 |
Soil Quality, Water Quality and Air Quality indices were within the Good range. Soil Quality showed an improving trend and Air Quality was stable. Water Quality showed a deteriorating trend due to an increase in contamination risk from higher amounts of nitrogen added to crops in the form of fertilizer and manure. |
| Water Quality Agri-Environmental Index | 81 by March 31, 2030 (with stable or improving trend) |
|
| Air Quality Agri-Environmental Index | 81 by March 31, 2030 (with stable or improving trend) |
|
| Biodiversity Quality Agri-Environmental Index |
81 by March 31, 2030 (with stable or improving trend) Note: Scale for these indices 0-20=Unacceptable |
The Biodiversity index was within the Average range on the Agri-Environmental Index, showing a deteriorating trend due to a shift in land use to more intense production and away from pastures and natural land. Note: Results based on 2001 data published in 2005 in Environmental Sustainability of Canadian Agriculture: Agri-Environmental Indicator Series, Report #2 |
| Program Activity | 2007-08 Actual Spending ($ millions) - Net |
2008-09 ($ millions) - Net | Alignment to Government of Canada Outcomes | |||
|---|---|---|---|---|---|---|
| Main Estimates2 |
Planned Spending3 |
Total Authorities4 |
Actual Spending5 |
|||
| Environment | 444.5 | 222.2 | 389.2 | 382.4 | 331.6 | Clean and Healthy Environment |
| Total (Net) | 444.5 | 222.2 | 389.2 | 382.4 | 331.6 | |
| Strategic Outcome 3: Innovation for Growth | ||
| Performance Indicators | Targets | 2008-09 Performance |
|---|---|---|
| % increase in private industry's Research and Development expenditures in the agri-food sector as measured by food processing and bioproducts sectors (% reflects a real increase, after adjustments for inflation) | 10% by March 2014 | Progress toward this five-year target has been achieved and is reflected in Program Activity performance information in Section II of this report. However, specific information against this Strategic Outcome target was not measured in this reporting period. |
| Increase in agriculture Net Value-Added (a Statistics Canada measure of Canadian value-added Canadian Gross Domestic Products) | 7% by March 2014 | As above |
| % increase in production of bio-products as measured by revenues from bioproducts | 10% by March 2014 | As above |
| Program Activity | 2007-08 Actual Spending ($ millions) - Net |
2008-09 ($ millions) - Net | Alignment to Government of Canada Outcomes | |||
|---|---|---|---|---|---|---|
| Main Estimates2 |
Planned Spending3 |
Total Authorities4 |
Actual Spending5 |
|||
| Innovation and Renewal | 511.5 | 410.8 | 465.2 | 708.2 | 677.0 | Innovative and Knowledge-Based Economy |
| Markets and International6 | 34.5 | - | - | - | - | Strong Economic Growth and Prosperous Canada Through Global Commerce |
| Rural and Co-operatives Secretariats | 28.1 | 15.6 | 29.5 | 25.9 | 22.7 | Innovative and Knowledge-Based Economy |
| Canadian Pari-Mutuel Agency | (0.9) | - | - | 3.6 | (0.8) | Fair and Secure Marketplace |
| Total (Net) | 573.2 | 426.3 | 494.7 | 737.7 | 698.9 | |
| Summary of Planned and Actual Spending for all Strategic Outcomes | |||||
| 2007-08 Actual Spending ($ millions) - Net |
2008-09 ($ millions) - Net | ||||
|---|---|---|---|---|---|
| Main Estimates2 |
Planned Spending3 |
Total Authorities4 |
Actual Spending5 |
||
| Sub-total Planned Spending (Net) | 3,438.8 | 2,569.6 | 3,194.3 | 2,766.5 | 2,585.7 |
| Less: Non-Respendable Revenue | 44.3 | N/A | 32.7 | N/A | 58.4 |
| Plus: Cost of Services received without charge7 | 48.2 | N/A | 57.6 | N/A | 57.7 |
| Total Departmental Spending | 3,442.8 | N/A | 3,219.1 | N/A | 2,585.0 |
1 Full-Time Equivalents - reflect only those FTEs funded through the department's appropriated resources. In addition to the actual FTEs of 6,385 there were 55 FTEs employed by AAFC for research funded through collaborative agreements with industry partners and 25 FTEs funded from other government departments. Also, 407 FTEs were employed as students.
2 Main Estimates figures are as reported in the 2008-09 Main Estimates.
3 Planned Spending figures are as reported in the 2008-09 Report on Plans and Priorities (RPP). Planned spending reflects funds already brought into the department's reference levels as well as amounts to be authorized through the Estimates process as presented in the Annual Reference Level Update. It also included adjustments totalling $624.7 million for funding approved in the government fiscal plan, but not yet brought into the department’s reference level.
4 Authorities are 2008-09 Main Estimates plus Supplementary Estimates and Allotment transfers received during the 2008-09 fiscal year, as well as adjustments to statutory amounts, internal adjustments and transfers (totalling $196.9 million), as reported in the 2008-09 Public Accounts.
5 Actual Spending figures represent the actual expenditures incurred during the 2008-09 fiscal year, as reported in the 2008-09 Public Accounts. In certain cases, where Authorized amounts are unspent, they can be re-profiled for use in future years.
6 The Markets and International Program Activity contributed to two Strategic Outcomes in the 2007-08 year: Security of the Food System and Innovation for Growth. In 2008-09, it contributed to just Security of the Food System.
7 Cost of services received without charge includes accommodation provided by Public Works and Government Services Canada (PWGSC), the employer's share of employees' insurance premiums and expenditures paid by Treasury Board Secretariat (excluding revolving funds), Workers' Compensation coverage provided by Social Development Canada, and services provided by the Department of Justice Canada.
The variance between Actual and Planned Spending is primarily attributable to Business Risk Management (BRM) programming. BRM programs are demand-driven in nature. Spending for those programs fluctuates to meet the demands and requirements of the agriculture industry.
The figures in the above tables have been rounded.
Due to rounding, figures may not add to the exact totals shown.
Contribution of Priorities to Strategic Outcomes
The agriculture and agri-food sector continues to play an important economic and social role in Canada. Ensuring the sector has the tools it needs to continue this contribution is key to maximizing its long-term profitability and competitiveness, while meeting growing market and consumer demands for safe food and environmental stewardship. In 2008-09, AAFC provided the Canadian agriculture and agri-food sector with new tools to increase long-term profitability and competitiveness.
The 2008-09 year marked a transition from the Agricultural Policy Framework to Growing Forward, Canada's new policy framework for the agriculture, agri-food and agri-based products sector. The department helped producers participate in the emerging biofuels industry, supported industry-led innovation strategies across value chains and further implemented its Science and Innovation Strategy, while complementing the objectives of Canada's federal Science and Technology Strategy. A new suite of business risk management (BRM) programs was also launched, building on previous income-stabilization programs, to provide producers across the country with more responsive, predictable and bankable assistance.
Additional information on these operational priorities is provided in the following table.
| Operational Priorities | Type | Status | Links to Strategic Outcome(s) |
|---|---|---|---|
|
Growing Forward
A transformative policy framework that supports a sector that is competitive and innovative, generating returns to the sector and the Canadian economy as a whole |
New |
Successfully Met
The Growing Forward multilateral and bilateral agreements were mostly signed in 2008-09 allowing federal and province/territory-specific programming to be implemented, including BRM and non-BRM programs. |
These agreements were a critical step in implementing Growing Forward programming to help achieve AAFC’s Strategic Outcomes. |
|
Science and Innovation
Equipping the industry with bioproducts, knowledge-based production systems and strategies to capture opportunities and manage change |
Ongoing |
Successfully Met
Innovation and competitiveness were supported by increased producer and sector participation in new and emerging industries through ecoAgriculture Biofuels Capital (ecoABC), Agriculture Bioproducts Innovation Program (ABIP), Agri-Opportunities, and the Biofuels Opportunities for Producers Initiative. |
|
|
New Suite of BRM Programs
Enhancing producers’ capacity to manage risk, and increasing the sector’s viability and profitability |
New |
Successfully Met
A more responsive, bankable and predictable suite of BRM programs was implemented on April 1, 2008 under Growing Forward. These programs included AgriInvest (a savings account program for producers), AgriStability (an improved margin-based program), AgriInsurance (insurance against production losses) and AgriRecovery (a disaster relief framework). |
|
AAFC’s management priorities for the effective delivery of programs and services included strengthening its corporate management operations. During 2008-09, the department updated its Management, Resources and Results Structure (MRRS) to reflect the new Growing Forward policy framework. The MRRS supports a common, government-wide approach to the collection, management and reporting of financial and non-financial performance information. AAFC also improved risk management through tools such as the Corporate Risk Profile, Business Continuity Plans, and Emergency Management Framework.
The department continued its client-focussed approach to service delivery, which was supported by its Information Management and Technology framework. AAFC worked closely with other organizations of the agriculture and agri-food portfolio to address common challenges and to foster the development of cohesive policies. In addition, the department also supported the Clerk of the Privy Council’s priorities for Public Service Renewal, including further integration of Human Resources planning with departmental business planning.
Additional information on these management priorities is provided in the following table.
| Management Priorities | Type | Status | Links to Strategic Outcome(s) |
|---|---|---|---|
|
Corporate Management Key initiatives to address the Corporate Management priority included: (1) updating the Management, Resources and Results Structure (MRRS) to reflect the new Growing Forward policy framework; and (2) improving risk management through tools such as the Corporate Risk Profile (CRP),Business Continuity Plans and Emergency Management Framework |
Ongoing |
Mostly Met
In 2008-09, AAFC updated its MRRS but did not implement it as this was a transition year to the new Growing Forward framework. The existing MRRS was continued. AAFC put in place its 2008-10 CRP, prioritizing risks, describing mitigation strategies, assigning accountability for managing these strategies, and linking risks to Strategic Outcomes. Also, the Business Continuity Program and framework continued to be developed. The Emergency Management Framework was close to completion and work was continuing on a complementary document outlining AAFC’s Concept of Operations; it is anticipated that both documents would be finalized and approved simultaneously in 2009-10. |
Sound management practices, processes and systems, especially in areas such as service delivery to clients, are essential to AAFC’s ability to deliver its programs and achieve progress on its three Strategic Outcomes. By having an MRRS that accurately reflects the programs of the department and clear linkages to the CRP and other risk management tools, AAFC is in a better position to anticipate challenges and capture opportunities. Progress was achieved on Business Continuity and Emergency Management frameworks that will help ensure that, in challenging situations, the department can maintain the capacity to deliver essential programs and achieve progress on its three Strategic Outcomes. |
|
Citizen-focused Service AAFC continued its client-focussed approach to service delivery, with a commitment to achieving measurable improvements in response to client expectations |
Previously committed to |
Successfully met
Phase 1 of the Service Inventory (BRM) was completed on time and on budget; AAFC launched the Service Excellence Web corner; more informative, client-friendly benefit statements to producers were created; and a new quality assurance process reduced errors in benefit calculations, increasing accuracy from 90% to 97%. AAFC's second national client satisfaction survey was completed in March 2009. This survey and multiple rounds of Growing Forward consultations will help guide the department in determining its service agenda priorities. |
|
|
Portfolio collaboration
AAFC promoted portfolio collaboration to help ensure cohesive policy and program development and effectively manage challenges in the agriculture and agri-food sector |
Ongoing |
Successfully Met AAFC co-ordinated portfolio-wide approaches to policy and program development through a variety of collaborative mechanisms, in areas such as communications, human resources and market information. |
|
|
People Management To deliver on public service renewal priorities, AAFC continued to improve integration of Human Resources (HR) planning with business planning, focus on recruitment and employee development, and build and maintain effective systems and processes |
Previously committed to |
Successfully met AAFC met or exceeded its commitments under all public service renewal priority areas set out in the Clerk’s 2008-09 renewal action plan. AAFC was assessed as Strong regarding Public Service Renewal in the Management Accountability Framework (MAF) assessment by the Treasury Board Secretariat (TBS) for 2008-09. |
|
|
Information Management and Technology AAFC continued to implement a strategic management framework for Information Management (IM) and Information Technology (IT), to achieve the effective delivery of client-centred programs, services and information |
Previously committed to |
Mostly met A business model and IM/IT governance structure were developed with the goals of cost transparency, improved departmental priority setting and closer alignment with departmental business outcomes. This model is expected to be implemented in 2009-10. |
|
The 2008-09 MAF assessment of AAFC’s management capacity was very positive. There was a significant improvement in the department’s ratings compared to the previous year’s assessment. The department was also recognized for progress made on both management priorities identified for 2008-09: Effectiveness of Internal Audit; and Effective Management of Security and Business Continuity.
TBS has identified the following three management priorities for the coming year: Utility of the Corporate Performance Framework; Quality of Analysis in Treasury Board Submissions; and Extent to which the Workforce is Productive, Principled, Sustainable and Adaptable. AAFC is implementing actions to address these areas and other opportunities for improving its management practices.
Risk Analysis
Agricultural production carries inherent risk. As noted in the 2008-09 RPP, these production risks include weather-related disasters, climate change, pests, and disease. For example, farmers and ranchers in southwest Saskatchewan were again hard hit by drought this past year. In response, AAFC announced that $17 million in federal financial assistance was being made available under the new AgriRecovery program.
The sector also faces risk in terms of market and trade conditions. In 2008-09, the department repeatedly raised concerns with the U.S. regarding its mandatory country-of-origin labeling (COOL) provisions and the resulting negative impacts on agriculture and agri-food products. In December 2008, Canada sought formal consultations with the U.S. under the World Trade Organization’s (WTO) dispute settlement process.
In March 2009, Minister Ritz travelled to Korea to have final face-to-face discussions with the Korean ministers for trade and agriculture before Canada initiated the WTO dispute settlement process. In April, Canada requested formal WTO consultations with Korea on its measures affecting imports of bovine meat and meat products from Canada. This occurred after six years of Canadian efforts to restore access for Canadian beef to Korea based on science. The Government of Canada is continuing to pursue resolution of this case. The next formal stage in the WTO process is application before the WTO dispute settlement panel, expected to take place in fall 2009.
The department also remained very active in pressing for an ambitious and balanced outcome at the WTO trade negotiations in Geneva.
Last year, in addition to these production and market risks, the impact of global economic uncertainty was especially hard-felt across the sector. Such risks and uncertainty underline the importance of sound mitigation strategies to prepare for and prevent or limit the impact of potential threats. It is equally important that government programming help strengthen industry’s capacity to respond and recover by maintaining existing market access, as well as taking advantage of new and emerging opportunities. These imperatives are reflected in AAFC’s Security of the Food System and Innovation for Growth Strategic Outcomes and the Program Activities falling under these Outcomes.
Expenditure Profile
AAFC departmental spending varies from year to year in response to the circumstances in the agriculture and agri-food industry in any given year. Programming within AAFC is in direct response to industry and economic factors which necessitate support to this vital part of our economy. Much of AAFC’s programming is statutory, ie. for programs approved by Parliament through enabling legislation, and therefore the associated payments fluctuate according to the demands and requirements of agriculture producers.
The figure below illustrates AAFC's spending trend from 2006-07 to 2011-12.
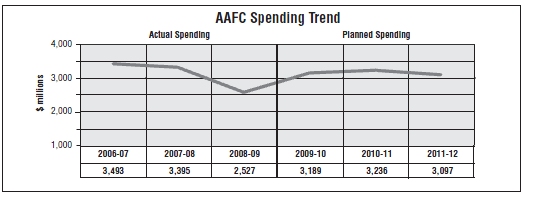
Over the period 2006-07 to 2011-12, Actual and Planned Spending varies from a high of $3.5 billion in 2006-07 to a low of $2.5 billion in 2008-09.
AAFC’s overall spending in 2006-07 was relatively higher than other years primarily as a result of the 2006 Federal Budget announcement of $1.5 billion to assist farmers in the transition to more effective programming for farm income stabilization. Included in this was $900 million for the Canadian Agricultural Income Stabilization Inventory Transition Initiative (CITI).
For 2007-08, spending included Budget 2007 funding of $1 billion for the Cost of Production and AgriInvest Kickstart programs (one-year programs). As a result of this one-time spending for 2007-08, actual spending for 2008-09 is relatively low in comparison. In addition, reduced expenditures in 2008-09 for Business Risk Management programming reflect a strong rise in crop receipts - mainly in the grains and oilseeds sector, for 2008 over 2007. 2008-09 was also a transition year as the five-year Agricultural Policy Framework expired and the new Growing Forward policy framework was introduced.
New Business Risk Management (BRM) programming was launched and other non-BRM programs were being adapted or replaced to meet the changing demands of the Canadian agriculture and agri-food sector. The planned spending for the 2009-10 to 2011-12 years includes the spending for the new Growing Forward initiatives.
Notes:
- Actual spending represents the actual expenditures incurred during the respective fiscal year, as reported in Public Accounts less Non-respendable Revenue, which include such items as refunds of previous years' expenditures, proceeds from the sales of Crown Assets, privileges, licences and permits.
- Planned spending reflects funds already brought into the department's reference levels as well as amounts to be authorized through the Estimates process as presented in the Annual Reference Level Update. It also includes adjustments in future years for funding approved in the government fiscal plan, but yet to be brought into the department's reference levels. Planned Spending has not been adjusted to include new information contained in Budget 2009, such as Strategic Review efficiency savings as well as new funding for the AgriFlexibility and Slaughterhouse programs. More information will be provided in the 2009-10 Supplementary Estimates.
- Actual and Planned Spending amounts all exclude Services Received without charge.
Voted and Statutory Items
This table illustrates voted and statutory items as displayed in AAFC's Main Estimates.
| Vote # or Statutory Item (S) |
Truncated Vote or Statutory Wording | 2006-07 | 2007-08 | 2008-09 | |
|---|---|---|---|---|---|
| Actual Spending |
Actual Spending |
Main Estimates1 |
Actual Spending2 |
||
| 1 | Operating Expenditures | 708.2 | 683.8 | 530.8 | 694.5 |
| 5 | Capital Expenditures | 34.1 | 32.5 | 32.0 | 30.3 |
| 10 | Grants and Contributions | 596.7 | 614.0 | 379.0 | 590.4 |
| 15 | Pursuant to Section 29 of the Financial Administration Act, to authorize the Minister of Agriculture and Agri-Food, on behalf of her Majesty in Right of Canada, in accordance with terms and conditions approved by the Minister of Finance, to guarantee payments of an amount not exceeding, at any one time, in aggregate the sum of $1,500,000,000 payable in respect of cash advances provided by producer organizations, the Canadian Wheat Board and other lenders under the Spring Credit Advance Program and $1,500,000,000 payable in respect of cash advances provided by producer organizations, the Canadian Wheat Board and other lenders under the Enhanced Spring Credit Advance Program. | - | - | - | - |
| 20 | Pursuant to Section 29 of the Financial Administration Act, to authorize the Minister of Agriculture and Agri-Food, on behalf of her Majesty in Right of Canada, in accordance with terms and conditions approved by the Minister of Finance, to guarantee payments of amounts not exceeding, at any time, in aggregate, the sum of $140,000,000 payable in respect of Line of Credit Agreements to be entered into by the Farm Credit Corporation for the purpose of the renewed (2003) National Biomass Ethanol Program. | - | - | - | - |
| (S) | Contributions Payments for the AgriInsurance program | - | - | 388.7 | 548.3 |
| (S) | Contribution Payments for the AgriStability program | - | - | 655.2 | 340.5 |
| (S) | Grant Payments for the AgriInvest program | - | 165.6 | - | 175.7 |
| (S) | Contributions to employee benefit plans | 74.0 | 74.7 | 69.2 | 74.9 |
| (S) | Contribution Payments for the Agricultural Disaster Relief Program / AgriRecovery | - | - | 108.4 | 55.4 |
| (S) | Payments in connection with the Agricultural Marketing Programs Act | 10.6 | 44.1 | 137.5 | 37.0 |
| (S) | Contribution Payments for the AgriInvest program | - | 1.7 | 159.5 | 17.7 |
| (S) | Grants in support of the Cull Breeding Swine Program | - | 38.0 | - | 12.0 |
| (S) | Grants in support of the Cost of Production Benefit | - | 353.5 | - | 8.7 |
| (S) | Grant payments for the Canadian Agricultural Income Stabilization Program Inventory Transition Initiative | 431.0 | (0.7) | - | 8.4 |
| (S) | Canadian Cattlemen's Association Legacy Fund | 4.9 | 7.0 | 5.0 | 7.0 |
| (S) | Spending of proceeds from the disposal of surplus Crown assets | 2.7 | 3.5 | - | 4.0 |
| (S) | Contributions payments for the Canadian Agricultural Income Stabilization Program Inventory Transition Initiative | 442.0 | - | - | 3.7 |
| (S) | Grant Payments for the Agricultural Disaster Relief Program - AgriRecovery | - | 0.1 | - | 1.0 |
| (S) | Minister of Agriculture and Agri-Food - salary and motor car allowance | 0.1 | 0.1 | 0.1 | 0.1 |
| (S) | Loan guarantees under the Farm Improvement and Marketing Cooperatives Loans Act | 0.0 | 0.7 | 4.0 | 0.0 |
| (S) | Refunds of amounts credited to revenues in previous years | 0.1 | 0.0 | - | 0.0 |
| (S) | Contributions in support of Business Risk Management programs under the Agricultural Policy Framework - Agriculture Policy Initiatives | 1.7 | 4.7 | - | 0.0 |
| (S) | Collection agency fees | 0.0 | 0.0 | - | 0.0 |
| (S) | Contributions in support of the AgriInvest Cost of Production Element | - | - | 100.0 | - |
| (S) | Grants to agencies established under the Farm Products Agencies Act | - | - | 0.2 | - |
| (S) | Contributions in support of Business Risk Management programs under the Agricultural Policy Framework - Production Insurance | 343.1 | 416.4 | - | - |
| (S) | Contributions in support of Business Risk Management programs under the Agricultural Policy Framework - Canadian Agricultural Income Stabilization program | 933.3 | 377.3 | - | - |
| (S) | Contribution payments for the AgriInvest Kickstart Program | - | 95.8 | - | - |
| (S) | Grant payments for the drought assistance package for livestock producers | - | 4.4 | - | - |
| (S) | Grant payments for the Golden Nematode Disaster Program | 1.0 | 0.5 | - | - |
| (S) | Contributions in support of the Cost of Production Benefit | - | 44.7 | - | (0.0) |
| (S) | Contributions to a transition to future risk management programming | (0.6) | (0.3) | - | (0.0) |
| (S) | Class contribution payments for Repositioning of the Canadian beef and cattle industry | (0.0) | (8.9) | - | (0.0) |
| (S) | Class contribution payments for the Transitional Industry Support Program | (1.6) | (0.1) | - | (0.1) |
| (S) | Class contribution payments for the Farm Income Program | (1.3) | (4.7) | - | (0.2) |
| (S) | Class grant payments for the Transitional Industry Support Program | (2.6) | (0.2) | - | (0.3) |
| (S) | Class grant payments for the Farm Income Payment Program | (2.8) | (1.0) | - | (0.3) |
| (S) | Canadian Pari-Mutuel Agency Revolving Fund | (0.8) | (0.9) | - | (0.8) |
| (S) | Contributions for agricultural risk management - Spring Credit Advance Program, Business Risk Management | (1.7) | 8.9 | - | (1.9) |
| (S) | Grants in support of the Grain and Oilseed Payment Program | (0.1) | (0.0) | - | (2.1) |
| (S) | Bovine Spongiform Encephalopathy Recovery Program | (2.3) | (1.0) | - | (2.1) |
| (S) | Contributions in support of Business Risk Management programs under the Agricultural Policy Framework-province-based programs | (1.9) | (0.0) | - | (6.9) |
| (S) | Grant payments for the AgriInvest Kickstart Program | - | 484.4 | - | (9.1) |
| Total | 3,567.7 | 3,438.8 | 2,569.6 | 2,585.7 | |
The variance between the Actual Spending for 2007-2008 and 2008-2009 is primarily attributable to Budget 2007 funding received in 2007-2008 for Cost of Production and AgriInvest Kickstart programs (one-year programs).
1 Main Estimates figures are as reported in the 2008-2009 Main Estimates.
2 Actual figures represent the actual expenditures incurred during the 2008-2009 fiscal year, as reported in the 2008-2009 Public Accounts. In certain cases, where Authorized amounts are unspent, they can be re-profiled for use in future years.
The figures have been rounded. Figures that cannot be listed in millions of dollars are shown as 0.0. Due to rounding, figures may not add to the totals shown.