
Treasury Board of Canada Secretariat
www.tbs-sct.gc.ca
Common menu bar links
Breadcrumb Trail
ARCHIVED - Canada School of Public Service
 This page has been archived.
Archived Content
Information identified as archived on the Web is for reference, research or recordkeeping purposes. It has not been altered or updated after the date of archiving. Web pages that are archived on the Web are not subject to the Government of Canada Web Standards. As per the Communications Policy of the Government of Canada, you can request alternate formats on the "Contact Us" page.
Section III: Supplementary Information
Organizational Information
The School is a departmental corporation whose legislative mandate flows from the Canada School of Public Service Act (the former CCMD Act, as amended by the Public Service Modernization Act).
Organization and Accountability
The School’s Strategic Outcome – Public servants have the common knowledge and leadership and management competencies required to effectively serve Canada and Canadians – is supported by three program activities:
- Public servants able to perform in their current job, take on the challenges of the next job in a dynamic, bilingual environment
- Public Service has strong leaders delivering results for Canadians; and
- Public Service innovates to achieve excellence in delivering results for Canadians.
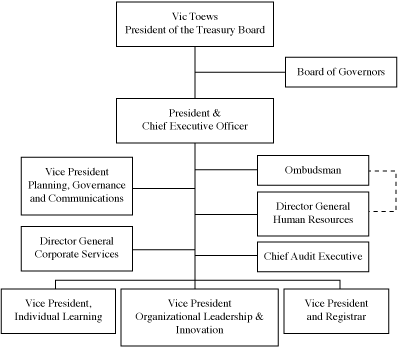
The School’s organizational structure is loosely aligned with the Program Activity Architecture and includes
- Three major operational sectors – Individual Learning, Organizational Leadership & Innovation and the Registrar; and
- Four administrative focal points – Planning, Governance & Communications; Corporate Services; Human Resources and the Ombudsperson.
The figure below highlights the elements of the organization:
Responsibility
| Individual Learning |
|
| Organizational Leadership and Innovation |
|
| Registrar |
|
| Planning, Governance & Communications |
|
| Corporate Services |
|
| Human Resources |
|
Governance
The School has implemented a systematic governance model. It includes:
- A Board of Governors that is established in legislation and is responsible for the conduct and management of the School; chaired by the Clerk of the Privy Council and Secretary to Cabinet, the Board of Governors meets at least twice during each fiscal year;
- The position of President which is also established in legislation; the President is the chief executive officer of the School and is responsible for supervision over and direction of the work and staff of the School;
- A Senior Executive Committee which meets periodically to establish priorities and approve budgets, oversee the implementation of the strategic directions set by the Board of Governors and report to the Board on the School’s operation;
- An Operations Committee which focuses on the coordination and harmonization of operational and policy issues within the School, and oversees the delivery of the School’s core business;
- A Management Committee to assist with the operations of the School. The Committee meets periodically to inform managers of the Board’s decisions on strategic directions and priorities and to provide a forum for the discussion of progress in implementing priorities;
- An Internal Audit and Evaluation Committee to oversee the School’s corporate management framework, address horizontal management issues, and review and approve key corporate management documents; and
- A Human Resources Committee responsible for the review of proposed staffing strategies and, in accordance with School policies, recommend for approval by the President various HR requests. The Committee advises the Executive Committee on emerging issues and trends with respect to human resources strategies within the School.
Operational Flexibilities
The School is a departmental corporation whose legislative mandate flows from the Canada School of Public Service Act. The School’s most significant flexibilities, as a departmental corporation, are:
- Revenue Respending Authority – 18(2)
Subject to any condition imposed by the Treasury Board, the revenue from fees received by the School in a fiscal year through the conduct of its operations may be spent by the School for its purposes in that, or the next, fiscal year; - Staffing Authority – 15(2)
The President may, on behalf of the School, appoint and employ teaching and research staff and may, with the approval of the Treasury Board, establish the terms and conditions of their employment, including their remuneration; and - Intellectual Property Management Authority – 18(1)
The Board may, with the approval of the Treasury Board, prescribe the fees or the manner of determining the fees to be charged by the School when selling, licensing the use of or otherwise making available any copyright, trade–mark or other similar property right held, controlled or administered by the School.
For additional information see:
http://www.myschool–monecole.gc.ca/about/gov_struc_e.html.
Financial Tables
Table 1: Comparison of Planned to Actual Spending (including Full–time Equivalents)
This table offers a comparison of the Main Estimates, Planned Spending, Total Authorities, and Actual Spending for the most recently completed fiscal year, as well as historical figures for Actual Spending.
The $2.1million decrease in 2006–2007 from Main Estimates ($111.2M) to Planned Spending ($109.1M) is the result of reductions related to funding for Learning in the Public Sector and the expenditure review on procurement.
The $27 million increase in 2006–2007 from Planned Spending ($109.1M) to Total Authorities ($136.1M) is mainly due to:
|
Increase in revenues |
$12.6M |
The $23.1 million difference in 2006–2007 between Total Authorities ($136.1M) and Actual Spending ($113M) is made up of: revenues to be carried forward to fiscal year 2007–2008 according to section 18(2) of the Canada School of Public Service Act; and lapses in the normal course of business.
The $12.6 million increase in spending from 2005–2006 ($100.4M) to 2006–2007 ($113M) can be accounted for by: an increase in the level of funding for Learning in the Public Sector; and a decrease due to the end of funding for the Public Service Modernization Act.
The $21 million increase in spending from 2004–2005 ($79.4M) to 2005–2006 ($100.4M) is mainly due to new funding for Learning in the Public Sector and the Public Service Modernization Act, as well as compensation for salary adjustments.
| ($ thousands) | 2004–05 Actual |
2005–06 Actual |
2006–07 | |||
| Main Estimates |
Planned Spending |
Total Authorities |
Total Actuals | |||
| New Program Activities | ||||||
| Public Servants able to perform in their current job, take on the challenges of the next job in a dynamic, bilingual environment | 79,106 | 92,590 | 76,902 | |||
| Public Service has strong leaders delivering results for Canadians | 14,908 | 24,309 | 19,850 | |||
| Public Service organizations innovate to achieve excellence in delivering results for Canadians | 15,110 | 19,201 | 16,285 | |||
| Old Program Activities | ||||||
| Develop, Manage, Disseminate of Knowledge Products | 8,851 | 16,564 | 16,949 | Note 1 | Note 1 | Note 1 |
| Manage the Provision of Learning Services | 70,597 | 83,787 | 94,236 | Note 1 | Note 1 | Note 1 |
| Total | 79,448 | 100,351 | 111,185 | 109,124 | 136,100 | 113,037 |
| Less: Non–respendable revenue (note 2) | (12,000) | (6,143) | N/A | N/A | (480) | N/A |
| Less: Respendable revenue (pursuant to section 18(2) of the CSPS act) (note 2) | (11,496) | (19,474) | (20,000) | (20,000) | (42,341) | (26,750) |
| Plus: Cost of services received without charge (3) | 7,256 | 12,024 | N/A | 12,568 | N/A | 12,648 |
| Total Departmental Spending | 63,208 | 86,758 | 91,185 | 101,692 | 93,279 | 98,935 |
| Full–time Equivalents | 732.6 | 844.0 | N/A | 930.0 | N/A | 966.0 |
Notes:
(1) Adjustments have been made to the program activity architecture for the Canada School of Public Service due to a change in focus of its mandate. As a result, the program activity Develop, Manage, Disseminate Knowledge Products and the program activity Manage the Provision of Learning Services have been replaced with three new program activities which better reflect the business model of the School. (see Table 2: Crosswalk)
(2) Table 5 contains further details on respendable and non–respendable revenues.
(3) Table 4 contains further details on Cost of services received without charge
Table 2A: Resources by Program Activity
Adjustments have been made to the program activity architecture for the Canada School of Public Service due to a change in focus of its mandate. As a result, the program activity Develop, Manage, Disseminate Knowledge Products and the program activity Manage the Provision of Learning Services have been replaced with three new program activities which better reflect the business model of the School.
| New Program Activities | ||||
| Old Program Activities | Public servants able to perform in their current job, take on the challenges of the next job in a dynamic, bilingual environment |
Public Service has strong leaders delivering results for Canadians | Public Service organizations innovate to achieve excellence in delivering results for Canadians | Total |
| 2006–2007 Main Estimates ($ thousands) | ||||
| Develop, Manage and Disseminate Knowledge Products | 7,410 | 2,419 | 7,120 | 16,949 |
|
Manage the Provision of Learning Services |
73,677 | 12,529 | 8,030 | 94,236 |
| Total | 81,087 | 14,948 | 15,150 | 111,185 |
Table 2B: Resources by Program Activity
The following table provides information on how resources are used for the most recently completed fiscal year.
($ thousands)
| 2006–07 | |||||
| Program Activity |
Budgetary | ||||
| Operating | Contributions and Other Transfer Payments | Total: Gross Budgetary Expenditures | Less: Respendable Revenue |
Total: Net Budgetary Expenditures |
|
| Public Servants able to perform in their current job, take on the challenges of the next job in a dynamic, bilingual environment | |||||
| Main Estimates | 81,087 | 81,087 | (10,233) | 70,854 | |
| Planned Spending | 79,106 | 79,106 | (10,233) | 68,873 | |
| Total Authorities | 92,590 | 92,590 | (30,268) | 62,322 | |
| Actual Spending | 76,902 | 76,902 | (19,123 | 57,779 | |
| Public Service has strong leaders delivering results for Canadians | |||||
| Main Estimates | 14,948 | 14,948 | (4,731) | 10,217 | |
| Planned Spending | 14,908 | 14,908 | (4,731) | 10,177 | |
|
Total Authorities |
24,309 | 24,309 | (8,328) | 15,981 | |
|
Actual Spending |
19,850 | 19,850 | (5,261) | 14,589 | |
|
Public Service organizations innovate to achieve excellence in delivering results for Canadians |
|||||
|
Main Estimates |
14,850 | 300 | 15,150 | (5,036) | 10,114 |
|
Planned Spending |
14,810 | 300 | 15,110 | (5,036) | 10,074 |
|
Total Authorities |
18,885 | 316 | 19,201 | (3,745) | 15,456 |
|
Actual Spending |
15,969 | 316 | 16,285 | (2,366) | 13,919 |
|
Total |
|||||
|
Main Estimates |
110,885 | 300 | 111,185 | (20,000) | 91,185 |
|
Planned Spending |
108,824 | 300 | 109,124 | (20,000) | 89,124 |
|
Total Authorities |
135,784 | 316 | 136,100 | (42,341) | 93,759 |
|
Actual Spending |
112,721 | 316 | 113,037 | (26,750) | 86,287 |
Table 3: Voted and Statutory Items
This table primarily replicates the summary table listed in the Main Estimates. Resources are presented to Parliament in this format. Parliament approves the voted funding and the statutory information is provided for information purposes
($ thousands)
| Vote or Statutory Item |
Truncated Vote or Statutory Wording |
2006–07 | |||
| Main Estimates |
Planned Spending (1) |
Total Authorities (2) |
Total Actuals (3) | ||
| 25 |
Operating expenditures |
84,641 | 82,580 | 85,098 | 77,626 |
| (S) |
Contributions to employee benefit plans |
6,544 | 6,544 | 8,642 | 8,642 |
| (S) |
Spending of revenues |
20,000 | 20,000 | 42,341 | 26,750 |
| (S) |
Spending of proceeds from the disposal of surplus Crown assets |
– | – | 19 | 19 |
|
Total |
111,185 | 109,124 | 136,100 | 113,037 | |
(1) Planned Spending is from the 2006–2007 Report on Plans and Priorities
(RPP)
(2) The Total Authorities refers to the total spending authorities received during this fiscal year (i.e. through Main Estimates, Supplementary Estimates, Statutory Authorities)
(3) The Total Actuals can be found in the 2006–2007 Public Accounts
(S) Indicates expenditures the Department is required to make that do not require an appropriation act
Table 4: Services Received Without Charge
| ($ thousands) | 2006–07 Actual Spending |
| Accommodation Provided by Public Works and Government Services Canada | 8,499 |
| Contributions covering the employer’s share of employees’ insurance premiums and expenditures paid by the Treasury Board of Canada Secretariat (excluding revolving funds); employer’s contribution to employees’ insured benefits plans and associated expenditures paid by the Treasury Board of Canada Secretariat | 4,419 |
| Total 2006–07 Services received without charge | 12,648 |
Table 5: Sources of Respendable and Non–respendable Revenue
Respendable Revenue:
Planned Revenues are those forecasted to be collected at the time of the publication of the 2006–2007 Report on Plans and Priorities. Total Authorities are the revenues collected in 2006–2007 plus the carry forward of collected revenues in 2005–2006 pursuant to section 18(2) of the Canada School of Public Service Act. The
Actuals are the level of revenues expended in 2006–2007. The $15.6 million variance between Total Authorities and the Actuals will be carried forward to year two (i.e. 2007–2008)
Non–Respendable Revenue:
The Actuals reflected for 2004–2005 and 2005–06 are based on the previous Canadian Centre for Management Development
(CCMD) non–respendable revenue forecasts. The Total Authorities in 2006–07 are revenues collected which are not eligible to be respent by the School.
| ($ thousands) | Actual 2004–05 |
Actual 2005–06 |
2006–07 | |||
| Main Estimates |
Planned Revenue |
Total Authorities |
Actual |
|||
| Public servants able to perform in their current job, take on the challenges of the next job in a dynamic, bilingual environment | 10,233 | 30,268 | 19,123 | |||
| Public Service has strong leaders delivering results for Canadians | 4,731 | 8,328 | 5,261 | |||
| Public Service organizations innovate to achieve excellence in delivering results for Canadians | 5,036 | 3,745 | 2,366 | |||
| Develop, Manage, Disseminate Knowledge Products | 1,069 | 3,093 | 1,592 | |||
| Manage the Provision of Learning Services | 10,427 | 16,381 | 18,408 | |||
| Total Respendable Revenue | 11,496 | 19,474 | 20,000 | 20,000 | 42,341 | 26,750 |
Non–respendable Revenue
($ thousands) |
Actual 2004–05 |
Actual 2005–06 |
2006–07 | |||
| Main Estimates |
Planned Revenue |
Total Authorities |
Actual |
|||
| Canada School of Public Service | 12,000 | 6,143 | N/A | N/A | 480 | N/A |
| Total Non–respendable Revenue | 12,000 | 6,143 | N/A | N/A | 480 | N/A |
Table 6: Resource Requirements by Branch or Sector
($ thousands)
| 2006–07 | ||||
| Branch | Public servants able to perform in their current job, take on the challenges of the next job in a dynamic, bilingual environment | Public Service has strong leaders delivering results for Canadians | Public Service organizations innovate to achieve excellence in delivering results for Canadians | Total |
| President’s Office | ||||
| Planned Spending | 402 | 43 | 98 | 543 |
| Actual Spending | 732 | 171 | 80 | 983 |
| Corporate Services | ||||
| Planned Spending | 11,731 | 1,106 | 988 | 13,825 |
| Actual Spending | 11,003 | 6,210 | 459 | 17,672 |
| Human Resources | ||||
| Planned Spending | 2,128 | 230 | 518 | 2,876 |
| Actual Spending | 3,173 | 741 | 345 | 4,259 |
| Planning, Governance & Communications | ||||
| Planned Spending | 8,228 | 890 | 2,001 | 11,119 |
| Actual Spending | 2,763 | 542 | 3,237 | 6,542 |
| Individual Learning | ||||
| Planned Spending | 45,907 | 2,034 | 652 | 48,593 |
| Actual Spending | 44,108 | 4,721 | 664 | 49,493 |
| Organizational Leadership & Innovation | ||||
| Planned Spending | 1,303 | 10,605 | 5,692 | 17,600 |
| Actual Spending | 76 | 7,465 | 3,604 | 11,145 |
| Registrar and Regional Operations | ||||
| Planned Spending | 9,406 | 5,162 | 14,568 | |
| Actual Spending | 15,048 | 7,895 | 22,943 | |
| Total | ||||
| Planned Spending | 79,105 | 14,908 | 15,111 | 109,124 |
| Actual Spending | 76,903 | 19,850 | 16,284 | 113,037 |
Table 7: User Fees
| User Fee | Fee Type | Fee–setting Authority |
Date Last Modified |
2006–2007 | Planning Years | ||||||
| Forecast Revenue $0 |
Actual Revenue $0 |
Full Cost $0 |
Performance Standard | Performance Results | Fiscal Year | Forecast Revenue $0 |
Estimated Full Cost $0 |
||||
|
Fees charged for the processing of access requests filed under the Access to Information Act (ATIA) |
Other products and services (O) |
Access to Information Act | 1992 | 0.20 | 0.19 | 70.08 | Response provided within 30 days following receipt of request; the response time may be extended pursuant to section 9 of the ATIA. Notice of extension to be sent within 30 days after receipt of request | 30 day processing standard met | 2007–2008 2008–2009 2009–2010 |
0.25 0.25 0.25 |
70.08 |
Table 8: Financial Statements (unaudited) for the year ended March 31, 2007
Management Responsibility for Financial Statements
Responsibility for the integrity and objectivity of the accompanying financial statements for the year ended March 31, 2007 and all information contained in these statements rests with the management of the Canada School of Public Service ("the School"). These financial statements have been prepared by management in accordance with Treasury Board accounting policies which are consistent with Canadian generally accepted accounting principles for the public sector.
Management is responsible for the integrity and objectivity of information in these financial statements. Some of the information in the financial statements is based on management’s best estimates and judgement and gives due consideration to materiality. To fulfil its accounting and reporting responsibilities, management maintains a set of accounts that provides a centralized record of the School’s financial transactions. Financial information submitted to the Public Accounts of Canada and included in the School’s Departmental Performance Report is consistent with these financial statements.
Management maintains a system of financial management and internal control designed to provide reasonable assurance that financial information is reliable, that assets are safeguarded and that transactions are in accordance with the Financial Administration Act and the Canada School of Public Service Act, are executed in accordance with prescribed regulations, within Parliamentary authorities, and are properly recorded to maintain accountability of Government funds. Management also seeks to ensure the objectivity and integrity of data in its financial statements by careful selection, training and development of qualified staff, by organizational arrangements that provide appropriate divisions of responsibility, and by communication programs aimed at ensuring that regulations, policies, standards and managerial authorities are understood throughout the department.
The financial statements of the School have not been audited.
| ________________________ | ________________________ | |
| Jamie Tibbetts Senior Financial Officer |
Ruth Dantzer President and CEO |
Ottawa, Canada
__________________ 2007
Canada School of Public Service
Statement of Operations (Unaudited)
For the year ended March 31
(in thousands of dollars)
| 2007 | 2006 | ||||
|
Knowledge Products Program |
Learning Services Program |
Total |
Total |
||
| Transfer payments | 316 | – | 316 | 160 | |
| Operating expenses | |||||
| Salaries and employee benefits | 13,240 | 56,035 | 69,275 | 63,063 | |
| Professional and special services | 5,328 | 27,095 | 32,423 | 25,800 | |
| Rental of accommodation and equipment | 1,506 | 9,971 | 11,477 | 10,518 | |
| Transportation and telecommunications | 781 | 4,351 | 5,132 | 3,769 | |
| Small equipment and parts | 785 | 2,333 | 3,118 | 3,753 | |
| Utilities, materials and supplies | 204 | 2,043 | 2,247 | 1,724 | |
| Loss on write–off of tangible capital assets | 170 | 964 | 1,134 | – | |
| Printing and publishing | 82 | 795 | 877 | 1,855 | |
| Amortization of tangible capital assets | 121 | 688 | 809 | 551 | |
| Repair and maintenance | 41 | 264 | 305 | 554 | |
| Other operating expenses | 5 | 123 | 128 | 65 | |
| Total Operating expenses | 22,263 | 104,662 | 126,925 | 111,652 | |
| Total Expenses | 22,579 | 104,662 | 127,241 | 111,812 | |
| Revenues | |||||
| Sales of Goods and Services | 1,706 | 31,353 | 33,059 | 31,717 | |
| Other Revenues | 7 | 39 | 46 | 34 | |
| Total Revenues | 1,713 | 31,392 | 33,105 | 31,751 | |
| Net Cost of Operations | 20,866 | 73,270 | 94,136 | 80,061 | |
The accompanying notes form an integral part of these financial statements.
Statement of Financial Position (Unaudited)
At March 31
(in thousands of dollars)
| 2007 | 2006 | |
| Assets | ||
| Financial assets | ||
| Accountable advances | 11 | 25 |
| Accounts receivable | 6,882 | 2,007 |
| Total financial assets | 6,893 | 2,032 |
| Non-financial assets | ||
| Prepaid expenses | 150 | - |
| Inventories | - | 78 |
| Tangible capital assets (Note 4) | 4,707 | 4,707 |
| Total non-financial assets | 4,857 | 4,785 |
| Total | 11,750 | 6,817 |
| Liabilities | ||
| Accounts payable and accrued liabilities | 21,384 | 18,720 |
| Provision for vacation leave | 3,003 | 2,250 |
| Employee severance benefits (Note 5) | 8,641 | 6,710 |
| Other liabilities | 6 | 20 |
| Total liabilities | 33,034 | 27,700 |
| Equity of Canada | (21,284) | (20,883) |
| Total | 11,750 | 6,817 |
Contractual obligations (Note 6)
The accompanying notes form an integral part of these financial statements.
Statement of Equity of Canada (Unaudited)
For the year ended March 31
(in thousands of dollars)
| 2007 | 2006 | |
| Equity of Canada, beginning of year | (20,883) | (22,532) |
| Net cost of operations | (94,136) | (80,061) |
| Current year appropriations used (Note 3a) | 113,037 | 100,352 |
| Change in net position in the Consolidated Revenue Fund (Note 3c) | (31,950) | (30,666) |
| Services provided without charge by other government departments (Note 7) | 12,648 | 12,024 |
| Equity of Canada, end of year | (21,284) | (20,883) |
The accompanying notes form an integral part of these financial statements.
Statement of Cash Flow (Unaudited)
For the year ended March 31
(in thousands of dollars)
| 2007 | 2006 | |
| Operating Activitites | ||
| Net cost of operations | 94,136 | 80,061 |
| Non-cash items: | ||
| Amortization of tangible capital assets | (809) | (551) |
| Loss on write-off of tangible capital assets | (1,134) | - |
| Services provided without charge | (12,648) | (12,024) |
| Variations in Statement of Financial Position: | ||
| Increase in accounts receivable and accountable advances | 4,861 | 357 |
| Increase (decrease) in prepaid expenses and inventories | 72 | (44) |
| (Increase) in liabilities | (5,334) | (1,056) |
| Cash used by operating activities | 79,144 | 66,743 |
| Capital Investment Activities | ||
| Net acquisition of tangible capital assets | 1,943 | 2,943 |
| Cash used by capital investment activities | 1,943 | 2,943 |
| Net cash provided by Government of Canada | 81,087 | 69,686 |
The accompanying notes form an integral part of these financial statements.
Notes to the Financial Statements (Unaudited)
For the year ended March 31, 2007
Authority and Objectives
On April 1, 2004, amendments to the Canadian Centre for Management Development Act were proclaimed and the organization was renamed the Canada School of Public Service (the School). The amended legislation, now entitled the Canada School of Public Service Act, continues and expands the mandate of the former organization as a departmental corporation. The School reports to the President of the Treasury Board, through a Board of Governors made up of representatives of the private and public sectors.
The School is the common learning service provider for the Public Service of Canada. It brings a unified approach to serving the common learning and development needs of public servants and helps ensure that all public service employees across Canada have the knowledge and skills they need to meet the employer’s knowledge standard and deliver results for Canadians.
Through its programming, the School delivers on its legislative mandate to encourage pride and excellence in public service and to foster a common sense of purpose, values and traditions. It helps to ensure that public servants have the knowledge, competencies and skills they need to serve Canada and Canadians and supports the growth and development of public servants committed to the service of Canada. The School assists deputy heads in meeting their organization’s learning needs and pursues excellence in public sector management and public administration.
-
Summary of Significant Accounting Policies
These financial statements have been prepared in accordance with Treasury Board accounting policies which are consistent with Canadian generally accepted accounting principles for the public sector.
Significant accounting policies are as follows:
- Parliamentary appropriations – The School is primarily financed by the Government of Canada through Parliamentary appropriations. Financial reporting for appropriations provided to the School do not parallel financial reporting according to generally accepted accounting principles since appropriations are primarily based on cash flow requirements. Consequently, items recognized in the statement of operations and in the statement of financial position are not necessarily the same as those provides through appropriations from Parliament. Note 3 provides a high-level reconciliation between the two bases of reporting.
- Net Cash Provided by Government – The School operates within the Consolidated Revenue Fund (CRF) which is administered by the Receiver General for Canada. All cash received by the School is deposited to the CRF and all cash disbursements made by the School are paid from the CRF. The net cash provided by Government is the difference between all cash receipts and all cash disbursements including transactions between departments of the federal government.
- Change in net position in the Consolidated Revenue Fund – It represents the difference between the net cash provided by Government and appropriations used in a year, excluding the amount of non respendable revenue recorded by the department. It results from timing differences between when a transaction affects appropriations and when it is processed through the CRF.
- Revenues – Revenues are accounted for in the period in which the underlying transaction or event occurred that gave rise to the revenues.
-
Expenses – Expenses are recorded on the accrual basis:
- Vacation leave – Vacation leave is expensed as the benefits accrue to the employees under their respective terms of employment. The liability for vacation leave is calculated at the salary levels in effect at the end of the year for all unused vacation balances.
- Services provided without charge – Services provided without charge by other government departments for accommodation and the employer’s contribution to the health and dental insurance plans are recorded as operating expenses, at their estimated cost, in the statement of operations. A corresponding amount is reported directly in the Statement of Equity of Canada.
-
Employee future benefits
- Pension benefits – Eligible employees participate in the Public Service Pension Plan, a multiemployer plan administered by the Government of Canada. The School’s contributions to the Plan are charged to expenses in the year incurred and represent the total School’s obligation to the Plan. Current legislation does not require the School to make contributions for any actuarial deficiencies of the Plan.
- Severance benefits – Employees are entitled to severance benefits under labour contracts or conditions of employment. These benefits are accrued as employees render the services necessary to earn them.
- Accounts receivable – Accounts receivable are stated at amounts expected to be ultimately realized. A provision is made for receivables where recovery is considered uncertain.
- Inventories – Inventories consist of spare parts and supplies held for future program delivery and are not intended for re-sale. They are valued at cost. If they no longer have service potential, they would be valued at the lower of cost or net realizable value.
-
Tangible capital assets – All tangible capital assets (including leasehold improvements) having an initial cost of $5,000 or more are recorded at their acquisition cost less accumulated amortization. Similar items under $ 5,000 are expensed in the statement of operations.
Amortization of tangible capital assets is calculated on a straight-line basis over the estimated useful life of the assets as follows:
Asset class Useful life Machinery and equipment 5 years Other equipment (including furniture) 5 years Informatics hardware 5 years Software (including developed software) 3-6 years Motor vehicle 4 years Leasehold improvements 10 years
- Measurement uncertainty – The preparation of these financial statements in accordance with Canadian generally accepted accounting principles for the public sector requires management to make estimates and assumptions that affect the reported amounts of assets and liabilities at the date of the financial statements and the reported amount of expenses and revenues during the reporting period. At the time of preparation of these statements, management believes the estimates and assumptions to be reasonable. The most significant estimates used are the useful life of tangible capital assets and the liability for employee severance benefits. Actual results could differ from those estimates. Management’s estimates are reviewed periodically and, as adjustments become necessary, they are recorded in the financial statements in the year they become known.
-
Parliamentary Appropriations
The School receives most of its funding through Parliamentary appropriations. Items recognized in the statement of operations and the statement of financial position in one year may be funded through Parliamentary appropriations in prior, current or future years. Accordingly, the School has different net results of operations for the year on a government funding basis than on an accrual accounting basis. The differences are reconciled in the following tables:
(a) Reconciliation of net cost of operations to current year appropriations used
(in thousands of dollars)2007 2006 Net cost of operations 94,136 80,061 Adjustments for items affecting net cost of operations but not affecting appropriations Add (Less): Revenues 33,105 31,745 Services provided without charge (12,648) (12,024) Employee severance benefits (1,931) (1,321) Loss on write-off of tangible capital assets (1,134) - Amortization of tangible capital assets (809) (551) Vacation leave (753) (275) Other 993 (222) 16,823 17,352 Adjustments for items not affecting net cost of operations but affecting appropriations Add (Less): Net acquisition of tangible capital assets 1,943 2,943 Prepaid expenses 150 - Other (15) (4) 2,078 2,939 Current year appropriations used 113,037 100,352
(b) Reconciliation of Parliamentary appropriations provided to current year appropriations used
(in thousands of dollars)2007 2006 Parliamentary Appropriations Voted: Program expenditures (Vote 25) 84,641 48,670 Governor General’s special warrants - 27,699 Transfer from Treasury Board (Vote 15) 457 - Less: Lapsed appropriation – Program expenditures
(vote 25)(7,472) (3,442) Total appropriations used 77,626 72,927 Statutory authorities: Spending of revenues pursuant to subsection 18 (2) of the Canada School of Public Services Act 26,750 19,474 Contributions to employee benefit plans 8,642 7,951 Spending of proceeds from the disposal of surplus Crown assets 19 - Total Statutory Authorities used 35,411 27,425 Current year appropriations used 113,037 100,352
(c) Reconciliation of net cash provided by Government to current year appropriations used
(in thousands of dollars)2007 2006 Net cash provided by Government 81,087 69,686 Revenues 33,105 31,751 Change in net position in the Consolidated Revenue Fund Variation in accounts receivable and accountable advances (4,861) (357) Variation in accounts payable and other liabilities 2,650 (540) Other adjustments 1,056 (188) (1,155) (1,085) Current year appropriations used 113,037 100,352
-
Tangible Capital Assets
(in thousands of dollars)2007 2006 Cost Accumulated amortization Opening balance Acquisi-tions Disposals and write-offs1 Closing balance Opening balance Amorti-zation Disposals and write-offs1 Closing balance Net book value Net book value Machinery and equipment 483 - - 483 407 59 (3) 469 14 76 Other equipment (including furniture) 391 90 60 421 190 41 36 195 226 201 Informatics hardware 3,271 499 1,149 2,621 907 300 95 1,112 1,509 2,364 Software (including developed software) 2,066 1,287 - 3,353 571 344 (51) 966 2,387 1,494 Motor vehicle 30 - - 30 3 4 - 7 23 27 Leasehold improvements 591 67 - 658 47 61 (2) 110 548 545 Total 6,832 1,943 1,209 7,566 2,125 809 75 2,859 4,707 4,707
1 A tangible capital asset review was conducted in 2007 and resulted in assets’ write-offs.
-
Employee Future Benefits
-
Pension benefits
The School and all eligible employees contribute to the Public Service Pension Plan, which is sponsored and administered by the Government of Canada. Pension benefits accrue up to a maximum period of 35 years at a rate of 2 percent per year of pensionable service, times the average of the best five consecutive years of earnings. The benefits are integrated with Canada/Qu�bec Pension Plans benefits and they are indexed to inflation.The 2006-07 expense amounts to $ 1,365,512 ($ 1,272,161 in 2005-06), which represents approximately 2.2 times (2.6 in 2005-06) the contributions by employees.
The School’s responsibility with regard to the Plan is limited to its contributions. Actuarial surpluses or deficiencies are recognized in the financial statements of the Government of Canada, as the Plan’s sponsor.
- Employee severance benefits
The School provides severance benefits to its employees based on eligibility, years of service and final salary. The severance benefits are not pre-funded. Benefits will be paid from future appropriations. Information about the severance benefits, measured as at March 31 is as follows:
(in thousands of dollars) 2007 2006 Accrued benefit obligation, beginning of year 6,710 5,389 Expense for the year 3,315 2,194 Benefits paid during the year (1,384) (873) Accrued benefit obligation, end of year 8,641 6,710
-
-
Contractual Obligations
The nature of the School’s activities can result in some large multi-year contracts and obligations whereby it will be obligated to make future payments when the services will be rendered or goods received. Significant contractual obligations that can be reasonably estimated are summarized as follows:
(in thousands of dollars) 2008 2009 2010 2011 2012 and thereafter Total Goods and services 1,496 1,446 1,516 1,579 5,772 11,809 Operating leases 878 751 156 - - 1,785 Total 2,374 2,197 1,672 1,579 5,772 13,594
-
Related Party Transactions
The School is related as a result of common ownership to all Government of Canada departments, agencies and Crown corporations. The School enters into transactions with these entities in the normal course of business and on normal trade terms. Also, during the year, the School received services which were obtained without charge from other Government departments and agencies as presented in part (a).
-
Services provided without charge
The costs of these services have been recognized as an expense in the School’s Statement of Operations as follow:
(in thousands of dollars)2007 2006 Accommodation received from Public Works and Government Services Canada (PWGSC) 8,499 8,361 Contributions covering employer's share of employees' insurance premiums and expenditures paid by Treasury Board Secretariat (TBS) 4,149 3,663 Total 12,648 12,024
The Government has structured some of its administrative activities for efficiency and cost-effectiveness purposes so that one department performs these on behalf of all without charge. The cost of these services, which include payroll and cheque issuance services provided by Public Works and Government Services Canada are not included as an expense in the School’s Statement of Operations.
-
Payables and receivables outstanding at year-end with related parties
(in thousands of dollars) 2007 2006 Accounts receivable from other government departments and agencies 6,650 1,824 Accounts payable to other government departments and agencies 5,136 5,780
-
Services provided without charge
- Comparative Information
Comparative figures have been reclassified to conform to the current year’s presentation.
Table 9: Response to Parliamentary Committees, and Audits and Evaluations
| Response to Parliamentary Committees |
| None |
| Response to the Auditor General of Canada, including to the Commissioner of the Environment and Sustainable Development (CESD) |
| None |
| External Audits (Note: These refer to other external audits conducted by the Public Service Commission of Canada or the Office of the Commissioner of Official Languages.) |
| None |
| Internal Audits |
|
An internal audit report on procurement, initiated in 2005 (as a pilot project in partnership with the Department of Finance/Treasury Board Secretariat Internal Audit and Evaluation group), was received by the School in May 2007. While this is outside of the reporting period of 2006-07, most issues outlined in the audit report have already been addressed by the School, and an official management response is being developed. A corporate risk profile was prepared during the reporting period, and the School has been working towards building an internal audit capacity to meet the requirements of the new Policy on Internal Audit. An internal audit plan will be developed during the next planning period. |