
Treasury Board of Canada Secretariat
www.tbs-sct.gc.ca
Common menu bar links
Breadcrumb Trail
ARCHIVED - Industry Canada - Report
 This page has been archived.
Archived Content
Information identified as archived on the Web is for reference, research or recordkeeping purposes. It has not been altered or updated after the date of archiving. Web pages that are archived on the Web are not subject to the Government of Canada Web Standards. As per the Communications Policy of the Government of Canada, you can request alternate formats on the "Contact Us" page.
Section III: Supplementary Information
 Financial highlights
The future-oriented financial highlights presented within this Report on Plans and Priorities are intended to serve as a general overview of Industry Canada’s financial position and operations. These future-oriented financial highlights are prepared on an accrual basis to strengthen accountability and improve transparency and financial management.
Future-oriented financial statements can be found on IC’s website.
| (in thousands of dollars) At March 31 |
% Change | Estimated Results 2011–12 |
Planned Results 2012–13 |
|---|---|---|---|
| Assets | |||
| Financial Assets | 2% | 886,152 | 906,401 |
| Non-Financial Assets | -3% | 99,396 | 96,349 |
| TOTAL | 2% | 985,548 | 1,002,750 |
| Liabilities | |||
| Accounts Payable and Accrued Liabilities | -22% | 382,423 | 296,655 |
| Deferred Revenue | -14% | 3,249,112 | 2,780,731 |
| Other Liabilities | 1% | 526,447 | 531,799 |
| Total Liabilities | -13% | 4,157,982 | 3,609,185 |
| Equity | -18% | (3,172,434) | (2,606,435) |
| TOTAL | 2% | 985,548 | 1,002,750 |
| Condensed Future-oriented Statement of Operations (unaudited) For the period ended March 31 |
|||
| Expenses | |||
| Transfer Payments | -27% | 897,629 | 650,818 |
| Operating Expenses | -5% | 814,385 | 773,546 |
| Total Expenses | -17% | 1,712,014 | 1,424,364 |
| Revenues | |||
| Sales of Services | -5% | 1,083,189 | 1,027,474 |
| Other | -3% | 24,396 | 23,609 |
| Total Revenues | -5% | 1,107,585 | 1,051,083 |
| NET COST OF OPERATIONS | -38% | 604,429 | 373,281 |
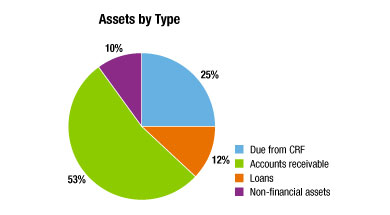
Assets by Type
Total assets are projected to be approximately $1 billion for fiscal year 2012–13. Industry Canada’s loan account is expected to be approximately $530 million and is expected to include new loan amounts paid through the Automotive Innovation Fund (AIF) and the Strategic Aerospace and Defence Initiative (SADI) programs. Due from CRF, the second largest asset represented at $254 million, is a representation of Industry Canada’s access to the Consolidated Revenue Fund to pay down its accounts payables and varies from year to year in relation to that account. Similarly, Accounts receivable, which has been forecasted to be $125 million, is based on historical data and forecasted revenue for the year. The majority of Non-financial assets are tangible capital assets for which no substantial increases or decreases are expected. These projections include a reduction to net capital assets of approximately $2 million transferred to Shared Services Canada.
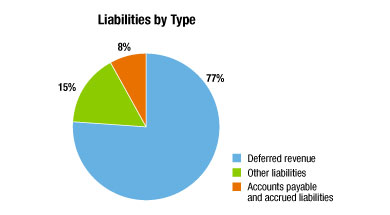
Liabilities by Type
Total liabilities are projected to be $3.6 billion for fiscal year 2012–13. The forecasted deferred revenue is the largest liability on the Future-oriented Statement of Financial Position (77% or $2.8 billion). This amount represents spectrum auction revenues that are deferred and recognized on a straight-line basis, with a significant portion resulting from the Advanced Wireless Services and Other Spectrum auction that was held during fiscal year 2008–09. Accounts payable and accrued liabilities are largely projected based on expense levels. Other liabilities consist of an allowance for loan guarantees (conservatively held at December 31, 2011 levels – $397 million), special purpose accounts and allowances for vacation and severance pay; all projected based on low-level upward trends and historic rates with the exception of severance pay which has been adjusted to reflect recent payouts as a result of Public Service Alliance of Canada (PSAC) collective agreements.
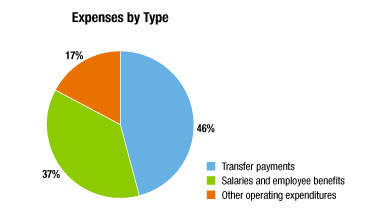
Expenses by Type
Total expenses are projected to be $1.42 billion in fiscal year 2012–13. The majority of these expenses are in the form of transfer payments. The Economic Action Plan transfer payment programs will have completed making payments and the largest of those program expenditures, the Knowledge Infrastructure Program (approximately $250 million in 2011–12), will result in a projected reduction to the levels of transfer payments for 2012–13. In addition, cost containment measures are reflected in the reduction to all operating expense categories, year-over-year, including salaries. The transfer of operations to the newly formed Shared Services Canada has also been reflected with a reduction to operating expenses.
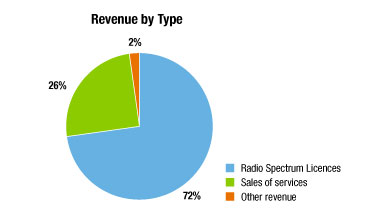
Revenues by Type
Total revenues are projected to be $1.05 billion for fiscal year 2012–13. Radio spectrum licenses make up almost three-quarters of the projected revenue ($750 million), which includes yearly license revenue as well as the recognition of deferred revenue sales of spectrum auction licenses. Other sales of services ($278 million) includes various sources of revenue such as fees under Canada Small Business and Financing Program, Canadian Intellectual Property Office, and Office of the Superintendent of Bankruptcy, all of which have been projected to be consistent with prior year collections. Other revenues consist largely of fines from Competition Law Enforcement and Advocacy which are projected to be less than half that of the 2011–12 levels.
3.2 Supplementary information tables
The following tables are available on the Treasury Board of Canada Secretariat website:

- Details of Transfer Payment Programs
- Greening Government Operations
- Sources of Respendable and Non-Respendable Revenue
- Summary of Capital Spending by Program Activity
- Up-Front Multi-Year Funding
- Upcoming Internal Audits and Evaluations in the Next Three Fiscal Years
- User Fees
Section IV: Other Items of Interest
Expected results of program sub-activities by strategic outcome
The program sub-activities, including their expected results, performance indicators and targets, are presented by the strategic outcome to which they contribute.
- The Canadian marketplace is efficient and competitive;
- Advancements in science and technology, knowledge, and innovation strengthen the Canadian economy;
- Canadian businesses and communities are competitive.