
Treasury Board of Canada Secretariat
www.tbs-sct.gc.ca
Common menu bar links
Breadcrumb Trail
ARCHIVED - Correctional Service Canada - Report
 This page has been archived.
Archived Content
Information identified as archived on the Web is for reference, research or recordkeeping purposes. It has not been altered or updated after the date of archiving. Web pages that are archived on the Web are not subject to the Government of Canada Web Standards. As per the Communications Policy of the Government of Canada, you can request alternate formats on the "Contact Us" page.
Section 3: Supplementary Information
3.1 Financial Highlights
| % Change | 2011 | 2010 | |
|---|---|---|---|
| Total Assets | 6.6 | 1,655.2 | 1,553.2 |
| Total Liabilities | 10.5 | 583.3 | 527.7 |
| Equity of Canada | 4.5 | 1,071.9 | 1,025.5 |
| Total | 6.6 | 1,655.2 | 1,553.2 |
| % Change | 2011 | 2010 | |
|---|---|---|---|
| Total Expenses | 6.2 | 2,515.6 | 2,368.3 |
| Total Revenues | 13.2 | 55.8 | 49.3 |
| Net Cost of Operations | 6.1 | 2,459.8 | 2,319.0 |
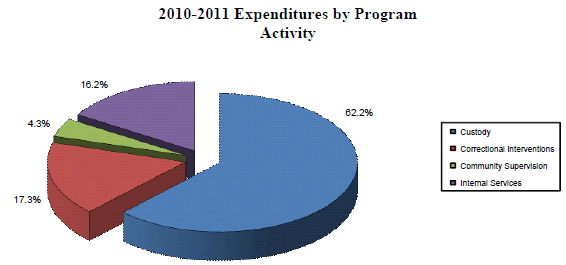
3.2 Financial Highlights Charts/Graphs
3.3 Financial Statements
http://www.csc-scc.gc.ca/text/pblct/finance/financl-2010-11-eng.shtml
3.4 List of Supplementary Information Tables
All electronic supplementary information tables found in the 2010–2011 Departmental Performance Report can be found on the Treasury Board of Canada Secretariat’s website.
- Sources of Respendable and Non-Respendable Revenue
- User Fees Reporting
- Green Procurement
- Response to Parliamentary Committees and External Audits
- Internal Audits and Evaluations
Section 4: Other Items of Interest
4.1 Organizational Contact Information
Lisa Hardey
Associate Assistant Commissioner
Policy Sector
340 Laurier Avenue West
Ottawa, Ontario
K1A 0P9
Telephone: 613 992-8723
Facsimile: 613 995-5064
Email: Lisa.Hardey@csc-scc.gc.ca
4.2 Additional Information
http://www.csc-scc.gc.ca/text/index-eng.shtml
1 http://infonet/Corporate/National/OurOrganization/MissionPriorities/mission1117.htm?lang=en
2 Note that an offender can appear more than once in the conditional release flow-through count. An offender may be released from an institution more than once during a year and thereby will be counted more than once. In addition, if an offender spent a portion of the year incarcerated and another portion supervised, the offender will appear in both the institutional and community counts.
3 Includes all active employees or employees on paid leave and term employees with a term greater than three months.
4 Offenders are released according to various provisions of the Corrections and Conditional Release Act. Some offenders are released by law, whereas others are released as a result of the decision-making authority of the Parole Board Canada.
5, 5b, 5c The explanation of the variance between the Planned Spending and the Total Authorities is mainly due to an increase in the following items: operating and capital budget carry-forwards; Compensation for employee benefits and collective agreements; CORCAN’s revolving funds; Supplementary Estimates funding for the Renewal of the Strengthening Community Safety Initiative.
6 The variance between the Total Authorities and the Actual Spending is mainly explained by: the re-profiling of resources into future years; Treasury Board freezing resources for funding related to the new mandatory minimum penalties for serious drug offences; operating and capital budget carry-forwards; cost containment measures from Federal Budget 2010.
7 The variance is mainly attributed to the methodology used to derive the planned FTEs and resulted in an underestimation given that the estimated average salary used was slightly higher than the actual average salary. It should also be noted that the overall estimated salary did not include the forecasted transfers between operating and salary budgets. Finally, the planned FTE number is not adjusted to reflect the additional funding received through the Supplementary Estimates during the year. CSC is currently refining its methodology to improve the accuracy of the planned numbers where needed.
8 New criminal conviction data is lagged by one year in order to account for court proceedings and delays in sentencing. Refer to Section 2 Community Supervision for detailed information related to these performance indicators.
9 Incidence rate (or cumulative incidence) is the number of events per population in a given time period as a proportion of a specific population at risk. When the denominator is the sum of the person-time of the ‘at risk’ population, it is also known as Incidence Density or Person-Time incidence rate. Using person-time accounts for situations where the amount of observation time differs among people or when the population at risk varies with time. Use of this measure ensures that the incidence rate is constant over different periods of time. The numerator does not change, however the denominator becomes the sum of each individual's time at risk (or the sum of the time that each person remained under observation) and is therefore a more precise estimate of the rate of occurrence for variable period reporting.
10 The explanation for the variances is presented in the footnote section of the Summary of Performance on page 16.
11 Offender Person Years (OPY) as referenced explanation in Section 1. Urinalysis performance indicators are reported in percentages as opposed to prevalence rates.
12 The data for this indicator includes escapes from Medium, Minimum, Multi-level and Section 81 facilities.
13 The data for this indicator includes murder, overdose, suicide and all cases where the cause of death could not be identified as murder, overdose, suicide or natural causes or is still under investigation.
14 The data for this indicator reflects incidents where there is an identified instigator or an identified victim.
15 The data for this indicator reflects incidents where there is an identified instigator or an identified victim.
16 The data for this indicator includes one of: Minor, Non-serious bodily injury, Serious Bodily Injury, Major, or Death.
17 The data for this indicator includes one of: Minor, Non-serious bodily injury, Serious Bodily Injury, Major, or Death.
18 The data for this indicator includes seizures from offenders, visitors, community, staff and contract workers.
19 The data for this indicator is based on the total number of samples requested.
20 The data for this indicator represents the percentage of offender refusals to participate in random-sample urinalysis tests, based on the total number of samples requested.
21 Information related to this indicator is available for this reporting year only. This indicator is not referenced in the 2011-2012 Reports on Plan and Priorities.
22 An offender was considered as having mental health needs if the offender had either an accepted Community Mental Health Initiative referral or had received at least one institutional mental health service as recorded in the Psychology and Mental Health Tracking Database.
23 CSC/Parole Board Canada warehouse database.
24 The explanation for the variances is presented in the footnote section of the Summary of Performance on page 16.
25 The 2010-2011 Report on Plans and Priorities stated a rate for this particular performance indicator. For reporting purposes in the 2010-2011 Departmental Performance Report, CSC is using the number of enrolments to correctional programs. Nationally recognized correctional programs refer to all programs that have been developed and implemented on a national level and any regional/local programs that have been recognized at the national level.
26 The data for this indicator includes the following program assignment statuses: Successful, Attend all sessions, and Successful certificate.
27 Discretionary release performance indicators are reported in percentages as opposed to prevalence rates. The data for this indicator includes discretionary releases (Day and Full Parole) based on the total number of first releases from custody.
28 Re-admission after release performance indicators are reported in percentages as opposed to prevalence rates. The years identified for both two and five years post-warrant expiry throughout this document are the years when the offenders actually reached warrant expiry for their earlier sentences. Review period is 2006-2007 to 2008-2009. The data for this indicator includes offenders re-admitted to federal custody on a new sentence for a violent offence within two years of reaching warrant expiry of the previous sentence.
29 Re-admission after release performance indicators are reported in percentages as opposed to prevalence rates. Review period is 2003-2004 to 2005-2006. The data for this indicator includes offenders re-admitted to federal custody on a new sentence for a violent offence within five years of reaching warrant expiry of the previous sentence.
30 Re-admission after release performance indicators are reported in percentages as opposed to prevalence rates. The years identified for both two and five years post-warrant expiry throughout this document are the years when the offenders actually reached warrant expiry for their earlier sentences. Review period is 2006-2007 to 2008-2009. The data for this indicator includes offenders re-admitted to federal custody on a new sentence for a violent or non violent offence within two years of reaching warrant expiry of the previous sentence.
31 Re-admission after release performance indicators are reported in percentages as opposed to prevalence rates. Review period is 2003-2004 to 2005-2006. The data for this indicator includes offenders re-admitted to federal custody on a new sentence for a violent or non violent offence within five years of reaching warrant expiry of the previous sentence.
32 There were no completions in the Integrated Correctional Program Model during the first three quarters of 2009-2010 as the Program was being implemented.
33 Data Source: CSC/ Parole Board Canada Data Warehouse(April 10, 2011 snapshot) Information Source: Performance Management.
34 Data Source: CSC/ Parole Board Canada Data Warehouse(April 10, 2011 snapshot) Information Source: Performance Management.
35 The explanation for the variances is presented in the footnote section of the Summary of Performance on page 16.
36 The 2010-2011 Report on Plans and Priorities stated a percentage for this particular performance indicator. For reporting purposes in the 2010-2011 Departmental Performance Report, CSC is using the Offender Person Years as referenced in Section 1.
37 The data for this indicator includes Day Parole, Full Parole, Statutory Release and Long Term Supervision Orders.
38 New criminal conviction data is lagged by one year in order to account for court proceedings and delays in sentencing.
39 The data for this indicator includes conditional releases that ended as a result of one or more violent/non-violent convictions.
40 The data for this indicator includes conditional releases that ended as a result of one or more non-violent convictions.
41 The data for this indicator includes conditional releases that ended as a result of one or more violent convictions.
42 The explanation for the variances is presented in the footnote section of the Summary of Performance on page 16.
43 The Planned Spending amount for Internal Services will be updated in the 2012-2013 RPP to better align with CSC’s approved allocation model. As a result, the variance between the Planned Spending and the Actual Spending should significantly decrease in future years.
44 The variance is mainly related to centrally-managed activities such as Information Management & Information Technology. CSC does not currently allocate these costs on a prorated basis by activities.