
Treasury Board of Canada Secretariat
www.tbs-sct.gc.ca
Common menu bar links
Breadcrumb Trail
ARCHIVED - Correctional Service Canada - Report
 This page has been archived.
Archived Content
Information identified as archived on the Web is for reference, research or recordkeeping purposes. It has not been altered or updated after the date of archiving. Web pages that are archived on the Web are not subject to the Government of Canada Web Standards. As per the Communications Policy of the Government of Canada, you can request alternate formats on the "Contact Us" page.
Section III – Supplementary Information
Financial Highlights
| Condensed Statement of Financial Position At End of Year (March 31, 2010) |
2010 | 2009 restated | Dollar Variance | Percentage Variance |
|---|---|---|---|---|
| Assets | 1,553.19 | 1,616.14 | - 62.95 | - 3.90% |
| Total Assets | 1,553.19 | 1,616.14 | - 62.95 | - 3.90% |
| Total | 1,553.19 | 1,616.14 | - 62.95 | - 3.90% |
| Liabilities | 527.70 | 634.47 | - 106.77 | - 16.83% |
| Total Liabilities | 527.70 | 634.47 | - 106.77 | - 16.83% |
| Equity | 1,025.49 | 981.67 | 43.82 | 4.46% |
| Total Equity | 1,025.49 | 981.67 | 43.82 | 4.46% |
| Total | 1,025.49 | 981.67 | 43.82 | 4.46% |
| Condensed Statement of Operations At End of Year (March 31, 2010) |
2010 | 2009 Restated | Dollar Variance | Percentage Variance |
|---|---|---|---|---|
| Expenses | 2,368.29 | 2,412.03 | - 43.74 | - 1.81% |
| Total Expenses | 2,368.29 | 2,412.03 | - 43.74 | - 1.81% |
| Revenues | 49.27 | 57.44 | - 8.17 | - 14.22% |
| Total Revenues | 49.27 | 57.44 | - 8.17 | - 14.22% |
| Net Cost of Operations | 2,319.02 | 2,354.59 | - 35.57 | - 1.51% |
Financial Highlights Charts/Graphs
Expenses - Where funds go
2009-2010 Actual Spending by Program Activity ($2,265.10 million)
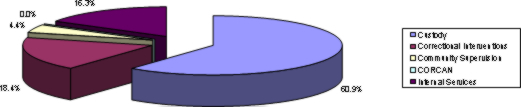
The above figure displays CSC’s expenses by Program Activity for 2009-10. CSC expenses are primarily under Program Activity 1 (Custody) as it relates to the operations of institutions.
Financial Statements
http://www.csc-scc.gc.ca/text/pblct/finance/financl-2009-10-eng.shtml
Supplementary Information Tables
All electronic supplementary information tables found in the 2009–10 Departmental Performance Report can be found on the Treasury Board of Canada Secretariat’s website.
- Sources of Respendable and Non-Respendable Revenue
- User Fees Reporting
- Status Report on Projects Operating with Specific Treasury Board Approval
- Green Procurement
- Response to Parliamentary Committees and External Audits
- Internal Audits and Evaluations
2 http://www.csc-scc.gc.ca/text/organi/trnsform-eng.shtml
3 http://www.publicsafety.gc.ca/scs-scc/report-rapport/table_of_contents-eng.aspx
4 Head, Don. “Transformation Steering Committee: Integration, Progress, and Results”. http://infonet/Corporate/National/NewsWork/CommissionersMessages/2010/ CommitteeComiteTrans.htm?lang=en. February 11, 2010.
5 http://www.laws.justice.gc.ca/eng/C-44.6/index.html
6 This number reflects the December 24, 2008 closure of Isabel McNeil House
7 Offenders are released according to various provisions of the Corrections and Conditional Release Act. Some offenders are released by law, whereas others are released as a result of the decision-making authority of the National Parole Board.
8 Planned spending includes Main Estimates of $2,204.52M plus adjustments in the amount of $211.48M approved by Treasury Board.
9 Difference of 179 full-time equivalents represents only a 1.1% variance which is not significant.
10 Unless otherwise indicated, all numbers, data and results reported in this Departmental Performance Report were produced by CSC’s Policy, Planning and Performance Branch using Offender Management System-based information.
11 This data includes participation in correctional interventions including correctional programs, education, and employment.
12 While there is a range of correctional interventions to help offenders prepare for safe release back to the community, the results reported here refer to correctional programs only as the data for them is the most reliable (i.e. some correctional interventions such as employment have no completion date).
13 CSC is responsible for preparing eligible offenders through appropriate correctional interventions and making recommendations to the National Parole Board, with whom the decision rests.
14 The data do tell that an offender has earned a conditional release, but do not specify if it was precisely at the first eligibility date.
15 The upward trend noted in year five is not unique to Canada. International comparisons show CSC readmission rates to be less than many other countries, but that is likely misleading since it is not a truly valid comparison. Many jurisdictions don't provide correctional programs to offenders, thus would not publish readmission data for these offenders. 'Readmission' is defined differently both within CSC and across organizations. In this case, readmission for a new conviction (overall and violent) after warrant expiry date is what is captured. Not all jurisdictions follow their offenders past warrant expiry date, and thus readmission statistics often include violations of parole. Each jurisdiction publishes readmission information for a time-period of their choosing. Obtaining two and five-year readmission information specifically is a challenge.
16 The years identified for both two and five years post-warrant expiry throughout this document are the years when the offenders actually reached warrant expiry for their earlier sentences. The reconviction occurred in 2009-2010.
17 Statistics to accurately measure this indicator are available for the last three years.
18 Flow-through refers to the number of unique offenders who were at a specific location during a period of time
(e.g. month, year). For any given time period, the flowthrough is made up of two components: (a) stock, the number of offenders who were at the location when the interval started, and (b) intake, the number of new offenders who were introduced to the location during the period (i.e. admissions, transfers, releases). A property of flow-through is that as the length of a time
increases, the more it is comprised of ‘intake’ versus ‘stock’. Conversely, a shorter time period is influenced more by the stock versus intake. For this reason, a flow-though based on one time interval is not comparable (or proportional) to a flow-through based on another time interval. For example, a proportion that uses monthly flow-through as the
denominator is not comparable (or proportional) to a proportion that is based on yearly flow-through.
19 Incidence rate (or cumulative incidence) is the number of events per population in a given time period as a proportion of a specific population at risk. When the denominator is the sum of the person-time of the ‘at risk’ population, it is also known as Incidence Density or Person-Time incidence rate. Using person-time accounts for situations where the amount of observation time differs among people or when the population at risk varies with time. Use of this measure ensures that the incidence rate is constant over different periods of time. The numerator does not change, however the denominator becomes the sum of each individual's time at risk (or the sum of the time that each person remained under observation) and is therefore a more precise estimate of the rate of occurrence for variable period reporting.
20 Incidence Rate = Number of events during a given period / total person-time of observation.
21 The variance between total authorities and actual spending is mainly due to the re-profile of resources into future years, resources frozen by Treasury Board for the Employee Benefit Plan contribution, the funding to implement the measures related to the new Mandatory Minimum penalties for Serious Drug Offences, Operating and Capital budget Carry Forward and CORCAN’s revolving fund.
22 2008-2009 Actual Spending for Internal Services: Based on 2008-2009 Main Estimates, Internal Services costs were reallocated to the Custody, Correctional Intervention and Community Supervision program activities.
23 The Plan includes information on community release details such as proposed destination, type of release (unescorted temporary absence, day/full parole, statutory release, Section 84 parole release to an Aboriginal community); offender’s financial situation; outstanding risk factors; victim considerations, and specific actions that will be taken by the offender to achieve the objectives of the Correctional Plan in the community.
24 Evaluation Report: Correctional Service Canada’s Correctional Programs. Evaluation Branch, Performance Assurance Sector, CSC, January 2009.
25 CSC Evaluation Report: Correctional Service Canada’s Correctional Programs, January 2009. A matched comparison was used for this study.
26 CSC Report: Transforming Community Corrections, March 2010.
27 Source: Statistics Canada. Aboriginal Peoples in Canada in 2006: Inuit, Metis and First Nations, 2006 Census. Ottawa, Statistics Canada, 2008 (Cat. No. 97-558-XIE).
28 Pathways units provide a traditional environment in CSC institutions for Aboriginal offenders dedicated to following a traditional healing path within their correctional plan. Offenders residing in Pathways units had a significantly lower rate of reoffending after release (17 percent compared to 35 percent for Aboriginal offenders who have not resided on those units). These units are also proving to be safer environments for CSC staff and for Aboriginal offenders, with lower rates of violent incidents and detected drug use.
29 A mental health services tracking database is being implemented to measure both the demand for mental health services and the types of services. In 2009-2010 the database was gradually implemented at pilot sites, with data from all 57 institutions to be available in 2010-2011. The figure presented above includes only mental health services that are treatment focused (e.g. assessment, counselling, etc.), and excludes the provision of mental health or psychological services for operational purposes (e.g. risk assessments, assessments for family visits, mental health reviews for segregation, etc.).
30 The variance between total authorities and actual spending is due to several factors such as the re-profile of resources into future years, resources frozen by Treasury Board and the Operating and Capital budget Carry Forward.
31 With the exception of mental health, measures are reported in each top row as rate per 100 offender person years, as explained in Section I of this Departmental Performance Report, and in each bottom row as “flow-through” which is how CSC has reported in recent years.32 The change “over five years” commitment related to the performance indicators above begins in fiscal year 2009-2010. The baseline year is therefore identified as 2008-2009.
33 The percentages reported give the first release type for offenders with a mental health diagnosis that was reported during intake assessment. While there was a slight decline in day and full parole release for these offenders between 2008-2009 and 2009-2010, the overall trend remains positive since there was an increase of 6% in day and full parole releases for offenders with mental health disorders between 2007-2008 and 2008-2009. The decline in 2009-2010 must be seen in this context, and identified as anticipated year over year variability. Furthermore, while offenders with reported mental health disorders have trended upwards in day and full parole releases, those without reported mental health disorders have trended downwards for day and full parole (4.4 percent from 2007-2008 to 2009-2010). Thus, the comparative groups are slowly trending towards each others' performance.34 The difference represents only 1.8% of planned full-time equivalents which is not significant.
35 Evaluation Report: Correctional Service Canada’s Correctional Programs. Evaluation Branch, Performance Assurance Sector, CSC, January 2009.
36 Measures are reported in each top row as rate per 100 offender person years, as explained in Section I of this Departmental Performance Report, and in each bottom row as “flow-through” which is how CSC has reported in recent years.
37 This data includes participation in correctional interventions including correctional programs, education, and employment.
38 While there is a range of correctional interventions to help offenders prepare for safe release back to the community, the results reported here refer to correctional programs only as the data for them are the most reliable (i.e. some correctional interventions such as employment have no completion date).
39 The data do tell that an offender has earned a conditional release, but do not specify if it was precisely at the first eligibility date.40 Readmission percentages noted in this table include offenders who participated in all correctional interventions. This does not equate to the proportion, referenced above and in Section 1 who completed formal correctional programs. Those programs are a subset of the full range of correctional interventions.
41 Bill C-39 is proposed legislation that would amend the Corrections and Conditional Release Act, including abolishing the current system of Accelerated Parole Review.42 Rivera, Margo, PhD., CPsych. “Segregation is Our Prison Within the Prison: Operational Examination of Long-Term Segregation and Segregation Placements of Inmates with Mental Health Concerns in the Correctional Service of Canada”. May 2010.
Thériault, Yvette. “Operational Examination of Long-Term Segregation and Segregation Placements of Inmates with Mental Health Concerns in the Correctional Service of Canada”. May 2010.
43 The difference represents only 119 full-time equivalents which is not significant.
44 Measures are reported in each top row as rate per 100 offender person years, as explained in Section I of this Departmental Performance Report, and in each bottom row as “flow-through” which is how CSC has reported in recent years.
45 Community capacity-building activities include promoting the development of new and additional services; working to improve social programs and health services by encouraging communities and organizations to be responsive to identified needs; coordinating and working with various organizations to combat relevant social issues through community awareness; and attending, organizing and contributing at community meetings to ensure adequate consideration of the needs of offenders with mental disorders.
46 CSC Evaluation Branch, 2008.
47 As a revolving fund, CORCAN’s expenses are offset by their revenues; as a consequence, there is no impact on planned financial resources.
48 The negative expense represents the surplus of cash received over disbursements.
49 Gillis, C.A., & Nafekh, M. (2005). The impact of community based employment on offender reintegration. Forum of Corrections Research, vol 17 (1), 10-14.
50 CSC Evaluation Branch (June 2008). Correctional Service of Canada’s Employment Strategy: Institutional Component File # 394-2-74. CSC, Ottawa, ON.51 Gillis, C.A., & Nafekh, M. (2005). The impact of community based employment on offender reintegration. Forum of Corrections Research, vol 17 (1), 10-14;
CSC Evaluation Branch (June 2008). Correctional Service of Canada’s Employment Strategy: Institutional Component File # 394-2-74. CSC, Ottawa, ON.