ARCHIVED - Canadian Food Inspection Agency - Report
 This page has been archived.
Archived Content
Information identified as archived on the Web is for reference, research or recordkeeping purposes. It has not been altered or updated after the date of archiving. Web pages that are archived on the Web are not subject to the Government of Canada Web Standards. As per the Communications Policy of the Government of Canada, you can request alternate formats on the "Contact Us" page.
2009-10
Departmental Performance Report
Canadian Food Inspection Agency
The original version was signed by
The Honourable Gerry Ritz, PC, MP
Minister of Agriculture and Agri-Food and Minister for the Canadian Wheat Board
Table of Contents
Management Representation Statement for Performance Information
- 1.1 Raison d’être
- 1.2 Responsibilities
- 1.3 Strategic Outcomes and Program Activity Architecture
- 1.4 Performance Summary
- 1.5 Risk Analysis
- 1.6 Office of the Auditor General Reports
Section II – Analysis of Program Activities by Strategic Outcome
- 2.1 How the Agency Plans and Reports
-
2.2 Performance by Strategic Outcomes
- 2.2.1 Strategic Outcome 1: Public health risks associated with the food supply and transmission of animal diseases to humans are minimized and managed
- 2.2.2 Strategic Outcome 2: A safe and sustainable plant and animal resource base
- 2.2.3 Strategic Outcome 3: Contributes to consumer protection and market access based on the application of science and standards
- 2.2.4 Internal Services
Section III – Supplementary Information
Minister's Message![The Honourable [Type Minister’s name]](images/minister-ministre.jpg)
Through the work of the Canadian Food Inspection Agency (CFIA), the Government of Canada is committed to protecting citizens from food safety risks, preventing and managing animal diseases, and protecting our plant resources from pests, diseases and invasive species. The successful delivery of this mandate also provides the critical foundation for domestic and international market confidence and the resulting economic opportunities for the agriculture and agri-food sectors.
The 2009–10 fiscal year was challenging for the CFIA and for me as Minister responsible. After the listeriosis outbreak of the previous year, the Government of Canada initiated an independent investigation into the response undertaken by the CFIA and its federal partners. The 57 recommendations of Sheila Weatherill were complemented by another study undertaken by the House of Commons Subcommittee on Food Safety. Upon receiving the recommendations of all the investigations, the Government of Canada immediately committed $75 million to ensure that the recommendations would be fulfilled. The CFIA has undertaken extensive reviews of its operating procedures and has begun hiring the 70 new food safety inspection staff to which the Government had committed. This builds upon the 538 inspection staff hired by he CFIA between March 31, 2006, and March 31, 2010.
To further the goal of continuous improvement in food safety and to implement the Weatherill recommendations, the CFIA continues to collaborate with federal, provincial, territorial, and municipal partners and organizations to minimize and manage risks to food. In addition to hiring new inspectors, the CFIA has purchased state-of-the-art technology to improve its ability to identify pathogens.
The Agency also implemented key communication enhancements to inform the public of food recalls, including the launching of foodsafety.gc.ca. Additional advances were made under the Food and Consumer Safety Action Plan and by engaging consumers in a dialogue around food safety.
The CFIA has responded to consumer and industry demands for greater assurance in the organic sector by developing our new Organic Products Regulations. These regulations provide for a consistent set of standards for all products marketed as organic.
Market access is an ongoing issue for the Canadian cattle and beef industry as a result of bovine spongiform encephalopathy (BSE). The CFIA continued to monitor the level of BSE and the effectiveness of measures taken to control the disease in the domestic cattle population. Our BSE control measures are directly responsible for international markets opening up to Canadian beef in countries like China and Colombia.
H1N1 was another high-priority animal and human health issue that the CFIA faced this past year. The Agency's response was to collaborate with the Public Health Agency of Canada to raise awareness in the animal health community and to develop rapid test methods to confirm the virus in animals. These tests were then shared with other animal disease laboratories in Canada and around the world.
In addition to an excellent track record in animal disease response, the CFIA pursued a proactive agenda related to animal health. To this end, the Agency launched an animal health awareness campaign around core biosecurity principles on farms across Canada. In addition, the Agency released the national Avian On-Farm Biosecurity Standard, designed to minimize the introduction and spread of diseases and pests. This standard was developed through extensive consultation with agri-commodity stakeholders, academia, and provincial and federal partners.
The CFIA applies sound science when developing its policies and programs. It does this through consultations with, and participation in, highly respected international organizations such as the World Organisation for Animal Health (OIE), the Codex Alimentarius Commission and the International Plant Protection Convention. The collective intelligence and research of the world's foremost scientists are considered in CFIA policy and program delivery. This adherence to sound science informs Canadian consumers and our trading partners that they can be confident about the quality and safety of our food, livestock animals and plant products.
The Government of Canada will continue to work with its existing partners, other governments and stakeholders to strengthen our ability to prevent, prepare for and respond to food safety, animal health or plant health emergencies.
The Honourable Gerry Ritz, PC, MP
Minister of Agriculture and Agri-Food and Minister for the Canadian Wheat Board
Management Representation Statement for Performance Information

The Canadian Food Inspection Agency's (CFIA) 2009–2010 Performance Report for the year ending March 31, 2010, was prepared under my direction and the CFIA's Senior Management Committee, and approved by the Minister of Agriculture and Agri-Food. In accordance with the Canadian Food Inspection Agency Act, the report also includes an assessment of the fairness and reliability of the performance information conducted by the Auditor General of Canada.
I submit for tabling in Parliament the 2009–2010 Performance Report for the CFIA.
This document has been prepared based on the following reporting principles contained in the Guide for the Preparation of Part III of the Estimates: 2010–2011 Report on Plans and Priorities and 2009–2010 Departmental Performance Report:
- It adheres to the specific reporting requirements outlined in Treasury Board Secretariat guidance;
- It is based on the CFIA's Strategic Outcomes and Program Activity Architecture that were approved by Treasury Board;
- It presents consistent, comprehensive, balanced and reliable information;
- It provides a basis of accountability for the results achieved with the resources and authorities entrusted to it; and
- It reports finances based on approved numbers from the Estimates and the Public Accounts of Canada.
Carole Swan
President, Canadian Food Inspection Agency
Section I – Agency Overview
1.1 Raison d’�tre
The Canadian Food Inspection Agency (CFIA) is the largest science-based regulatory agency in Canada. It has close to 7,3001 dedicated employees working across Canada in the National Capital Region and in four operational Areas (Atlantic, Quebec, Ontario and West). The CFIA is dedicated to safeguarding food, animals and plants, and contributing to a safe and accessible food supply and plant and animal resource base—thereby enhancing the health and well-being of Canada's people, environment and economy.
The CFIA's activities are aimed at protecting Canadian and international food consumers, Canadian agricultural production (including forestry) and our environment. These activities benefit Canadian farmers, fishers, foresters, processors and distributors (including importers and exporters), as well as consumers.
1.2 Responsibilities
The CFIA is responsible for administering and enforcing 13 federal statutes and 38 regulations that govern the safety and labelling of food sold in Canada and that support a sustainable plant and animal resource base.
The CFIA shares many areas of responsibility with other federal departments and agencies; provincial, territorial and municipal authorities; and other stakeholders. Within a complex operating environment, the CFIA works with its partners to implement food safety measures; manage food, animal and plant risks and emergencies; and promote the development of food safety and disease control systems to maintain the safety of Canada's high-quality agriculture, aquaculture and fisheries, and agri-food products. The Agency's activities include verifying domestic industry compliance and compliance of imported products; registering and inspecting establishments; testing food, animals, plants and their related products; and approving the use of many agricultural inputs.
The CFIA’s Legislative Authority
- Agriculture and Agri-Food Administrative Monetary Penalties Act
- Canada Agricultural Products Act
- Canadian Food Inspection Agency Act
- Consumer Packaging and Labelling Act (as it relates to food)
- Feeds Act
- Fertilizers Act
- Fish Inspection Act
- Food and Drugs Act (as it relates to food)
- Health of Animals Act
- Meat Inspection Act
- Plant Breeders’ Rights Act
- Plant Protection Act
- Seeds Act
At the CFIA, informed decision making is based on high-quality, timely and relevant science. Science informs policy development, as well as program design and delivery, through the practices of foresight, advice, risk assessment, influencing international standards, research and development, and testing.
The CFIA’s Key Federal Partners
- Health Canada
- Public Health Agency of Canada
- Agriculture and Agri-Food Canada
- Canadian Grain Commission
- Public Safety Canada
- Canada Border Services Agency
- Fisheries and Oceans Canada
- Natural Resources Canada, including Canadian Forest Service
- Foreign Affairs and International Trade Canada
- Environment Canada, including Canadian Wildlife Service
1.3 Strategic Outcomes and Program Activity Architecture
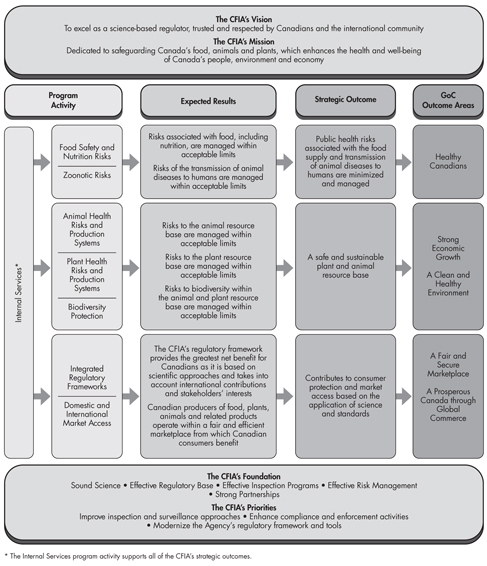
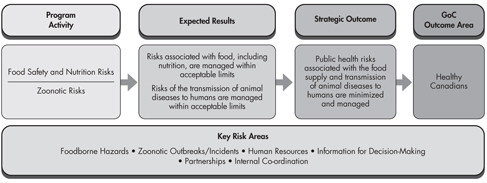
The CFIA's Program Activity Architecture (PAA) is a component of its Management, Resources and Results Structure (MRRS), which forms part of the Whole of Government Framework for a common, government-wide approach to the collection, management and reporting of financial and non-financial information. To effectively deliver on its responsibilities, the CFIA aims to achieve three strategic outcomes (SO).2 The current PAA, shown in Figure 1, illustrates the alignment of the CFIA's strategic outcomes to the Government of Canada (GoC) outcome areas and reflects how the Agency plans to allocate and manage its resources in order to achieve the corresponding expected results.
Figure 1: The CFIA’s Program Activity Architecture
1.4 Performance Summary
1.4.1 Expenditure Profile
1.4.1.1 Comparison of Planned versus Actual Spending
| Planned Spending | Total Authorities | Actual Spending |
|---|---|---|
| 597.0 | 750.6 | 718.1 |
| Planned | Actual | Difference |
|---|---|---|
| 6,357 | 6,525 | (168) |
The variance between Planned Spending and Total Authorities is mainly attributable to the following: funding received for the continuance of the Bovine Spongiform Encephalopathy (BSE) initiative and the Growing Forward Program Suite; funding received for new program initiatives such as Canada’s Economic Action Plan (CEAP), the Government Response to Listeriosis, H1N1 Preparedness and Response, and the Pork Industry Recovery and Expansion Strategy; funding received to assist in the payment of litigation cost; funding received for collective bargaining and for the 2008–09 carry forward; as well as increases in statutory compensation and statutory employee benefit plans.
The variance between Total Authorities and Actual Spending is less than 5% and is mainly due to the establishment of a frozen allotment to cover costs associated with moving funding from non-pay to pay, delays in capital projects and small lapses in some of the Agency's initiatives.
The Variance between Planned and Actual Human Resources is attributable to additional salary resources received for the Government Response to Listeriosis, the H1N1 Preparedness and Response, and the Pork Industry Recovery and Expansion Strategy, as well as an increase in hiring related to existing CFIA initiatives, including the Food and Consumer Safety Action Plan (FCSAP).
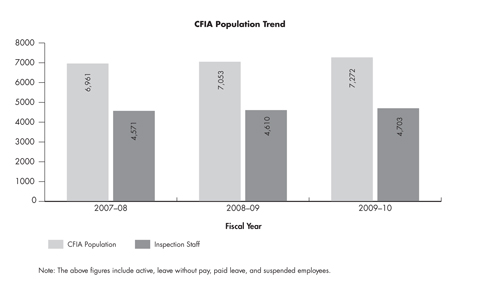
The 2009–10 Report on Plans and Priorities (RPP) reflected a notional budget of some 6,357 FTEs3 for 2009–10. In the time since the 2009–10 RPP was tabled, additional FTEs were received for the continuance of BSE, the Government's Response to Listeriosis, the H1N1 Preparedness and Response, and the Pork Industry Recovery and Expansion Strategy which explains the increase from planned to actual FTEs. Only employees who are receiving a salary are included in the FTE figure. The CFIA Population Trend chart shows a total of 7,272 actual employees. This figure reflects all employees currently on strength with the Agency4.
1.4.1.2 Voted and Statutory Items
| Vote # or Statutory Item (S) | Truncated Vote or Statutory Wording | 2007-08 ($ millions) |
2008-09 ($ millions) |
2009-10 ($ millions) |
|
|---|---|---|---|---|---|
Actual Spending |
Actual Spending |
Main Estimates |
Actual Spending |
||
| 30 | Operating Expenditures and Contributions | 573.6 | 524.6 | 480.6 | 591.5 |
| 35 | Capital Expenditures | 22.3 | 26.1 | 22.6 | 35.0 |
| (S) | Compensation Payments under the Health of Animals Act and the Plant Protection Act | 10.6 | 20.5 | 1.5 | 7.3 |
| (S) | Contributions to employee benefit plans | 74.1 | 73.5 | 67.3 | 84.2 |
| (S) | Spending of proceeds from the disposal of surplus Crown assets | 0.7 | 0.8 | 0.0 | 0.1 |
| Total | 681.3 | 645.5 | 572.0 | 718.1 | |
The increase in Actual Spending from 2008–09 to 2009–10 within the Operating Expenditures and Contributions Vote is mainly due to new funding received for H1N1 Preparedness and Response; the Pork Industry Recovery and Expansion Strategy; the Government Response to Listeriosis; the payment of litigation costs; costs related to the implementation of new collective bargaining agreements for a large percentage of the Agency's employees; and an increase in resources received from Agriculture and Agri-Food Canada (AAFC) under the Growing Forward Program Suite.
The increase in Actual Spending from 2008–09 to 2009–10 within the Capital Expenditures Vote is mainly due to new funding received under the CEAP for Modernizing Laboratories, as well as new funding received for the Government Response to Listeriosis and H1N1 Preparedness and Response.
The decrease in Actual Spending from 2008–09 to 2009–10 in Statutory Compensation payments largely pertains to decreased expenditures related to Sudden Oak Death,
Chronic Wasting Disease and Avian Influenza.
1.4.1.3 Spending and CFIA Population Trend
The CFIA's spending has increased overall from 2007–08 to 2009–10 mainly due to incremental resources received for the FCSAP, the CEAP, the Government Response to Listeriosis, H1N1 Preparedness and Response, the Pork Industry Recovery and Expansion Strategy, and collective bargaining. The 2008–09 spending appears to have decreased over the previous fiscal year. However, this is an anomaly due to the settlement of the reclassification of meat inspector positions in 2007–08.

Canada's Economic Action Plan5
The federal government committed approximately $24 million over two years (2009–10 to 2010–11) to help modernize the CFIA's laboratories. The CFIA has planned to deliver 13 initiatives comprising 30 projects in six provinces and seven laboratories. In Year 1 (2009–2010), the federal government provided the CFIA with $9.8 million under the CEAP. This funding was used to help modernize the CFIA's laboratories so that scientists and researchers can continue to work in safe, modern facilities and continue contributing to the health and safety of Canadians.
1.4.2 Performance Summary Tables6
Please note that, starting with the 2009–10 Estimates cycle, the resources for the Internal Services Program Activity are displayed separately from other program activities. They are no longer distributed among the remaining program activities, as was the case in previous Main Estimates. This has affected the comparability of spending and FTE information by Program Activity between fiscal years.
The performance summary in Table 1-1 represents the performance summary at the Program Activity level.
Table 1–1: Linking Performance to Strategic Outcome 1
| Program Activity | Alignment to Government of Canada Outcome Areas7 |
|---|---|
| Food Safety and Nutrition Risks | Healthy Canadians |
| Zoonotic Risks | Healthy Canadians |
| Performance 2009–10 The CFIA, in collaboration with federal, provincial, territorial, and municipal partners and organizations, worked to minimize and manage risks to food and food production systems from unintentional and deliberate threats by undertaking the following work: continuing to address the recommendations of reviews of the 2008 listeriosis outbreak; advancing its efforts under the FCSAP; and taking steps to engage consumers in a dialogue to manage food safety and nutrition risks. The Agency continued to minimize and manage risks associated with the transmission of animal diseases to humans by enhancing its surveillance systems and by forming partnerships and plans to respond to zoonotic diseases8. |
|
| Program Activity | 2008–09 Actual Spending ($ millions) | 2009–10 ($ millions) | |||
|---|---|---|---|---|---|
| Main Estimates |
Planned Spending |
Total Authorities |
Actual Spending |
||
| Food Safety and Nutrition Risks | 228.2 | 220.5 | 245.5 | 276.5 | 270.5 |
| Zoonotic Risks | 66.1 | 75.3 | 75.3 | 91.2 | 83.3 |
| Total | 294.3 | 295.8 | 320.8 | 367.7 | 353.8 |
Table 1–2: Linking Performance to Strategic Outcome 2
| Program Activity | Alignment to Government of Canada Outcome Areas |
|---|---|
| Animal Health Risks and Production Systems | Strong Economic Growth |
| Plant Health Risks and Production Systems | A Clean and Healthy Environment |
| Biodiversity Protection | A Clean and Healthy Environment |
| Performance 2009–10 The CFIA, in collaboration with its partners, continued to help protect Canada's animals from regulated diseases and to promote and regulate animal welfare. This was achieved by working with stakeholders to develop a more flexible structure for responding to animal health emergencies and by modernizing the regulatory framework relating to animal programs. The CFIA minimized and managed risks to Canada's plant resource base by focusing on advancing the development of a holistic approach to managing plant pest–related risks and by facilitating trade and commerce and economic growth. The CFIA continued to help prevent the spread of invasive species and other pests to Canada's environment through targeted programs and services. |
|
| Program Activity | 2008–09 Actual Spending ($ millions) | 2009–10 ($ millions) | |||
|---|---|---|---|---|---|
| Main Estimates |
Planned Spending |
Total Authorities |
Actual Spending |
||
| Animal Health Risks and Production Systems | 86.8 | 56.7 | 56.7 | 84.1 | 80.1 |
| Plant Health Risks and Production Systems | 75.9 | 61.3 | 61.3 | 94.7 | 89.7 |
| Biodiversity Protection | 12.9 | 11.1 | 11.1 | 11.3 | 9.5 |
| Total | 175.6 | 129.1 | 129.1 | 190.1 | 179.3 |
Table 1–3: Linking Performance to Strategic Outcome 3
| Program Activity | Alignment to Government of Canada Outcome Areas |
|---|---|
| Integrated Regulatory Frameworks | A Fair and Secure Marketplace |
| Domestic and International Market Access | A Prosperous Canada Through Global Commerce |
| Performance 2009-10 The CFIA continued to enhance consumer protection by strengthening the regulatory base and improving the regulatory amendment process. The CFIA worked with stakeholders to address, and provide guidance on, priority regulatory areas of interest to Canadians such as the development of the Organic Products Regulations and changes to the Seeds Regulations. The CFIA improved domestic and international market access by implementing and enforcing a more effective and efficient regulatory system and through its contribution to the drafting and development of international standards. |
|
| Program Activity | 2008–09 Actual Spending ($ millions) | 2009–10 ($ millions) | |||
|---|---|---|---|---|---|
| Main Estimates |
Planned Spending |
Total Authorities |
Actual Spending |
||
| Integrated Regulatory Frameworks | 14.9 | 14.2 | 14.2 | 14.2 | 10.7 |
| Domestic and International Market Access | 30.4 | 24.6 | 24.6 | 36.1 | 32.4 |
| Total | 45.3 | 38.8 | 38.8 | 50.3 | 43.1 |
Internal Services
Internal services are groups of related activities and resources that are administered to support the needs of programs and other corporate obligations of an organization. These groups include the following: Management and Oversight Services, Communications Services, Legal Services, Human Resources Management Services, Financial Management Services, Information Management Services, Information Technology Services, Real Property Services, Security Management Services, Environmental Management Services, Materiel Management Services, Procurement Services and Travel and Other Administrative Services.
| Program Activity | 2008–09 Actual Spending ($ millions) | 2009–10 ($ millions) | |||
|---|---|---|---|---|---|
| Main Estimates |
Planned Spending |
Total Authorities |
Actual Spending |
||
| Internal Services | 130.3 | 108.3 | 108.3 | 142.5 | 141.9 |
| Total | 130.3 | 108.3 | 108.3 | 142.5 | 141.9 |
1.4.3 Contribution of Priorities to Strategic Outcomes
For 2009–10, the CFIA established three priorities to guide the management of resources toward achieving its strategic outcomes (SO). The CFIA's performance with respect to achieving these priorities is summarized below while Section II elaborates on performance by SO.
Table 1–4: Summary of Performance by Operational Priority
| Operational Priorities | Type | Status | Linkages to SO(s) |
|---|---|---|---|
| Improve inspection and surveillance approaches | Ongoing |
Mostly Met* In support of this priority, the CFIA undertook the following work:
|
SO 1: Public health risks associated with the food supply and transmission of animal diseases to humans is minimized and managed SO 3: Contributes to consumer protection and market access based on the application of science and standards |
| Enhance compliance and enforcement activities | Ongoing |
Somewhat Met* In support of this priority, the CFIA undertook the following work:
|
SO 2: A safe and sustainable plant and animal resource base |
| Modernize the Agency's regulatory framework and tools | Previously committed |
Mostly Met* In support of this priority, the CFIA undertook the following work:
|
All Strategic Outcomes |
* Exceeded: More than 100 per cent of the expected level of performance, Met All: 100 per cent of the expected level of performance, Mostly Met: 80 to 99 per cent of the expected level of performance, Somewhat Met: 60 to 79 per cent of the expected level of performance, Not Met: Less than 60 per cent of the expected level of performance.
1.5 Risk Analysis
The effective management of risks associated with food, animals and plants is fundamental to the achievement of CFIA's mandate. To ensure the effective and consistent management of risks, CFIA's approach to risk management is articulated in its Integrated Risk Management (IRM) Policy. The policy highlights the importance of IRM as an integral part of all CFIA mandate delivery, governance, and stewardship responsibilities. IRM provides value by informing policy development, priority setting, planning, resourcing, delivery, review and reporting activities at all levels within the CFIA.
A key output of the CFIA's risk management process is the Agency-wide Corporate Risk Profile (CRP). The CRP describes the CFIA's nine strategic risks, as identified against the Agency's strategic outcomes. The risks and mitigation strategies identified in the CRP help to inform the Agency's Report on Plans and Priorities, the CFIA's key planning document. Progress against the mitigation strategies is subsequently reported against in the Agency's Performance Report (PR).
In 2009–10 continued efforts were aimed at mitigating risks associated with Foodborne Hazards, which include the failure to detect, track or mitigate foodborne pathogens, toxins, chemical contaminants and other health hazards. The CFIA focused its mitigation efforts on a number of key initiatives such as making additional advances under the Food and Consumer Safety Action Plan and addressing the recommendations put forward in the Report of the Independent Investigator into the 2008 Listeriosis outbreak. The CFIA was also able to capitalize on a number of opportunities related to Foodborne Hazards. One key opportunity is that the CFIA implemented the Compliance Verification System (CVS) in the Feed Program and continued improvement of CVS for the Meat Program. The CVS will help improve regulated parties' compliance with regulations and enhance food safety oversight. It is expected that industry compliance with regulations will continue to increase each year as operators of federally registered meat and poultry establishments become more familiar with the CVS. More information on key initiatives aimed at mitigating the risks associated with Foodborne Hazards can be found under Strategic Outcome (SO) 1 performance reporting found in Section 2.2.1.
This year, the CFIA continued work with its key partners towards mitigating risks associated to Zoonotic Incidents, which include failure to detect or prevent the entry or spread of an animal disease transmissible to humans (zoonotic). The emergence of the H1N1 virus this past year was a major focus of the CFIA's activities under this risk area. The CFIA worked with a number of its governmental partners, including the Public Health Agency of Canada (PHAC), to effectively mitigate the risk posed to humans and animals by H1N1. In addition, the Agency pursued a number of opportunities including collaborating with the Canadian Animal Health Surveillance Network (CAHSN) National BSE Surveillance Program to achieve a web-based, central repository. This repository allows for merged provincial BSE test data which is accessible for analysis and reporting to the World Organization for Animal Health. Further details as well as other examples of key initiatives aimed at mitigating the risks associated to Zoonotic Incidents can be found under SO 1 performance reporting found in Section 2.2.1.
A number of key initiatives were undertaken this year to mitigate the risks associated with Animal and Plant Pests and Diseases. These risks include the failure to appropriately prevent, detect, contain and mitigate a pest or disease that threatens the plant and/or animal resource base. Mitigation efforts against animal disease focused on a number of areas including working with partners to advance key initiatives such as further implementation of the National Aquatic Animal Health Program and further development of a framework to guide animal health and welfare-related activities in Canada. The CFIA also continued work with its federal/provincial/territorial partners to deliver on a National Agriculture and Food Traceability System for livestock and poultry. This system is a key opportunity under the Animal Health risk area and will enhance the capacity to track priority livestock species (cattle, hogs, bison, sheep and poultry) and support animal health and disease control, emergency management and market access.
This year also saw continued work directed at managing plant pest-related risks. This work focused not only on mitigating the risks identified in the CRP but also responding to those identified in the Office of the Auditor General's 2008 audit, Managing Risks to Canada's Plant Resources. In addition, the CFIA completed an internal evaluation of its Invasive Alien Species Program. CFIA's actions in this area have focused on strengthened governance, Information Management and Information Technology action items, as well as performance management. The CFIA also worked on implementing a number of preventative measures. The Agency recognizes that prevention depends on effective environmental scanning, identification of high-risk pests and pathways and collaboration between internal and external stakeholders to develop and implement effective risk-mitigation measures for plant commodities. To that end, new phytosanitary measures were put into place to minimize the risk of introduction of two new plant pests: tomato leafminer moth (tuta absoluta) and the false codling moth (Thaumatotibia leucotreta). Further details as well as other examples of key initiatives aimed at mitigating the risks associated with Animal and Plant Pests and Diseases can be found under SO 2 performance reporting found in Section 2.2.2.
Progress was also made in 2009–10 towards mitigating the risks related to Human Resources management. These risks include being unable to attract, develop and retain a human resource base with the necessary competencies to fully and effectively deliver on the CFIA's mandate. This year the CFIA continued to progress on all public service renewal commitments that respond to challenges related to planning, engagement, recruitment, building capacity, and providing a supportive human resource management architecture. More information on key initiatives aimed at mitigating the risks associated to Human Resources management can be found under the Internal Services program activity performance reporting found in Section 2.2.4.
Foresight exercises were conducted and completed as part of mitigation strategies related to the risks associated with Science and Technology Capacity. These risks include the CFIA's scientific and technology capacity not being able to remain abreast of new scientific or regulatory developments. The exercises were part of the Foresight for Canadian Animal Health (Fore-CAN) project, led by the CFIA with partners in PHAC, AAFC, provinces and territories, academia and industry. Foresight is a key element for a better understanding of the challenges and opportunities that science partners will have to face in the future. Further details as well as other examples of key initiatives aimed at mitigating the risks associated with Science and Technology Capacity can be found under SO 2 performance reporting found in Section 2.2.2.
A number of mitigation strategies for addressing the risks associated with Information for Decision-Making, including that performance, analytical and scientific information will be insufficiently compiled, focused and defined to support CFIA decision-making and reporting, were pursued. These strategies include the development of the Performance Management and Reporting Solution and related key IM/IT initiatives such as the implementation of a data centre that houses mission-critical computer systems and associated components. Once fully implemented, these strategies will help the CFIA to strengthen its internal decision-making and reporting processes. Further details as well as other examples of key initiatives aimed at mitigating the risks associated to Information for Decision-Making can be found under the Internal Services program activity performance reporting found in Section 2.2.4.
The risks associated to Partnership include that the roles and responsibilities of key partners will be insufficiently coordinated to support program delivery. The primary mitigation strategy that the CFIA has identified for these risks is the enhancement of its relationships with partners and stakeholders with regards to information sharing, and CFIA participation in international fora. To that end, the CFIA has continued its participation in a number of international regulatory fora including the World Organization for Animal Health and the Codex Alimentarius Commission. The CFIA has also enhanced its relationship with a number of its key partners including working with the U.S. Food and Drug Administration, to discuss options for information-sharing regarding mutual food safety challenges and to identify areas for collaboration. Further details as well as other examples of key initiatives aimed at mitigating the risks associated to Partnership can be found throughout Section 2, as these risks relate to all Agency SOs.
Key initiatives continue to be undertaken for addressing the risks associated with having insufficient Internal Coordination to support program delivery and design. A major focus this year for the CFIA was on beginning the process for establishing an Agency Enterprise Project Management Office (EPMO). Once firmly established, the EPMO will help to ensure consistency in Agency project management through the design and implementation of project management processes, standards and templates. Further details as well as other examples of key initiatives aimed at mitigating the risks associated to Internal Coordination can be found throughout Section 2, as these risks are associated with all Agency SOs.
The CFIA also continued work towards strengthening its regulatory base as a means to protect consumers and facilitate trade. These efforts were aimed at mitigating the risks associated to the Program Framework. Work continued on the advancement of the CFIA's Paper Burden Reduction Initiative. Under this initiative, is the E-Certification project which aims to reduce the risks associated to export documentation while also reducing the time it takes to issue import/export certificates. The CFIA also continued to work with international organizations to influence the development and implementation of international standards. This work included providing technical expertise on a number of trade negotiations and establishing an Agency chief technical negotiator. Further details as well as other examples of key initiatives aimed at mitigating the risks associated to the Program Framework can be found under SO 3 performance reporting found in Section 2.2.3.
1.6 Office of the Auditor General Reports
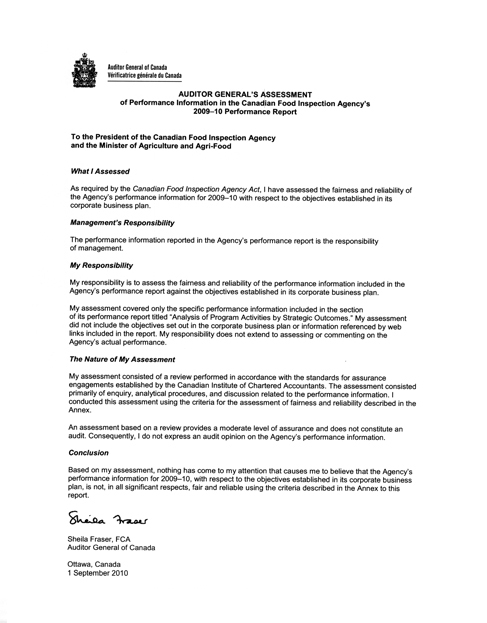
The Auditor General's assessment of the CFIA's performance information is presented in Section 2.1.3 of this report. The performance information, presented in Section 2.2, has not been audited; the assessment is done only at a review level of assurance.
The Auditor General's audit opinion on the CFIA's financial statements is presented in Section 3.1 of this report. The audited statements are also presented in Section 3.1.
The Auditor General has not assessed or audited other sections of this report.
Section II: Analysis of Program Activities by Strategic Outcome
2.1 How the Agency Plans and Reports
In accordance with Treasury Board Secretariat's (TBS) MRRS Policy, the CFIA planning and reporting framework is based on strategic outcomes, a PAA and an associated governance framework. The PAA is aligned with the GoC outcomes and takes into consideration the impact of several factors – including the global and national environment, GoC priorities, CFIA strategic risks, its human and financial resource capacity, and outcomes of its past performance and related lessons learned.
This report highlights key accomplishments and reports on progress made in advancing the plans and priorities identified in the CFIA's 2009–10 RPP. Under each strategic outcome and program activity, performance is reported on special initiatives, risk mitigation strategies and ongoing activities, with a focus on expected results for Canadians.
Section 2.2 of this report describes performance information, including highlights, challenges, lessons learned and expected results for each strategic outcome measured against targets using compliance and other relevant performance indicators.
2.1.1 Assessment of Compliance and Performance Targets
Given the complexity and inherent variability of the agriculture, agri-food, forestry and fisheries production, processing and distribution sectors, the approach to assessing compliance varies across commodity groups. The CFIA uses a variety of tools to monitor and promote compliance, including inspections, audits, product sampling and testing. The CFIA uses risk-based approaches that focus effort on the areas of highest risk. For example, the CFIA focuses its efforts on systems, processes and facilities that have the most direct effect on the safety of food. The resulting compliance rates indicate the extent to which regulated parties have adhered to requirements specified in the federal acts and regulations. Year-over-year compliance trends, when the broader environmental context is taken into account, are more informative in terms of the true performance in an area than the absolute compliance rate for any one year. For detailed information on the assessment of compliance, see Section 3.3.3.
Performance targets for compliance rates are qualitative or quantitative goals set by the CFIA that provide a basis for measuring the performance of regulated parties and the Agency toward achieving expected results. The targets in this report are for critical program areas and based either on historical averages of actual performance or on the expected results of effective programming (e.g. rate of industry compliance with regulatory standards). The CFIA has assessed the extent to which performance has met or exceeded established targets and provided analysis when performance has fallen below targets. Targets for programs that monitor activities are set differently than for programs that focus on specific areas of non-compliance. In terms of compliance rates, the CFIA considers performance within +/- 1% to be considered met.
2.1.2 Fair and Reliable Performance Reporting
In 2008–09, as part of a long-term process to improve overall performance measurement and reporting, the CFIA initiated the Performance Management Reporting Solution (PMRS) project, an Agency-wide management tool that will allow for better reporting and enhance performance monitoring and reporting at all levels. The Enterprise and Operational Reporting (EOR) system, an electronic data warehouse that integrates data from CFIA programs for use by the PMRS, was also launched. When fully operational, the PMRS will facilitate the production of corporate documents such as the RPP, the Performance Report and the Management Accountability Framework, and the PAA and its Performance Measurement Framework. In 2009–10, 16% of the programs were rolled out in the EOR system.
2.1.2.1 Data Quality
In 2009–10, a review was conducted of the methodology behind the Data System and Process Control table that used to appear in previous performance reports (PR). It was determined that the methodology previously used to assess the quality of the data and the resulting assigned ratings was no longer valid because it did not adequately reflect the current state of data control at the CFIA. As such, the Data System and Process Control table has been removed.
Consequently, to provide the reader with an understanding of the level of reliability associated with the performance indicator results found in this report, the CFIA has included a table outlining the various data quality checks that are in place for each performance indicator. The CFIA has identified nine general data quality checks that can be present during the process whereby raw performance data is collected, processed, and analysed to generate a final performance result. Table 2-1 shows which of the nine data quality checks are used in each of the data systems behind each performance indicator. This provides the reader with a clear sense of the data quality checks used to generate each performance indicator result.
It is important to keep in mind that the information found in this table provides a relative measure of the reliability of the performance indicator results. This means a data system with nine out of nine data checks in place should be thought of as more reliable than one with five out of nine data checks. It does not mean that a data system with five out of nine data checks in place is unreliable or that a data system with nine out of nine data checks is reliable. The reader should keep in mind that the performance indicator results presented in this report do go through a thorough internal review before they are published. Please note that the new approach used this year to improve the data quality discussion is an interim step in a longer term process. As such, the CFIA will continue to strengthen its data quality discussion in future performance reports.
Table 2.1: Data Quality Checks
| Indicator Title | Source Documents available (Guides, Procedures, manuals) | Data is cross-referenced | Performance results are compared to previous years | System reports and results are consistent regardless of when they are generated or who generates them | Employees are trained to manipulate data | No 3rd-party data is used or 3rd-party data is provided in a compulsory fashion | Data is prepared at least once per year | Management Reviews results at least once per year | No new data system(s) used in 2009–10 | # Data Quality Checks Met |
|---|---|---|---|---|---|---|---|---|---|---|
| Extent to which inspected federally-registered establishments comply with federal food safety requirements | ||||||||||
| Meat | √ | X | √ | X | X | √ | √ | X | √ | 5 |
| Fish and seafood | √ | √ | √ | √ | √ | √ | √ | √ | √ | 9 |
| Processed products | X | X | √ | √ | X | √ | √ | √ | √ | 6 |
| Dairy | √ | X | √ | √ | √ | √ | √ | √ | √ | 8 |
| Shell Egg | √ | √ | √ | √ | √ | √ | √ | √ | √ | 9 |
| Extent to which domestic and imported food products comply with federal chemical residue requirements | ||||||||||
| Meat | √ | X | √ | √ | √ | √ | √ | √ | √ | 8 |
| Fish & Seafood | √ | √ | √ | √ | √ | √ | √ | √ | √ | 9 |
| Fresh fruit and vegetables | √ | X | √ | √ | √ | √ | √ | √ | √ | 8 |
| Processed products | √ | X | √ | √ | √ | √ | √ | √ | √ | 8 |
| Honey | √ | X | √ | √ | √ | √ | √ | √ | √ | 8 |
| Shell Egg | √ | X | √ | √ | √ | √ | √ | √ | √ | 8 |
| Dairy | √ | X | √ | √ | √ | √ | √ | √ | √ | 8 |
| Time taken to issue public warnings for Class I recalls | √ | X | √ | √ | √ | √ | √ | √ | √ | 8 |
| Extent to which nutrition information on non-registered food products inspected is accurate | √ | X | √ | √ | √ | √ | √ | √ | √ | 8 |
| Number of incidents of Avian Influenza that expand beyond the initial control zone | √ | √ | X | √ | X | √ | √ | √ | √ | 7 |
| Extent to which the CFIA’s data indicates that foreign regulated animal diseases have entered Canada via specified regulated pathways | √ | X | √ | X | X | X | √ | √ | √ | 5 |
| Extent to which the CFIA’s data indicates the spread of foreign regulated animal diseases that entered into Canada this fiscal year | √ | √ | X | √ | X | √ | √ | √ | √ | 7 |
| Extent to which renderers and feed mills inspected are without any major deviations with respect to the Feeds Regulations and the Health of Animals Regulations | ||||||||||
| Renderers | Not Reported in 2009–2010 | |||||||||
| Feed Mills | Not Reported in 2009–2010 | |||||||||
| Extent to which CFIA data indicates the entry and establishment of new and foreign regulated plant diseases and pests into Canada (listed diseases/pests in the Regulated Pest List for Canada) | √ | X | X | √ | X | X | √ | √ | √ | 5 |
| Extent of change in the presence of regulated plant diseases or pests beyond the regulated areas | √ | X | X | √ | X | X | √ | √ | √ | 5 |
| Extent to which Plant Health risks identified by the CFIA (within and outside Canada) are communicated to the affected stakeholders | Not Reported in 2009–2010 | |||||||||
| Percentage of inspections of novel products that demonstrate compliance with the requirements and standards outlined in the respective authorizations for experimental purposes | ||||||||||
| Plants with Novel Traits | √ | X | √ | √ | √ | √ | √ | √ | √ | 8 |
| Novel Fertilizers | √ | X | √ | √ | √ | √ | √ | √ | √ | 8 |
| Feed | No Inspections Performed | |||||||||
| Veterinary Biologics | √ | X | X | X | √ | √ | √ | √ | √ | 6 |
| Percentage of regulatory initiatives that meet publication requirements for publication in either Canada Gazette, Part I or Part II | √ | √ | √ | X | √ | √ | X | √ | √ | 7 |
| Extent to which the net quantity, composition, labelling and advertising of non-registered food products inspected is accurate | √ | X | √ | √ | √ | √ | √ | √ | √ | 8 |
| Extent to which certified food, animal and plant shipments meet the receiving country’s import requirements | ||||||||||
| Food – Meat | √ | X | √ | X | X | X | √ | √ | √ | 5 |
| Food – Fish and Seafood | √ | √ | √ | √ | √ | X | √ | √ | √ | 8 |
| Food – Processed Egg | √ | √ | √ | √ | √ | X | √ | √ | √ | 8 |
| Animal | No Data Available | |||||||||
| Plant | √ | X | √ | √ | √ | X | √ | √ | √ | 7 |
2.1.3 Auditor General's Assessment of Performance Information
2.2 Performance by Strategic Outcome
2.2.1 Strategic Outcome 1: Public health risks associated with the food supply and transmission of animal diseases to humans are minimized and managed
As a contributor to the GoC's integrated approach to population health, the CFIA, in collaboration with federal partners and provincial, territorial and municipal governments, protects Canadians from preventable foodborne health risks and risks associated with animal diseases potentially transmissible to humans. In carrying out activities toward the achievement of this strategic outcome, the CFIA focused its efforts on the following two priorities:
- Improving inspection and surveillance approaches
- Modernizing the Agency's regulatory framework and tools
While work under the program activities Food Safety and Nutrition Risks and Zoonotic Risks is primarily aimed at addressing the Foodborne Hazards and Zoonotic Outbreaks/Incidents risk areas9, it also benefits the other key risk areas noted above.
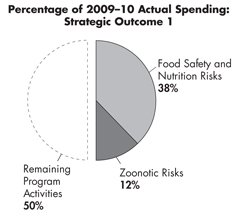
Percentage of 2009–10 Actual Spending: Strategic Outcome 1
Food Safety and Nutrition Risks
Benefits for Canadians
The safety of the Canadian food supply is critical to the overall health and well-being of Canadians. The CFIA, in collaboration with federal, provincial, territorial, and municipal partners and organizations works to protect the overall health of Canadians by minimizing and managing food safety and nutrition risks.
Performance Summary
The following table identifies the CFIA's expected results, performance indicators and targets for the Food Safety and Nutrition Risks program activity, and reports 2009–10 performance against these expectations. For more detailed information, including results from previous reporting periods, refer to Summary of Performance Indicators in Section 3.3.1. Where applicable, performance indicator results have been rounded down to the nearest percentage point.
Table 2–2: Summary of Performance: Food Safety and Nutrition Risks
| Expected Result: Risks associated with food, including nutrition, are managed within acceptable limits | |||||
| 2009-10 Financial Resources ($ millions) |
2009-10 Human Resources (FTEs) |
||||
|---|---|---|---|---|---|
| Planned Spending |
Total Authorities |
Actual Spending |
Planned | Actual | Difference |
| 245.5 | 276.5 | 270.5 | 2,795 | 2,838 | (43) |
| Variance Analysis | |||||
| The Variance between Planned Spending and Total Authorities is mainly due to new funding for the Government of Canada Response to Listeriosis, the CEAP and the Growing Forward Program Suite. The variance analysis between Planned and Actual FTEs is not provided because the Planned figure does not consider reallocations of FTEs between program activities. If the Planned figure was restated for this, it would be 2,831 compared to Actual FTEs of 2,838, resulting in a difference of 7. | |||||
| Performance Indicators* |
Targets | Performance Status | ||
|---|---|---|---|---|
|
Extent to which inspected federally registered establishments comply with federal food safety requirements |
≥ 98% compliance | Meat | 96% | Not Met |
| Fish and Seafood10 | 99% | Met | ||
| Processed Products | 99% | Met | ||
| Dairy | 100% | Met | ||
| Shell Egg | 99% | Met | ||
|
Performance Analysis: Meat Emphasis has also been placed on resolving problems before they occur resulting in enhanced communication and engagement with the meat industry. This includes guidance for both inspectors and operators of federally registered meat and poultry establishments which should also help the industry to improve compliance in subsequent years. Compliance Approaches and Methods: Three-year Trend Analysis: Fish and Seafood Dairy and Shell Egg Processed Products |
||||
| Performance Indicators* |
Targets | Performance Status |
||
|
Extent to which domestic and imported food products comply with federal chemical residue requirements |
≥ 95% compliance | Meat | 96% | Met |
| Fish and Seafood12 | 95% | Met | ||
| Fresh fruit and vegetables | 97% | Met | ||
| Processed Products | 99% | Met | ||
| Honey | 61% | Not Met | ||
| Shell Egg | 97% | Met | ||
| Dairy | 96% | Met | ||
|
Performance Analysis: Honey Compliance Approaches and Methods: Fish and Seafood Meat, Fresh Fruit and Vegetables, Processed Products, Honey, Shell Egg and Dairy Three-year Trend Analysis: Fish and Seafood Honey (2007–08, 84%; 2008–09, 76%) |
||||
| Performance Indicators* |
Targets | Performance Status |
|
|---|---|---|---|
|
Time taken to issue public warnings for Class I recalls |
100% of public warnings for Class I recalls are issued within 24 hours of a recall decision |
100% |
Met |
|
Performance Analysis: Three-year Trend Analysis: |
| Performance Indicators* |
Targets | Performance Status |
|
|---|---|---|---|
|
Extent to which nutrition information on non-registered food products inspected is accurate.16 |
≥80% of food products inspected declare nutrition information, which is accurate. |
80% |
Met |
|
Performance Analysis: Three-year Trend Analysis: (2008–09, 85%) |
|
Additional Information: |
* For more information on data controls and data limitations regarding CFIA's performance indicators, please see Table 2-1.
In addition to the detailed performance results found in Table 2-2, the CFIA also achieved strategic performance results under the Food Safety and Nutrition Risks PA:
Strategic Performance Analysis
In responding to the recommendations in the Report of the Independent Investigator into the 2008 Listeriosis Outbreak, the CFIA has implemented changes to food safety programs and directives that are designed to improve and strengthen existing processes and procedures. The CFIA was the lead in addressing 25 of a total of 57 recommendations. As identified in the March “Progress on Food Safety” report17, the Government has made progress on all of the recommendations contained in the report of the Independent Investigator. The following are examples of progress made by the CFIA with respect to the 25 recommendations for which it is the lead Agency:
- Implemented revised Listeria directives that require meat processors to bring all Listeria-positive results to the attention of CFIA inspectors. Requirements from the directives, as well as additional improvements, were included in an updated version of the Meat Hygiene Manual of Procedures.
- Expanded its capacity to conduct enhanced Listeria surveillance and testing pursuant to sampling plans implemented in April 2009. To address the increased volume of samples, all CFIA food microbiology laboratories were made available to receive samples and perform tests seven days per week.
- Met with consumers and consumer association representatives across Canada to share information on topics such as the CFIA's role in food recalls, food labelling and food safety investigations. Results from these meetings helped the CFIA to strengthen outreach—such as the launch of the GoC Food Safety Portal and the redesign of the Agency's Consumer Centre website—and to inform policies relating to food safety.
- Worked with Health Canada on a number of food safety publications and multimedia products.
- Provided additional information on Class II and III food recalls on the CFIA's website to raise consumer awareness of the potential risks to the food supply.
ENHANCING CFIA'S FOOD SAFETY CAPACITY
35 new meat processing inspectors in federally-registered ready-to-eat meat plants were hired between November 1, 2009 and March 31, 2010. The 35 new inspectors are focussing on specific issues related to Listeria and other food pathogens at ready-to-eat meat establishments. These additional inspectors will result in an increase in the number of trained ready-to-eat meat inspection staff and it is expected that they will improve the management of risks associated with Listeria in ready-to-eat meats produced in federally registered establishments.*† The CFIA also developed capacity, through its Pulse-Field Gel Electrophoresis Centre, to routinely test food samples and to report virtually immediately to the provincial and federal PulseNet Canada members when its laboratories isolate foodborne bacterial pathogens. This new capacity has greatly improved Canada's ability to detect contaminated food products and identify laboratory linkages to human diseases related to consumption of these products.
* Please refer to the Inspection.gc.ca website for more information: www.inspection.gc.ca/english/fssa/proge.shtml
† Please refer to Section 1.4.1.3 for more information on CFIA staffing trends
The CFIA is committed to continually strengthening its programs to maintain Canadians' high level of confidence in Canada's food safety system. In 2009–10, the CFIA achieved the following:
- Implemented the CVS in the Feed Program and continued the improvement of the CVS for the Meat Program. The CVS will help improve regulated parties' compliance with regulations and enhance food safety oversight. Furthermore, the CFIA continued to study the feasibility of implementing the CVS throughout its commodity inspection programs.
Within the context of the Food and Consumer Safety Action Plan (FCSAP), the CFIA is advancing initiatives that support the following: active prevention to better identify food safety risks, targeted oversight to enhance inspection of high-risk food sectors, and rapid response to problems when they occur (i.e. enhanced food recall capacity and improved tools to alert Canadians to food-related hazards). For example, in 2009–10, the CFIA achieved the following:
- Signed an important arrangement with the General Administration of Quality Supervision, Inspection and Quarantine of the People's Republic of China (AQSIQ) as part of Year Two of the FCSAP. This arrangement establishes a Canada–China Food Safety Working Group, whose main objective is a mutual understanding of our structures, programs and operating mechanisms to facilitate exploration of approaches for the rapid exchange of information on food safety issues and the handling of food safety emergencies.
- Continued to enhance its relationship with the U.S. Food and Drug Administration (U.S. FDA) by discussing options for information-sharing regarding mutual food safety challenges, and by identifying areas for collaboration.
- Enhanced the delivery of inspections by targeting “high-risk” products such as seasonings, flavourings, pastes and sauces (e.g. chili paste, curry powder mix) for undeclared allergens (soy, gluten, milk, etc.) or snack foods, as well as flavoured beverages for undeclared allergens (peanut, milk, tree nuts).
- Worked with domestic government partners to increase capacity to identify and mitigate food safety risks through such activities as developing and implementing a risk mapping model. The CFIA also focused on the development of policy and associated programs to enhance food safety oversight, and increased awareness and understanding of consumers and industry stakeholders regarding their role in food safety through the use of communications tools and a number of outreach initiatives. These outreach initiatives included industry and consumer conferences, information sessions and workshops.
Lessons Learned
- Due to the developmental nature of the work that was underway in the first year of the Food Safety Action Plan (FSAP), the monitoring and reporting elements were found to be challenging.
- To address this, during the past year, the CFIA developed a series of documents to well-define and wholly articulate all areas of activity. These documents provided a solid basis for improved project management, monitoring and reporting for the remaining three years of the FSAP.
Zoonotic Risks
Benefits for Canadians
Managing and mitigating the spread of zoonotic diseases from animals to humans is important because it minimizes the danger to the health and well-being of Canadians. This involves work with federal, provincial and territorial partners and non-government stakeholders.
Performance Summary
The following table identifies the CFIA's expected result, performance indicators and targets for the Zoonotic Risks program activity, and reports 2009–10 performance against these expectations. For more detailed information, including results from previous reporting periods, refer to Summary of Performance Indicators in Section 3.3.1. Where applicable, performance indicator results have been rounded down to the nearest percentage point.
Table 2–3: Summary of Performance: Zoonotic Risks
| Expected Result: Risks of the transmission of animal diseases to humans are managed within acceptable limits18 | |||||
| 2009-10 Financial Resources ($ millions) |
2009-10 Human Resources (FTEs) |
||||
|---|---|---|---|---|---|
| Planned Spending |
Total Authorities |
Actual Spending |
Planned | Actual | Difference |
| 75.3 | 91.2 | 83.3 | 679 | 539 | 140 |
| Variance Analysis | |||||
| The Variance between Planned Spending and Total Authorities is mainly due to new funding for the H1N1 Preparedness and Response and the CEAP, as well as funding received for the continuance of the BSE initiative. The Variance between Total Authorities and Actual Spending relates to lapsing funds in both BSE and Avian Influenza. The Variance analysis between Planned and Actual FTEs is not provided because the Planned figure does not consider reallocations of FTEs between program activities. If the Planned figure was restated for this, it would be 298 compared to Actual FTEs of 539, resulting in a difference of 241. This variance can be explained by the FTEs received during the fiscal year for the continuance of BSE. | |||||
| Performance Indicators* |
Targets | Performance Status |
|---|---|---|
|
Number of incidents of avian influenza that expand beyond the initial control zone19 |
No expansion of the disease beyond the initial control zone | Met |
|
Performance Analysis: Three-year Trend Analysis: |
||
| Additional Information: Avian Influenza programming: http://www.inspection.gc.ca/english/anima/heasan/disemala/avflu/avflue.shtml Animal diseases: http://www.inspection.gc.ca/english/anima/disemala/disemalae.shtml |
||
* For more information on data controls and data limitations regarding CFIA's performance indicators, please see Table 2-1.
In addition to the detailed performance results found in Table 2-3, the CFIA also achieved strategic performance results under the Zoonotic Risks PA:
Strategic Performance Analysis
The CFIA continued to enhance systems to manage and mitigate the spread of existing federally controlled zoonotic diseases. In 2009–10, the CFIA did the following:
- Continued to protect cows from BSE and ensuring Canadian's food is safe by verifying industry's removal of specified risk material (SRM) from the human food and animal feed chains. Removal of SRM is recognized as the single most effective measure for controlling BSE.
- Helped prevent animal infections by working to detect poultry flocks infected with notifiable avian influenza before the disease could be spread to other flocks. This was achieved by educating industry through the CFIA's biosecurity programs and ongoing surveillance. In addition, the CFIA conducted field exercises within the Agency and with partners in provinces and industry; continued training in foreign animal disease recognition; and reviewed containment strategies such as vaccination.
- Enhanced communications on reportable disease detections in farmed animals. All confirmed cases of any of the reportable diseases are now reported monthly or quarterly on the CFIA's website, at which time email notification is sent to subscribers. This centralized format provides additional disease background more readily for stakeholders and partners.
- Collaborated with the Canadian Animal Health Surveillance Network (CAHSN) National BSE Surveillance Program achieving a web-based, central repository for merged provincial BSE test data that is accessible for analysis and reporting to the World Organisation for Animal Health (OIE).
PROTECTING CANADIANS FROM BSE
The CFIA continued to monitor the level of BSE and the effectiveness of measures taken to control it in the domestic cattle population. Of 34,618 samples tested in 2009, 1 was confirmed positive for BSE. No part of this confirmed BSE animal entered the human food supply or animal feed systems.
The CFIA is a key player in a number of international zoonotic disease fora and is actively called upon to manage Canadian portions of international zoonotic disease outbreaks. A number of key partnerships have been formed, and plans have been proactively developed to respond to zoonotic diseases and protect public health, such as the following:
- In collaboration with the Public Health Agency of Canada (PHAC), the CFIA developed a test to confirm, within a very short timeline, the presence and characteristics of the H1N1 virus in animals. This test was then shared with other animal disease diagnostic laboratories in Canada and around the world.
- To ensure that the CFIA would be able to respond effectively to an H1N1 outbreak in animals, the Agency purchased over $100,000 of personal protective equipment for front-line staff. Additionally, the CFIA developed a national policy entitled “Policy to Manage Pandemic H1N1/2009 in Animal Populations” to improve the management of infected livestock and poultry.
- The CFIA continued to work with federal, provincial and territorial partners, and other national and international organizations such as the OIE to share scientific knowledge, establish collaborative approaches to common challenges and share best practices as they pertain to zoonotic disease preparedness, disease mitigation and control.
Lessons Learned
- The existing disease response system had deficiencies in defining roles and responsibilities between levels of government (federal and provincial) and between departments responsible for human and animal health at the federal level.
- To address this, the CFIA demonstrated leadership when a herd of swine in Alberta became ill with an influenza virus strain (H1N1) that appeared to have passed from humans to the pigs. Along with other levels of government, the CFIA developed clearer protocols to provide greater public protection in the event of other emerging zoonotic events.
2.2.2 Strategic Outcome 2: A safe and sustainable plant and animal resource base
The CFIA's programming is aimed at protecting Canada's crops, forests, livestock, aquatic species and wildlife from regulated pests and diseases; preventing the introduction of contaminants into human food or the environment through animal and plant production systems; and assessing the environmental sustainability and impact on biodiversity of new products derived through enabling technologies such as biotechnology. In carrying out activities toward the achievement of this strategic outcome, the CFIA focused its efforts on the following priorities:
- Enhancing compliance and enforcement activities; and
- Modernizing the Agency's regulatory framework.
While work under such program activities as Animal Health Risks and Production Systems, Plant Health Risks and Production Systems, and Biodiversity Protection, is primarily aimed at addressing the Animal and Plant Pest and Disease risk areas, it also benefits the other key risk areas noted above.
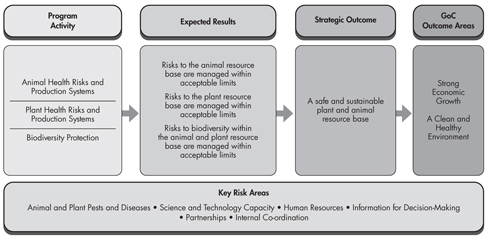
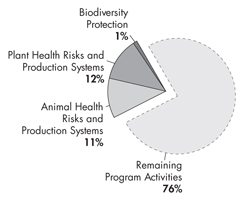
Percentage of 2009–10 Actual Spending: Strategic Outcome 2
Animal Health Risks and Production Systems
Benefits for Canadians
The Canadian agriculture and agri-food industry depends on a safe and sustainable animal resource base. In support of this, the CFIA works to protect the animal resource base—through the regulation of terrestrial and aquatic diseases and feed—from risks that could impact the food supply, economy, environmental sustainability and well-being of Canadians.
Performance Summary
The following table identifies the CFIA's expected result, performance indicators and targets for the Animal Health Risks and Production Systems program activity, and reports 2009–10 performance against these expectations. For more detailed information, including results from previous reporting periods, refer to Summary of Performance Indicators in Section 3.3.1. Where applicable, performance indicator results have been rounded down to the nearest percentage point.
Table 2–4: Summary of Performance: Animal Health Risks and Production Systems
| Expected Result: Risks to the animal resource base are managed within acceptable limits | |||||
| 2009-10 Financial Resources ($ millions) |
2009-10 Human Resources (FTEs) |
||||
|---|---|---|---|---|---|
| Planned Spending |
Total Authorities |
Actual Spending |
Planned | Actual | Difference |
| 56.7 | 84.1 | 80.1 | 652 | 725 | (73) |
| Variance Analysis | |||||
| The Variance between Planned Spending and Total Authorities is mainly due to funding received for the Growing Forward Program Suite and for additional statutory compensation. The Variance between Total Authorities and Actual Spending relates to lapsing funds in some of the CFIA's initiatives, as well as internal reallocations. The Variance analysis between Planned and Actual FTEs is not provided because the Planned figure does not consider reallocations of FTEs between program activities. If the Planned figure was restated for this, it would be 792 compared to Actual FTEs of 725, resulting in a difference of 67. This variance relates to lapsing funds in some of the Agency's initiatives. | |||||
| Performance Indicators* |
Targets | Performance Status |
|---|---|---|
|
Extent to which the CFIA's data indicates that foreign regulated animal diseases have entered Canada via specified regulated pathways |
No evidence (i.e. confirmed by the CFIA's data) that foreign regulated animal diseases have entered into Canada through specified regulated pathways | Met |
|
Performance Analysis: Three-year Trend Analysis: |
||
| Performance Indicators* |
Targets | Performance Status |
|---|---|---|
|
Extent to which the CFIA's data indicates the spread of foreign regulated animal diseases that entered into Canada this fiscal year20. |
No evidence, as confirmed by the CFIA's data of spread of foreign regulated animal diseases beyond the initial control zone. | Met |
|
Performance Analysis: Three-year Trend Analysis: |
||
| Performance Indicators* |
Targets | Performance Status |
||
|---|---|---|---|---|
|
Extent to which renderers and feed mills inspected are without any major deviations with respect to the Feeds Regulations and the Health of Animals Regulations (enhanced feed ban)21 |
≥ 95% compliance | Renderers | Not reporting | Not reporting |
| Feed Mills | Not reporting | Not reporting | ||
|
Performance Analysis: Compliance Approaches and Methods: Three-year Trend Analysis: |
||||
| Additional Information: Animal Health Programs: http://www.inspection.gc.ca/english/anima/animae.shtml |
||||
* For more information on data controls and data limitations regarding CFIA's performance indicators, please see Table 2-1.
In addition to the detailed performance results found in Table 2-4, the CFIA also achieved strategic performance results under the Animal Health Risks and Production Systems:
Strategic Performance Analysis
The CFIA continues to respond to emergencies and domestic animal disease outbreaks while maintaining a collaborative approach with stakeholders. More specifically, the CFIA undertook the following:
- Launched an animal health awareness campaign that helped increase awareness and the adoption of core biosecurity principles on farms across Canada. The campaign included a national advertising campaign, training video and handbook, and face-to-face interaction at fairs, conferences and meetings with producers across Canada. Two-thirds of producers surveyed recall having seen, read or heard advertising about animal health or biosecurity over the past few months.
- Released the national Avian On-Farm Biosecurity Standard, designed to minimize the introduction and spread of diseases and pests that has since been incorporated into Chicken Farmers of Canada's on-farm safety program. The Standard was developed through extensive consultation with agri-commodity stakeholders, academia, and provincial and federal partners.
- The CFIA continued to address action items identified in the Foot and Mouth (FMD) Preparedness Risk Based Action Plan in order to enhance Agency preparedness and response capabilities. Activities included industry biosecurity guideline development for susceptible livestock species, progress on the CFIA–U.S. Department of Agriculture (USDA) project on regionalization in the event of foreign animal disease, and elaboration of animal disposal procedures to include all hazards/species and transportation of infected animal material.
- Further implemented the National Aquatic Animal Health Program in 2009–10, which led to proposed regulatory changes to ensure that Canada maintains its exports by having an internationally recognized aquatic animal health program that meets international standards. These changes will increase consumer and aquatic resources (both wild and farmed) protection, and will enhance market access for aquaculture and wild aquatic commodities.
- Completed foresight exercises as part of the Foresight for Canadian Animal Health (Fore-CAN) project, led by the CFIA with partners in PHAC, AAFC, provinces and territories, academia and industry. Foresight is a key element for a better understanding of the challenges and opportunities that science partners will have to face a decade or more into the future.
In 2009–10, the CFIA continued to work with federal, provincial and territorial governments to advance key initiatives under the animal health program.
- For example, the discovery of pandemic H1N1 2009 influenza virus (pH1N1) in a herd of pigs in Alberta at the initial stages of the 2009 pandemic resulted in a collaborative effort involving animal health and public health authorities at the international, national and the federal, provincial and territorial levels to address issues of common concern associated with the pathogenicity of the virus, virus transmission and occupational safety and health. The One World, One Health concept was illustrated by this situation and continues to be applied in federal, provincial and territorial discussions on policy and regulatory approaches for identified and emerging zoonotic diseases.
- Federal, provincial, and territorial governments are committed to move forward on a comprehensive national traceability system for livestock and poultry by 2011, which is critical for managing animal health and food safety issues, as well as expanding market access and driving efficiencies.
To continue to modernize the animal programs, the CFIA updated key elements of the regulatory framework by undertaking the following in 2009–10:
HUMANE TRANSPORTATION AND SLAUGHTER OF ANIMALS IN CANADA
The CFIA has been working in collaboration with partners and stakeholders to develop a proposal aimed at updating regulations relating to humane transportation of animals in Canada. It is expected that the proposed amendments will strengthen the existing regulatory framework respecting the humane treatment of animals during transport and slaughter.
Lessons Learned
- Traceability is critical for following animals and food from one point in the supply chain to another. The current federal framework can be strengthened to ensure more consistent reporting of premises identification and movement of information across Canada.
- The CFIA is working with provincial, territorial, and industry partners to develop a proposed legislative framework that will strengthen Canada's traceability framework to better equip governments with more detailed information to prepare for, and rapidly respond to, animal health issues in the livestock and poultry sectors.
Plant Health Risks and Production Systems
Benefits for Canadians
The protection of the plant resource base is integral to a safe and accessible food supply and critical to the economy, environmental sustainability and well-being of all Canadians. The CFIA helps to protect Canada's plant resource base from regulated pests and diseases and from deliberate threats, and regulates agricultural and forest products to promote the sustainability of the plant resource base.
Performance Summary
The following table identifies the CFIA's expected result, performance indicators and targets for the Plant Health Risks and Production Systems program activity, and reports 2009–10 performance against these expectations. For more detailed information, including results from previous reporting periods, refer to Summary of Performance Indicators in Section 3.3.1. Where applicable, performance indicator results have been rounded down to the nearest percentage point.
Table 2–5: Summary of Performance: Plant Health Risks and Production Systems
| Expected Result: Risks to the plant resource base are managed within acceptable limits | |||||
| 2009-10 Financial Resources ($ millions) |
2009-10 Human Resources (FTEs) |
||||
|---|---|---|---|---|---|
| Planned Spending |
Total Authorities |
Actual Spending |
Planned | Actual | Difference |
| 61.3 | 94.7 | 89.7 | 655 | 735 | (80) |
| Variance Analysis | |||||
| The Variance between Planned Spending and Total Authorities is mainly due to funding received to assist in the payment of litigation costs; funding received related to the CEAP; and funds received for additional statutory compensation. The Variance between Total Authorities and Actual Spending relates to lapsing funds in some of the Agency's initiatives, as well as internal reallocations. The Variance analysis between Planned and Actual FTEs is not provided because the Planned figure does not consider reallocations of FTEs between program activities. If the Planned figure was restated for this, it would be 735, the same as the Actual FTEs. | |||||
| Performance Indicators* |
Targets | Performance Status |
|---|---|---|
|
Extent to which CFIA data indicates the entry and establishment of new and foreign regulated plant diseases and pests into Canada (listed diseases/pests in the Regulated Pest List for Canada)22 |
No evidence (i.e. confirmed by CFIA data) of the entry and establishment of new foreign regulated plant diseases and pests into Canada through specified regulated pathways |
Met 0 entries of pests currently on the Regulated List for Canada |
|
Performance Analysis: Three-year trend Analysis: (2007-08, 3 entries, 2008–09, no entries) |
||
| Performance Indicators* | Targets | Performance Status |
|---|---|---|
|
Extent of change in the presence of regulated plant diseases or pests beyond the regulated areas |
No evidence of increase in the size of regulated areas for plant diseases/pests attributable to human activity |
Not Met Four pests spread outside their regulated areas. |
|
Performance Analysis: Of the four pests that spread outside of the regulated area during the 2008–09 fiscal year, only the emerald ash borer and the blueberry maggot spread again in 2009–10. In 2009–10, the pine shoot beetle and the brown spruce longhorn beetle spread outside of their regulated areas. Three-year Trend Analysis: (2006–07, Some Increase; 2007–08, Increase; 2008–09, Five Pests Spread) |
||
| Performance Indicators* |
Targets | Performance Status |
|---|---|---|
|
Extent to which Plant Health risks identified by the CFIA (within and outside Canada) are communicated to the affected stakeholders |
Following the identification of a plant health risk, appropriate information is communicated with the relevant stakeholders in less than one month |
Not Reporting |
|
Performance Analysis: Three-year Trend Analysis: |
||
| Additional Information: Plant Protection Programs: http://www.inspection.gc.ca/english/plaveg/plavege.shtml Plant Pests: http://www.inspection.gc.ca/english/plaveg/pestrava/pestravae.shtml |
||
* For more information on data controls and data limitations regarding CFIA's performance indicators, please see Table 2-1.
In addition to the detailed performance results found in Table 2-5, the CFIA also achieved strategic performance results under the Plant Health Risks and Production Systems PA:
Strategic Performance Analysis
In 2009–10, the CFIA focused on advancing the development of a systemic approach to managing plant pest–related risks.
- As indicated in the CFIA's 2008–2009 Performance Report, the Office of the Auditor General (OAG) conducted an audit to examine the CFIA's management of risks associated with the import of plants and plant products. In June 2009, the Standing Committee on Public Accounts (PACP) considered the findings of the OAG's 2008 report and the CFIA's management action plan, as well as its progress in addressing the OAG's recommendations, and developed its own set of recommendations. The GoC will implement its integrated detailed and technical action plan (DTAP). This plan, which responds to the PACP's report, is available online on the Parliament of Canada's website.23 As proposed and described in the DTAP, the CFIA has strengthened internal governance, assessed the flow of import documentation at its import service centres to identify potential solutions to change the current paper-based system, and developed an action plan for modernizing the Plant Health Import Program.
- In addition, the CFIA has completed an internal evaluation of its Invasive Alien Species Program in order to determine the effectiveness and success of the Program's design and to propose improvements to its design, governance structure and allocation of resources.24 The resulting recommendations from the internal evaluation focused on strengthened governance, including Information Management and Information Technology action items, as well as performance management.
- A key recommendation in the Standing Committee on Agriculture and Agri-Food (SCAAF) report on potato cyst nematode (PCN) in Quebec and Alberta was the timely completion of the negotiations to establish Guidelines on Surveillance and Phytosanitary Actions for PCN.25 In June 2009, the CFIA and the USDA signed the revised Canada and United States Guidelines on Surveillance and Phytosanitary Actions for PCN.26 Application of the Guidelines resulted in the deregulation of the majority of previously PCN-quarantined land in Alberta.
- The CFIA recognizes that prevention depends on effective environmental scanning, identification of high-risk pests and pathways, and collaboration between internal and external stakeholders to develop and implement effective risk-mitigation measures for plant commodities. To that end, new phytosanitary measures were put in place to minimize the risk of introduction of two new plant pests—tomato leafminer moth27 (Tuta absoluta) and false codling moth28 (Thaumatotibia leucotreta), both of which can enter Canada via imported greenhouse produce.
DID YOU KNOW?
The CFIA eliminated the backlog of submissions for approval and registration of fertilizers and supplements, and implemented service delivery standards for registration-related applications. This will facilitate the introduction of new, safe and high-quality fertilizers and supplements into the marketplace.
Lessons Learned
- In light of increased scrutiny by the OAG and the PACP, it was recognized that the CFIA needed to address its current use of resources to maintain and enhance its commitment to continually strengthen its regulatory systems. To address this, the Agency has begun a review of all of its program activities toward more efficient use of its resources, such as the development and implementation of a plant strategic action plan that will identify priorities, analyze risks and address future goals, and issues of protecting the plant resource base.
Biodiversity Protection
Benefits for Canadians
The protection of Canada's biodiversity is critical to the sustainability of the animal and plant resource base, the economy, the environment and the well-being of Canadians. Through targeted programs and services, the CFIA is managing risks and protecting Canada's environment from the spread of invasive alien species, other pests, novel agricultural products and emerging technologies.29
Performance Summary
The following table identifies the CFIA's expected result, performance indicators and targets for the Biodiversity Protection program activity, and reports 2009–10 performance against these expectations. For more detailed information, including results from previous reporting periods, refer to Summary of Performance Indicators in Section 3.3.1. Where applicable, performance indicator results have been rounded down to the nearest percentage point.
Table 2–6: Summary of Performance: Biodiversity Protection
| Expected Result: Risks to biodiversity within the animal and plant resource base are managed within acceptable limits | |||||
| 2009-10 Financial Resources ($ millions) |
2009-10 Human Resources (FTEs) |
||||
|---|---|---|---|---|---|
| Planned Spending |
Total Authorities |
Actual Spending |
Planned | Actual | Difference |
| 11.1 | 11.3 | 9.5 | 113 | 99 | 14 |
| Variance Analysis | |||||
| The Variance between Total Authorities and Actual Spending relates to lapsing funds in some of the Agency's initiatives as well as internal reallocations. The Variance analysis between Planned and Actual FTEs is not provided because the Planned figure does not consider reallocations of FTEs between program activities. If the Planned figure was restated for this, it would be 99 FTEs, the same as the Actual FTEs. | |||||
| Performance Indicators* | Targets31 | Performance Status |
||
|---|---|---|---|---|
|
Percentage of inspections of novel products that demonstrate compliance with the requirements and standards outlined in the respective authorizations for experimental purposes32 |
Plants with Novel Traits: 90% Novel Fertilizer: 95% Novel Feed: 80% Veterinary Biologics: 80% Additional information33 |
Plants with Novel Traits | 95% | Met |
| Novel Fertilizer | 95% | Met | ||
| Novel Feed | Not Applicable 0 inspections |
|||
| Veterinary Biologics | 100% | Met | ||
|
Performance Analysis: Novel Feed: Compliance Approaches and Methods: Three-year Trend Analysis: Novel Fertilizer (2007–08 95%), (2008–09 80%) Novel Feed and Veterinary Biologics |
||||
| Additional information: Invasive Alien Species: http://www.inspection.gc.ca/english/plaveg/invenv/refe.shtml Plant Biosafety: http://www.inspection.gc.ca/english/plaveg/bio/pbobbve.shtml |
||||
* For more information on data controls and data limitations regarding CFIA's performance indicators, please see Table 2-1.
In addition to the detailed performance results found in Table 2-6, the CFIA also achieved strategic performance results under the Biodiversity Protection PA:
Strategic Performance Analysis
Introducing new and innovative products contributes to maintaining the competitiveness of Canada's agricultural sector. However, competitiveness and innovation cannot come at the expense of environmental sustainability. As such, the CFIA considers impacts on the environment and other species (biodiversity) a key component of the regulatory review process that is mandatory for plants with novel traits, novel feeds and novel supplements or veterinary biologics.
- Under the draft Canadian Invasive Plant Framework, the CFIA has developed a draft Invasive Plant Policy, a Least Wanted Invasive Plants pilot project and a streamlined risk assessment tool. Phase III of stakeholder consultation on the draft Framework has been completed and the document is expected to be finalized by December, 2010. Broad stakeholder consultations on both the draft Invasive Plants Policy and the Least Wanted Invasive Plants pilot project will be completed by September 2010, and the implementation of these initiatives will be based on outcomes of the consultations. The risk assessment tool refined under the pilot project initiative would be an effective model to adopt in the future for other plant pests in order to protect the plant resource base.
- The CFIA continued delivering its Travellers Biosecurity Awareness campaign, which provides up-to-date information on what can and cannot be brought into Canada. The campaign included advertising, outreach and partnership strategies with a special focus on the 2010 Olympic and Paralympic Games. As well, partnerships with 11 new airlines were established, bringing the total to 22.
DID YOU KNOW?
The CFIA launched the Invasive Alien Species web portal to increase Canadians' awareness of the threat of invasive species and to help inform them of the Government of Canada's role in prevention and control.
Lessons Learned
- In the past few years, Canada has seen an increase in reported cases of invasive alien species such as the emerald ash borer. Losses to agriculture and forestry caused by invasive species in Canada have been estimated at $7.5 billion annually. This figure is expected to grow in the next several years. A major contributor to this increase is moving firewood, which creates a primary pathway for spreading invasive species. Moving firewood even a few kilometres away can have devastating effects on our forests by spreading invasive insects and diseases.
- As such, the Agency's Don't Move Firewood campaign underscores the importance of informing and involving Canadians in the fight against invasive species. Nearly one-third of Canadians are now aware of this message. Key to the campaign's success has been the Agency's collaborative approach with various levels of government and private industry. Outreach efforts included greater presence at exhibits across Canada (cottage shows and agricultural fairs), increased advertising on roadside billboards and in the Ontario Parks Guide, and improved distribution of brochures at campgrounds.
2.2.3 Strategic Outcome 3: Contributes to consumer protection and market access based on the application of science and standards

The CFIA's programming contributes to securing the conditions needed for consumer protection (as it relates to food and certain agricultural products) and for a prosperous Canadian agri-food sector that is able to access domestic and global markets. The Agency aims to verify that information provided to Canadian consumers through labels and advertising is truthful and not misleading. The CFIA also works to facilitate continued and new market access for Canadian agriculture, fishery, forestry, and food products by verifying that Canadian products meet domestic regulations and international standards, and by representing Canada's interests in international fora through the provision of technical support and in negotiating technical agreements and standards. In carrying out activities toward the achievement of this strategic outcome, the CFIA focused its efforts on the following priorities:
- Improving inspection and surveillance approaches; and
- Modernizing the Agency's regulatory framework and tools.
Work under the program activities Integrated Regulatory Frameworks and Domestic and International Market Access is primarily aimed at addressing the Program Framework and Partnership risk areas, it also benefits the other key risk areas noted above.
Percentage of 2009–10 Actual Spending: Strategic Outcome 3
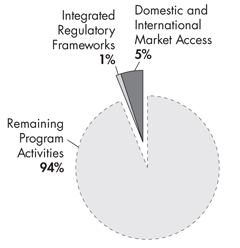
Integrated Regulatory Frameworks
Benefits for Canadians
The CFIA contributes to the development, maintenance and effective implementation of strong national and international regulatory frameworks. These frameworks are critical to a safe and sustainable food supply, to an animal and plant resource base for Canadian consumers and food industries, and to prosperous food and agricultural industries.
Performance Summary
The following table identifies the CFIA's expected result, performance indicators and targets for the Integrated Regulated Frameworks program activity, and reports 2009−10 performance against these expectations. For more detailed information, including results from previous reporting periods, refer to Summary of Performance Indicators in Section 3.3.1. Where applicable, performance indicator results have been rounded down to the nearest percentage point.
Table 2–7: Summary of Performance: Integrated Regulatory Frameworks
| Expected Result: The CFIA's regulatory framework provides the greatest net benefit for Canadians as it is based on scientific approaches and takes into account international contributions and stakeholders' interests | |||||
| 2009-10 Financial Resources ($ millions) |
2009-10 Human Resources (FTEs) |
||||
|---|---|---|---|---|---|
| Planned Spending |
Total Authorities |
Actual Spending |
Planned | Actual | Difference |
| 14.2 | 14.2 | 10.7 | 207 | 47 | 160 |
| Variance Analysis | |||||
| The Variance between Total Authorities and Actual Spending relates to lapsing funds in some of the Agency's initiatives and internal reallocations. The Variance analysis between Planned and Actual FTEs is not provided because the Planned figure does not consider reallocations of FTEs between program activities. If the Planned figure was restated for this, it would be 66 compared to Actual FTEs of 47, resulting in a difference of 19. This variance relates to lapsing funds in some of the Agency's initiatives. | |||||
| Performance Indicators* |
Targets | Performance Status |
|
|---|---|---|---|
|
Percentage of regulatory initiatives that meet publication requirements for either the Canada Gazette, Part I or Part II34 |
≥95% of regulatory initiatives that meet publication requirements |
77% | Not Met |
|
Performance Analysis:
Three-year Trend Analysis: (2008–09, 100%) |
|||
| Performance Indicators* |
Targets | Performance Status |
|
|---|---|---|---|
|
Extent to which the net quantity, composition, labelling and advertising of non-registered food products inspected is accurate35. |
70% of products, labels, and advertisements inspected are accurately represented. |
82% | Met |
|
Performance Analysis: Three-year Trend Analysis: (2008–09, 82%) |
|||
| Additional information: Paperwork Burden Reduction Initiative official site (Industry Canada): http://www.reducingpaperburden.gc.ca/epic/site/pbri-iafp.nsf/en/h_sx00001e.html Fair Labelling Practices: http://www.inspection.gc.ca/english/fssa/labeti/labetie.shtml Seeds: http://www.inspection.gc.ca/english/plaveg/seesem/seeseme.shtml Fertilizer: http://www.inspection.gc.ca/english/plaveg/fereng/ferenge.shtml |
|||
* For more information on data controls and data limitations regarding CFIA's performance indicators, please see Table 2-1.
In addition to the detailed performance results found in Table 2-7, the CFIA also achieved strategic performance results under the Integrated Regulatory Frameworks PA:
Strategic Performance Analysis
The CFIA worked with stakeholders to address and provide guidance on priority regulatory areas of interest to Canadians, and undertook the following in 2009–10:
- Continued to provide effective and sound compliance and enforcement services through its Enforcement and Investigation Services (EIS). The CFIA continued to provide core national regulatory enforcement training courses to enhance its inspection staff's and EIS investigation specialists' capacity to effectively deliver the Agency's regulatory mandate. The core training consists of foundations of inspection and regulation, note-taking, search warrants and tactical communications.
- Announced amendments to the Seeds Regulations in July 2009, following an extensive consultation period with stakeholders. The amendments will create a more flexible variety registration system with reduced regulation, while continuing to maintain the integrity of seed certification and environmental, food and feed safety. This flexible system should stimulate innovation in the seed industry and provide producers with more choice—thereby supporting the long-term growth of the seed sector.
REGULATIONS FOR ORGANIC PRODUCTS
In response to requests by the organic sector and consumers to develop a regulated system for organic agricultural products, the CFIA developed the Organic Products Regulations, which came into effect in June 2009. These regulations define specific requirements for organic products to be labelled as organic or that bear the organic agricultural product logo.
The CFIA continued to strengthen its regulatory base to enhance consumer protection in the area of food safety. For instance, the Agency undertook the following:
- Continued work on bilingual labelling, including identification of health and safety criteria for feed product labels, which ensures that manufacturers' conditions are met. These improvements will ensure that consumers are provided with health and safety-related information in both official languages on product labels.
- Continued work for the timely renewal and modernization of its legislative framework. The CFIA continues to develop a strategy to modernize its legislative framework in light of the changing needs of industry to protect the safety of the food supply for Canadians.
Lessons Learned
- The food safety environment has evolved dramatically in recent decades with an increasingly global food supply, technological developments, the aging population, and the evolution in consumer demands. Ensuring that the Canadian legislative framework for food safety continues to meet the challenges stemming from this ongoing evolution is critically important. At the same time, the framework needs to be efficient and effective for both industry and government.
- To address these issues, CFIA is working with Health Canada to develop a strategy to modernize and simplify its statutes. Once completed, Canadians and industry will be better supported into the future with a framework that will continue Canada's recognition as a leader in safe food.
Domestic and International Market Access
Benefits for Canadians
Maintaining domestic and international market access for Canadian products is critical to the sustainability of the agriculture, fishery, forestry and food industry and the economic prosperity of Canada. To support Canada's economic growth, the CFIA plays an ongoing role in the international arena to maintain and facilitate the opening of new markets to Canadian products by:
- Negotiating import and export conditions in a complex international environment; and
- Demonstrating the integrity of Canada's food, plant and animal regulatory system to Canadians and our trading partners.
Performance Summary
The following table identifies the CFIA's expected result, performance indicators and targets for the Domestic and International Market Access program activity, and reports 2009–10 performance against these expectations. For more detailed information, including results from previous reporting periods, refer to the Summary of Performance Indicators in Section 3.3.1. Where applicable, performance indicator results have been rounded down to the nearest percentage point.
Table 2–8: Summary of Performance: Domestic and International Market Access
| Expected Result: Canadian producers of food, plants, animals and related products operate within a fair and efficient marketplace, from which Canadian consumers benefit | |||||
| 2009-10 Financial Resources ($ millions) |
2009-10 Human Resources (FTEs) |
||||
|---|---|---|---|---|---|
| Planned Spending |
Total Authorities |
Actual Spending |
Planned | Actual | Difference |
| 24.6 | 36.1 | 32.4 | 424 | 521 | (97) |
| Variance Analysis | |||||
| The Variance between Planned Spending and Total Authorities is mainly due to funding received for the Pork Industry Recovery and Expansion Strategy and for the Growing Forward Program Suite. The Variance between Total Authorities and Actual Spending relates to lapsing funds in some of the Agency's initiatives and internal reallocations. The Variance analysis between Planned and Actual FTEs is not provided because the Planned figure does not consider reallocations of FTEs between program activities. If the Planned figure was restated for this, it would be 519 compared to Actual FTEs of 521, resulting in a difference of 2. | |||||
| Performance Indicators* |
Targets | Performance Status |
||
|---|---|---|---|---|
|
Extent to which certified food, animal and plant shipments meet the receiving country's import requirements |
≥ 99% meet requirements |
Food - Meat | 99% | Met |
| Food - Fish and Seafood | 99% | Met | ||
| Food - Processed Egg | 99% | Met | ||
| Animal | No data available | |||
| Plant | 99% | Met | ||
|
Performance Analysis: Three-year Trend Analysis: Animal:(2007–08, No Data Available; 2008–09, No Data Available) |
||||
|
Additional information: |
||||
* For more information on data controls and data limitations regarding CFIA's performance indicators, please see Table 2-1.
In addition to the detailed performance results found in Table 2-8, the CFIA also achieved strategic performance results under the Domestic and International Market Access PA:
Strategic Performance Analysis
The CFIA worked with existing and new trading partners to facilitate market access opportunities and to address unexpected market access issues.
- In 2009, traces of genetically modified flax were found in Canadian flax shipments to the European Union (EU)—leading to trade disruptions for Canadian flax exports, which account for 80% of world exports. In response, the CFIA and its Agriculture and Agri-Food Portfolio partners (Canadian Grain Commission and AAFC) worked with the flax industry, Foreign Affairs and International Trade Canada and international counterparts to secure continued market access to the EU for Canadian flax. In particular, the CFIA contributed scientific expertise and advice to the resultant rapid response management strategy and to the validation of seed testing protocols.
MAINTAINING CANADA'S EXPORTS
The CFIA will continue to support AAFC's Market Access Secretariat, in Government of Canada contributions to reopening or gaining new markets. This ongoing support, in turn, helps to strengthen Canada's economy.
The CFIA continued to work with international organizations to promote and influence the development and implementation of coherent and consistent international standards.
- The CFIA provided technical knowledge for a number of trade negotiations and worked with foreign counterparts on technical agreements to take advantage of expanded market opportunities. To support the CFIA's ongoing trade negotiations, the Agency established a chief technical negotiator.
- Canadian delegations continued to promote the adoption of risk-based Codex international standards. For instance, the CFIA played a significant role in promoting the adoption of MRLs for Melamine in Food and Feed, and of the microbiological criteria for Listeria monocytogenes in ready-to-eat foods by contributing scientific knowledge and research results supporting the adoption of these Codex standards.
The CFIA worked toward implementing technical solutions to facilitate compliance with import and export regulatory requirements.
- The CFIA continued advancing its Paper Burden Reduction Initiative. Under this initiative is the E-Certification project, which aims to improve the security of export documentation, minimize fraudulent activities and reduce the time of issuing import/export certificates. In 2009–10, the CFIA launched the implementation of the meat module “Read Import Countries Requirements,” which allows meat inspectors direct, online access to the importing country's requirement—thereby removing the burden of hard copy manuals. The CFIA also conducted a review to examine the possibility of consolidating the three existing E-Certification projects (Meat, Plant Health and Terrestrial Animal Health) into one E-Certification initiative. The review considered the business scope, architecture, design and risks. This consolidation moves the CFIA toward better horizontal planning while providing the opportunity to leverage best practices between individual programs, increase consistency, provide better return on future investments, and support the Agency in keeping up with an ever-changing and competitive environment.
Lessons Learned
- A need to improve the security of export documentation, minimize fraudulent activities and reduce the time of issuing import/export certificates was realized by the CFIA. To address this, the Agency has been considering a horizontal approach to the E-Certification suite of products and continues to work toward establishing a secure external service delivery channel using the new GoC Access Key solution. The CFIA is also conducting an architectural review of the internal infrastructure required to support this service. More concise instructions and requirements will allow for more user-friendly access for all business-driven users.
2.2.4 Internal Services
Internal services are groups of related activities and resources that are administered to support the needs of programs and other corporate obligations of an organization. These groups include Management and Oversight Services, Communications Services, Legal Services, Human Resources Management Services, Financial Management Services, IM/IT Services, Real Property Services, Security Management Services, Environmental Management Services, Materiel Management Services, Procurement Services, and Travel and Other Administrative Services.
Percentage of 2009–10 Actual Spending: Internal Services
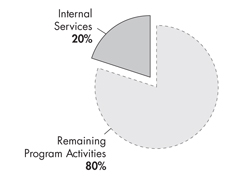
Benefits for Canadians
The CFIA delivers projects in a more disciplined manner, thereby contributing to prudent stewardship of financial resources and providing Canadians value for their tax dollar. Internal Services refer to groups of related activities and resources that are administered to support the needs of programs and other corporate obligations of an organization.
Work under this program activity is aimed at addressing Human Resources, Information Decision Making and Internal Coordination risk areas.
Performance Summary Table 2-9: Summary of Performance: Internal Services36
| 2009-10 Financial Resources ($ millions) |
2009-10 Human Resources (FTEs) |
||||
|---|---|---|---|---|---|
| Planned Spending |
Total Authorities |
Actual Spending |
Planned | Actual | Difference |
| 108.3 | 142.5 | 141.9 | 832 | 1,021 | (189) |
| Variance Analysis | |||||
| The Variance between Planned Spending and Total Authorities is mainly due to funding received for the Government Response to Listeriosis and the Growing Forward Program Suite, as well as collective bargaining and the 2008–09 carry-forward.37 The Variance analysis between Planned and Actual FTEs is not provided because the Planned figure does not consider reallocations of FTEs between program activities. If the Planned figure was restated for this, it would be 1,017 compared to Actual FTEs of 1,021, resulting in a difference of 4. | |||||
In addition to Table 2-9, the CFIA also achieved the following strategic initiatives under Internal Services:
Strategic Performance Analysis
The CFIA continued to strengthen its internal management processes and systems.
- The CFIA continued to develop and implement key IM/IT initiatives in support of business development and enhancement activities. One such example was the implementation of a data centre that houses mission-critical computer systems and associated components and that is a central repository for the storage, management and sharing of data and information. This data centre includes the first large-scale adoption of InterNetworking Voice and Data Solution in the GoC.
- The CFIA continued to progress on all public service renewal commitments that respond to challenges related to planning, engagement, recruitment, building capacity, and providing supportive human resource management architecture. Accomplishments include a more integrated, inclusive and horizontal approach to planning; participation in 20 career fairs; and the development of a training and multi-year rollout plan to support meat processing inspectors that will outline the training needed to support inspection staff in all commodities before they begin performing their duties. The CFIA will continue to advance the initiatives relating to the Agency's renewal plan for 2008–13.
- As part of its long-term process to improve overall performance measurement and reporting, the CFIA continued the development of its Performance Management and Reporting Solution (PMRS), with the objective of delivering timely program management and high-level performance information that is easily accessible, robust, reliable and well-substantiated. This project aims to create an Agency-wide management tool that provides effective performance feedback to allow better reporting and to enhance performance monitoring and reporting at all levels. When fully operational, the PMRS will facilitate the production of various corporate reports.
- The CFIA's Values and Ethics Strategy is one of the most comprehensive strategies within the GoC. Its design ensures that the Agency's values are embedded in the organization and helps foster an ethically sound and vibrant culture that reflects Public Service and Agency Values and Ethics. To that end, the Agency continued the development of a comprehensive Values and Ethics training program/strategy that included an updated on-line training module, an orientation program and leadership development courses.
DID YOU KNOW?
The CFIA was selected as one of the National Capital Region's Top 25 Employers, further branding the Agency as an employer of choice.
The CFIA focused on developing key plans for the future and improving critical areas of infrastructure.
- The federal government committed approximately $24 million over two years (2009–10 to 2010–11) to help modernize the CFIA’s laboratories so that scientists and researchers can continue to work in safe, modern facilities and continue contributing to the health and safety of Canadians. The CFIA has planned to deliver 13 initiatives comprising 30 projects in six provinces and seven laboratories. In 2009–10, the CFIA completed nine projects as planned at the following laboratories: Burnaby, Calgary, Dartmouth, Lethbridge, Ottawa and St-Hyacinthe.38
- As per the new TBS policy on investment planning, the CFIA updated the Investment Planning Implementation Project (IPIP), including approval of the project charter and the dedication of its resources. Through the IPIP, the CFIA evaluated governance, planning, processes and tools for investment planning to strategically integrate and prioritize plans related to assets and acquired services. The CFIA also began the process to establish an Enterprise Project Management Office and will prepare a draft Enterprise Project Management Framework including processes, standards and templates.
| 2009-10 ($ millions) |
|||
|---|---|---|---|
| Planned Spending |
Total Authorities39 | Actual Spending |
|
| 0 | 9.8 | 8.0 | |
| Expected Results | Performance Indicators | Targets | Performance Status |
|
Deferred maintenance at seven laboratories (over 2 years) is addressed to modernize equipment and improve safety standards |
Percentage of projects completed on time |
100% | 100% |
|
Percentage of CEAP funds spent |
100% | 82%* | |
* The 82% variance for the percentage of CEAP funds spent was due to the current construction industry climate in Canada. This industry is demonstrating significant uncertainty regarding potential bid prices and competitiveness. Projects that are very similar in scope and technical complexity but carried out in different regions of Canada are showing marked differences in bid prices. The result of these economic and industry factors is that many traditional assumptions applied to project estimates are no longer valid—resulting in large variances in bids to estimates. In the case of the 2009–10 EAP projects, this resulted in a net 18% surplus.
Lessons Learned
- Based on the internal post-mortem of Management Accountability Framework (MAF) Round VII, and in keeping with TBS guidance, the CFIA improved its tracking of progress toward addressing recommendations made under the MAF exercise through enhancements to its Action Plan—a tool used to track progress in all areas of management.
- The enhancements to the MAF Action Plan will contribute to better performance measurement for all areas of management, including Internal Services. This Action Plan requires regular updates and advising senior management of issues. The improvements provide for better horizontal analysis across areas of management, deliver more detailed best practices and identify areas of focus regarding management activities.
Section III – Supplementary Information
3.1 Financial Information
3.1.1 Financial Highlights
The financial highlights presented within the Agency's Performance Report are intended to serve as a general overview of the CFIA's financial position and operations. Financial statements are prepared in accordance with accrual accounting principles, Treasury Board accounting policies and year-end instructions issued by the Office of the Comptroller General which are consistent with Canadian generally accepted accounting principles for the public sector as required under Section 31 of the Canadian Food Inspection Agency Act. The Agency has been audited since its creation and has always received an unqualified opinion.
| Condensed Statement of Financial Position As at March 31 |
% Change | 2010 | 2009 |
|---|---|---|---|
| Assets | |||
| Total Assets | 3.90% | 284,961 | 274,269 |
| Total | 3.90% | 284,961 | 274,269 |
| Liabilities | |||
| Total Liabilities | (12.09%) | 199,515 | 226,956 |
| Equity | |||
| Total Equity | 80.60% | 85,446 | 47,313 |
| Total | 3.90% | 284,961 | 274,269 |
| Condensed Statement of Operations Year ended March 31 |
% Change | 2010 | 2009 |
|---|---|---|---|
| EXPENSES | |||
| Total Expenses | 0.35% | 808,476 | 805,691 |
| REVENUES | |||
| Total Revenues | 2.66% | 55,743 | 54,299 |
| Net Cost of Operations | 0.18% | 752,733 | 751,392 |
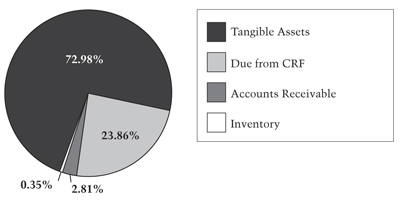
Total assets at the end of 2009–2010 were $285 million, an increase of $11 million (4%) over previous year's total assets of $274 million. The $11 million increase in total assets was caused by a $6 million increase in financial assets from major acquisitions that included the Burbaby laboratory consolidation ($4.4 million). The amount of Due from Consolidated Revenue Fund (CRF) also increased by 4 million from last year, which is in line with the increase in payables at year end. Tangible assets represented the largest portion of total assets, at $208 million (73%) of total assets, while Due from CRF represented 24% at $68 million. Accounts receivable only represented 3%, followed by inventory which represented less than 1% of total assets
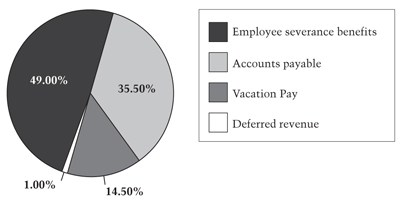
Total liabilities at the end of 2009–2010 were $200 million, a decrease of $27 million (12%) over the previous year's total liabilities of $227 million. The $27 million decrease is explained by the removal of the allowance for expired collective agreements of $14 million, the removal of the allowance for contingent liability of $9 millions, a reduction of $10 million in employee severance benefits in 2010 due to the reduction in the Treasury Board employee base rate, and offset by an increase of 6 millions in accounts payables at year end. Employee severance benefits represented 49% of total liabilities, at $98 million, followed by the accounts payable which represented 36% of total liabilities, at $71 million. Vacation pay represented $29 million (15%), while deferred revenue only represented 1% of total liabilities
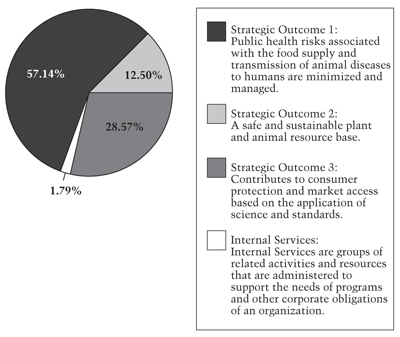
The Agency's total revenues amounted to $56 million for 2009–2010. Revenues for 2009–2010 remained fairly constant with the revenues earned in 2008-2009 with a slight increase of $2 million (3%) from the previous year. More than half of the revenue was derived from the Strategic Outcome 1. Strategic Outcome 3 represented 29% of all revenues ($16 million), where 13% ($7 million) were derived from Strategic Outcome 2. Less than 2% of all revenues were from Internal Services.
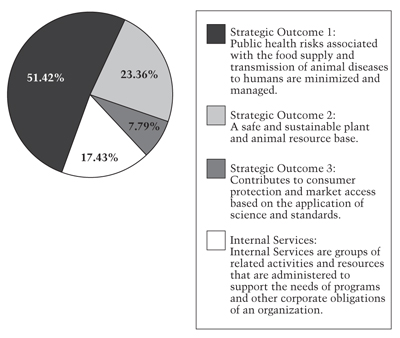
The total expenses for CFIA were $808 million in 2009–2010, a small increase of $3 million (less than 1%) compare to last year. Note that CFIA increase in budgetary expenses for 2010 was for the most part offset by reductions in accrual expenses. The majority of the expenses, $416 million (51%), were under Strategic Outcome 1. Strategic Outcome 2 represented $189 million (24%) of total expenses, while Internal Services expenses represented $141 million (17%) of total expenses. Approximately 8% of all expenses were derived from Strategic Outcome 3.
3.1.2 Auditor General's Audit Opinion on Financial Statements and Audited Financial Statements
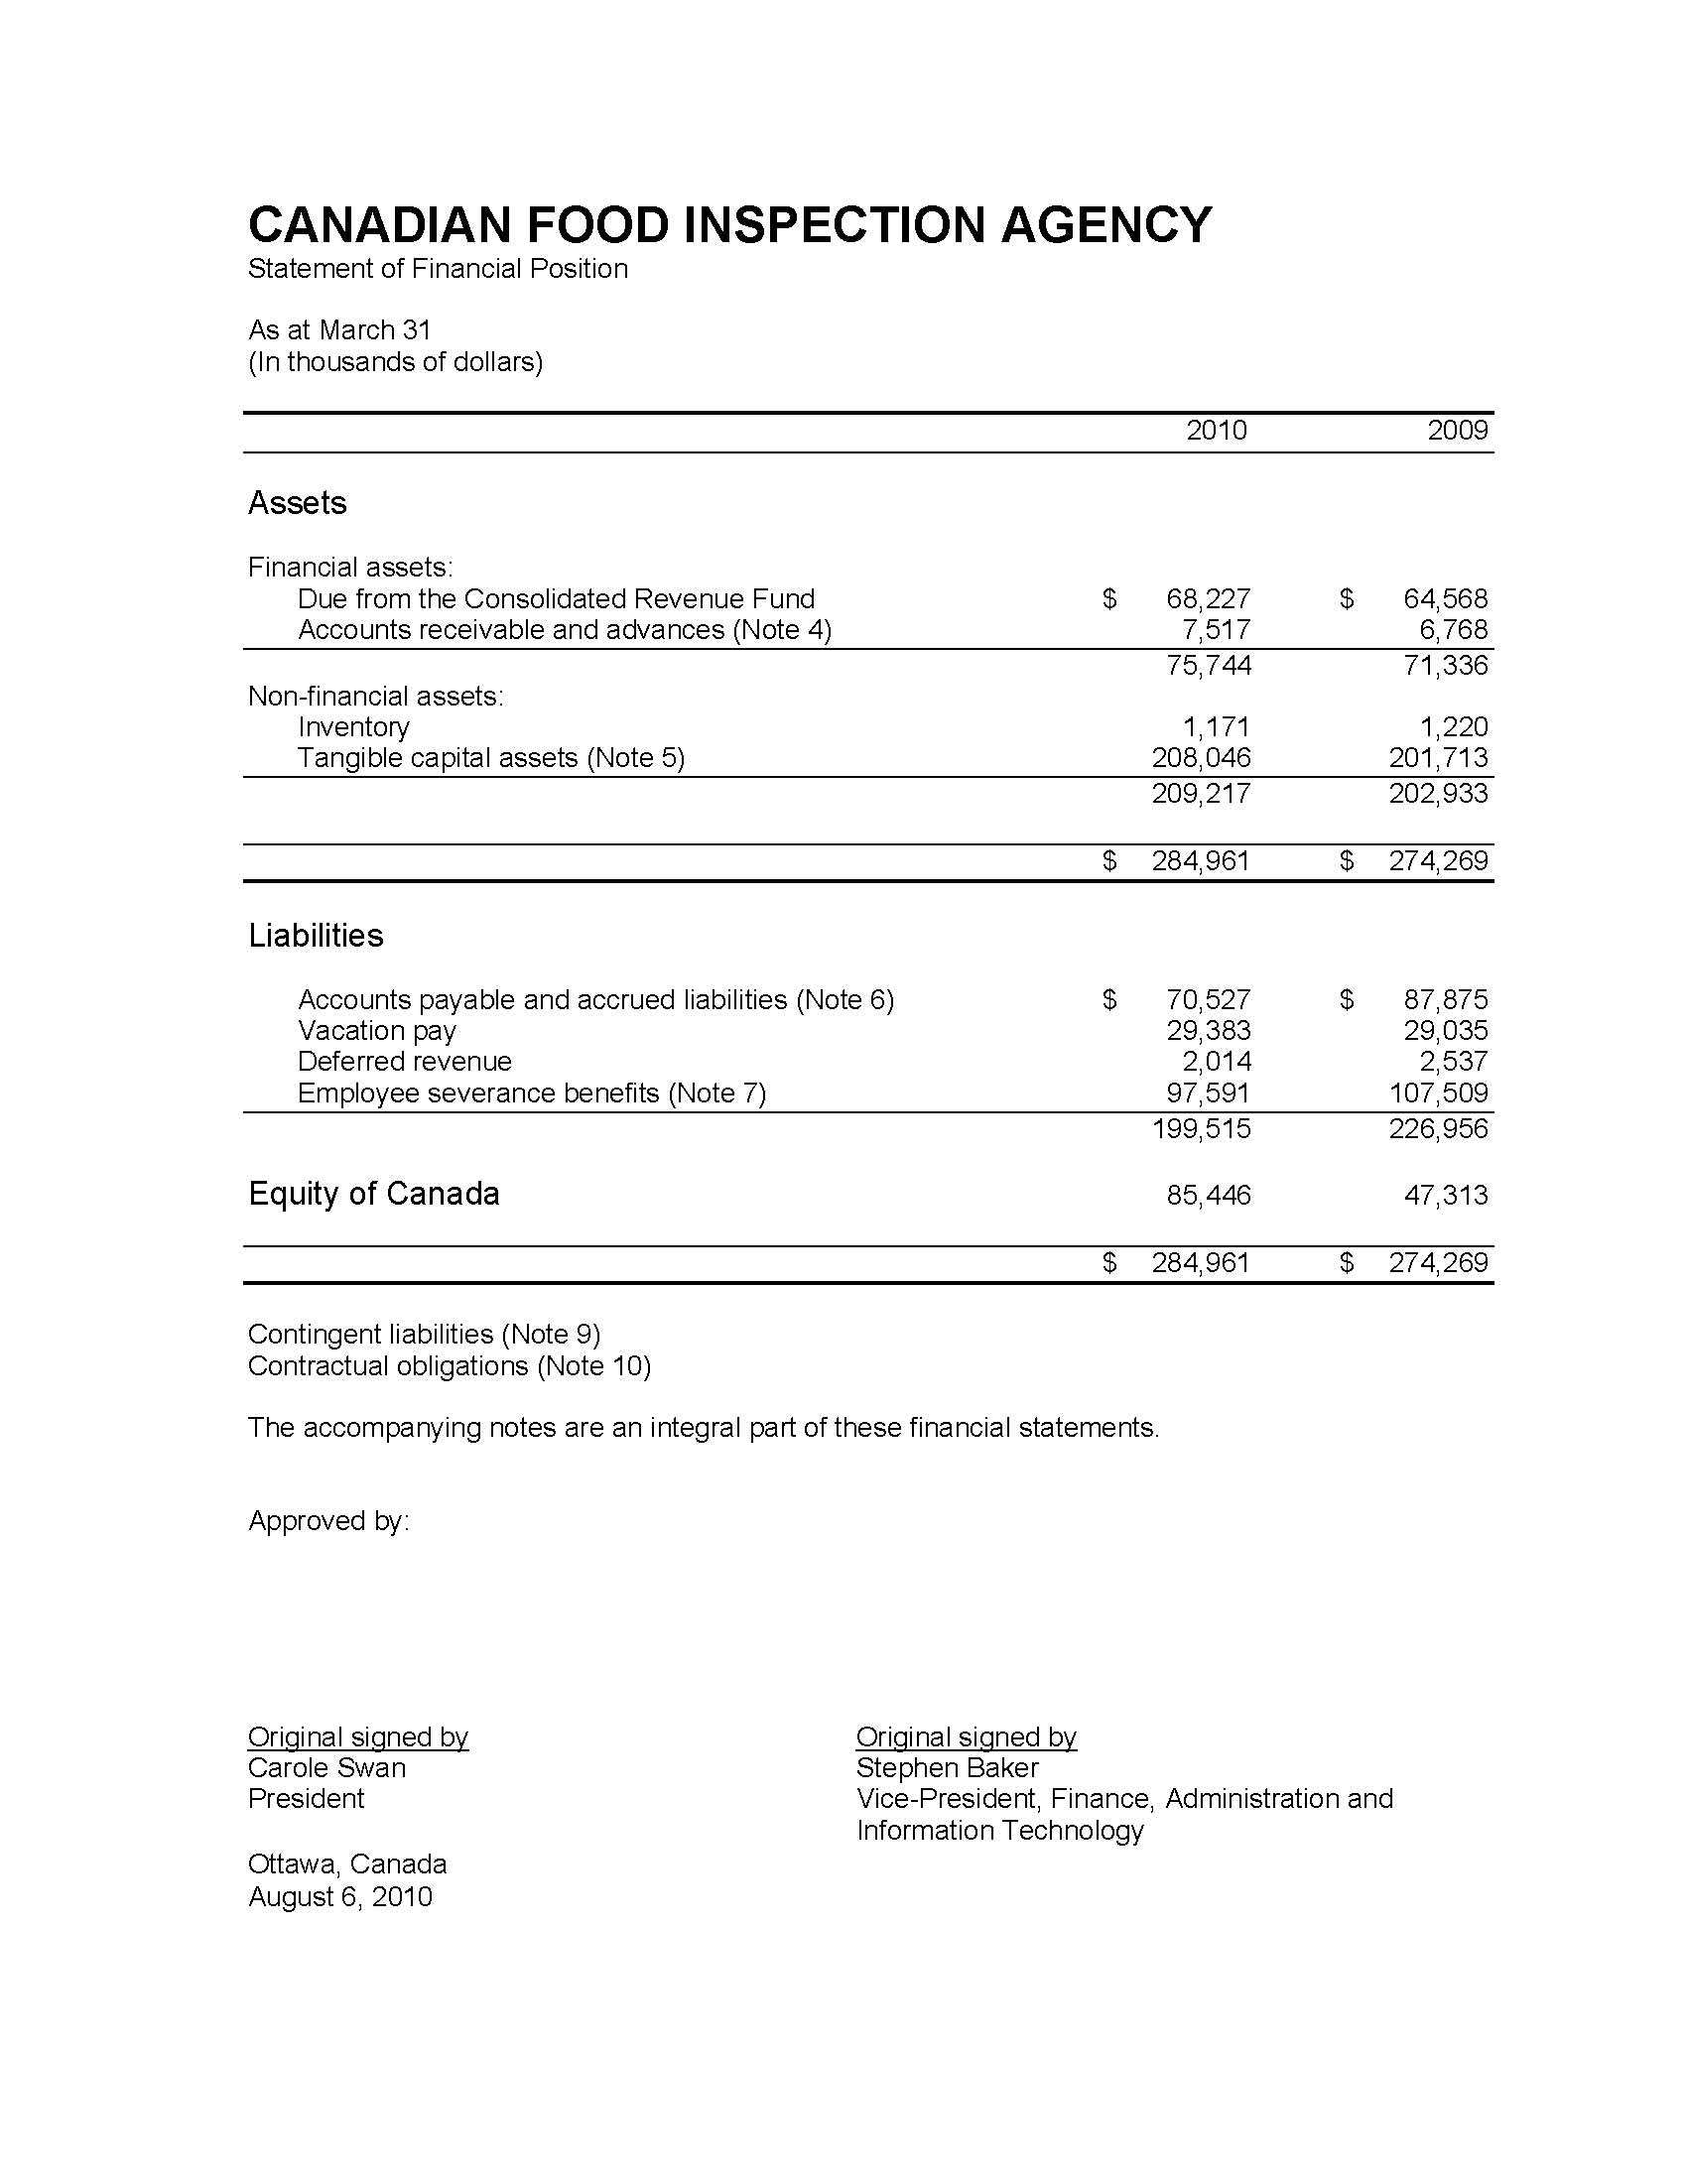
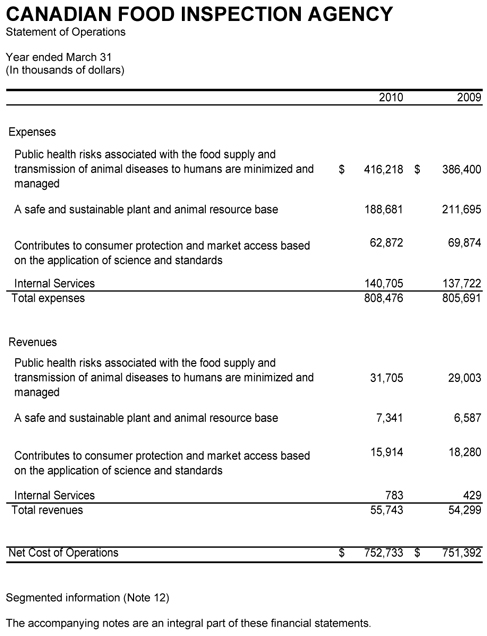
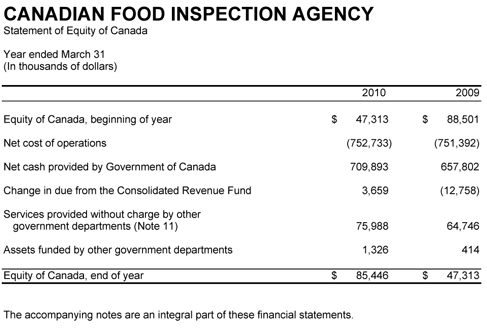
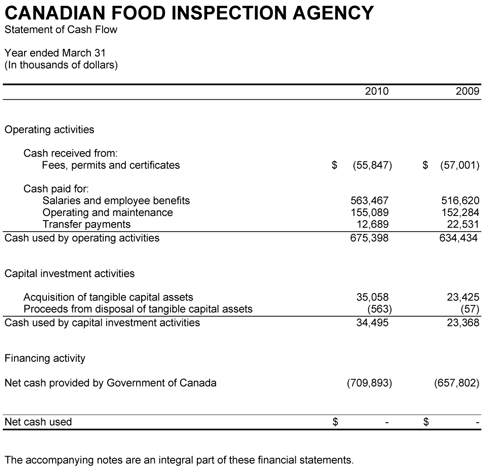
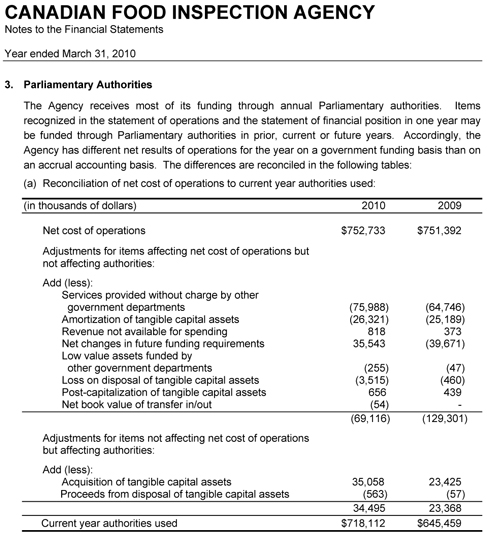
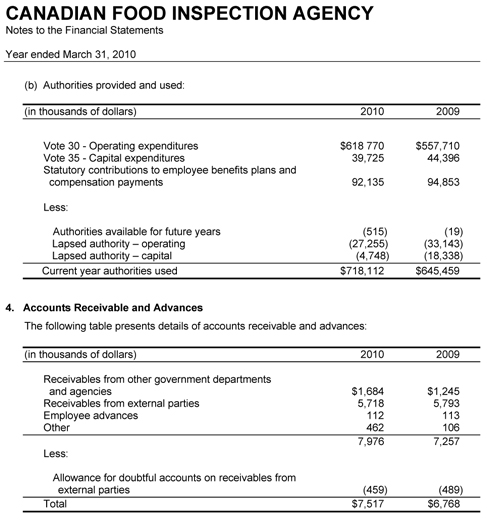
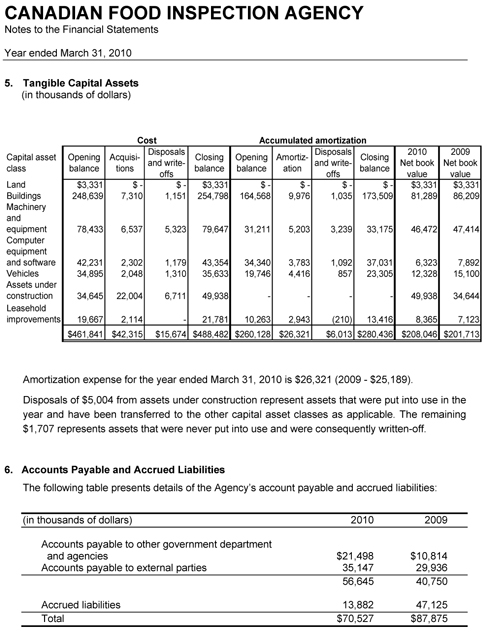
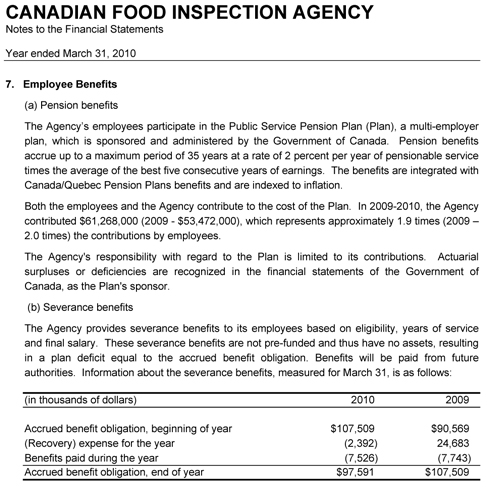
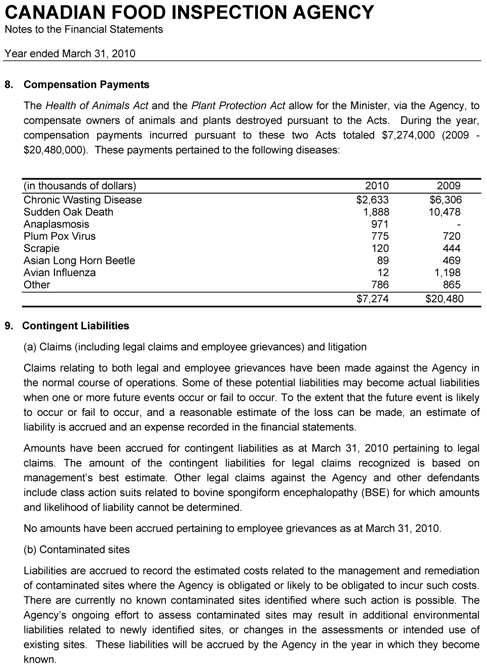
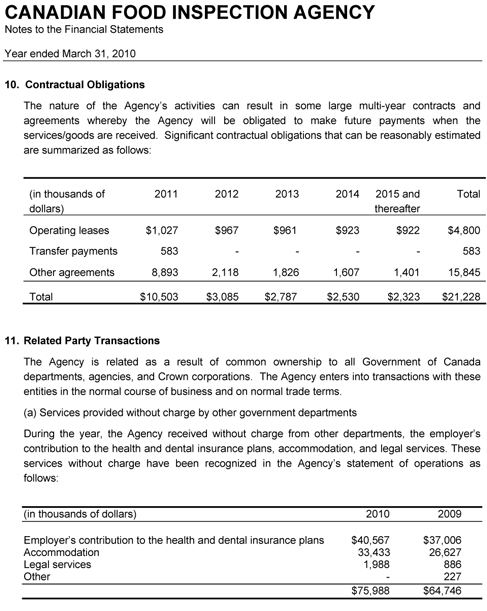
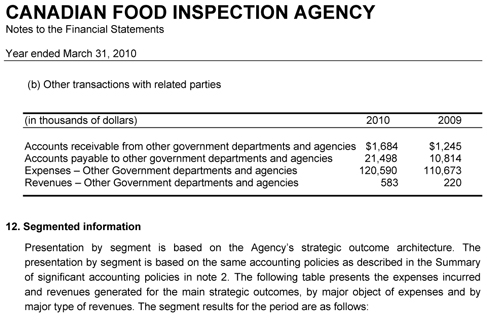
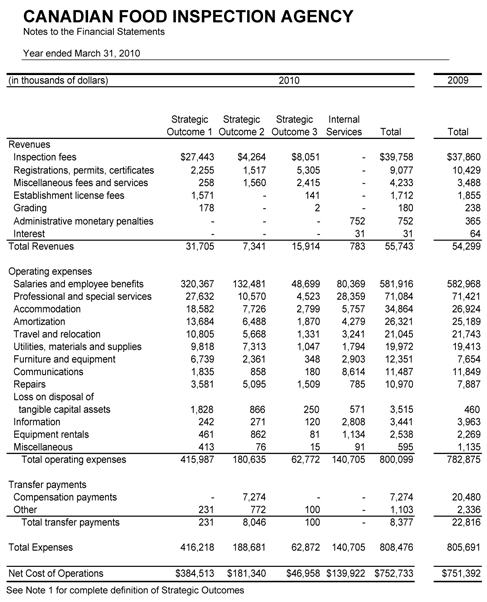
3.2 List of Supplementary Information Tables
- Sources of Respendable and Non-Respendable Revenue
- Sources of Respendable Revenue
- Sources of Non-Respendable Revenue
- 2009-10 User Fee Reporting - User Fees Act
- Table A: User Fee
- Table B: External Fee
- Status Report on Projects operating with specific Treasury Board Approval
- Details on Transfer Payment Programs (TPPs)
- Horizontal Initiatives
- Table A: Bovine Spongiform Encephalopathy
- Table B: National Aquatic Animal Health Program
- Table C: Listeria
- Green Procurement
- Response to Parliamentary Committees and External Audits
- Internal Audits and Evaluations
- Table A: Audits
- Table B: Evaluations
All electronic supplementary information tables listed in the 2009-10 Departmental Performance Report can be found on the Treasury Board of Canada Secretariat's website at
http://www .tbs-sct.gc.ca/dpr-rmr/st-ts-eng.asp
3.3 Other Items of Interest
- 3.3.1 Summary of Performance Indicators
- 3.3.2 Performance Indicators by Operational Priority
- 3.3.3 Further Information on the Assessment of Compliance
1 This number also includes active, leave without pay, paid leave, and suspended employees.
2 Strategic outcome: Long-term and enduring benefit to Canadians that stems from the Agency's vision and mission. It represents the difference the Agency intends to make for Canadians.
3 Full-Time Equivalent (FTE): A measure of human resource consumption. It calculates the number of assigned hours of work over the total hours of regularly scheduled work (37.5 hours per week over 12 months). For example, an employee who works half-time (18.75 hours per week) over a 12-month period is equivalent to a 0.5 FTE.
4 This includes active, on leave without pay, on paid leave, and suspended employees.
5 For detailed performance information on CFIA, CEAP Projects, please refer to Section 2.2.4 Internal Services.
6 The performance summaries in Tables 1-1, 1-2 and 1-3 represent performance at the Program Activity levels.
7 For more information on Government of Canada outcome areas, please refer to www.tbs-sct.gc.ca/ppg-cpr/framework-cadre-eng.aspx?Rt=1039
8 Zoonotic diseases are diseases transmissible from animals to humans.
9 Risk areas have been derived from the CFIA's Corporate Risk Profile (CRP). For more information on the CRP and its risk areas, please refer to Section 1.5.
10 In 2009–10 the Fish and Seafood sub-indicator calculation was changed to harmonize with other sub-indicators by calculating compliance by the number of establishments versus the number of inspections.
11 Monitoring approach: Establishments are inspected, sampled and tested in such a way that the resulting compliance rates are representative of the CFIA-regulated population. Monitoring programs provide an adequate overview of industry compliance in general.
12 In 2009–10 the Fish and Seafood sub-indicator calculation was changed to harmonize with other sub-indicators by adding import inspection data to the compliance calculation. Reports also include data that is processed manually or using stand alone tools.
13 Monitoring approach: products are inspected, sampled and tested in such a way that the resulting compliance rates are representative of the CFIA-regulated population. Monitoring programs provide an adequate overview of compliance in the industry in general.
14 Targeted approach: In cases where monitoring has identified specific compliance problems, the CFIA takes a targeted approach to inspections, sampling and testing by focusing on the problem area and areas of highest risk. Non-compliant establishments or products are often sought out for the targeted approach to better define problem areas and reasons for non-compliance. For this reason, compliance rates of targeted programs are typically lower. Improved compliance is promoted through enforcement actions.
15 Investigative approach: Compliance is assessed for the purposes of prosecution for non-compliance. Investigations involve gathering evidence and information from a variety of sources considered relevant to a suspected violation or offence.
16 Wording of this indicator changed in 2009–10 to reflect that the indicator only measures non–federally registered food products.
17 For more information visit: http://www.inspection.gc.ca/english/fssa/proge.shtml
18 The expected result was changed from “Risks of the transmission of federally controlled zoonotic diseases to humans are successfully managed” to simplify the wording and clarify the desired outcome.
19 In the 2009–10 RPP, the indicator was changed to “Number of Canadians who become infected with federally controlled zoonotic diseases by direct contact with animals or their products.” Because this falls outside the CFIA's jurisdiction, the Agency reverted back to the wording used for the 2008–09 DPR—“Number of incidents of avian influenza that expand beyond the initial control zone” .
20 This indicator reflects only foreign animal diseases. The CFIA also conducts a wide variety of activities with regard to animal diseases already established in Canada. Performance measures to illustrate performance in this regard will be developed and reported on in future years.
21 Major deviations with respect to the enhanced feed ban could include evidence of cross-contamination of ruminant feed with prohibited material, the unavailability of written procedures and required records, and labeling violations. Major deviations with respect to the Feeds Regulations could include evidence of cross-contamination with medications, the unavailability of required records and labeling violations.
22 The indicator has been revised from the 2009–2010 RPP to clarify that the CFIA investigates new plant diseases and pests, not just new foreign regulated plant diseases and pests.
23 CFIA's detailed action plan can be found at: www2.parl.gc.ca/Content/HOC/Committee/402/PACP/WebDoc/WD4020496/Action_Plans/06-Canadian%20Food%20Inspection%20Agency-e.htm
24 Report on the internal evaluation of Invasive Alien Species can be found at: www.inspection.gc.ca/english/agen/eval/invenv/invenve.shtml
25 GoC Response to SCAAF Report at Parliamentary can be found at: www2.parl.gc.ca/HousePublications/Publication.aspx?DocId=4096914&Language=E&Mode=1&Parl=40&Ses=2
26 USA–CANADA Guideline announcement can be found at: www.inspection.gc.ca/english/corpaffr/newcom/2009/20090604be.shtml
27 Tomato leafminer moth can be found at: www.inspection.gc.ca/english/plaveg/pestrava/tutabs/20100226inde.shtml
www.inspection.gc.ca/english/plaveg/pestrava/tutabs/tutabse.shtml
28 False codling moth can be found at: www.inspection.gc.ca/english/plaveg/hort/20091023inde.shtml www.inspection.gc.ca/english/plaveg/protect/dir/peptoe.shtml
29 The performance indicator measuring the CFIA's management of invasive species and other pests is listed under the Plant Health Risks and Production Systems program activity.
30 The expected result “Potential new invasive plants and plant pests have been identified and their entry by known pathways is regulated” was removed because the same performance measurement is captured under the Plant Health Risk and Production Systems.
31 The performance indicators for this program activity were set in the 2009–10 RPP, but no targets were specified. The targets for the Plants with Novel Traits and Novel Fertilizer sub-indicators have been brought forward from the 2008–09 Performance Report.
32 The wording of this indicator changed from the 2009–10 RPP from the following: Extent to which authorized novel products, having undergone an environmental assessment, comply with CFIA requirements and standards outlined in the authorization. This indicator now measures compliance-by-inspection versus compliance-by-products to provide a common measure of performance across plant, feed, fertilizer and veterinary biologics areas.
33 As performance indicators for this program activity were not set in the 2009–10 RPP, there were also no targets specified. The targets for the Plants with Novel Traits and Novel Fertilizer sub-indicators have been brought forward from the 2008–2009 Performance Report.
34 The wording of this indicator changed from the 2009–10 RPP from the following: The proportion of regulatory initiatives that are prepublished in the Canada Gazette, Part I, prior to publication in the Canada Gazette, Part II. The methodology was also changed in 2009–10 to support the new wording of this indicator.
35 The wording of this indicator changed from the 2009–10 RPP from the following: “Extent to which the net quantity, composition, labeling and advertising of food products inspected is accurate” to specify that it applies to only non-registered food products.
36 This is the first year Internal Services is formally reported as a distinct Program Activity, as such performance indicators have not yet been developed. To ensure uniformity, performance measures to be used across the GoC will be provided by TBS.
37 Internal Services was displayed separately from other program activities for the first time in 2009–10, affecting the comparability of spending and FTE information by program activity.
38 For more details on CFIA's projects in Canada Economic Action Plan please see http://actionplan.gc.ca/eng/index.asp
39 The Authorities and Actual Spending figures of the CEAP are inclusive of Employee Benefit Plans (EBP).