ARCHIVED - Environment Canada - Supplementary Tables
 This page has been archived.
Archived Content
Information identified as archived on the Web is for reference, research or recordkeeping purposes. It has not been altered or updated after the date of archiving. Web pages that are archived on the Web are not subject to the Government of Canada Web Standards. As per the Communications Policy of the Government of Canada, you can request alternate formats on the "Contact Us" page.
2009-10
Departmental Performance Report
Environment Canada
Supplementary Information (Tables)
Table of Contents
- Sources of Respendable and Non-respendable Revenue
- User Fees/External Fees
- Status Report on Projects operating with specific Treasury Board Approval
- Details on Transfer Payments Programs
- Up-Front Multi-Year Funding
- Horizontal Initiatives
- Green Procurement
- Response to Parliamentary Committees and External Audits
- Internal Audits and Evaluations
Sources of Respendable and Non-Respendable Revenue
| Program Activity | Actual 2007-2008 |
Actual 2008-2009 |
2009-2010 | |||
|---|---|---|---|---|---|---|
| Main Estimates |
Planned Revenue |
Total Authorities |
Actual | |||
| Biodiversity and Wildlife Program | ||||||
| Information Products | 0.0 | 0.0 | 0.0 | 0.0 | 0.1 | 0.1 |
| Realty (Accommodation) | 0.2 | 0.2 | 0.2 | 0.2 | 0.2 | 0.2 |
| Scientific and Professional Services | 0.2 | 0.4 | 0.0 | 0.0 | 0.0 | 0.0 |
| Regulatory Services | 0.3 | 0.2 | 0.3 | 0.3 | 0.2 | 0.2 |
| Sub-total | 0.7 | 0.8 | 0.5 | 0.5 | 0.5 | 0.5 |
| Water Program | ||||||
| Information Products | 0.2 | 0.4 | 0.1 | 0.1 | 0.6 | 0.4 |
| Realty (Accommodation) | 0.2 | 0.1 | 0.0 | 0.0 | 0.0 | 0.0 |
| Scientific and Professional Services | 3.2 | 2.9 | 3.9 | 3.9 | 3.4 | 2.6 |
| Sub-total | 3.7 | 3.3 | 4.0 | 4.0 | 4.0 | 3.0 |
| Ecosystems Initiatives Program | ||||||
| Realty (Accommodation) | 0.3 | 0.3 | 0.3 | 0.3 | 0.3 | 0.3 |
| Scientific and Professional Services | 0.0 | 0.1 | 0.1 | 0.1 | 0.1 | 0.0 |
| Sub-total | 0.3 | 0.3 | 0.4 | 0.4 | 0.4 | 0.3 |
| Environmental Science and Monitoring Program | ||||||
| Information Products | 6.5 | 6.1 | 2.2 | 2.2 | 7.6 | 7.6 |
| Realty (Accommodation) | 1.6 | 1.4 | 0.6 | 0.6 | 1.0 | 1.0 |
| Scientific and Professional Services | 8.0 | 9.1 | 13.2 | 13.2 | 9.3 | 9.2 |
| Sub-total | 16.0 | 16.6 | 16.1 | 16.1 | 17.9 | 17.8 |
| Weather and Environmental Prediction Program | ||||||
| Information Products | 37.2 | 37.3 | 41.8 | 41.8 | 37.7 | 37.3 |
| Realty (Accommodation) | 2.1 | 0.7 | 0.0 | 0.0 | 0.0 | 0.0 |
| Scientific and Professional Services | 3.1 | 3.5 | 3.0 | 3.0 | 3.6 | 3.5 |
| Sub-total | 42.4 | 41.5 | 44.8 | 44.8 | 41.3 | 40.8 |
| Chemicals Management Program | ||||||
| Information Products | 0.0 | 0.1 | 0.0 | 0.0 | 0.0 | 0.0 |
| Realty (Accommodation) | 0.2 | 0.1 | 0.0 | 0.0 | 0.1 | 0.1 |
| Scientific and Professional Services | 1.1 | 2.5 | 2.1 | 2.1 | 2.0 | 2.0 |
| Regulatory Services | 1.7 | 1.8 | 1.9 | 1.9 | 2.0 | 1.8 |
| Sub-total | 3.1 | 4.4 | 4.1 | 4.1 | 4.1 | 3.9 |
| Clean Air Program | ||||||
| Scientific and Professional Services | 0.3 | 0.6 | 0.5 | 0.5 | 1.7 | 1.6 |
| Sub-total | 0.3 | 0.6 | 0.5 | 0.5 | 1.7 | 1.6 |
| Internal Services | ||||||
| Information Products | 0.0 | 0.0 | 0.5 | 0.5 | 0.5 | 0.5 |
| Realty (Accommodation) | 0.0 | 0.0 | 0.3 | 0.3 | 0.7 | 0.6 |
| Scientific and Professional Services | 0.0 | 0.0 | 0.0 | 0.0 | 0.1 | 0.1 |
| Sub-total | 0.0 | 0.0 | 0.8 | 0.8 | 1.3 | 1.2 |
| Total Respendable Revenue | 66.5 | 67.6 | 71.1 | 71.1 | 71.1 | 69.2 |
Totals may differ between and within tables due to rounding of figures.
| Program Activity | Actual 2007-2008 |
Actual 2008-2009 |
2009-2010 | |||
|---|---|---|---|---|---|---|
| Main Estimates |
Planned Revenue |
Total Authorities |
Actual | |||
| Biodiversity and Wildlife Program | ||||||
| Licenses and Permits | 3.1 | 3.3 | 4.4 | 4.4 | 4.4 | 3.1 |
| Proceeds from the disposal of surplus Crown assets | 0.0 | 0.1 | 0.0 | 0.0 | 0.0 | 0.1 |
| Regulatory Services | 0.1 | 0.1 | 0.0 | 0.0 | 0.0 | 0.1 |
| Miscellaneous | 0.1 | 0.1 | 0.0 | 0.0 | 0.0 | 0.1 |
| Sub-total | 3.4 | 3.6 | 4.4 | 4.4 | 4.4 | 3.4 |
| Water Program | ||||||
| Proceeds from the disposal of surplus Crown assets | 0.1 | 0.1 | 0.0 | 0.0 | 0.0 | 0.1 |
| Miscellaneous | 0.1 | 0.0 | 0.0 | 0.0 | 0.0 | 0.0 |
| Royalties | 0.0 | 0.0 | 0.0 | 0.0 | 0.0 | 0.1 |
| Third Party Agreements | 0.2 | 0.3 | 0.0 | 0.0 | 0.0 | 0.4 |
| Sub-total | 0.4 | 0.4 | 0.0 | 0.0 | 0.0 | 0.7 |
| Ecosystems Initiatives Program | ||||||
| Miscellaneous | 0.1 | 0.1 | 0.0 | 0.0 | 0.0 | 0.0 |
| Fines | 0.0 | 0.1 | 0.0 | 0.0 | 0.0 | 0.0 |
| Sub-total | 0.1 | 0.2 | 0.0 | 0.0 | 0.0 | 0.0 |
| Environmental Science and Monitoring Program | ||||||
| Information Products | 0.5 | 0.2 | 0.7 | 0.7 | 0.7 | 0.0 |
| Proceeds from the disposal of surplus Crown assets | 0.2 | 0.1 | 0.0 | 0.0 | 0.0 | 0.2 |
| Miscellaneous | 1.2 | 1.1 | 0.0 | 0.0 | 0.0 | 1.1 |
| Royalties | 0.4 | 0.3 | 0.3 | 0.3 | 0.3 | 0.3 |
| Scientific and Professional Services | 0.0 | 0.0 | 1.4 | 1.4 | 1.4 | 0.0 |
| Sub-total | 2.3 | 1.7 | 2.4 | 2.4 | 2.4 | 1.6 |
| Weather and Environmental Prediction Program | ||||||
| Information Products | 0.7 | 0.6 | 6.4 | 6.4 | 6.4 | 0.4 |
| Miscellaneous | 3.8 | 3.6 | 0.0 | 0.0 | 0.0 | 3.6 |
| Scientific and Professional Services | 0.0 | 0.0 | 0.4 | 0.4 | 0.4 | 0.0 |
| Sub-total | 4.5 | 4.2 | 6.8 | 6.8 | 6.8 | 4.0 |
| Chemicals Management Program | ||||||
| Proceeds from the disposal of surplus Crown assets | 0.0 | 0.0 | 0.0 | 0.0 | 0.0 | 0.1 |
| Miscellaneous | 0.1 | 0.1 | 0.0 | 0.0 | 0.0 | 0.1 |
| Royalties | 0.2 | 0.1 | 0.0 | 0.0 | 0.0 | 0.0 |
| Sub-total | 0.3 | 0.2 | 0.0 | 0.0 | 0.0 | 0.3 |
| Legislation and Information Program | ||||||
| Miscellaneous | 0.1 | 0.0 | 0.0 | 0.0 | 0.0 | 0.0 |
| Sub-total | 0.1 | 0.0 | 0.0 | 0.0 | 0.0 | 0.0 |
| Clean Air Program | ||||||
| Proceeds from the disposal of surplus Crown assets | 0.5 | 0.6 | 0.0 | 0.0 | 0.0 | 0.5 |
| Miscellaneous | 0.1 | 0.0 | 0.0 | 0.0 | 0.0 | 0.3 |
| Scientific and Professional Services | 0.0 | 0.0 | 0.0 | 0.1 | 0.0 | 0.0 |
| Sub-total | 0.6 | 0.6 | 0.0 | 0.1 | 0.0 | 0.8 |
| Internal Services | ||||||
| Proceeds from the disposal of surplus Crown assets | 0.0 | 0.0 | 0.0 | 0.0 | 0.0 | 0.1 |
| Miscellaneous | 0.0 | 0.0 | 0.0 | 0.0 | 0.0 | 0.3 |
| Sub-total | 0.0 | 0.0 | 0.0 | 0.0 | 0.0 | 0.4 |
| Total Non-respendable Revenue | 11.7 | 10.9 | 13.6 | 13.6 | 13.6 | 11.3 |
| Total Respendable and Non-Respendable Revenue |
78.2 | 78.5 | 84.8 | 84.8 | 84.8 | 80.5 |
Totals may differ between and within tables due to rounding of figures.
User Fees Reporting
In the following tables, under “fee type,” R = Regulatory, and O = Other products and services.
User Fee: Ocean Disposal Permit Application Fees
Fee Type: R
Fee-setting Authority: Canadian Environmental Protection Act, 1999 (CEPA 1999), ss. 135(1); Disposal at Sea Regulations
Date Last Modified: 2001
Performance Standards:
Under the application fee, each application is reviewed according to Schedule 6 of CEPA 1999 and the Disposal at Sea Regulations. This involves public notice, an application that provides detailed data, scientific review and payment of fees. Each permit is published in the Canada Gazette
within 120 days of applying if the application is complete and there are no issues from other stakeholders. Under the permit fee, Environment Canada is committed to annual client meetings to review monitoring plans; conduct representative disposal site monitoring according to national guidelines; produce an annual report on activity; produce a financial summary of revenues,
expenses and value for clients; and report results of monitoring to the Office for the London Convention.
Performance Results:
Met service standards. Applications were reviewed within the 120-day timeframe. Advice was provided to applicants to assist timely permit reviews. Monitoring plans were reviewed with key clients. Disposal site monitoring was conducted and reported.
For further details see www.ec.gc.ca/seadisposal/.
| 2009-2010 | Planning Years | ||||
|---|---|---|---|---|---|
| Forecast Revenue | Actual Revenue | Full Cost | Fiscal Year | Forecast Revenue | Estimated Full Cost |
| 200.0 | 232.5 | 1,021.0 | 2010-2011 | 200.0 | 1,021.0 |
| 2011-2012 | 200.0 | 1,021.0 | |||
| 2012-2013 | 200.0 | 1,021.0 | |||
User Fee: Ocean Disposal Site Monitoring Fees
Fee Type: R
Fee-setting Authority: Financial Administration Act (FAA), par. 19.1(a); Ocean Dumping Permit Fee Regulations (Site Monitoring)
Date Last Modified: 2001
Performance Standards:
The permittee has access to a permitted site and the ability to dispose of 1000 m3 of dredged or excavated material for each $470 paid. The collected revenue is used by the Disposal at Sea Program to operate a representative national disposal site monitoring program that allows the client group as a whole to continue to have access to suitable disposal sites and to demonstrate
that the resource is used sustainably for the Canadian public.
Performance Results:
Met the service standards. Permittees disposed of dredged and excavated material authorized by their permits. Representative monitoring was carried out in accordance with monitoring guidelines.
| 2009-2010 | Planning Years | ||||
|---|---|---|---|---|---|
| Forecast Revenue | Actual Revenue | Full Cost | Fiscal Year | Forecast Revenue | Estimated Full Cost |
| 1,600.0 | 1,160.2 | 1,200.0 | 2010-2011 | 1,300.0 | 1,300.0 |
| 2011-2012 | 1,300.0 | 1,300.0 | |||
| 2012-2013 | 1,300.0 | 1,300.0 | |||
User Fee: New Substances Notification
Fee Type: R
Fee-setting Authority: Fee-setting Authority: CEPA 1999, s. 328, New Substances Fees
Date Last Modified: 2009
Performance Standards:
All notifications are reviewed and decisions taken within the prescribed timeframes. Requests are acknowledged by letter, email or fax within 10 business days of receipt.
Performance Results:
All new substances notifications are processed and decisions taken within the legislative time period. Requests made by letter, email or fax are responded to 95% of the time within 10 days.
| 2009-2010 | Planning Years | ||||
|---|---|---|---|---|---|
| Forecast Revenue | Actual Revenue | Full Cost | Fiscal Year | Forecast Revenue | Estimated Full Cost |
| 327.0 | 447.0 | 3,700.0 | 2010-2011 | 350.0 | 3,700.0 |
| 2011-2012 | 350.0 | 3,700.0 | |||
| 2012-2013 | 350.0 | 3,700.0 | |||
Other Information: Note that the actual revenues are shared between Environment Canada (2/3) and Health Canada (1/3). In 2009–2010 Environment Canada kept $298,000 and Health Canada received $149,000.
User Fee: Migratory Bird Program - Migratory Game Bird Hunting Permit
Fee Type: R
Fee-setting Authority: Migratory Birds Convention Act, 1994 (MBCA 1994), s. 12; Migratory Birds Regulations, C.R.C., c. 1035
Date Last Modified: 1998 - SOR/98 314
Performance Standards:
Migratory Game Bird Hunting (MGBH) permits are sold for $8.50 each. MGBH permits are available at selected Canada Post Corporation (CPC) offices, selected provincial government service outlets and private vendors from August 1 to March 10. The performance standard is to ensure that adequate numbers of permits are available for distribution within that timeframe.
Permits validated by the Habitat Conservation Stamp are mandatory for migratory game bird hunting. The hunter and/or his or her representative must physically go to a vendor and purchase a MGBH permit. Quality service is provided to the clients by vendors of the MGBH permit. Clients purchasing the permit receive it immediately following completion of the sale transaction.
There are no current discussions for increasing the permit fee.
Performance Results:
MGBH permits were available to meet hunter demand within the specified time period. All purchased MGBH permits were provided immediately following the sale transaction. There were approximately three complaints in 2009 that stemmed from permits not available at
specific CPC outlets due to the fact that the outlets had not requested more stock from the CPC warehouse. Environment Canada has rectified this situation by requesting that CPC make available to outlets clear instructions on how to replenish stock for the 2010 MGBH
permits.
| 2009-2010 | Planning Years | ||||
|---|---|---|---|---|---|
| Forecast Revenue | Actual Revenue | Full Cost | Fiscal Year | Forecast Revenue | Estimated Full Cost |
| 2,006.0 | 884.0 | 960.0 | 2010-2011 | 1,600.0 | 900.0 |
| 2011-2012 | 1,700.0 | 800.0 | |||
| 2012-2013 | 1,800.0 | 500.0 | |||
User Fee: Migratory Bird Program - Habitat Conservation Stamp
Fee Type: R
Fee-setting Authority: MBCA 1994, s. 12; Migratory Birds Regulations
Date Last Modified: 1991
Performance Standards:
The retail value of the Wildlife Conservation Stamp is $8.50 each. The performance standard is to ensure that adequate numbers of single stamps are available for the MGBH permits in addition to a number of Wildlife Conservation Stamps available for distribution by CPC
offices and vendors selected by Wildlife Habitat Canada (WHC).
Collectors can purchase Wildlife Conservation Stamps from Canada Post outlets and Wildlife Habitat Canada and its selected vendors by mail order, telephone and fax. These purchases require a two-week processing period. The price of the Wildlife Conservation stamps ranges from $8.50 for a single stamp to $136.00 for a pane of 16 stamps and also includes signed (by the artist) booklets at $20.00. There is no current discussion on increasing the fee for the Wildlife Conservation Stamp.
Performance Results:
Wildlife Conservation Stamps were available to meet the requirements for MGBH permits, and sufficient numbers were available for purchase at the beginning of the 2009 calendar year within the specified time period. Clients were able to purchase Wildlife Conservation Stamps from CPC outlets or by mail order, telephone and fax, and these were made available within the two-week processing period. Wildlife Conservation Stamps purchased from WHC and its selected vendors in person, by telephone or mail order were also processed within the two-week processing period. No
complaints relating to availability of the stamps were received.
| 2009-2010 | Planning Years | ||||
|---|---|---|---|---|---|
| Forecast Revenue | Actual Revenue | Full Cost | Fiscal Year | Forecast Revenue | Estimated Full Cost |
| 2,200.0 | 1,455.0 | 960.0 | 2010-2011 | 1,900.0 | 2,200.0 |
| 2011-2012 | 1,900.0 | 2,200.0 | |||
| 2012-2013 | 1,900.0 | 2,200.0 | |||
User Fee: Migratory Bird Program - Avicultural Permits, Taxidermist Permits and Eiderdown Permits
Fee Type: R
Fee-setting Authority: MBCA 1994, s. 12; Migratory Birds Regulations
Date Last Modified: prior to 1978
Performance Standards:
These permits are issued by Environment Canada regional offices for a fee of $10.00 each after reviewing applications from the public. To be successful, applicants must meet certain requirements; for example, with respect to aviculture, a person must demonstrate that they will wing-clip/pinion or keep the birds in an enclosure to prevent mixing with wild populations. Each
region can attach specific conditions to each permit. Permits generally expire on December 31 of the year issued. The performance standard is to review all applications received and issue permits, or notify applicants of the reasons for denying a permit, within 30 days of receiving the application.
Performance Results:
All applications were processed within the 30-day timeframe unless site inspections were required. In those cases (10% of all applications), an additional 30–60 days were required to process the application.
| 2009-2010 | Planning Years | ||||
|---|---|---|---|---|---|
| Forecast Revenue | Actual Revenue | Full Cost | Fiscal Year | Forecast Revenue | Estimated Full Cost |
| 6.0 | 5.1 | 34.0 | 2010-2011 | 4.6 | 34.0 |
| 2011-2012 | 4.6 | 34.0 | |||
| 2012-2013 | 5.0 | 34.0 | |||
User Fee: Cap Tourmente National Wildlife Area - Permit Sales
Fee Type: R
Fee-setting Authority: Canada Wildlife Act (CWA), s. 12; Wildlife Area Regulations
Date Last Modified: 2001
Performance Standards:
To meet the needs of hunters during the hunting season at Cap Tourmente, and to ensure that they enjoy their time and come back in future years, Environment Canada ensures that there are well‑maintained facilities such as good trails, meal areas that are pleasant and appreciated by the hunters, sufficient parking spaces, and toilets.
Performance Results:
According to a survey of permit holders conducted in 2005, hunters were very satisfied with how well the facilities were maintained.
| 2009-2010 | Planning Years | ||||
|---|---|---|---|---|---|
| Forecast Revenue | Actual Revenue | Full Cost | Fiscal Year | Forecast Revenue | Estimated Full Cost |
| 190.0 | 98.0 | 155.0 | 2010-2011 | 55.0 | 85.0 |
| 2011-2012 | 55.0 | 85.0 | |||
| 2012-2013 | 70.0 | 85.0 | |||
Other Information: For 2010-2011 and 2011-2012, revenues are forecast to decrease by approximately 45% from previous years due to the elimination of spring hunting. In 2012-2013, regulation changes are anticipated that will increase the cost of permits and will return annual revenues to approximately $70,000.
User Fee: Fees charged for the processing of access requests filed under the Access to Information Act (ATIA)
Fee Type: O
Fee-setting Authority: Access to Information Act, ss. 11(1) and par. 77(1)d); Access to Information Regulations
Date Last Modified: 1992
Performance Standards:
A response is to be provided within 30 days following receipt of request; the response time may be extended pursuant to section 9 of the ATIA. A notice of extension must be sent within 30 days after receipt of the request.
The Access to Information Act provides further details: http://laws.justice.gc.ca/en/A-1/218072.html.
Performance Results:
Environment Canada received 890 requests in 2009–2010 and processed 929 requests, including some carried over from the previous year. Two hundred and fifteen (215) requests were carried over to 2010–2011.
| 2009-2010 | Planning Years | ||||
|---|---|---|---|---|---|
| Forecast Revenue | Actual Revenue | Full Cost | Fiscal Year | Forecast Revenue | Estimated Full Cost |
| 13.5 | 8.0 | 1,155.5 | 2010-2011 | 8.5 | 1,400.0 |
| 2011-2012 | 9.0 | 1,600.0 | |||
| 2012-2013 | 9.5 | 1,800.0 | |||
Other Information: It is the Department’s practice to waive fees where the total owing per request amounts to less than $25.
User Fee: Cap Tourmente National Wildlife Area - Entry Sales
Fee Type: O
Fee-setting Authority: CWA, s.12; Wildlife Area Regulations
Date Last Modified: 2003
Performance Standards:
To meet the needs of visitors during the Cap Tourmente operating season and to ensure that they enjoy their time and that they come back in future years, Environment Canada ensures that there are well-maintained facilities such as good trails, meal areas that are pleasant and appreciated by the hunters, sufficient parking spaces, and toilets. Visitors also have access to
bilingual visitor and interpretation services, enabling them to learn more about the Cap Tourmente site.
Performance Results:
According to comments gathered from some visitors, there is general satisfaction with the visitor and interpretation services offered and with how well the facilities are maintained.
| 2009-2010 | Planning Years | ||||
|---|---|---|---|---|---|
| Forecast Revenue | Actual Revenue | Full Cost | Fiscal Year | Forecast Revenue | Estimated Full Cost |
| 226.0 | 148.0 | 270.0 | 2010-2011 | 226.0 | 260.0 |
| 2011-2012 | 226.0 | 270.0 | |||
| 2012-2013 | 226.0 | 280.0 | |||
| 2009-2010 | Planning Years | |||||
|---|---|---|---|---|---|---|
| Forecast Revenue | Actual Revenue | Full Cost | Fiscal Year | Forecast Revenue | Estimated Full Cost | |
| Sub-Total (R) | 6,529.0 | 4,281.8 | 9,270.0 | 2010-2011 | 5,409.6 | 9,240.0 |
| 2011-2012 | 5,509.6 | 9,140.0 | ||||
| 2012-2013 | 5,625.0 | 8,840.0 | ||||
| Sub-Total (O) | 239.5 | 156.0 | 1,425.5 | 2010-2011 | 234.5 | 1,660.0 |
| 2011-2012 | 235.0 | 1,870.0 | ||||
| 2012-2013 | 235.5 | 2,080.0 | ||||
| Total | 6,768.5 | 4,437.8 | 10,695.5 | 2010-2011 | 5,644.1 | 10,900.0 |
| 2011-2012 | 5,744.6 | 11,010.0 | ||||
| 2012-2013 | 5,860.5 | 10,920.0 | ||||
External Fees Reporting
| External Fee | Service Standard | Performance Results | Stakeholder Consultation |
|---|---|---|---|
| Regulatory Services | |||
| Ocean Disposal Permit Application Fees | Under the application fee, each application will be reviewed according to Schedule 6 of the Canadian Environmental Protection Act, 1999 (CEPA 1999) and the Disposal at Sea Regulations. This involves public notice, application that provides detailed data, scientific review and payment of fees. Each permit will be published in the Canada Gazette within 120 days of applying if the application is complete and there are no issues from other stakeholders. Under the permit fee, Environment Canada is committed to annual client meetings to review monitoring plans; conduct representative disposal site monitoring according to national guidelines; produce an annual report on activity; produce a financial summary of revenues, expenses and value for clients; and report results to the London Convention office. | Met service standards. Applications were reviewed within the 120‑day timeframe. Advice was provided to applicants to assist timely permit reviews. Monitoring plans were reviewed with clients in each region. Disposal site monitoring was conducted and reported on. For further details see www.ec.gc.ca/seadisposal/ |
Application fees set in 1993 were rolled over in 2001. Regulatory Impact Assessment Statements and multistakeholder consultations were conducted before each regulation was enacted. Multistakeholder consultations were carried out from 1996 to 1998 for setting the permit fee. There was general acceptance of the fee, but there was some concern for how it would be set. Permittees indicated that they preferred a proportional volume-based fee. As well, Environment Canada committed to regular meetings with permit holders, reporting, and to review the fee three years after implementation. The review was conducted in 2003 and its report concluded that no change to fees was required. All consultations between 1993 and 2003 involved discussion papers, public meetings and final reports. For further details see www.ec.gc.ca/seadisposal/regs/min_reg_g2_e.html |
| Ocean Disposal Site Monitoring Fees | The permittee has access to a permitted site and is permitted to dispose of 1000 m3 of dredged or excavated material for each $470 paid. The collected revenue is used by the Disposal at Sea Program to operate a representative national disposal site monitoring program that allows the client group as a whole to continue to have access to suitable disposal sites and to demonstrate that the resource is used sustainably for the Canadian public. | Met the service standards. Permittees disposed of dredged and excavated material as authorized by their permits. Representative monitoring was carried out in accordance with monitoring guidelines. | Multistakeholder consultations were carried out from 1996 to 1998 for setting the permit fee. There was general acceptance for the fee, but there was some concern for how it would be set. Permittees indicated that they preferred a proportional volume-based fee. As well, Environment Canada committed to regular meetings with permit holders, reporting, and to review the fee three years after implementation. The review was conducted in 2003 and its report concluded that no change to the fee was required. Further consultations were undertaken between 1993 and 2003 involving discussion papers, public meetings and final reports. For further details see www.ec.gc.ca/seadisposal/regs/min_reg_g2_e.html. Current consultations are ongoing through a discussion document to examine ways of reducing the fees and/or improving delivery of the services. |
| New Substance Notification | All notifications are reviewed and decisions taken within the prescribed timeframes. Requests are acknowledged by letter, e-mail or fax within 10 business days of receipt. | All new substances notifications were processed and decisions were taken within the legislative time period. Requests made by letter, email or fax were responded to within 10 days, 95% of the time. | Amendments to the New Substances Notifications Regulations were published in the Canada Gazette, Part II, in September 2005. Under the Service Delivery Improvement Initiative of the New Substances Program, a service charter and standards were developed and published in 2006. As well, in 2004 a notifier survey was designed and implemented to determine areas for improvement in the Program. A second New Substances Program notifer survey was completed in the 2009–2010 fiscal year. The results from both surveys will be used as a benchmark for the Program’s improvement initiatives. |
| Migratory Bird Program - Migratory Game Bird Hunting Permit | Migratory Game Bird Hunting (MGBH) permits are sold for $8.50 each. MGBH permits are available at selected Canada Post Corporation (CPC) offices, selected provincial government service outlets and private vendors from August 1 to March 10. The performance standard is to ensure that adequate numbers
of permits are available for distribution within that timeframe. Permits validated by the Habitat Conservation Stamp are mandatory for migratory game bird hunting. The hunter and/or his or her representative must physically go to a vendor and purchase a MGBH permit. Quality service is provided to the clients by vendors of the MGBH permit. Clients purchasing the permit receive it immediately following completion of the sale transaction. There are no current discussions for increasing the permit fee. |
MGBH permits were available to meet hunter demand within the specified time period. All purchased MGBH permits are provided immediately following the sale transaction. There were approximately three complaints in 2009 that stemmed from permits not available at specific CPC outlets because the outlets had not requested more stock from the CPC warehouse. Environment Canada has rectified this sitution by requesting that CPC make available to outlets clear instructions on how to replenish stock for the 2010 MGBH permits. | No recent consultations have been conducted. The revenues collected from the sale of the MGBH permits are deposited directly into the Consolidated Revenue Fund. No consultations are planned for 2010–2011. |
| Migratory Bird Program - Habitat Conservation Stamp | The retail value of the Wildlife Conservation Stamp is $8.50 each. The performance standard is to ensure that adequate numbers of single stamps are available for the MGBH permits in addition to a number of Wildlife Conservation stamps available for distribution by CPC offices and vendors selected by Wildlife Habitat Canada (WHC). Collectors can purchase Wildlife Conservation Stamps from Canada Post outlets and Wildlife Habitat Canada and its selected vendors by mail order, telephone and fax. These purchases require a two-week processing period. The price of the Wildlife Conservation Stamps ranges from $8.50 for a single stamp to $136.00 for a pane of 16 stamps and also includes signed (by the artist) booklets at $20.00. There is no current discussion on increasing the fee for the Wildlife Conservation Stamp. |
Wildlife Conservation Stamps were available to meet the requirements for MGBH permits, and sufficient numbers were available for purchase at the beginning of the 2009 calendar year within the specified time period. Clients were able to purchase Wildlife Conservation Stamps from CPC outlets or by mail order, telephone and fax, and these were made available within the two‑week processing period. Wildlife Conservation Stamps bought from WHC and its selected vendors in person, by telephone or mail order were also processed within the two‑week processing period. No complaints relating to availability of the stamps were received. | No consultations are planned for 2010–2011. |
| Migratory Bird Program - Avicultural Permits, Taxidermist Permits and Eiderdown Permits | These permits are issued by Environment Canada regional offices for a fee of $10.00 each after reviewing applications and renewal requests from the public. To be successful, applicants must meet certain requirements; for example, with respect to aviculture, a person must demonstrate that they will wing-clip/pinion and keep the birds in an enclosure to prevent mixing with wild populations. Each region can attach specific conditions to each permit. Permits generally expire on December 31 of the year issued. The performance standard is to review all applications received and issue permits, or notify applicants of the reasons for denying a permit, within 30 days of receiving the application. | All applications were processed within the 30‑day timeframe unless site inspections were required. In those cases (10% of all the applications), an additional 30–60 days were required to process the application. Site inspections are the responsibility of the Wildlife Enforcement Directorate, so timeframe relates directly to officer workload. | Since revenues and cost are insignificant and since no complaints were received, consultations are not currently planned. |
| Cap Tourmente National Wildlife Area: Permit Sales | To meet the needs of hunters during the hunting season at Cap Tourmente, and to ensure that they enjoy their time and come back in future years, Environment Canada ensures that there are well-maintained facilities such as good trails, meal areas that are pleasant and appreciated by the hunters, sufficient parking spaces, and toilets. | According to a survey of permit holders conducted in 2005, hunters were very satisfied with how well the facilities were maintained. | No consultations are planned for 2010–2011. |
| Information Products | |||
| Other Products and Services | |||
| Fees charged for the processing of access requests filed under the Access to Information Act (ATIA) | A response is to be provided within 30 days following receipt of request; the response time may be extended pursuant to section 9 of the ATIA. A notice of extension must be sent within 30 days after receipt of the request. The Access to Information Act provides further details: http://laws.justice.gc.ca/en/A-1/218072.html. |
Environment Canada received 890 requests in 2009–2010 and processed 929 requests, including some carried over from the previous year. Two hundred and fifteen (215) requests were carried over to 2010–2011. | The service standard is established by the Access to Information Act and the Access to Information Regulations. Consultations with stakeholders were undertaken by the Department of Justice and the Treasury Board of Canada Secretariat for amendments made in 1986 and 1992. |
|
B. Other Information: It is the Department’s practice to waive fees where the total owing per request amounts to less than $25. |
|||
|
Haying & Grazing (Canadian Wildlife Service Agricultural Activity) |
A standing request list—“Notice of Interest”—is searched to identify applicants interested in the activity, e.g., haying, grazing, crop. If no interest is shown then a call for applications is made through ads in local papers or other suitable means. Interested persons are asked to fill out a Canadian Wildlife Service (CWS) agricultural
activity application form. Application forms are reviewed to determine the most suitable candidate(s) and a reference check of the candidate(s) is conducted. |
Federal lands are monitored to ensure that permit conditions are being met and habitat management goals (e.g., maintaining native plant community and habitat for wildlife, and reducing weed and exotic species invasion) are achieved through the activity. If so, the permit will be granted in subsequent years (subject to annual review). |
The most suitable applicant is contacted to confirm their interest in obtaining a permit. Discussions are held to ensure that the applicant understands and agrees to all conditions that will be on the permit. It is also ensured that the applicant understands that the permit is only for one season, and that if any conditions of the permit are not followed, the permit
may be immediately revoked by the Minister. |
|
Entry Fees: Biosphère (Montréal) |
Throughout the year, visitors to the Biosphère have access to visitor services and interpretation services in the exhibition halls, guided activities on various environmental subjects, and educational workshops designed especially for groups, as well as maintained facilities (exhibition halls, rest areas, lookouts, parking, etc.) |
According to visitors’ written comments, which are gathered daily, and evaluation sheets completed by group leaders, a majority of visitors were very satisfied with their individual or group visit experience, and with the other services. |
When a group visits, the group leader (e.g., the teacher) must complete an assessment of the services received. For visits by individuals, a sample survey will be conducted in 2011-2012. |
|
Cap Tourmente National Wildlife Area: Entry Sales |
To meet the needs of visitors during the Cap Tourmente operating season, and to ensure that their time there is pleasant and that they come back in future years, the facilities are well maintained, with good trails, meal areas that are pleasant and appreciated by the visitors, sufficient parking spaces, and toilets. Visitors also have access to bilingual visitor and interpretation services, enabling them to learn more about the Cap Tourmente site. |
According to comments gathered from some visitors, users were generally satisfied with the visitor and interpretation services offered and with how well the facilities are maintained. |
No formal consultation was conducted this year. A suggestion box is available on the site, so that visitors can submit their comments and suggestions. For the planning of student visits, meetings are sometimes held in advance with teachers, in order to take into account their expectations concerning the information disseminated and how the visits will unfold. |
|
Publications and Publication Services |
Most publications are provided free of charge. They are available in the Environment Canada online catalogue in various formats (print, HTML, PDF). Some publications are sold to cover the printing costs of the Publications Section and to underwrite the cost of production (translation, editing, design and layout). The content of these publications is very scientific
and technical. |
The online ordering set-up has a built-in tracking system. For audit purposes, all supporting documentation (purchase orders, requests, etc.) is attached to the invoice. Most items are prepaid, with the exception of purchases by other government departments and Canadian companies that are set up for purchase orders. For international orders, Environment Canada asks for prepayment before shipping the items, to prevent having to recover small amounts at year end. |
All publications promote our 1-800 number to voice concerns and complaints. |
|
Publications and Publication Services |
Packaging and shipping is carried out at a dedicated facility (Distribution Centre, 171 Jean-Proux, Gatineau QC K1A 0H3). Items are shipped by Canada Post for the most part, unless the client chooses alternative means, in which instance the Department fully recovers the associated costs. In addition to sending publications out by mail, publications are also distributed through government libraries, electronic distribution, and conferences. |
The only delays experienced in the past involved reprinting. The online order tracking system allows Environment Canada staff to view the orders; post invoices, work order and shipping information; and to chronologically list all correspondence with the client. Items are categorized as PENDING, PROCESSING and COMPLETED, and are viewed daily to make sure that all orders are completed in a timely fashion. |
|
|
NOTE: CHANGE IN REPORTING FROM PREVIOUS DEPARTMENTAL PERFORMANCE REPORTS: |
|||
Status Report on Projects operating with specific Treasury Board Approval
In March 2009, Environment Canada received Treasury Board approval of its 5-year Investment Plan and Organizational Project Management Capacity Assessment (OPMCA) at a Class 2 Level. The projects noted below were identified to TBS prior to March 2009 when these new authorities came into effect. No additional projects exceeding Environment Canada's Capacity Class Level 2 were initiated within this reporting period.
| Project | Original Estimated Total Cost |
Revised Estimated Total Cost |
Actual Cost Total |
2009-2010 | ||||
|---|---|---|---|---|---|---|---|---|
| Main Estimates |
Planned Spending |
Total Authorities |
Actual | Expected date of close-out |
||||
| Program Activity: Environmental Science and Monitoring Program | ||||||||
| Supercomputer facility upgrade to electrical and cooling capacity (effective project approval) (project close-out phase) | 6.1 | 6.9 | 6.9 | 1.0 | 1.0 | 1.0 | 1.0 | 2009–2010 |
| UPS replacement - Dorval facility (effective project approval) (project implementation phase) | 10.6 | 15.4 | 15.4 | 0.7 | 0.7 | 0.7 | 0.7 | 2012–2013 |
| Total Projects | 16.7 | 22.3 | 22.3 | 1.7 | 1.7 | 1.7 | 1.7 | - |
Totals may differ between and within tables due to rounding of figures.
Details of Transfer Payment Programs (TPPs)
- Contributions to support environment research and development
- Contributions to support environmental and sustainable development initiatives
- Contributions to Support Canada’s International Commitments
- Habitat Stewardship Program for Species at Risk (HSP)
- EcoAction 2000 – Community Funding Initiative
- Grant to the Canada Foundation for Sustainable Development Technology for the Next-Generation Biofuels Fund™
- Initiatives of the Action Plan on Clean Water—Freshwater Programs—Contributions
- National Vehicle Scrappage Program - Contributions
1. Name of Transfer Payment Program: Contributions to support environment research and development*
2. Start date: June 1999
3. End date: March 31, 2010*
4. Description: The purpose of this class contribution is to stimulate, increase or improve scientific knowledge and information, to support the promotion and coordination of research and development in areas that support Environment Canada's objectives, such as wildlife, toxicology, climate change and atmospheric studies.
5. Strategic Outcome: Not applicable*
6. Results Achieved: Environment Canada funds contributions to support environmental research and development that are aligned with departmental and program priorities. The Department continued ongoing relationships with a number of Canadian universities on a wide variety of initiatives, resulting in increases in knowledge in atmospheric sciences, toxic chemicals, water and the impacts of pollutants on water, as well as wildlife and the impacts of pollutants on wildlife.
The progress made is reflected through the delivery of Environment Canada's programs and results reported in Section II of the 2009–2010 Departmental Performance Report.
| 7. Actual Spending 2007-2008 |
8. Actual Spending 2008-2009 |
9. Planned Spending 2009-2010 |
10. Total Authorities 2009-2010 |
11. Actual Spending 2009-2010 |
12. Variance(s) | |
|---|---|---|---|---|---|---|
| 14. Total Grants | 0 | 0 | 0 | 0 | 0 | 0 |
| 14. Total Contributions | 4.4 | 5.7 | 0 | 8.4 | 8.4 | (8.4) |
| 14. Total Other Types of Transfer Payments | 0 | 0 | 0 | 0 | 0 | 0 |
| 15. Total Program Activity(ies) | 4.4 | 5.7 | 0 | 8.4 | 8.4 | (8.4) |
*Note: Treasury Board approved Environment Canada’s redesign of the existing class transfer payment programs (i.e. Contributions to Support Environmental Research and Development, Contributions to Support Environmental and Sustainable Development Initiatives and Contributions to Support Canada's international commitments) so that they align to the Department’s revised 2010-2011 Program Activity Architecture (PAA). The redesign and alignment to the PAA will improve performance measurement and reporting and clarify accountability arrangements.
1. Name of Transfer Payment Program: Contributions to support environmental and sustainable development initiatives*
2. Start date: June 1999
3. End date: March 31, 2010*
4. Description: The objective of this class contribution is to enable Canadian groups, associations and organizations to become actively involved in environmental and sustainable development initiatives while accommodating regional ecosystem and socio-economic considerations. Contributions enable recipients to plan, manage and complete environmental and sustainable development initiatives at the regional or ecosystem level. This funding also serves to increase awareness and understanding of environmental and sustainable development issues and to encourage environmentally responsible action.
5. Strategic Outcome: Not applicable*
6. Results Achieved: Environment Canada funds contributions to support environmental and sustainable development initiatives that are aligned with departmental and program priorities. The contributions facilitate access, on a national level, to existing knowledge, tools and methods for making good decisions on the environment and sustainable development that are appropriate, given the social, cultural and economic contexts.
The progress made is reflected in the delivery of Environment Canada's programs and results, reported in Section II of the 2009–2010 Departmental Performance Report.
| 7. Actual Spending 2007-2008 |
8. Actual Spending 2008-2009 |
9. Planned Spending 2009-2010 |
10. Total Authorities 2009-2010 |
11. Actual Spending 2009-2010 |
12. Variance(s) | |
|---|---|---|---|---|---|---|
| 14. Total Grants | 0 | 0 | 0 | 0 | 0 | 0 |
| 14. Total Contributions | 26.3 | 25.8 | 28.2 | 25.6 | 23.0 | 5.2 |
| 14. Total Other Types of Transfer Payments | 0 | 0 | 0 | 0 | 0 | 0 |
| 15. Total Program Activity(ies) | 26.3 | 25.8 | 28.2 | 25.6 | 23.0 | 5.2 |
*Note: Treasury Board approved Environment Canada’s redesign of the existing class transfer payment programs (i.e. Contributions to Support Environmental Research and Development, Contributions to Support Environmental and Sustainable Development Initiatives and Contributions to Support Canada's international commitments) so that they align to the Department’s revised 2010–2011 Program Activity Architecture (PAA). The redesign and alignment to the PAA will improve performance measurement and reporting and clarify accountability arrangements.
1. Name of Transfer Payment Program: Contributions to Support Canada’s International Commitments
2. Start date: June 1999
3. End date: March 31, 2010
4. Description: The purpose of this class contribution is to sustain and enhance Canada's participation in international multilateral and bilateral environmental organizations, agreements and protocols; ensure that Canadian interests are represented in international forums relating to environmental issues; facilitate the participation of developing countries in global environmental and sustainable development issues; and build, strengthen and maintain Canada's links with the international community on global environmental and sustainable development issues.
5. Strategic Outcomes:
- Canada's natural capital is restored, conserved, and enhanced
- Weather and environmental predictions and services reduce risks and contribute to the well-being of Canadians
- Canadians and their environment are protected from the effects of pollution and waste
6. Results Achieved: The results achieved and progress made are reflected through program delivery. This class contribution facilitates access on a national level to existing knowledge tools and methods for making good policy decisions on the environment and health that are appropriate, given the social, cultural and economic contexts.
| 7. Actual Spending 2007-2008 |
8. Actual Spending 2008-2009 |
9. Planned Spending 2009-2010 |
10. Total Authorities 2009-2010 |
11. Actual Spending 2009-2010 |
12. Variance(s) | |
|---|---|---|---|---|---|---|
| 14. Total Grants | 0 | 0 | 0 | 0 | 0 | 0 |
| 14. Total Contributions | 8.5 | 7.3 | 8.7 | 10.5 | 10.5 | (1.8) |
| 14. Total Other Types of Transfer Payments | 0 | 0 | 0 | 0 | 0 | 0 |
| 15. Total Program Activity(ies) | 8.5 | 7.3 | 8.7 | 10.5 | 10.5 | (1.8) |
*Note: Treasury Board approved Environment Canada’s redesign of the existing class transfer payment programs (i.e. Contributions to support Environmental Research and Development, Contributions to support Environmental and Sustainable Development Initiatives and Contributions to support Canada's international commitments) so that they align to the Department’s revised 2010-2011 Program Activity Architecture (PAA). The redesign and alignment to the PAA will improve performance measurement and reporting and clarify accountability arrangements.
16. Comment(s) on Variance(s): Long range planning for the Asia-Pacific Partnership program resulted in a $1M shift of spending from prior years into the current 2009–2010 fical year. The Aisa-Pacific Partnership program's overall 4 years budget is on target. Increased United Nations Framework Convention on Climate Change (UNFCCC) negotiation meetings and support to developing countries for climate change resulted in an additional $0.8M.
17. Audit completed or planned: An audit of contributions related to Asia-Pacific Partnership program is planned for 2010–2011.
18. Evaluation completed or planned: Evaluation of the International Actions Theme (IAT) included an evaluation of the contributions under the Asia-Pacific Partnership program. Results of the Evaluation will be available to the public in 2010–2011.
1. Name of Transfer Payment Program: Habitat Stewardship Program for Species at Risk (HSP)
2. Start Date: August 20, 2000
3. End Date: Program is ongoing. March 2012 is the end date for a portion of HSP funding ($4 M)
4. Description: The purpose of the HSP is to contribute to the recovery of endangered, threatened and other species of concern, and to prevent other species from becoming a conservation concern, by engaging Canadians in conservation actions to benefit wildlife. The HSP fosters partnerships among organizations interested in the recovery of species at risk and provides funding for implementing activities that protect or conserve habitats for species at risk. It enables non-government organizations, landowners, the private sector, Aboriginal organizations, educational institutions, community groups and other levels of government to plan, manage and complete projects that will achieve the program goal.
5. Strategic Outcome: Canada’s natural capital is restored, conserved and enhanced
6. Results Achieved: From April 2009 to March 2010, the Habitat Stewardship Program (HSP) contributed $12.1million to 229 projects addressing terrestrial and aquatic species-at-risk issues in all provinces and territories. The HSP directed $37 million (program plus matching funds) to projects addressing both habitat conservation and threat mitigation issues. These stewardship activities benefited approximately 396 species at risk designated by the Committee on the Status of Endangered Wildlife in Canada (COSEWIC), 354 of which were listed under the Species at Risk Act (SARA). Activities such as monitoring, surveys and inventory work as well as the collection of traditional ecological knowledge, evaluation, and program planning and development activities directly involved more than 15 000 people, and 19 500 people participated in projects aiming at reducing or mitigating threats to species at risk. More than 4295 landowners participated in conservation activities leading to the protection of 13 367 ha of habitat through legally binding protection measures and to an additional 321 710 ha through non‑binding protection measures. Nearly 21 436 ha of habitat and 243 km of shoreline were improved due to the efforts of 6000 project participants.
Overall, since its inception in 2000, the HSP has contributed over $90 million to more than 1600 projects, leveraging an additional $232 million in matching funds from project partners. In its first ten years, the HSP has contributed to the protection of nearly 150 000 ha of land through legally binding protection measures, and has improved approximately 31 000 ha of habitat for species at risk every year.
| 7. Actual Spending 2007-2008 |
8. Actual Spending 2008-2009 |
9. Planned Spending 2009-2010 |
10. Total Authorities 2009-2010 |
11. Actual Spending 2009-2010 |
12. Variance(s) | |
|---|---|---|---|---|---|---|
| 14. Total Grants | ||||||
| 14. Total Contributions | 8.8 | 11.0 | 13.0 | 13.0 | 12.1 | 0.9 |
| 14. Total Other Types of Transfer Payments | ||||||
| 15. Total Program Activity(ies) | 8.8 | 11.0 | 13.0 | 13.0 | 12.1 | 0.9 |
16. Comment(s) on Variance(s): The approved yearly budget is $13M in contributions; however, with normal program operational slippage and withdrawal/cancellation of some projects over $100K in the fourth quarter due to delayed approvals, final expenditures can vary yearly. Looking ahead, with the Department’s new contribution management system in place, more program funding will be provided to recipients and in a timely fashion.
17. Evaluation Completed or Planned: A program evaluation led by Environment Canada’s Audit and Evaluation Branch, with the participation of Fisheries and Oceans Canada (DFO) and Parks Canada Agency (PCA) was undertaken from October 2008 to March 2009 and completed in September 2009. The evaluation examined the overall effectiveness of the HSP from fiscal years 2004–2005 to 2007–2008, focusing on issues of relevance, success, cost-effectiveness and design and delivery. This evaluation revealed that the program is highly relevant to federal government roles and priorities, and is also a particularly appropriate means of federal government intervention for addressing the needs of species at risk on non-federal lands because of its collaborative approach. While similar programs co‑exist with the HSP, none duplicate the program’s targeted activities. In its current form, the program is well managed and administered with a clear and effective governance structure. It was observed that the program would benefit from adopting a more strategic approach toward habitat protection for species at risk. The evaluation is posted at: http://ec.gc.ca/doc/ae-ve/2009-2010/966/toc_eng.htm.
1. Name of Transfer Payment Program: EcoAction 2000 – Community Funding Initiative
2. Start Date: 1998; the program’s Terms and Conditions were renewed and approved by the Minister of the Environment, December 1, 2009.
3. End Date: Terms and Conditions apply for the duration of the program, provided that an evaluation is completed at least once every five years. Next evaluation is scheduled for 2013–2014.
4. Description: Provides financial support to non-profit organizations to undertake environmental projects that yield positive, measurable results; increase capacity and engagement at the community level; and support Canadians to take action for the environment.
5. Strategic Outcome: Canada’s natural capital is restored, conserved and enhanced
6. Results Achieved: The EcoAction Community Funding Initiative delivered 206 projects through contribution agreements in 2009–2010. Of these, 125 were new projects representing a departmental investment of $4.2 million. These projects leveraged $10.3 million in cash and in‑kind support, which translates to $2.45 leveraged for every dollar of federal funding, with an average of 5.6 partner sectors involved in each project. The program funded 54% of project applications received. In support of the International Year of Biodiversity 2010, 54 biodiversity‑related projects were funded, for a total of $1.65 million in federal funding. These projects will reduce biodiversity loss, protect wildlife and improve species habitat, and increase urban re‑naturalization. Climate change projects to reduce greenhouse gas emissions represented 35% of new projects funded, for a total of $1.7 million in federal funding. The remaining projects focused on clean water (23%) and clean air (4%) initiatives. Over 420 000 individuals were engaged in EcoAction projects across Canada, including 2574 volunteers. An additional 108 jobs were created.
Environmental results achieved by projects completed in 2009–2010:
Nature: 1470 hectares of habitat were permanently protected; 277 hectares of habitat were created, restored or rehabilitated; over 61 000 native plants, trees and shrubs were planted; and 211 wildlife structures were installed.
Clean water: 1476 kilograms of toxic or harmful waste (fertilizers, pesticides) were diverted or reduced; over 1 million litres of water were re-used or conserved; 9154 hectares of shoreline were protected, stabilized or improved; and 10 572 hectares were covered by Environmental Management Plans.
Clean air and climate change: Greenhouse gas emissions were reduced by 595 tonnes (CO2 equivalent); emissions of other air pollutants (sulphur dioxide, nitrous oxide, etc.) were reduced by 20 tonnes; 537 445 kilowatt hours/year of energy were conserved; and 22 807 kilograms of organic waste were composted/diverted from landfill.
| 7. Actual Spending 2007-2008 |
8. Actual Spending 2008-2009 |
9. Planned Spending 2009-2010 |
10. Total Authorities 2009-2010 |
11. Actual Spending 2009-2010 |
12. Variance(s) | |
|---|---|---|---|---|---|---|
| 14. Total Grants | 0 | 0 | 0 | 0 | 0 | 0 |
| 14. Total Contributions | 3.99 | 4.3 | 4.5 | 4.5 | 4.46 | 0.04 |
| 14. Total Other Types of Transfer Payments | 0 | 0 | 0 | 0 | 0 | 0 |
| 15. Total Program Activity(ies) | 3.99 | 4.3 | 4.5 | 4.5 | 4.46 | 0.04 |
16. Comment(s) on Variance(s): The small variance in contribution spending is a result of lapsed funds due to changes in project delivery or timing.
17. Audit Completed or Planned: n/a
18. Evaluation Completed or Planned: A program evaluation led by Environment Canada’s Audit and Evaluation Branch was undertaken from October 2008 to March 2009 and completed in May 2009. The evaluation examined the overall effectiveness of the EcoAction program from fiscal years 2004–2005 to 2007–2008, focusing on issues of relevance, success, cost-effectiveness and design and delivery. Overall, the evaluation of the program was positive. Key findings indicated that: the program is aligned with federal priorities and is working towards achieving its intended outcomes; it provides good value for money (leveraging $2.26:$1); it is successful in reaching its intended audience; and it has achieved high client satisfaction. The evaluation noted that some areas required improvement: addressing confusion among program staff on the decision-making process; improving program monitoring activities; and assessing the longer-term impact of funded projects. The evaluation acknowledged that high administrative costs of the program are a result of program design and the focus on client service; however some improvements could be made to increase cost-efficiency. Recommendations focused on improving program forms and tools; examining roles, responsibilities and processes; and improving the program’s ability to demonstrate results. The action plan to implement these improvements was approved by the responsible senior management board. The evaluation is posted at: http://www.ec.gc.ca/doc/ae-ve/2009-2010/954/toc_eng.html.
The next program evaluation is planned for 2013–2014.
1. Name of Transfer Payment Program: Grant to the Canada Foundation for Sustainable Development Technology for the Next-Generation Biofuels Fund™
2. Start Date: April 1, 2007
3. End Date: September 30, 2027 (the last appropriation by Parliament will be in fiscal year 2014–2015, with the last disbursement to Sustainable Development Technology Canada (SDTC) by March 31, 2017)
4. Description: The Foundation will provide grants with conditional repayment terms to eligible recipients for the establishment of first-of-kind, large, demonstration-scale facilities producing next-generation renewable fuels. These facilities must involve both non-conventional technologies and non-traditional feedstocks and be built in Canada, using representative Canadian feedstock. Selection will be based on an in-depth due diligence process developed to assess applications for funding using a roster of biofuels experts and a Project Review Committee.
Since next-generation technologies are capital equipment intensive, they constitute a greater debt financing risk. The support provided by the Next-Generation Biofuels Fund™ will encourage the retention and growth of technology expertise and innovation capacity for next-generation renewable fuels production in Canada.
Of the $500M in total funding, $200M is statutory, with the remaining $300M being appropriated funding which is spread over seven fiscal years, beginning in FY 2008–2009 and ending in FY 2014–2015. The funding is equally divided between Natural Resources Canada and Environment Canada.
5. Strategic Outcome: Canadians and their environment are protected from the effects of pollution and waste.
6. Results Achieved: To date, SDTC has received one formal Application for Funding (AFF) under the Next-Generation Biofuels Fund™ (NGBF). At this time SDTC is tracking approximately 100 companies as potential applicants both from Canada and abroad.
The Next-Generation Biofuels Fund™ adopted a project assurance process based on best practices used by multinational companies. From end to end, there are seven phases and five decision gates. The Fund also assembled a roster of biofuels experts to assist with the in-depth due diligence exercises required to assess applications for funding. The Project Review Committee was created to support the review of applications. The SDTC Board of Directors approved the Next-Generation Biofuels Fund™ Evaluation Framework
| 7. Actual Spending 2007-2008 |
8. Actual Spending 2008-2009 |
9. Planned Spending 2009-2010 |
10. Total Authorities 2009-2010 |
11. Actual Spending 2009-2010 |
12. Variance(s) | |
|---|---|---|---|---|---|---|
| 14. Total Grants | 1.6 | 31.5 | 12.5** | 0 | 0*** | 12.5 |
| 14. Total Contributions | 0 | 0 | 0 | 0 | 0 | 0 |
| 14. Total Other Types of Transfer Payments | 0 | 0 | 0 | 0 | 0 | 0 |
| 15. Total Program Activity(ies) | 1.6 | 31.5 | 12.5** | 0** | 0*** | 12.5 |
*These grants are Environment Canada’s portion of payment made to SDTC based on cash flow statements received from the Foundation. Funding is divided equally between Natural Resources Canada and Environment Canada.
**The $12.5M that was appropriated by Parliament in 2009-10 was reprofiled forward to 2010–2011.
***No payments were made to SDTC in 2009–2010. The Next-Generation Biofuels Fund™ had an opening balance of $65.3M, as of December 31, 2008. Accordingly, SDTC had on hand the funds that it had estimated as its requirement for the period January 1, 2009 to March 31, 2010. Actual spending by SDTC was significantly less than its estimates in Cash Flow Statements, because the anticipated payments to projects have been delayed by the proponents.
16. Audit completed or planned: There was no performance audit or evaluation in FY 2009–2010, except for the standard financial audit required for the financial data in the Annual Report.
17. Evaluation completed or planned: There were no evaluations in FY 2009–2010. Three interim evaluations will be performed by an independent third party selected by the Foundation (November 30, 2012, November 30, 2017 and November 30, 2022); a final evaluation is due by September 30, 2027. The federal government may choose to evaluate the foundation at any time to determine whether it is meeting its objectives. A value-for-money (performance) audit may be conducted by the government at least once every five years.
1. Name of Transfer Payment Program: Initiatives of the Action Plan on Clean Water—Freshwater Programs—Contributions
2. Start Date: April 1, 2008
3. End Date: March 31, 2013
4. Description: The objective of this class contribution is to enable the remediation of contaminated sediment in eight Areas of Concern (AOCs), to fully restore and remove these sites from the list of Great Lakes AOCs, and advance clean-up efforts to restore Lake Winnipeg and Lake Simcoe. Transfer payments made under the Program will be in the form of contributions to a broad range of entities to support the remediation of contaminated sediment in Great Lakes AOCs and/or rehabilitation measures that reduce nutrient loads to Lake Winnipeg and Lake Simcoe and their tributaries including: domestic or international non-profit organizations, provincial and municipal governments, regional conservation authorities, Canadian individuals, businesses, post-secondary institutions, First Nations and Aboriginal organizations and associations.
5. Strategic Outcome: Canada’s natural capital is restored, conserved and enhanced.
6. Results Achieved:
- Under the Lake Winnipeg Basin Stewardship Fund, a public advisory committee was established to oversee and provide project funding recommendations for stewardship projects. By the end of 2009–2010, two funding rounds had been completed and 14 projects had been funded to reduce pollutants, particularly nutrients loads, in priority areas of the Lake Winnipeg Basin, with recommended projects for a third round awaiting approval. (grants and contributions [G&C] spending in 2009–2010 of $583,000).
- Under the Lake Simcoe Clean-up Fund, in the second two rounds of funding, a total of twenty-six new projects were approved to receive a total of $4.73 million as part of an overall investment of $30 million over five years, which was announced in February 2008 to restore Lake Simcoe. This funding supports projects by federal, provincial and municipal governments, as well as the conservation authority, non-governmental and community organizations, and landowners. The projects contribute to meeting the Government of Canada's Lake Simcoe Clean-up Fund objectives of reducing rural and urban non-point sources of pollution, rehabilitating priority habitats to restore the health of the aquatic ecosystem and coldwater fishery in Lake Simcoe, and improving information and monitoring for decision makers. (G&C spending in 2009–2010 of $6.01 million)
- Under the Great Lakes Contaminated Sediment Removal Program, based on assessment of project status at AOCs, funds were reallocated to future years and to projects via the Annual Reference Level Update process. AOCs where projects are proceeding more slowly than expected are Thunder Bay, Peninsula Harbour and Randal Reef. However, the Detroit River project was completed in FY 2008–2009 at a cost of $0.2M (G&C) from Environment Canada. In FY 2009–2010, G&C funding ($50K) was provided for the Niagara River Lyon’s Creek East contaminated sediment management project.
| 7. Actual Spending 2007-2008 |
8. Actual Spending 2008-2009 |
9. Planned Spending 2009-2010 |
10. Total Authorities 2009-2010 |
11. Actual Spending 2009-2010 |
12. Variance(s) | |
|---|---|---|---|---|---|---|
| 14. Total Grants | 0 | 0 | 0 | 0 | 0 | 0 |
| 14. Total Contributions | 0 | 2.1 | 10.9 | 11.1 | 6.6 | 4.3 |
| 14. Total Other Types of Transfer Payments | 0 | 0 | 0 | 0 | 0 | 0 |
| 15. Total Program Activity(ies) | 0 | 2.1 | 10.9 | 11.1 | 6.6 | 4.3 |
16. Comment(s) on Variance(s):
- Lake Winnipeg Stewardship Fund: Total Authority was $956,000 followed by reprofiling to 2011–2012, leaving planned spending for 2009–2010 at $607,000, of which all but $23,000 was spent.
- Lake Simcoe: $573,000 was reprofiled from fiscal year 2009–2010 to 2010–2011, bringing planned spending down to $6.01 million, which was spent.
- Great Lakes: Total authority in 2009–2010 was $2.99 million followed by reprofiling to future fiscal years and vote transfers between O&M and G&C; final planned spending in 2009–2010 was $50,000, which was spent.
17. Audit completed or planned: The Lake Winnipeg Basin Initiative was included in the freshwater resources audit undertaken in 2009–2010 by the Commissioner of the Environment and Sustainable Development, Office of the Auditor General (audit report pending). An audit and evaluation of the Great Lakes Contaminated Sediment Removal Program will be conducted as per the Program Evaluation Plan developed by Environment Canada’s Audit and Evaluation Branch. The proposed date of the audit and evaluation is not known at this time.
18. Evaluation completed or planned: A third-party program evaluation will be conducted for the Lake Winnipeg and Lake Simcoe initiatives (2010–2011).
1. Name of Transfer Payment Program: National Vehicle Scrappage Program - Contributions
2. Start date: April 1, 2007
3. End date: March 31, 2011
4. Description: The National Vehicle Scrappage Program is primarily a contribution program that provides funding to a national not-for-profit organization for program delivery and incentives to encourage Canadians to retire their old, high-polluting personal vehicles
5. Strategic Outcome: Canadians and their environment are protected from the effects of pollution and waste
6. Results Achieved:
- About 64,000 old, high-polluting vehicles of model year 1995 and earlier were retired through the program, known as Retire Your Ride, resulting in a reduction of 2900 tonnes of smog-forming emissions.
- Canadians in every province were offered one of a selection of rewards for retiring their older vehicles, including $300 cash, free transit passes, rebates on a bicycle or replacement vehicle, car sharing membership, etc. The cash reward is the most popular incentive, selected by 86% of participants.
- In August 2009, vehicle manufacturers began to offer program participants rebates ranging in value from $500 to $3000 on the purchase of one of their new vehicles. These rebates have had a significant and positive impact on program participation.
- About 300 recyclers (or 17% of the known Canadian automobile recycling companies) are collecting vehicles retired through Retire your Ride. To participate in the program, vehicle recyclers must respect Environment Canada’s national code of practice, which outlines environmental requirements for processing retired vehicles. Training sessions for participating vehicle recyclers were held across the country, and an on-line training tool was implemented.
| 7. Actual Spending 2007-2008 |
8. Actual Spending 2008-2009 |
9. Planned Spending 2009-2010 |
10. Total Authorities 2009-2010 |
11. Actual Spending 2009-2010 |
12. Variance(s) | |
|---|---|---|---|---|---|---|
| 14. Total Grants | 0 | 0 | 0 | 0 | 0 | 0 |
| 14. Total Contributions | 0.2 | 4.6 | 35.1 | 35.1 | 25.8 | 9.3 |
| 14. Total Other Types of Transfer Payments | 0 | 0 | 0 | 0 | 0 | 0 |
| 15. Total Program Activity(ies) | 0.2 | 4.6 | 35.1 | 35.1 | 25.8 | 9.3 |
16. Comment(s) on Variance(s): Amount set aside in contribution agreements was not entirely spent by recipients. An amount of $7,165,000 has been reprofiled to fiscal year 2010-11. Moreover, some expenditures related to the Vehicle Scappage program are also presented under the “Contributions to support environmental and sustainable development initiative.
17. Audit completed or planned: Third-party recipient audit of financial report until September 2009 to be completed in Summer 2010.
18. Evaluation completed or planned: Third-party program evaluation to be completed by March 31, 2011.
Up-Front Multi-Year Funding
- Sustainable Development Technology Canada
- Federation of Canadian Municipalities Green Municipal Fund
- Nature Conservancy of Canada
- Canadian Foundation for Climate and Atmospheric Sciences
- Clayoquot Biosphere Trust
1. Name of Recipient: Sustainable Development Technology Canada (SDTC)
2. Start Date: March 2001 (SD Tech Fund™) and April 2007 (NextGen Biofuels Fund™)
3. End Date: June 2015 (SD Tech Fund™) and September 2027 (NextGen Biofuels Fund™)
4. Total Funding: $1.05 billion* ($550 M for SD Tech Fund™ and $500M for NextGen Biofuels Fund™) shared equally between Natural Resources Canada and Environment Canada.
* Environment Canada’s share is one-half or $550 M.
5. Description: SDTC is a not-for-profit foundation created by the Government of Canada. It finances and supports development and demonstration of clean air technologies that provide solutions to issues related to climate change, clean air, water and soil quality, delivering economic, environmental and health benefits to Canadians. SDTC operates two funds aimed at development and demonstration of innovative technological solutions:
- SD Tech Fund™ - To stimulate the development and demonstration of Canadian technologies aimed at climate change, clean air, clean water and clean soil;
- NextGen Biofuels Fund™ - to establish first-of-kind large demonstration-scale facilities producing next-generation renewable fuels.
6. Strategic Outcome(s): Canadians and their environment are protected from the effects of pollution and waste
7. Summary of Results Achieved by the Recipient:
- SD Tech Fund™
In 2009**, under the SD Tech Fund™, SDTC announced that 33 projects were approved for funding, with SDTC providing $114M or 34% of the total eligible project value of $336M. In 2009, under the SD Tech Fund™, SDTC saw the completion of another 7 projects, for a total of 33 since the Foundation’s inception. Since its inception, the SD Tech Fund™ has announced $463M for 183 projects, for a total project value of $1.6 billion and the potential for 7 to 17 megatonnes of CO2 emission reductions annually by 2015. Project disbursement payments from the SD Tech Fund™ are expected to increase with the number of completed projects. Disbursement payments are projected to be $70M in 2010 and $100M in 2011, compared to $47M in 2009 and $42M in 2008. As of December 2009, $172M had been disbursed under the SD Tech Fund™. As required by legislation, SDTC submitted the annual report documents on time to Environment Canada and Natural Resources Canada and posted these on the SDTC website, making them available to the public. - NextGen Biofuels Fund™
Under the new NextGen Biofuels Fund™, SDTC received one formal application in 2008. Currently, SDTC is tracking 100 companies as potential applicants, but there were no allocations in 2009. (See also Supplementary Table “Details of Transfer Payment Programs” for NextGen Biofuels Fund™)
** Unless specified otherwise, SDTC yearly results and data refer to calendar year as per SDTC annual reports.
| 8. Actual Spending 2007-2008 |
9. Actual Spending 2008-2009 |
10. Planned Spending 2009-2010 |
11. Total Authorities 2009-2010 |
12. Actual Spending 2009-2010 |
13. Variance(s) |
|---|---|---|---|---|---|
| 1.6 | 31.5 | 12.5M*** | 0**** | 0 | 0 |
***Planned spending 2009-2010 has been restated to reflect Environment Canada's planned contribution of $12.5 M to SDTC. The 2009-2010 Report on Plans and Priorities data inadvertently included, in this column, 2009-2010 Foundation planned allocations: SD Tech Fund: $100 Million; NGBF: $200-250 Million.
****The $12.5M that was appropriated by Parliament in 2009–2010 was reprofiled forward to 2010–2011.
15. Comments on Variance(s): The $ 12.5 million for the NextGen Biofuels Fund was reprofiled from 2009-2010 to 2010-2011 because anticipated payments to projects have been delayed by the proponents.
16. Significant Evaluation findings by the recipient during the reporting year and future plan: As per the Funding Agreement Three for the SD Tech Fund™, SDTC has conducted an independent third party interim evaluation which is the second of its kind since the Fund’s inception. The evaluation report was submitted on June 30, 2009, and covered operations up to December 31, 2008. The evaluation concluded that the Fund is meeting its purposes and objectives and no major adjustments to the program are required. An "Evaluation by Canada" is optional at any time. For NextGen Biofuels Fund™, there was no evaluation in 2009. The first of three interim evaluations for NextGen Biofuels Fund™ is required in November 2012.
17. Significant Audit findings by the recipient during the reporting year and future plan: A "Value-for-money (Performance) Audit" for the SD Tech Fund™ was initiated by the government in FY 2009–2010 (which is equivalent to once every 5 years as per Funding Agreement Three). Results will be reported, upon completion of the audit, in FY 2010–2011. In addition, a standard financial audit was completed as required for the financial data in the SDTC Annual Report.
18. URL to Recipient’s Website: www.sdtc.ca
1. Name of Recipient: Federation of Canadian Municipalities (FCM) Green Municipal Fund (GMF); formerly known as the Green Municipal Enabling Fund and the Green Municipal Investment Fund
2. Start Date: February 2000
3. End Date: In perpetuity
4. Total Funding: $550 million (Environment Canada's share is $275 million)
5. Description: The Green Municipal fund is a $550 million revolving fund, administered by the Federation of Canadian Municipalities (FCM), that supports grants, loans and loan guarantees to encourage investment in environmental municipal infrastructure. The Government of Canada endowed the FCM with the $550 million and this amount was fully paid out in prior years.
The priorities of the GMF are to have a positive impact on the health and quality of life of Canadians by reducing greenhouse gas emissions, improving local air, water and soil quality, and promoting the use of renewable resources by supporting environmental studies and projects within the municipal sector. Eligible projects may include one or more of the following categories of activity: energy; water; waste; sustainable transportation; brownfields and integrated community projects. Of the total amount of this fund, $150 million is to be used exclusively to provide loans for the cleanup and redevelopment of brownfields.
The amount of GMF financing available to municipalities is directly related to the environmental benefits and/or innovation of the projects undertaken, with grant-loan combinations of up to 80 percent of eligible costs available for projects with exceptional environmental benefits.
The GMF is co-funded equally by Natural Resources Canada and Environment Canada, which manage the fund at arm's length, creating a strong partnership between the FCM and the Government of Canada. The FCM Board of Directors, formally designated as the decision-making body for the funds, is advised by a 15-member council that includes five federal appointees. The council plays a key role, supported by the FCM Secretariat and the GMF Peer Review Committee.
6. Strategic Outcome(s): Canadians and their environment are protected from the effects of pollution and waste
7. Summary of Results Achieved by the Recipient: Findings on the results achieved by the recipient are available in the recipient's annual report.
| 8. Actual Spending 2007-2008 |
9. Actual Spending 2008-2009 |
10. Planned Spending 2009-2010 |
11. Total Authorities 2009-2010 |
12. Actual Spending 2009-2010 |
13. Variance(s) |
|---|---|---|---|---|---|
| - | - | N/A | - | - | - |
15. Comments on Variance(s): N/A
16. Significant Evaluation Findings by the Recipient During the Reporting Year and Future Plan: Section 11.05 of the Funding Agreement stipulates that the FCM agrees to obtain and make public and forward to each Minister, for tabling in Parliament, an independent review using recognized evaluation standards according to the following timeline: an initial review within six months following March 31, 2009; and subsequent reviews every five years from the date of the first review.
An independent review, conducted by KPMG, observed that, since its inception, the GMF has made, and continues to make important contributions towards supporting municipalities in achieving their sustainable environmental and infrastructure objectives. Funding recipients have realized environmental, economic, and social benefits, resulting in numerous success stories to date. The report, entitled Review of the Green Municipal Fund – Final Review Report, September 25, 2009, is available on the recipient’s website.
17. Significant Audit Findings by the Recipient During the Reporting Year and Future Plan: Section 11.05 of the Funding Agreement stipulates that the FCM agrees to have carried out an independent performance (value-for-money) audit to ensure the economy, efficiency and effectiveness with which funds have been used. An initial review must be carried out within six months following March 31, 2009, and subsequent reviews every five years from the date of the first review.
An independent performance (value-for-money) audit, conducted by KPMG, found that the GMF has implemented and follows practices and processes to achieve the audit objectives that help ensure the economy, efficiency and effectiveness of funds used. The report, entitled Performance Audit of the GMF – Final Audit Report, September 25, 2009, is available on the recipient’s website.
18. Recipient's Site: http://www.sustainablecommunities.fcm.ca
1. Name of Recipient: Nature Conservancy of Canada (NCC)
2. Start Date: March 2007
3. End Date: In perpetuity (until the total funding is expended)
4. Total Funding: $225 million
5. Description: The Nature Conservancy of Canada works to ensure the long-term protection of biodiversity by placing funds into a stewardship endowment to support the ongoing management and restoration of habitat and the recovery of species at risk. The Conservancy focuses on working with private landowners to secure ecologically significant lands that have been identified as priorities for conservation action. To that effect, the Conservancy acquires and preserves land through one of four methods: land purchase, land donations, conservation easements or relinquishment of rights. The goal of the program is to secure 200 000 hectares of private land for conservation.
6. Strategic Outcome(s): Canada’s natural capital is restored, conserved and enhanced
7. Summary of Results Achieved by the Recipient: As of the end of December 2009, the Conservancy has drawn $145.6 million under the federal allocation (equivalent to 65% of the total Natural Areas Conservation Program (NACP) funding available). To date, the Conservancy and its partners have raised more than $96 million in matching funds and pledges from private and other public sources, and received donations of conservation lands and easements valued at $132 million from private landowners, for a total of $228 million. The Conservancy and its partners have already reached the goal to match the federal investment of $225 million over the life of the program. The Conservancy and its partners have now secured more than 138 600 hectares of land, through more than 630 land transactions. These lands are found in every province and provide habitat for at least 79 species at risk.
| 8. Actual Spending 2007-2008 |
9. Actual Spending 2008-2009 |
10. Planned Spending 2009-2010 |
11. Total Authorities 2009-2010 |
12. Actual Spending 2009-2010 |
14. Variance(s) |
|---|---|---|---|---|---|
| 70.2 | 46.1 | 0.0 | 29.3 | 29.3 | (29.3) |
15. Comments on Variance(s): This conditional grant was fully accounted for in the 2006–2007 fiscal year. Payments made under the grant are based on the Conservancy’s fiscal year, which commences on July 1. Installments under the grant were $70.2 million in 2007–2008, $46.1 million in 2008–2009 and $29.3 million in 2009–2010.
16. Significant Evaluation Findings by the Recipient During the Reporting Year and Future Plan: The second annual progress report, spanning April 1, 2007, to June 30, 2009, was received from the Conservancy on December 22, 2009, and was deemed to be satisfactory. Under the grant, program evaluations are to be carried out no less frequently than every five years from the date of the agreement and when the funding has been expended.
17. Significant Audit Findings by the Recipient During the Reporting Year and Future Plan: A financial audit, dated June 30, 2009, was conducted by Ernst & Young to inform the second annual progress report on the program, spanning July 1, 2008, to June 30, 2009. The auditor’s report indicated that “...the financial statements present fairly, in all material respects, the financial position of the Fund as at June 30, 2009, and the results of its operations and its cash flows for the year then ended in accordance with Canadian generally accepted accounting principles … except for the effect of adjustments, if any, which we might have determined to be necessary had we been able to obtain detailed supporting documentation for expenses incurred by Ducks Unlimited Canada” as per the sub-agreement between the Conservancy and Ducks Unlimited Canada.
18. URL to Recipient’s Site: www.natureconservancy.ca
1. Name of Recipient: Canadian Foundation for Climate and Atmospheric Sciences (CFCAS)
2. Start Date: February 2000
3. End Date: March 2012
4. Total Funding: $110 million (a one-time $60 million grant to be disbursed over six years was received in 2001; a second grant of $50 million to be disbursed by the end of March 2011 was received in 2004); the Minister of the Environment approved a one-year no-cost extension to CFCAS’s mandate, which will allow the Foundation to operate until March 31, 2012.
5. Description: To invest strategically in excellent university-based research in climate and atmospheric sciences to do the following:
- provide relevant scientific information to support federal policymaking;
- generate better knowledge of climate change and its impacts on the natural environment;
- provide results to help Canada respond to its international environmental commitments; and
- ensure a supply of skilled human resources to meet future environmental challenges.
6. Strategic Outcome: Weather and environmental predictions and services reduce risks and contribute to the well-being of Canadians
7. Summary of Results Achieved by the Recipient: In the fiscal year 2009–2010, the Foundation actively supported 12 research networks and 77 projects. The outputs of these initiatives and research were showcased during the year at workshops and conferences. In addition, a workshop on data management was held in November 2009 to discuss data archiving and accessibility of the Foundation’s funded networks. The Foundation also funded 14 short-term outreach projects and supported, or was involved in, various international programs and organizations. These activities demonstrated the continued commitment of the Foundation to developing and disseminating new knowledge and expertise in relevant areas of national priority, which is consistent with the federal Science and Technology Strategy, Mobilizing Science and Technology to Canada’s Advantage.
| 8. Actual Spending 2007-2008 |
9. Actual Spending 2008-2009 |
10. Planned Spending 2009-2010 |
11. Total Authorities 2009-2010 |
12. Actual Spending 2009-2010 |
13. Variance(s) |
|---|---|---|---|---|---|
| 0 | 0 | 0 | 0 | 0 | 0 |
15. Comments on Variance(s): N/A
16. Significant Evaluation Findings by the Recipient during the Reporting Year and Future Plan: The Foundation tracks the progress, management and outputs of networks and projects through meetings, reports and audits. An independent program evaluation for the Foundation was completed in March 2010, which indicated that the Foundation has contributed well and remains relevant to developing expertise in the area of climate and atmospheric science, and that it was able to achieve the intended outputs from its program. The evaluation also indicates that the Foundation has contributed to transferring knowledge gained from research to the international science community, which provides an indication of the impact of the research that it has supported.
17. Significant Audit findings by the Recipient During the Reporting Year and Future Plan: The Foundation received independent audit reports on its financial status in fiscal year 2009–2010. The financial audit indicates that the Foundation had good financial controls and that the reporting of its financial position as at March 31, 2010, regarding the results of its operation and its cash flows in FY 2009–2010, were in accordance with accounting principles generally accepted in Canada.
18. URL to Recipient’s Website: www.cfcas.org
1. Name of Recipient: Clayoquot Biosphere Trust (CBT)
2. Start Date: February 2000
3. End Date: In perpetuity
4. Total Funding: $12 million
5. Description: Creation of an endowment fund for the Clayoquot Biosphere Trust (CBT)—the cornerstone of the Clayoquot Sound UNESCO Biosphere Reserve. The CBT uses the income from the endowment fund to support local research and education in the Biosphere Reserve region.
6. Strategic Outcome(s): Canada’s natural capital is restored, conserved and enhanced
7. Summary of Results Achieved by the Recipient: The CBT has successfully focused on its core priorities of Healthy Food, Healthy Communities; Youth and the Biosphere; and the Biosphere Centre. The CBT has also secured additional revenue through external funding sources. Projects funded during 2009 help build local capacity for community action and respond to specific needs in the core priority areas. These projects included a Clayoquot Sound Biosphere Reserve economic analysis; Healthy Food, Healthy Communities workshops; a Clayoquot Biosphere Region Food Action Plan project; and a Cha-me-ta-Ha-uuk Hesquiaht project. In addition, the CBT provided grants to local schools to help them leverage funds for Biosphere-related projects and funded First Nations youth participation at a Parks Canada conference on protected places. During 2009, the CBT engaged in larger projects with a greater diversity of partners and made significant progress in establishing collaborative ventures with federal, provincial and local organizations, including other NGOs and foundations.
| 8. Actual Spending 2007-2008 |
9. Actual Spending 2008-2009 |
10. Planned Spending 2009-2010 |
11. Total Authorities 2009-2010 |
12. Actual Spending 2009-2010 |
13. Variance(s) |
|---|---|---|---|---|---|
| 0 | 0 | 0 | 0 | 0 | 0 |
15. Comments on Variance(s): N/A
16. Significant Evaluation Findings by the Recipient during the Reporting Year and Future Plan: Realignment of the annual call for projects to the beginning of the fiscal year resulted technically in a skipped year of funding during the worst of the recession. However, the CBT still contributed over $65,000 in grants and contracts to eligible local organizations through the 2008 call for projects and multi-year funding commitments from 2006. The Clayoquot Biosphere Trust Society (the Society) operated with four volunteer advisory committees instead of five during 2009. The Community Development Committee was disbanded in favour of new approaches for improved local capacity building.
In the midst of a market downturn, the CBT continued to exercise what fiscal restraint it could in 2009 without jeopardizing its relevance and effective functioning in the community. External fundraising efforts on the part of staff and board members has resulted in steady progress in offsetting increasingly reduced monthly dividend withdrawals from the fund.
17. Significant Audit Findings by the Recipient during the Reporting Year and Future Plan: As per the CBT’s audited financial statements, the funding agreement obligation at December 31, 2009, was $14,697,093. This is represented by the original federal contribution of $12,000,000 plus a cumulative cost of living allowance adjustment of $2,697,093 for inflation using the Consumer Price Index. The cost of living allowance requirements of the federal funding agreement must be met within a three-year period, with the exception of the first period beginning on May 5, 2000, and ending on December 31, 2003. At December 31, 2009, the funding agreement obligation was not adequately funded when the market value of the endowment fund is considered. (2009 market value of investments being $13,034,386 less funding agreement obligation of $14,697,093 = 2009 funding agreement deficit of $1,662,707). While this is largely due to market conditions beyond the control of the Society, the CBT is taking actions to improve the financial health of the endowment fund as markets continue to gain strength. These actions include reducing the monthly withdrawals from $40,000.00 to $35,000.00; pursuing relevant grants and funding programs to offset operational and program expenses currently funded through the endowment; implementing a donor strategy and pursuing individual and corporate donations; and reducing annual operational expenses while maintaining effective and efficient performance in support of the UNESCO Biosphere Reserve designation.
18. URL to Recipient’s Website: www.clayoquotbiosphere.org
Horizontal Initiatives
- Canadian Group on Earth Observations
- Implementation of the Species at Risk Act
- Great Lakes Basin Ecosystem Initiative
- The Federal Contaminated Sites Action Plan
- Clean Air Agenda
1. Name of Horizontal Initiative: Canadian Group on Earth Observations (CGEO)
2. Name of Lead Department(s): Environment Canada
3. Lead Department Program Activity: Weather and environmental predictions and services reduce risks and contribute to the well being of Canadians.
4. Start Date of the Horizontal Initiative: July 2003
5. End Date of the Horizontal Initiative: Ongoing
6. Total Federal Funding Allocation (start to end date): No new funds—annual multi-departmental contributions
7. Description of the Horizontal Initiative (including funding agreement): Interdepartmental coordination of Canada's participation in the international Group on Earth Observations (GEO) to advance coordinated, comprehensive and sustained Earth observations in Canada. The initiative is funded through annual interdepartmental transfers and in-kind contributions.
8. Shared Outcome(s):
- Enhancing access to global Earth observation data and science to meet Canadian environmental and socio-economic monitoring requirements
- Maximizing the effectiveness of Canadian investments in Earth observation networks, both domestic and international
- Improving evidence-based decision making in operational and policy domains based on coordinated, comprehensive and sustainable Earth observations
9. Governance Structure(s):
- Assistant Deputy Ministers (ADM) Steering Committee (Chair: Assistant Deputy Minister for the Meteorological Service of Canada)
- Directors General (DG) Interdepartmental Coordination Committee
| 10. Federal Partners | 11. Federal Partner Program Activity (PA) | 12. Names of Programs for Federal Partners | 13. Total Allocation (from Start to End Date) | 14. Planned Spending for 2009-2010 |
15. Actual Spending for 2009-2010 |
16. Expected Results for 2009-2010 |
17. Results Achieved in 2009-2010 |
|---|---|---|---|---|---|---|---|
| Environment Canada | Canadians are informed of, and respond appropriately to, current and predicted environmental conditions. Canadian Group on Earth Observations (CGEO) established to: a) coordinate Canada’s participation in the intergovernmental Group on Earth Observations (GEO); b) advance coordinated, comprehensive and sustained Earth observations in Canada. Transfers and in-kind contributions. A small interdepartmental secretariat is funded through annual inter-departmental transfers and in-kind contributions. |
Weather and Environmental Monitoring | Not available | $145K salary $75K O&M $88K G&C |
$180K salary $46K O&M $88K G&C |
The Global Earth Observation System of Systems (GEOSS) leverages interdepartmental and global partnerships and efforts in science, monitoring, prediction and service to improve access to Earth observations for better-informed decisions leading to societal benefits for all Canadians. | - Active interdepartmental engagement in participation in GEO Plenary in Washington. - Hosted Coastal Zones Forum and Community of Practice day at Canadian Embassy following GEO Plenary in Washington. - Hosted International GEO Workshop on Synthetic Aperture Radar (SAR) in Kananaskis, Alberta, including training of representatives from developing countries. - Interdepartmental team engaged to continue the development of the Federal Earth Observation Strategy. - Progress made with CGEO working committees (Soil Moisture Way Forward proposal prepared, Communities of Practice active). - CGEO actively engaged in GEOSS in the Americas. - Bilateral activities with the US. - Active participation of Canadian experts in GEO tasks and activities, committees, working groups and task forces. |
| Natural Resources Canada | Canadian Group on Earth Observations | Earth Sciences Sector | Not available | 0.2 FTE in-kind $50K O&M in-kind |
As above | ||
| Canadian Group on Earth Observations | Canadian Forest Service | Not available | 0.3 FTE in-kind $10K O&M in-kind |
||||
| Agriculture and Agri-Food Canada | Canadian Group on Earth Observations | Science and Technology | Not available | 35K O&M | $15K O&M .75 FTE in kind $75K O&M in-kind |
As above | |
| Canadian Group on Earth Observations | Agri-Environment Services Branch | Not available | $20K O&M .75 FTE $75K O&M in-kind |
||||
| Canadian Space Agency | Canadian Group on Earth Observations | Earth Observations | Not available | 40K O&M | $40K O&M .5 FTE in kind $50K O&M in-kind |
As above | |
| Fisheries and Oceans Canada | Canadian Group on Earth Observations | Science and Technology | Not available | .3 FTE in kind $30K O&M in-kind |
As above | ||
| Health Canada | Canadian Group on Earth Observations | Radiation | Not available | 5K O&M | $5K O&M .3 FTE in kind $30K O&M in-kind |
As above | |
| Statistics Canada | Canadian Group on Earth Observations | Agriculture | Not available | .5 FTE in kind $50K O&M in-kind |
As above | ||
| Foreign Affairs and International Trade Canada | Canadian Group on Earth Observations | Environment | Not available | .1 FTE in kind $10K O&M in-kind |
As above | ||
| Canadian International Development Agency | Canadian Group on Earth Observations | Not available | 100K O&M | $98K O&M | As above | ||
| Total | $180K Salary $224K O&M $88K G&C 3.7 FTE in kind $380K O&M in-kind |
||||||
18. Comments on Variances:
19. Results to be achieved by non-federal partners: Not applicable
20. Contact information:
Michael Crowe,
Director
Strategic Integration, Meteorological Service of Canada
Environment Canada
141 Laurier Ave W.
Ottawa, ON
K1A 0H3
613-943-5580
1. Name of Horizontal Initiative: Implementation of the Species at Risk Act
2. Name of Lead Department(s): Environment Canada
3. Lead Department Program Activity: Biodiversity is conserved and protected
4. Start Date of the Horizontal Initiative: 2000
5. End Date of the Horizontal Initiative: Ongoing (some sunsetting resources ending in 2011–2012)
6. Total Federal Funding Allocation (start to end date): Ongoing resources plus a total of $125 million (from 2007–2008 to 2011–2012) in sunsetting resources across departments
7. Description of the Horizontal Initiative (including funding agreement): This horizontal initiative supports the development and implementation of the National Strategy for the Protection of Species at Risk and the Species at Risk Act (SARA) that came fully into force in June 2004. Environment Canada, Fisheries and Oceans Canada and Parks Canada are the departments/agency responsible for the protection of species at risk under federal jurisdiction. They all received funds from Treasury Board in 2000 for the "Implementation of the National Strategy for the Protection of Species at Risk and their Critical Habitat", in 2003 for the "Implementation of the Act respecting the protection of wildlife species at risk in Canada" and in 2007 for "Delivering results under the Species at Risk Act ".
8. Shared Outcome(s):
- Implementation of SARA
- Protection of species at risk
- Protection of biodiversity
9. Governance Structure(s):
-
Formal Governance Structure:
- Canadian Endangered Species Conservation Council (CESCC) - federal, provincial and territorial ministers responsible for wildlife
-
Federal officials committees:
- Deputy Ministers (DM) Committee - DMs from Environment Canada, Fisheries and Oceans Canada and Parks Canada responsible for species at risk
- Assistant Deputy Ministers (ADM) Committee – ADMs from Environment Canada, Fisheries and Oceans Canada and Parks Canada responsible for species at risk
- Director General (DG) Operations Committee – DGs from Environment Canada, Fisheries and Oceans Canada and Parks Canada Agency responsible for species at risk
-
Supporting and Advisory Structures:
- Species at Risk Advisory Council (SARAC) – Committee established to facilitate consultation with industry and environmental groups
- Canadian Wildlife Directors Committee (CWDC) – federal, provincial and territorial directors responsible for wildlife
- National Aboriginal Council on Species at Risk (NACOSAR) – NACOSAR is comprised of 6 representatives of the Aboriginal peoples of Canada, whose role is to provide advice to the minister on the administration of the act and provide advice and recommendations to CESCC.
| 10. Federal Partners | 11. Federal Partner Program Activity (PA) | 12. Names of Programs for Federal Partners | 13. Total Allocation (from Start to End Date) | 14. Planned Spending for 2009-2010 |
15. Actual Spending for 2009-2010 |
16. Expected Results for 2009-2010 |
17. Results Achieved in 2009-2010 |
|---|---|---|---|---|---|---|---|
| 1. Environment Canada | PA1 – Biodiversity and Wildlife Program Lead PA | a – Environment Canada Species at Risk Program | Ongoing (Some sunsetting resources ending in 2011–2012 | $59,900,000 | $47,763,000 | General administration of SARA, including production of the Annual Report to Parliament. Preparation for and participation in Parliamentary five-year review of SARA and as required, Minister's Roundtable | Administration of SARA, including production of the Annual Report to Parliament. Prepared for and participated in Parliamentary five-year review of SARA |
| 2. Fisheries and Oceans Canada | PA1 – Healthy and Productive Aquatic Ecosystems Lead PA | a – Fisheries and Oceans Canada Species at Risk Program | $26,000,000 | $21,829,940 | Respond to recommendations from the SARA Minister's Round Table (SARA s.127) | A report from the Round Table, outlining the Minister’s response to the recommendations received, was posted on the Species at Risk Public Registry on July 7, 2009 | |
| 3. Parks Canada | PA2 – Heritage Resources Conservation Lead PA | a – Parks Canada Species at Risk Program | $14,100,000 | $18,370,800 | Finalization and implementation of policies | Completed first draft of the Federal Policy Suite and conducted public consultations Analytical work to support departmental operational guidance on the identification of critical habitat and the issuance of permits under SARA Progress made on the development of guidance documents |
|
| Continued implementation of the SARA evaluation action plan | Near completion of the SARA evaluation action plan | ||||||
| Ongoing administration of contribution funding programs, including: Habitat Stewardship Program (HSP), Aboriginal Funds for Species at Risk (AFSAR), Interdepartmental Recovery Fund (IRF) | HSP, AFSAR, and IRF programs administered and funding provided | ||||||
| Preparation of COSEWIC Assessments | Ministerial response statements to COSEWIC Assessments prepared | ||||||
| Continued work to finalize bilateral agreements with provinces and territories | Continued work to finalize bilateral agreements with provinces and territories and administrative agreements with other federal departments, including interdepartmental Memorandum of Understanding with National Defence | ||||||
| Consultations on listing and recovery strategies | Consultations were undertaken on proposed additions to Schedule 1, listing and recovery strategies including critical habitat Consultations also took place on management plans and actions plans |
||||||
| Regulatory initiatives, as required, including addition of species to the List of Wildlife Species at Risk | Regulatory initiatives completed with Governor in Council Orders to add species to the List of Wildlife Species at Risk | ||||||
| Preparation of recovery strategies | Recovery strategies, management plans, and actions plans were posted on the SAR public registry Revised guidance material was developed on the preparation of recovery strategies to better reflect SARA requirements |
||||||
| Development of outreach material, including SARA enforcement and compliance promotion | Material for Outreach developed and used for SARA enforcement and compliance promotion Production and implementation of the Parks Canada -Prevention Guidelines promoting compliance through awareness and understanding of SAR and their habitat Trained law enforcement officers |
||||||
| Responding to legal challenges | Responded to legal challenges Also responded to court’s decision on Sage Grouse (identifying critical habitat) and collaborated in developing materials and submissions for Killer Whale and Nooksack Dace court cases. |
||||||
| Other results | Evaluation and analysis of DFO data to support the preparation of species status reports by the Committee on the Status of Endangered Wildlife in Canada (COSEWIC) Development of a preliminary model for risk based approach to formulating departmental recommendations on the listing of species under SARA Implemented recovery actions and restoration initiatives to help recover species at risk |
||||||
| Total | Ongoing | $100,000,000 | $87,963,740 | ||||
18. Comments on Variances:
- From EC: The amount lapsed is due to a lag in staffing vacant positions and a shift of SARA funds to support complementary wildlife program activities. Progress has been made in staffing new positions but more work is required to complete staffing appointments.
The shift of A-based SARA funds to support complementary activities in other wildlife programs, including protected areas and migratory bird programs, was also necessary this fiscal year.
From DFO: Variance is primarily due to temporary re-allocation of resources to other departmental priorities.
From PC : Funds carried forward from 2008–2009 have been allocated to appropriate national parks and national historic sites with significant species at risk for action on the ground initiatives (recovery activities and restoration) and for completion of legal requirements in the delivery of recovery strategies.
19. Results achieved by non-federal partners:
- Assessment and reassessment of species, sub-species and populations by the Committee on the Status of Endangered Wildlife in Canada (COSEWIC)
- In addition to the federal government’s achievements, there was development of recovery strategies by provinces and territories, and with involvement of experts from academia and non-governmental organizations
- Protection of important or critical habitat through the Aboriginal Funds for Species at Risk, which supports the participation of Aboriginal peoples in the protection and recovery of species at risk , including efforts to protect critical habitat
- Stewardship activities for the protection of species at risk habitat were carried out by public and private sector partners, and by other government departments and agencies, with funding from the Habitat Stewardship Program and the Interdepartmental Recovery Fund
20. Contact information:
Mary Taylor
Director
Conservation Service Delivery and Permitting Division
Canadian Wildlife Service
Environment Canada
819-953-9097
Mary.Taylor@ec.gc.ca
Susan Humphrey
Regional Director
Ontario Region
Canadian Wildlife Service
Environment Canada
416-739-5882
Susan.Humphrey@ec.gc.ca
1. Name of Horizontal Initiative: Great Lakes Basin Ecosystem Initiative
2. Name of Lead Department(s): Environment Canada
3. Lead Department Program Activity: Ecosystems Initiatives Program
4. Start Date of the Horizontal Initiative: April 1, 2005 (Great Lakes Action Plan [GLAP] IV resources)
5. End Date of the Horizontal Initiative: March 31, 2010 (expiry of GLAP IV resources)
6. Total Federal Funding Allocation (start to end date): $40 million over five years (GLAP IV resources, plus departmental A-base)
7. Description of the Horizontal Initiative (including funding agreement): The Great Lakes Basin Ecosystem Initiative (GLBEI) is Environment Canada’s mechanism for coordinating efforts to restore and maintain the chemical, physical and biological integrity of the Great Lakes Basin Ecosystem, and ensure delivery of federal commitments as expressed in the Canada-U.S. Great Lakes Water Quality Agreement. Environment Canada uses the Canada-Ontario Agreement Respecting the Great Lakes Basin Ecosystem (COA) to engage other federal departments and Ontario in delivering Canada’s Great Lakes Water Quality Agreement commitments.
The GLBEI reflects Budget 2005 investments targeted at continuing the work under the Great Lakes Action Plan to improve the ecological integrity of the Great Lakes Basin Ecosystem. A total of $40 million over five years was allocated in GLAP IV to continue the environmental restoration of key aquatic Great Lakes Areas of Concern. Federal departments also use A-base resources to support their efforts towards achieving COA results.
8. Shared Outcome(s): The Great Lakes Water Quality Agreement establishes broad, long-term objectives for Canada and the United States in restoring and protecting the Great Lakes. COA provides a short-term plan for achieving Canada’s Great Lakes Water Quality Agreement commitments. Through the COA, federal and provincial agencies are guided by a shared vision of a healthy, prosperous and sustainable Great Lakes Basin Ecosystem for present and future generations. The COA also establishes a common purpose and shared goals, results and commitment in four priority areas: restoration of Areas of Concern; reduction of harmful pollutants; achievement of lake and basin sustainability; and coordination of monitoring, research and information.
9. Governance Structure(s): Eight federal departments are engaged in delivering GLBEI results under the COA: Environment Canada, Fisheries and Oceans Canada, Agriculture and Agri-Food Canada, Natural Resources Canada, Parks Canada, Transport Canada, Infrastructure Canada and Health Canada.
The COA Management Committee is the senior federal-provincial management body responsible for setting priorities, establishing strategies to ensure delivery of the COA, and developing common positions and joint action plans for representing Canadian interests and engaging in cooperative initiatives with the United States agencies and the International Joint Commission.
Planning, prioritization and allocation of GLAP IV monies is managed through the federal Great Lakes Executive Committee, which involves the eight federal signatories to COA. The role of the Committee is to approve strategic directions and priorities for GLAP IV work activities, and to coordinate federal positions, strategies and initiatives in support of binational activities and discussions.
| 10. Federal Partners | 11. Federal Partner Program Activity (PA) | 12. Names of Programs for Federal Partners | 13. Total Allocation (from Start to End Date) | 14. Planned Spending for 2009-2010 |
15. Actual Spending for 2009-2010 |
16. Expected Results for 2009-2010 (See Appendix at end of document for COA Results Statements) |
17. Results Achieved in 2009-2010 |
|---|---|---|---|---|---|---|---|
| Environment Canada | Ecosystems Initiatives Program | COA | $37.5 million GLAPIV, plus departmental A-base | $2.4 million GLAPIV, plus $2.1 million departmental A-base | $4.9 million GLAPIV, plus $3.3 million departmental A-base | All COA Results, except Ann. 2–3.2 | See below. |
| Fisheries and Oceans Canada | Healthy and productive aquatic ecosystems | COA | $2.5 million GLAPIV, plus departmental A-base | $445,000 GLAPIV, plus $5.164 million departmental A-base | $437,100 GLAPIV, plus $5.45 million departmental A-base | Ann. 1-2.4; Ann. 1-2.6; Ann. 3-1.2; Ann. 3-1.3; Ann. 3-1.4; Ann. 3-3.1; Ann. 3-3.2; Ann. 3-4.1; Ann. 3-4.2; Ann. 3-5.1; Ann. 4-1.1; Ann. 4-2.2. | See below. |
| Agriculture and Agri-Food Canada | Health of the environment | Growing Forward | $57 million for environment and climate change from April 1, 2008 to March 31, 2013 | $8–10 million | $11 million | Ann. 1-1.2; Ann.1-2.2; Ann. 2-2.3; Ann. 3-1.2; Ann. 3-1.4; Ann. 3-2.2; Ann. 4-1.1; Ann. 4-2.2 | See below. |
| Natural Resources Canada | Canada is a world leader on environmental responsibility in the development and use of natural resources | Port Hope Long term Low-level Radioactive Waste Mgmt. Project | Departmental A-base and C-base | $675,000 | $545,000 | Ann. 1-2.3; Ann. 3-1.4; Ann. 3-2.4 | See below. |
| CFS Forest Harvesting in Riparian Zones | |||||||
| Ecosystem risk management: Canada understands and mitigates risks to natural resource ecosystems and human health | CFS Pesticides Program | ||||||
| Parks Canada | Conserve heritage resources | COA | Departmental A-base | $0 | $0 | Ann. 3-1.1; Ann. 3-1.2; Ann. 3-1.3; Ann. 3-2.2; Ann. 3-3.2; Ann. 3-3.3; Ann. 4-1.1; Ann. 4-2.2. | See below. |
| Transport Canada | Environmental Protection and Remediation; the Canadian Ballast Water Program | COA | Departmental A-base | $507,000 | $507,000 | Ann. 3-1.3; Ann. 3-2.1; Ann. 3-4.1; Ann. 3-4.2 | See below. |
| Infrastructure Canada | Infrastructure funding programs | The building Canada plan (Building Canada Fund, Provincial-Territorial Base Fund, and Gas Tax Fund), the Green Infrastructure Fund, as well as sunsetting programs (Canada Strategic Infrastructure Fund, Municipal Rural Infrastructure Fund). | No COA allocation | No COA allocation | No COA allocation | INFC supports the objectives of the COA with particular emphasis on Annex items Ann. 1-1.1; Ann. 1-2.1. | See below. |
| Health Canada | Healthy environments and consumer safety | COA | Departmental A-base | No A-base funding. COA commitment incorporated in CMP initiatives. | $*** | Ann. 2-3.2 | See below. |
| TOTAL GLAPIV (plus departmental funding) |
$19.291-21.291 million | $26.1391 million | |||||
*For Infrastructure Canada, exact figures are not available. Projects that are to be funded may be determined through a competitive, merit-based process, through joint federal-provincial discussions, or the Minister of Transport, Infrastructure and Communities may accept an Annual Capital Plan describing these.
**Infrastructure Canada is committed to attaining the objectives of the COA with particular emphasis on Annex items Ann. 1.2-1; Ann. 3-6.1; however, INFC employs its own project selection process to ensure that projects selected for funding meet specific eligibility criteria.
***Great Lakes Public Health Network (GLPHN) activities such as webinars and workshops are supported with funds from Canada’s Chemicals Management Plan (CMP)
17. Results Achieved in 2009–2010:
Specific Results by Department:
Environment Canada
Work continued to achieve progress in restoration of Great Lakes Areas of Concern (AOCs), including the following:
- Environmental restoration is now complete in the Wheatley Harbour AOC—a major achievement. The originally impaired beneficial uses, related to fish and wildlife populations, water quality, sediment impacts and habitat, have been restored. The Stage 3 Report documenting these achievements was reviewed and accepted by the International Joint Commission, and then finalized and released. A formal event to announce Canada’s decision to delist the AOC and celebrate this achievement took place in Wheatley Harbour in April 2010.
- All priority actions have been implemented in the St. Lawrence River (Cornwall) AOC. A draft Stage 3 Report is being prepared and will describe the results of monitoring to confirm the restoration of beneficial uses. Community consultations are ongoing and a decision is expected in 2010–2011 on whether to delist the Area of Concern or recognize it as an Area in Recovery.
- The Great Lakes Sustainability Fund supported studies leading to improved water quality through improved management of municipal wastewater. These projects focused on the reduction of solids, nutrients and bacteria from wet weather flows (combined sewer overflows and stormwater) in the St. Mary’s River, Bay of Quinte, Niagara River and Toronto Region AOCs.
Work continued to achieve a better understanding of the state and trends in the Great Lakes Ecosystem. Environment Canada worked with universities and other government agencies on many water and wildlife research projects, including:
- Finalized and distributed: The State of the Great Lakes 2009 Highlights and Technical reports, and the Nearshore Areas of the Great Lakes report.
- Consistent with the National Action Plan, the Lake Superior Lakewide Management Plan partners drafted a binational Aquatic Invasive Species Complete Prevention Plan.
- Supported community projects in the eastern Georgian Bay Littoral Biosphere Reserve, Nottawasaga Valley and the Bayfield North Gullies through the Lake Huron-Georgian Bay Watershed – A Canadian Framework for Community Action, part of the Lake Huron Binational Partnership.
- Collaborated with partner agencies in fieldwork and data collection on Lake Erie under the binational Cooperative Science and Monitoring Initiative. The Lake Erie Lakewide Management Plan (LaMP) State of Nutrient Science Report was completed, as were draft phosphorus targets. These will facilitate development of the Lake Erie Binational Nutrient Management Strategy.
- Completed the Lake Ontario Biodiversity Conservation Strategy to protect 24 significant coastal shorelines and watersheds across Lake Ontario.
Work continued to reduce the release of harmful substances (Annex 2). Environment Canada worked on a variety of activities and projects, including:
- Achieved progress towards development of a Canadian framework to identify and prioritize substances of emerging concern in the Great Lakes.
- Outreach activities to citizens in Thunder Bay were continued and offered to other Lake Superior north shore communities on the safe disposal of unused and expired pharmaceutical products.
- A national wastewater monitoring program was initiated in support of Canada’s Chemicals Management Plan to improve understanding of the occurrence and fate of emerging contaminants in municipal wastewater treatment processes and to determine if control measures are needed to prevent these substances from entering the municipal wastewater system. This program included five wastewater treatment plants discharging directly into the Great Lakes or a Great Lakes tributary.
- Achieved progress towards reaching the Great Lakes Binational Toxics Strategy’s PCB challenge goals, primarily through implementation of the new Canadian PCB Regulations (SOR/2008-273, September 5, 2008).
- Continued to monitor levels of dioxins in the environment, maintained its release inventory, collaborated with the U.S. to reduce uncontrolled combustion sources such as burn barrels, and launched a modeling study to better understand the transboundary impacts associated with releases of dioxins/furans from North American and global sources.
- Made available its report on the testing of newer U.S. EPA certified woodstoves, which confirmed that these have lower benzo(a)pyrene (BaP) emission factors than predicted.
- Released, with the U.S. EPA, the Great Lakes Binational Toxics Strategy December 2008 Status Report, summarizing binational efforts to address Level 1 substances and progress made to broaden the Strategy’s scope to encompass substances of emerging concern.
Fisheries and Oceans Canada
Work continued to conduct science, enhance fish habitats and control the negative impacts of established invasive species. Projects included:
- Conducted field trials of sea lamprey pheromones and trapping to control the spawning of sea lamprey populations.
- Constructed and maintained barriers to block the migration of sea lampreys
- Developed indices of Biotic Integrity and Habitat Productivity to evaluate the diversity and biomass components of productive capacity of nearshore fish populations in Hamilton Harbour and the Bay of Quinte.
- Developed fish habitat classification and supply models to measure the success of habitat restorations in Hamilton Harbour, Toronto Harbour and the Bay of Quinte.
- Continued long-term assessment of food web status in the Bay of Quinte and Hamilton Harbour.
- Supported restoration of fish habitat by working with other agencies on integrated initiatives.
Agriculture and Agri-Food Canada
Work continued to improve beneficial agriculture management practices with involvement of the Great Lakes farming community in numerous projects, including:
- Under agreement with Ontario, delivered the Canada-Ontario Environmental Farm Plan and Canada-Ontario Farm Stewardship Programs to farmers, which resulted in province-wide implementation of 1200 Environmental Farm Plans and 1800 on-farm Beneficial Management Practice projects in 2009–2010.
Natural Resources Canada
Work continued towards the achievement of sustainable development of Canada’s energy, forestry and mineral metals resources within the Great Lakes Basin, including:
- Enhanced policies and practices to mitigate forestry impacts on creeks and rivers.
- Enhanced accuracy of pesticide applications to forests to reduce impacts on aquatic organisms.
- Led the design of the waste management facilities to manage Port Hope area historic low-level radioactive wastes, following anticipated licensing decisions by the Canadian Nuclear Safety Commission in 2009 and 2011.
Parks Canada
Delivers the National Parks and National Marine Conservation Areas Programs and works to develop and maintain a viable protected areas network in the Great Lakes Basin that is relevant to Canadians. Projects included:
- Worked with the Canadian Wildlife Service and others to plan and implement actions to protect and rehabilitate Great Lakes waterfowl, shore and marsh birds, wetlands and associated habitats.
- Worked with the Fisheries and Oceans Canada to support the rehabilitation of Lake Superior native species.
Transport Canada
Work continued to ensure compliance with Canada Shipping Act, 2001 regulations related to the ecosystem health of the Great Lakes. Transport Canada undertook a wide variety of inspection, monitoring and training programs, including such projects as:
- Boarded vessels entering the Great Lakes to ensure compliance with ballast water regulations.
- Carried out biological analysis and evaluation of vessels targeted in the Joint Boarding Program.
- Supported Canadian firms interested in the development of ballast water technology programs compliant with the International Maritime Organization’s Ballast Water Discharge Standards.
Infrastructure Canada
Work continued towards providing funding to eligible infrastructure projects in support of a cleaner environment, including improved wastewater treatment, among other objectives. Under the Communities Component of the Building Canada Fund, as well as through the Infrastructure Stimulus Fund, federal funding has been announced for numerous wastewater infrastructure projects located in communities near the Great Lakes.
In 2009–2010, under the Major Infrastructure Component of the Building Canada Fund, as well as the Green Infrastructure Fund, a total of $264.6 million in federal funding was announced in support of nine projects located in communities near the Great Lakes.
Health Canada
Work continued to enhance environmental health knowledge within the Great Lakes Basin that can be integrated into policies to address risks to human health by all levels of government. Projects included:
- Supported and facilitated the development of environmental public health networks in the Great Lakes Basin.
- The Great Lakes Public Health Network (GLPHN) organized an environmental health surveillance workshop for staff from federal, provincial, and municipal governments in February 2010 in Toronto, Ontario.
- Implemented activities to address substances identified under Canada’s Chemicals Management Plan that are of concern within the Great Lakes Basin.
- Developed a Health Science Framework to guide and facilitate health science research activities specifically for Great Lakes Basin populations.
18. Comments on Variances:
ENVIRONMENT CANADA: Dedicated Great Lakes funding (GLAPIV) is received only by Environment Canada and Fisheries and Oceans Canada, who also each contribute departmental A-base resources towards achieving results under COA. All other partners to COA (federal and provincial) achieve COA results via departmental funding.
NATURAL RESOURCES CANADA: Actual spending is less than planned for 2009–2010 as result of delays in approval of contracting authority for the Port Hope Long-Term Low-Level Radioactive Waste Management Project.
PARKS CANADA: Figures for planned and actual spending are not available as Parks Canada financial coding systems are not designed to separate out Great Lakes-specific activities.
HEALTH CANADA: Health Canada supports work for the Great Lakes Basin Ecosystem Initiative through the joint Environment Canada/Health Canada Chemicals Management Plan. Specific resource figures are not available as this spending is not tracked separately in Health Canada's financial system.
INFRASTRUCTURE CANADA: Federal infrastructure funding programs do not include an allocation specific to COA.
19. Results achieved by non-federal partners (if applicable):
20. Contact information:
Jennifer McKay
Manager, Great Lakes Environment Office
Environment Canada
416-739-5712
Appendix – COA Results Statements
PRIORITY 1 – AREAS OF CONCERN
Result 1.1 – Reduce microbial and other contaminants and excessive nutrients from industrial or municipal wastewater to achieve delisting targets in Nipigon Bay and St. Lawrence River (Cornwall) AOCs.
Result 1.2 – Reduce microbial and other contaminants and excessive nutrients from rural non-point sources to meet delisting criteria in the St. Lawrence River (Cornwall) AOC.
Result 1.3 – Contaminated sediment management strategies developed for the Wheatley Harbour AOC and implemented in the St. Lawrence River (Cornwall) AOC.
Result 1.4 – Plans in place and being implemented to rehabilitate fish and wildlife habitats and populations to meet delisting targets in the Wheatley Harbour and St. Lawrence River (Cornwall) AOCs.
Result 1.5 – Informed, effective collaboration among government, communities and individuals to prioritize and complete actions required for delisting and confirming environmental recovery in Nipigon Bay, Jackfish Bay, Wheatley Harbour and St. Lawrence River (Cornwall) AOCs.
Result 1.6 – Environmental monitoring and reporting to document improvements and track environmental recovery.
Result 2.1 – Reduce microbial and other contaminants and excessive nutrients from municipal sewage treatment plants, combined sewer overflows, urban stormwater and industrial wastewater towards delisting targets in St. Marys River, St. Clair River, Detroit River, Niagara River, Hamilton Harbour, Toronto and Region, and Bay of Quinte AOCs.
Result 2.2 – Reduce microbial and other contaminants and excessive nutrients from rural non-point sources towards achieving Remedial Action Plan (RAP) delisting criteria in St. Clair River, Detroit River, Niagara River, Hamilton Harbour, and Toronto and Region AOCs.
Result 2.3 – Progress made in developing sediment management strategies to reduce ecological and human health risk from contaminated sediments in Thunder Bay, Peninsula Harbour, St. Marys River, St. Clair River, Detroit River, Niagara River, Hamilton Harbour, Port Hope and Bay of Quinte AOCs.
Result 2.4 – Long-term management plans being developed and priority actions for delisting being implemented for rehabilitation and protection of fish and wildlife habitats and populations in St. Marys River, St. Clair River, Detroit River, Niagara River, Hamilton Harbour, Toronto and Region, and Bay of Quinte AOCs.
Result 2.5 – Informed, effective collaboration amongst government, communities and individuals to prioritize and complete actions required for delisting and confirming environmental recovery in AOCs.
Result 2.6 – Identify monitoring needs, undertake required studies and evaluate results to assess environmental recovery and support remediation strategies in AOCs.
PRIORITY 2 - HARMFUL POLLUTANTS
Result 1.1 - Reduction in releases of Tier 1 substances beyond the 2005 achievements towards the goal of virtual elimination.
Result 2.1 - Reduction in releases of Criteria Air Pollutants.
Result 2.2 - Coordinated activities to reduce releases from municipal wastewater.
Result 2.3 - Develop and initiate a program for the Sound Management of Chemical Substances in the Great Lakes Basin.
Result 3.1 - Improved understanding of the sources, fate and impacts of harmful pollutants in the Great Lakes Basin.
Result 3.2 - Human Health risks from harmful pollutants are understood and addressed in the Great Lakes Basin
PRIORITY 3 - LAKE AND BASIN SUSTAINABILITY
Result 1.1 - Increased awareness and appreciation of the Great Lakes and their contributions to social, economic and environmental well-being.
Result 1.2 - Increased stewardship actions that work towards a balance between human well-being and prosperity, and healthy aquatic ecosystems.
Result 1.3 - Sustainable use of land, water and other natural resources to provide benefits from the Great Lakes now and in the future.
Result 1.4 - Enhanced knowledge about beneficial and harmful impacts of human activities on Great Lakes aquatic ecosystems and resources
Result 2.1 - Reduce microbial and other contaminants and excessive nutrients from industrial and municipal wastewater, combined sewer overflows and urban stormwater sources consistent with actions specified in binational Lakewide Management Plans (LaMPs) and binational lake action plans.
Result 2.2 - Reduce microbial and other contaminants and excessive nutrients from rural sources by undertaking actions specified in the binational Lakewide Management Plans and binational lake action plans.
Result 2.3 - Identification of contaminated sediment and development of sediment management plans to reduce the release and impact of sediment-bound contaminants on the Great Lakes Basin Ecosystem.
Result 2.4 - Enhanced knowledge about beneficial and harmful impacts of human activities on Great Lakes water quality.
Result 3.1 - Great Lakes aquatic ecosystems and habitats are protected, restored and sustained consistent with binational Great Lakes planning.
Result 3.2 - Progress on rehabilitation of Great Lakes native species to restore the health of aquatic ecosystems, consistent with binational Great Lakes planning.
Result 3.3 - Enhanced knowledge about beneficial and harmful impacts of human activities on Great Lakes aquatic ecosystems, habitats and species.
Result 4.1 - Implementation of the National Action Plan to Address the Threat of Aquatic Invasive Species in the Great Lakes.
Result 4.2: Enhanced knowledge about the harmful impacts of aquatic invasive species on Great Lakes aquatic ecosystems, food webs and species.
Result 5.1 - The impacts of climate change on the Great Lakes ecosystem composition, structure, and function, including biodiversity (organisms and their habitat), water quality and quantity, human health and safety (including access to clean drinking water), social well-being and economic prosperity, are understood by governments and the Great Lakes community.
Result 6.1 - The potential risks to Great Lakes drinking water intakes are identified and assessed, and early actions to address risks are undertaken
Result 6.2 - Develop knowledge and understanding of water quality and quantity issues of concern to the Great Lakes as drinking water sources.
PRIORITY 4 - COORDINATION OF MONITORING, RESEARCH AND INFORMATION
Result 1.1 – Responsive and comprehensive monitoring and research programs.
Result 2.1 – Improved reporting on environmental conditions, changes and progress
Result 2.2 – Increased sharing of data and information among governments, organizations and Basin residents.
1. Name of Horizontal Initiative: The Federal Contaminated Sites Action Plan (FCSAP), approved March 2005 (which succeeded the two-year Federal Contaminated Sites Accelerated Action Plan [FCSAAP]).
2. Name of Lead Department(s): Environment Canada and Treasury Board of Canada Secretariat
3. Lead Department Program Activity: Canadians and their environment are protected from the effects of pollution and waste (Environment Canada); Management Policy Development and Oversight (Treasury Board of Canada Secretariat)
4. Start Date of the Horizontal Initiative: FCSAP has been in effect since April 2005. Former two-year FCSAAP commenced April 2003.
5. End Date of the Horizontal Initiative: FCSAP is expected to continue until 2020. However, the current policy approval ends March 31, 2011.
6. Total Federal Funding Allocation (start to end date): $1,775.5 million (including Public Works and Government Services Canada accommodations charges) to March 31, 2011
7. Description of the Horizontal Initiative (including funding agreement): The Federal Contaminated Sites Action Plan (FCSAP) provides a long-term mechanism to address federal contaminated sites having the highest human health and ecological risks. At the end of March 2004, federal contaminated sites represented a financial liability of approximately $3.5 billion. Although responsibility for the actual management and remediation of federal contaminated sites rests with responsible custodial departments, the overall program is administered jointly by Environment Canada and the Treasury Board of Canada Secretariat.
8. Shared Outcome(s): Reduce federal financial liability and risks to human health and the environment, including fish habitat. Increase public confidence in the overall management of federal real property through the effective risk management or remediation of individual federal contaminated sites.
9. Governance Structure(s): Federal Contaminated Sites Assistant Deputy Ministers Steering Committee is supported by a Director Generals’ Committee, the Contaminated Sites Management Working Group (CSMWG) and the FCSAP Secretariat (at Environment Canada), which provides overall program coordination.
| 10. Federal Partners | 11. Federal Partner Program Activity (PA) | 12. Names of Programs for Federal Partners | 13. Total Allocation (from Start to End Date) | 14. Planned Spending for 2009-2010 |
15. Actual Spending for 2009-2010 |
16. Expected Results for 2009-2010 |
17. Results Achieved in 2009-2010 |
|---|---|---|---|---|---|---|---|
| Agriculture and Agri-Food Canada | Enterprise Activities | Asset Management | $5,465,649 | $877,000 | $810,595 | See below. | See below. |
| Canada Border Services Agency | Corporate Management and Direction | Infrastructure and Environment | $1,620,212 | $264,507 | $247,879 | See below. | See below. |
| Canadian Food Inspection Agency | NA | NA | $183,783 | $0 | $0 | NA | NA |
| Correctional Service Canada | Internal Services | Facilities/Asset Management Services | $10,368,090 | $2,817,669 | $895,361 | See below. | See below. |
| Environment Canada | Chemical Management Program | Risks to Canadians, their health and their environment posed by toxic and other harmful substances are assessed | $49,161,086 | $6,506,004 | $5,269,327 | See below. | See below. |
| Risks to Canadians and impacts on the environment posed by toxic and other harmful substances are managed | $44,900,126 | $6,640,375 | $5,463,939 | See below. | See below. | ||
| Subtotal | $94,061,213 | $13,146,379 | $10,733,266 | ||||
| Fisheries and Oceans Canada | Internal Services | Asset Management Services | $78,437,194 | $22,277,365 | $21,858,939 | See below. | See below. |
| Healthy and Productive Aquatic Ecosystems | Habitat Management | $21,665,285 | $3,335,637 | $3,163,138 | See below. | See below. | |
| Subtotal | $100,102,479 | $25,613,002 | $25,022,077 | ||||
| Health Canada | First Nations and Inuit Health | First Nations and Inuit Health Protection | $7,445,162* | $719,429 | $323,829 | See below. | See below. |
| Contaminated Sites | Healthy Environments, Consumer Safety Branch | $43,721,890 | $4,182,151 | $4,276,806 | See below. | See below. | |
| Subtotal | $51,167,052 | $4,901,580 | $4,600,635 | ||||
| Indian and Northern Affairs Canada | Responsible Federal Stewardship | Contaminated Sites Remediation | $148,254,393 | $48,873,812 | $36,810,343 | See below. | See below. |
| Northern Land and Resources | Contaminated Sites | $685,536,311 | $132,343,029 | $112,120,853 | See below. | See below. | |
| Subtotal | $833,790,704 | $181,216,841 | $148,931,196 | ||||
| Jacques Cartier and Champlain Bridges Incorporated | Management of federal bridge, highway and tunnel infrastructure, and properties in the Montréal area | NA | $955,672 | $358,938 | $94,552 | See below. | See below. |
| Marine Atlantic Inc. | Corporate Management | FCSAP (projects) | $120,000 | $50,000 | $29,148 | See below. | See below. |
| National Capital Commission | Real Asset Management | Land and real asset management | $8,600,052 | $2,295,000 | $2,295,000 | See below. | See below. |
| National Defence | Contribute to Canada and the international community | Contribute to the international community in accordance with Canadian Interests and Values | $380,070,345 | $57,133,697 | $62,030,559 | See below. | See below. |
| National Research Council Canada | Internal Services | Environmental Operations | $4,835,000 | $2,380,000 | $2,564,082 | See below. | See below. |
| Natural Resources Canada | Corporate Management | The provision of relevant and timely policy analysis and advice for decision making on government priorities and departmental responsibilities | $27,915,807 | $17,650,000 | $6,871,047 | See below. | See below. |
| Parks Canada | Conserve Heritage Resources | Active Management and Restoration | $38,814,369 | $11,653,802 | $10,577,140 | See below. | See below. |
| Public Works and Government Services Canada | Federal Accommodation & Holdings | FCSAP (projects) | $26,360,173 | $8,535,964 | $8,414,143 | See below. | See below. |
| FCSAP (expert services) | $5,450,000 | $900,000 | $816,334 | See below. | See below. | ||
| Subtotal | $31,810,173 | $9,435,964 | $9,230,477 | ||||
| Royal Canadian Mounted Police | Corporate Infrastructure | $23,100,214 | $5,797,330 | $4,974,127 | See below. | See below. | |
| Transport Canada | Policies, Programs and Infrastructure in Support of Sustainable Development | Environmental Programs | $150,768,925 | $30,628,840 | $21,200,981 | See below. | See below. |
| Treasury Board of Canada Secretariat | Management Policy Development and Oversight | Assets and Acquired Services | $2,747,200 | $480,229 | $479,039 | See below. | See below. |
| All Federal Partners (excluding PWGSC accommodations) |
$1,766,496,939 | $366,700,778 | $311,587,161 | ||||
16. Expected Results for 2009–2010:
Agriculture and Agri-Food Canada: Remediation / risk management for 1 project (1 site)
Canada Border Services Agency: Remediation / risk management for 1 project (1 site)
Correctional Service Canada: Remediation / risk management for 2 projects (2 sites)
Environment Canada (Custodian): Remediation / risk management for 4 projects (154 sites); assessment of approximately 445 sites
Environment Canada (Secretariat and Expert Support):
- Secretariat: Supports the Assistant Deputy Ministers Steering committee and Contaminated Sites Management Working Group (CSMWG), administers non-financial aspects of the program, including management of project selection process, and development and maintenance of secure website and reporting
- Expert Support: Provision of scientific and technical advice to custodial departments and the FCSAP Secretariat with respect to the ecological risk evaluation of federal contaminated sites; provision of ecological risk assessment training and guidance
Fisheries and Oceans Canada (Custodian): Remediation / risk management for 74 projects (108 sites); assessment of approximately 1014 sites
Fisheries and Oceans Canada (Expert Support): Provision of scientific and technical advice to custodial departments with respect to the risk management of federal contaminated sites; participation in the project submission process, including review of information provided by custodians; and technical tool development.
Health Canada (Custodian): Remediation / risk management for 7 projects (7 sites)
Health Canada (Expert Support): Provision of scientific and technical advice to custodial departments with respect to the human health risk management of federal contaminated sites; provision of human health risk assessment training and guidance; participation in the project submission process, including review of human health related information provided by custodians
Indian and Northern Affairs Canada (Indian and Inuit Affairs): Remediation / risk management for 37 projects (83 sites); assessment of approximately 2,797 sites
Indian and Northern Affairs Canada (Northern Affairs): Remediation / risk management for 27 projects (30 sites); assessment of approximately 55 sites
Jacques Cartier and Champlain Bridges Incorporated: Remediation / risk management for 1 project (1 site)
Marine Atlantic Inc.: Assessment of 1 site
National Capital Commission: Remediation / risk management for 3 projects (3 sites)
National Defence: Remediation / risk management for 42 projects (95 sites); assessment of approximately 44 sites
National Research Council of Canada: Remediation / risk management for 2 projects (2 sites); assessment of approximately 3 sites
Natural Resources Canada: Remediation / risk management for 1 project (6 sites); assessment of approximately 16 sites
Parks Canada: Remediation / risk management for 6 projects (7 sites); assessment of approximately 10 sites
Public Works and Government Services Canada (Custodian): Remediation / risk management for 10 projects (10 sites); assessment of approximately 20 sites
Public Works and Government Services Canada (Expert Support): Development of project management tools, dissemination of information on innovative technologies and technologies used at individual projects
Royal Canadian Mounted Police: Remediation / risk management for 4 projects (4 sites); assessment of approximately 2 sites
Transport Canada: Remediation / risk management for 15 projects (15 sites); assessment of approximately 4 sites
Treasury Board of Canada Secretariat: Ensures consistency with Treasury Board policies on management of federal contaminated sites, reviews financial aspects of proposals, administers fund and advises Environment Canada on monitoring of government-wide progress
17. Results Achieved in 2009–2010:
Agriculture and Agri-Food Canada: Remediation / risk management for 5 sites; assessments at 18 properties (32 sites).
Canada Border Services Agency: Soil and groundwater contamination at Port of Entry at Pleasant Camp, BC, has been significantly reduced by the in situ remediation system. Remediation “returns” declined significantly in 2009–2010 as the contamination plume contracted as predicted. Active in situ remediation was discontinued and the extent of the remaining contamination was quantified through a detailed site assessment. The site will be monitored as part of an ongoing risk management plan.
Correctional Service Canada: Remediation / risk management for 3 sites; assessment of 15 sites.
Environment Canada (Custodian): Remediation / risk management for 9 projects (58 sites); assessment of 46 properties (198 sites).
Environment Canada (Secretariat and Expert Support):
Secretariat:
- Prepared annual funding documents for ministerial approval;
- Developed and coordinated the 2000–2010 project submission process;
- Provided ongoing secretariat support to the Contaminated Sites Management Working Group (CSMWG) and the Federal Contaminated Sites Steering Committees;
- Implemented the first year of accelerated FCSAP activities under Canada’s Economic Action Plan (CEAP); and
- Undertook the development of the proposal for program renewal, for presentation to Cabinet in the fall of 2010–2011.
Expert Support:
- Provided scientifically sound guidance and expert advice to 19 custodial departments for the management of their sites so that risk to the environment is eliminated or minimized;
- Reviewed the eligibility requirements for more than 230 projects/sites to ensure that remediation / risk management projects are eligible for funding;
- Developed and provided national training to custodians on the review of ecological risk assessment reports and on quality assurance / quality control (QA/QC) measures that apply to contaminated sites;
- Completed or almost completed supplemental guidance documents on the ecological risk assessment of contaminated sites; and
- Developed, in collaboration with DFO, the FCSAP classification system for contaminated aquatic sites and a framework for addressing and managing these sites.
Fisheries and Oceans Canada (Custodian): Remediation / risk management for 167 projects (224 sites); assessment of 1547 sites.
Fisheries and Oceans Canada (Expert Support):
- Provided expert advice and guidance on remediation / risk management options on approximately 97 projects;
- Provided advice to ensure sustainability of local fish resource for approximately 261 projects;
- Provided input to the supplemental guidance documents on the ecological risk assessment of contaminated sites;
- Developed the FCSAP Aquatic Sites Classification System (ASCS) and developed and provided national training to the National Expert Support Team, Custodians and other stakeholders on the ASCS to ensure nationally consistent usage; and
- Developed a framework for addressing and managing aquatic contaminated sites under the FCSAP.
Health Canada (Custodian): Health Canada completed 3 Environmental Site Assessments (ESA) at 3 sites in BC and worked on 1 remediation project in Ontario and 2 in Manitoba.
Health Canada (Expert Support):
- The Contaminated Sites Division (CSD) of Health Canada provided expert advice and training on human health risk assessments , risk management and public involvement to custodial departments under the Federal Contaminated Sites Action Plan (FCSAP).
- Developed soil quality guidelines (SQG) and initiated protocol development for indoor dust and sediment.
- Developed guidance documents: (1) human health risk assessment guidance including preliminary and detailed risk assessment, vapour intrusion, Toxicity Reference Values (TRVs), peer review checklist, supplemental air guidance, model statement of work for risk assessment; (2) public involvement; and (3) site investigation.
- Supported research in the areas of bioaccessibility/bioavailability and other studies directly applicable to guideline development, human health risk assessment and risk management of contaminated sites in Canada.
- Reviewed projects and site submissions in order to determine the eligibility for funding.
Indian and Northern Affairs Canada (Indian and Inuit Affairs): Remediation for 160 sites; assessment of 111 sites.
Indian and Northern Affairs Canada (Northern Affairs): In 2009–2010, a Phase I site assessment was completed at 155 sites in the NWT. In addition, 21 sites completed both Phase I and II assessments in Nunavut. Finally, 16 sites completed Phase II/III assessments in 2009–2010. Therefore, the Program completed some form of assessment at 191 sites (155 on sites that have never been assessed before and 36 more rigorous assessments) in 2009–2010. In 2009–2010, 20 projects were considered to be in the remediation phase (step 8 or 9 of the FCSAP 10-step process).
Jacques Cartier and Champlain Bridges Incorporated: Completed site geotechnical and hydrogeological assessments and started the preparation of the detailed specifications (to be completed in 2010–2011)
Marine Atlantic Inc.: Completed an updated Phase I & Phase III ESA for the Bar Harbor (Maine) Ferry Terminal Site
National Capital Commission: Remediation / risk management for 5 projects (8 sites); assessment of 40 sites.
National Defence: Remediation / risk management for 60 projects (79 sites) and work completed on 9 sites; assessment of 54 projects (111 sites) and work completed on 31 sites.
National Research Council Canada: Remediation / risk management for 2 projects (2 sites); assessment of 5 sites
Natural Resources Canada: Remediation / risk management for 1 project (6 sites); assessment of 14 sites and 1 risk assessment.
Parks Canada: Remediation / risk management for 29 projects (41 sites); assessment of 46 projects (74 sites).
Public Works and Government Services Canada (Custodian): 34 environmental site assessments completed and 7 remediation / risk management projects completed.
Public Works and Government Services Canada (Expert Support): Assisted in the initial development of the Risk Reduction Indicator Tool and the Site Closure Process in association with Environment Canada Expert Support; delivered 5 training sessions at the Federal Contaminated Sites National Workshop; participated and engaged external service providers at Remtech; assisted in the organization, technical paper review, and acted as co-chair for the Federal Contaminated Sites National Workshop; annual maintenance of the Guidance and Orientation for the Selection of Technologies (GOST) and delivered 7 regional training sessions related to this tool; prepared innovative technology profiles, case studies, and developed associated marketing materials; development of FCSAP Demand Forecast for FY2010–2012; engagement in IRWGs and CSMWG; conducted consultations with key federal custodians on FCSAP Project Management tools and templates; continued development of the Sustainable Evaluation Tool with Environment Canada Expert Support and Sediment Costing Tool; Supported Environment Canada’s Expert Support by assisting in the development of the training material and retaining a consultant, to deliver a series of quality assurance / quality control (QA/QC) workshops; coordinated with other federal custodians in collective staffing processes.
Royal Canadian Mounted Police: Remediation / risk management for 9 projects (10 sites); assessment of 240 sites.
The results achieved are much greater than the expected results. The projects planned in 2009–2010 RPP were done at the end of 2008–2009 and preceded Canada’s Economic Action Plan (CEAP). Once CEAP went ahead and accelerated funding became available, many more assessment and remediation projects went ahead than were originally planned for in 2009–2010 Report on Plans and Priorities.
Transport Canada: in 2009–2010, Transport Canada undertook 26 remediation / risk management projects, of which 10 were accelerated under CEAP. Similarly, 48 environmental site assessment projects were undertaken, of which 33 were accelerated.
Treasury Board of Canada Secretariat:
- Supported the Environment Canada FCSAP Secretariat and custodians to ensure that development and implementation of the first year of accelerated FCSAP activities under Canada’s Economic Action Plan were consistent with Treasury Board policies on management of federal contaminated sites.
- Supported Environment Canada in the development of the proposal for program renewal, for presentation to Cabinet in the fall of 2010–2011.
- Reviewed financial aspects of proposals and administered the FCSAP fund.
- Administered the Federal Contaminated Sites Inventory.
- Coordinated planning for the May 2010 Federal Contaminated Sites National Workshop.
18. Comments on Variances:
Agriculture and Agri-Food Canada: Project expenditures were lower than the estimated costs. There were delays in staffing an employee for FCSAP contaminated sites program management.
Canada Border Services Agency:
Correctional Service Canada: Variance between CSC's planned and actual spending is $1,922,308. $250,000 was transferred to NRC in Supplementary Estimates B. $1,500,000 was carried forward to next fiscal year; $172,308 was lapsed. The main factor explaining the variance is that further assessments of potentially contaminated sites showed that the sites were much less contaminated than expected, resulting in lower remediation expenditures.
Environment Canada (Custodian): Variance between EC's planned and actual spending for2009–2010 is $1,236,677 of which $500,000 was transferred to Parks Canada in Supplementary Estimates C. The remaining variance of $736,677 can be attributed to northern and remote projects which were not carried out as planned due to unforeseen travel, timing, and weather issues. There were also other Environment Canada projects for which the actual costs were less than the planned budget.
Environment Canada (Secretariat and Expert Support): $1,176,436 was lapsed from the program as a result of staffing delays and delays in completion of contracts due in part to unforeseen work required to support program commitments under Canada’s Economic Action Plan.
Fisheries and Oceans Canada (Custodian): The actual expenditures for 2009–2010 differ from the approved amount for 2009–2010 as a result of a minor lapse in project dollars and salary. The minor lapse in project dollars is the result of projects coming in under budget, while the minor lapse in salary is the result of being unable to staff positions at the beginning of the fiscal year.
Fisheries and Oceans Canada (Expert Support): DFO-ES spent 95% of allocated funding, lapsing $172,499 in fiscal year 2009–2010.
Health Canada (Custodian): Projects: The completion of four remediation projects in Ontario did not proceed as planned as the First Nation communities did not sign Contribution Agreements for this work. The remediation projects were not priorities for the First Nation communities in 2009. One remediation project was to be completed when a new fuel tank system was to be installed. The installation was delayed and did not occur in 2009, and thus the remediation project was delayed as well.
*Funding: The department decided not to access $921,600 through a $1.8 million allocation Governor General’s Warrant, instead utilizing $617,272 in Health Canada (Non-FCSAP) Funds. This brings the Total Allocated FCSAP Funds (Start to End Date) in Column 13 to $6,746,051 ($7,445,162 minus $617,272).
Health Canada (Expert Support): The variance of $94,655 was cash-managed internally.
Indian and Northern Affairs Canada (Indian and Inuit Affairs): $10,075,158 was re-profiled and $1,988,311 was cash-managed as a result of a few high value remediation projects not proceeding as planned. The reasons were health and safety concerns on one major site, an unexpected election on another reserve, and conflicts of interest between INAC, the consulting firm and the First Nation.
Indian and Northern Affairs Canada (Northern Affairs): The department’s program had$112,120,853 of expenditures. A surplus of, $16,500,000 was re-profiled to 2010–2011 and $2,025,560 was requested for late re-profile; approval for the latter from Treasury Board and the Department of Finance is pending. In addition, the department lapsed $1,776,616.
Jacques Cartier and Champlain Bridges Incorporated: There were delays caused by the required additional investigation recommended by the consultant preparing the detailed specifications. The unexpended budget was re-profiled to 2010-2011.
Marine Atlantic Inc.: Project was submitted for tender and the consultants were able to complete the assessment within (below) the actual estimated budget.
National Defence: Increases in the “Planned Spending for 2009–2010” can be attributed to the extra $5 million transferred to National Defence (DND) from Natural Resources Canada (NRCan). For project management (PM) funds and assessment funds; $896,862 of the $1 million and $5,630,915 of the $6 million were spent, respectively. All remediation / risk management (R/RM) funds were spent, including the additional $5 million and remaining assessment funds, for a total of $55,502,782 ($50,133,697 planned + $5,000,000 extra from NRCan + $369,085 remaining assessment funds). Therefore, the total spent is $62,030,559 ($896,862 PM + $5,630,915 Assessment + $55,502,782 R/RM).
Increases in the number of projects and changes in the number of sites listed in “Expected Results for 2009–2010” can be attributed to the re-structuring of projects and related sites, as well as an increase in available funding (i.e., NRCan transfer of $5 million to DND) that allowed for additional work to be completed. Similarly, the number of sites reported included only those sites in which work was conducted or completed in 2009–2010.
National Research Council of Canada: NRC received $250,000 from CSC which was put toward remediation / risk management; $65,918 was lapsed.
Natural Resources Canada: $5,000,000 was transferred to the National Defence contaminated sites program and $5,778,953 was lapsed.
Parks Canada: PC received an extra $2,374,785 transferred from Environment Canada ($500,000), Transport Canada ($1,200,000) and the Royal Canadian Mounted Police ($674,785) in Supplementary Estimates C. An additional $1,091,210 was carried forward from 2008–2009 and $586,500 from previous multi-year submissions increased PC’s 2009–2010 planned spending to $15,706,297. PC carried forward $5,129,157 due to late staffing, project costs being less than anticipated and projects not carried out as planned due to unforeseen issues.
Public Works and Government Services Canada (Custodian): 99% of budget was expended. One percent variance due to the late cancellation of an assessment project.
Public Works and Government Services Canada (Expert Support): $83,666 was lapsed.
Royal Canadian Mounted Police: Where planned spending for 2009–2010 for the RCMP was $5,797,330, the actual spending was $4,974,127. The variance $823,203 can be explained by the following: two transfers to Parks Canada totalling $674,785 (one of $50,000 and the other of $624,785), a carry forward of program management funds of $130,200 and $18,218 in lapsed funds.
Transport Canada: $1,200,000 was transferred to Parks Canada through Supplementary Estimates; $600,753 of accelerated funds was lapsed; $7,627,106 of baseline funds will be requested to be re-profiled from 2009–2010 to 2011–2012.
Treasury Board of Canada Secretariat: TBS spent 99% of allocated funding, lapsing $1,190 in fiscal year 2009–2010.
19. Results achieved by non-federal partners (if applicable):
20. Contact information: FCSAP Secretariat, Contaminated Sites Division, 15th floor, Place Vincent Massey, 351 St. Joseph Blvd., Gatineau, QC K1A 0H3 819‑934-8153
Clean Air Agenda
| Lead Department |
Environment Canada |
|---|---|
| Lead Department Program Activity |
3.3 - Clean Air Program |
| Federal Theme Partners |
Natural Resources Canada, Transport Canada, Health Canada, Department of Foreign Affairs and International Trade, Indian and Northern Affairs Canada, Public Health Agency of Canada, National Research Council of Canada, Industry Canada, Human Resources and Skills Development Canada |
| Start Date |
April 1, 2007 |
| End Date | March 31, 2011 |
Description
Through the Clean Air Agenda (CAA), the Government of Canada has been working towards making tangible improvements in Canada's environment by addressing the challenges of climate change and air pollution1. Since 2007, the CAA has been supporting:
- Regulatory initiatives in the industrial, transportation, consumer and commercial sectors; and
- A range of complementary program measures designed to reduce greenhouse gas emissions, improve indoor air quality, mitigate the impacts of climate change, and engage at the international level.
The CAA is managed through a horizontal management, accountability and reporting framework. This framework facilitates comprehensive and systematic review of planning for and reporting on the financial and non-financial performance of CAA programming. Progress towards the CAA outcomes has been reported publically through this horizontal framework since 2007.
Since 2007, the CAA initial funding of $1.9 Billion has increased to $2.57 Billion. This funding is subject to renewal as of March 31, 2011 and subject to Government decisions to extend or enhance funding. The outcomes of these decisions will, therefore, be reflected in future budget exercises.
At the end of the third year (March 31, 2010) of its four year mandate, the cumulative actual spending for the first three years was $1,340.4 million2 against the cumulative planned spending of $1,553.8 million for the same period. Total planned spending for all federal partners in 2010-2011 is reported as $951.3 million3.
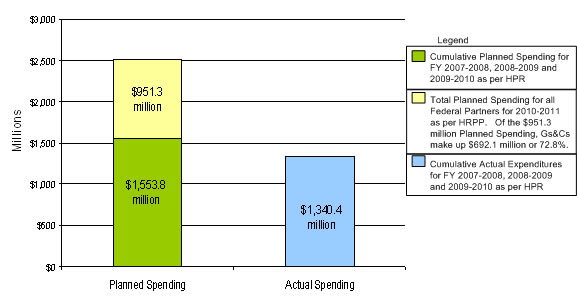
Notes:
1 Announcement of Canada’s emissions target under the Copenhagen Accord (February 1, 2009): http://www.ec.gc.ca/default.asp?lang=En&n=714D9AAE-1&news=EAF552A3-D287-4AC0-ACB8-A6FEA697ACD6
2 2007-2008, 2008-2009, 2009-2010 Clean Air Agenda Horizontal Performance Report available at http://www.tbs-sct.gc.ca/est-pre/index-eng.asp
3 2010-2011 Clean Air Agenda Horizontal Report on Plans and Priorities available at http://www.tbs-sct.gc.ca/est-pre/index-eng.asp
Shared Outcomes
The 45 programs of the CAA are organized within eight themes: clean air regulatory agenda, clean energy, clean transportation, indoor air quality, international actions, adaptation, partnerships, and management and accountability. The shared outcomes are:
- the health, economic and environmental benefits for Canadians have been realized;
- the risks to the health of Canadians and the environment resulting from exposure to air pollution have been reduced; and
- the risks to communities, infrastructure and to the health and safety of Canadians resulting from climate change have been reduced.
2009-2010 Achieved Results
For consolidated results of the CAA, please refer to Canada’s Performance Report 2009-2010 on the TBS website: http://www.tbs-sct.gc.ca/ppg-cpr/home-accueil-eng.aspx
For more detailed information on CAA results achieved in 2009-2010, the following reports detail results achieved at the Theme and Program Level.
2009-2010 Risks and Challenges
In moving the objectives of the Clean Air Agenda forward, the key challenges over 2009-2010 faced by CAA programming, included:
- Establishing for Canada a broad approach to climate change that remains flexible enough to align to the approach that will be followed in the US. This required undertaking foundational preparations for a number of possible policy approaches.
- Working with the impacts of the economic downturn which posed a challenge to some incentive programs (such as those in Clean Energy and Clean Transportation) as industrial participants were not in a position to take advantage of federal initiatives.
| Total Funding Approved under the CAA | Total Planned Spending in 2009-2010 | Total Actual Spending in 2009-2010 |
Actual Spending in 2009-2010 |
|---|---|---|---|
| $2,572,940,366* | $709,765,617 | $640,313,053 |
$231,653,448 (ecoENERGY Retrofit Program) |
*$18.5 million is included in total CAA approved funding to support Clean Air Regulatory programming and is forecast as planned spending in 2011-2012.
Contact information: Karen Turcotte, Executive Director, Clean Air Agenda Results Management Secretariat, Environment Canada, (819) 953-5842 Karen.Turcotte@ec.gc.ca
CLEAN AIR REGULATORY AGENDA THEME
- Industrial Sector Regulatory Actions - Environment Canada
- Transportation Sector Regulatory Actions - Environment Canada
- Transportation Sector Regulatory Actions - Transport Canada
- Transportation Sector Regulatory Actions - Natural Resources Canada
- Consumer and Commercial Products Regulatory - Environment Canada
- Consumer and Commercial Products Regulatory - Natural Resources Canada
- Indoor Air Quality Management Actions - Health Canada
- Science in Support of Regulatory Activities and Accountability - Environment Canada
- Science in Support of Regulatory Activities and Accountability - Health Canada
- Emissons Reporting - Environment Canada
- Emissons Trading - Environment Canada
- Enforcement Advice and Reporting on Progress - Environment Canada
- Policy Development, Analysis and Coordination - Environment Canada
- ecoENERGY for Buildings and Houses - Natural Resources Canada
- ecoENERGY Retrofit - Natural Resources Canada
- ecoENERGY for Industry - Natural Resources Canada
- ecoENERGY for Renewable Heat - Natural Resources Canada
- ecoENERGY for Renewable Power - Natural Resources Canada
- ecoENERGY for Technology Initiative - Natural Resources Canada
- Policy, Communications, Monitoring and Reporting - Natural Resources Canada
- ecoENERGY for Aboriginal and Northern Communities - Indian and Northern Affairs Canada
- ecoMobility - Transport Canada
- ecoTECHNOLOGY for Vehicles - Transport Canada
- National Harmonization Initiative for the Trucking Industry - Transport Canada
- Freight Technology Demonstration Fund - Transport Canada
- Freight Technology Incentives Program - Transport Canada
- ecoFreight Partnerships - Transport Canada
- Marine Shore Power Program - Transport Canada
- Analytical and Policy Support - Transport Canada
- ecoAuto Rebate Program - Transport Canada
- ecoAuto Rebate Program - Human Resources and Skills Development Canada
- ecoENERGY for Personal Vehicles - Natural Resources Canada
- ecoENERGY for Fleets - Natural Resources Canada
- Vehicle Scrappage - Environment Canada
- Radon Strategy - Health Canada
- Indoor Air Research and Development Initiative- National Research Council
- International Obligations - Environment Canada
- International Obligations - Department of Foreign Affairs and International Trade
- International Participation and Negotiation- Environment Canada
- International Participation and Negotiation - Department of Foreign Affairs and International Trade
- International Participation and Negotiation - Natural Resources Canada
- Asia-Pacific Partnership - Environment Canada
- Asia-Pacific Partnership - Natural Resources Canada
- Asia-Pacific Partnership - Industry Canada
- PM Annex - Environment Canada
- Canada - U.S. Clean Energy Dialogue (CED) - Environment Canada
- Canada - U.S. Clean Energy Dialogue (CED) - Department of Foreign Affairs and International Trade
- Canada - U.S. Clean Energy Dialogue (CED) - Natural Resources Canada
- Assist Northerners in Assessing Key Vulnerabilities and Opportunities - Indian and Northern Affairs Canada
- National Air Quality Health Index and Air Quality Forecast Program - Environment Canada
- National Air Quality Health Index and Air Quality Forecast Program - Health Canada
- Improved Climate Change Scenarios - Environment Canada
- Climate change and Health Adaptation in Northern/Inuit Communities - Health Canada
- Innovative Risk Management Tools/Regional Adaptation Action Partnerships - Natural Resources Canada
- Climate Change and Infectious Disease Alert and Response System to Protect the Health of Canadians - Health Canada
- Climate Change and Infectious Disease Alert and Response System to Protect the Health of Canadians - Public Health Agency of Canada
MANAGEMENT AND ACCOUNTABILITY THEME
Theme: Clean Air Agenda Regulatory Agenda (CARA)
| Lead Department |
Environment Canada |
|---|---|
| Federal Theme Partners |
Transport Canada, Natural Resources Canada, Health Canada |
Expected Results from Theme's Programming
Immediate Outcomes
- Industrial sectors meet emission levels of air pollutants and greenhouse gases (GHG) to comply with new or amended regulations by required dates.
- Canada's motor vehicles and engines fleet becomes increasingly more fuel efficient and cleaner as a result of new vehicle regulations to reduce fuel consumption and GHGs beginning in 2011 and new emission control standards applied to regulated modes of transportation and engines used and sold in Canada.
- Canadians have access to more environmentally safe and energy efficient products since products sold in Canada are designed and manufactured according to new energy efficiency and environmental regulations.
- Improvement of indoor air quality as new federal guidelines for levels of contaminants in indoor air and a national radon risk management strategy are widely deployed and publicized.
- Improved reporting for regulatees and compliance facilitated, as these processes are streamlined at the national level, with a single window reporting system and the establishment of flexible compliance mechanisms.
Intermediate Outcomes
- Canada 's emissions have been reduced from 2005 levels while maintaining competitiveness of Canadian regulated sectors
- for targeted air pollutants: mainly PM, NOx , SOx , VOCs and some specific such as NH3, Hg, benzene, PAHs, fluorides, and
- for GHGs (as CO2 equivalent)
Final Outcomes
- Human health and environmental quality are improved
- Due to reduced emissions of indoor and outdoor air pollutants, and GHGs.
2009-2010 Expected Achievements
See the 2009-2010 Horizontal Report on Plans and Priorities at: http://www.tbs-sct.gc.ca/rpp/2009-2010/CARA_Theme
2009-2010 Achieved Results
In support of the reduction of air emissions, progress was made with respect to advancing approaches to reducing GHG emissions from industrial sectors in the context of a North American cap-and-trade system, including the development of harmonization policy and support to decision-making through sound analysis and consultation. Also, a draft set of rules and guidance for Canada’s Offset System was published in June 2009.
Extensive economic analysis of Canada’s domestic and international climate change approaches was undertaken. Domestically, economic impact analyses of approaches to reduce emissions in selected sectors were undertaken to support key policy decisions and to support the development of Regulatory Assessment Impact Statements. With respect to international issues, analysis focused on the impacts of harmonizing with the United States (U.S.) approach and the impacts of adopting various international proposals which emerged prior to the Copenhagen climate change conference. Analysis of alternative options for a North American cap-and-trade regime was also undertaken.
Environment Canada (EC) has been working closely with provinces and territories as our approach to reducing GHG emissions continues to be developed. Agreements in Principle on climate change have been signed with Nova Scotia, Saskatchewan and British Columbia. Environment Canada has launched an Assistant Deputy Minister level working group to ensure federal, provincial and territorial coordination on domestic climate change approaches. EC led an extensive process with other federal departments, provinces, industry, and non-governmental organizations from a wide range of industrial activity sectors over several months, entailing an unprecedented level of collaboration with other levels of government and stakeholders to develop an integrated approach to improving air quality. A proposal for a Comprehensive Air Management System was finalized and submitted to federal, provincial and territorial Ministers for consideration.
In support of regulatory actions, scientific assessments of air pollutants, air quality, GHGs and climate change were undertaken extensively. These activities described emissions sources and trends, atmospheric concentrations of air pollutants and GHGs, their impacts on the environment and human health and the forecasted benefits of regulatory actions to
reduce air emissions. These assessments are the means by which the Government can determine whether the actions it and others have taken have been effective in reducing the risk to humans and their environment from air emissions. Furthermore, EC has expanded its monitoring activities, continued upgrade to data management and monitoring systems, enhanced its analytical capacity
and improved its capacity for air modelling forecasting. (Refer: Canada’s 2008 Greenhouse Gas Inventory: A Summary of Trends: 1990–2008: p. 1. http://www.ec.gc.ca/ges-ghg/0590640B-87F7-449A-AA8F-D5674A7BAC57/2010 Annual Summary of Trends.pdf)
In support of a more efficient and cleaner transportation sector, the Government of Canada completed stakeholder consultations on regulations for marine engines, off-road recreational vehicles, heavy-duty on-road and off-road diesel engines. Proposed regulations are being updated to maintain harmonization with the U.S.
Implementation of the vehicle and engine emission regulation has been ongoing, including emissions testing. The Government worked closely with the U.S. Environmental Protection Agency (US EPA) and Enforcement on regulatory administration activities to avoid duplication.
Notice of intent to develop GHG emission regulations under the Canadian Environmental Protection Act, 1999 for light-duty vehicles was published during the year.
The Government continued to support the Memorandum of Understanding (MOU) with the Railway Association of Canada on emission reductions in the rail sector. The MOU, in force from 2006 to 2010, has delivered substantial reductions in air pollutant emissions. In 2008, there was an improvement of 23.3% in the GHG emission intensity of total freight train operations, compared with the 1990 baseline.
In support of safer and energy efficient consumer product, two regulations controlling Volatile Organic Compounds (VOC) concentrations in automotive refinishing products and architectural coatings were finalized and will contribute to reduction in the formation of ground-level ozone and smog in Canada. Consultations and analysis was undertaken to inform the identification of the next group of consumer and commercial products to target for VOC reductions and inclusion in the longer term Federal Agenda for VOC reductions.
In support of improving air quality in Canadian households and buildings, 9,000 participants were recruited for the cross-Canada radon survey in 2009-2010. Kits were shipped out to the participants including instructions, a questionnaire and a radon detector and approximately 75% were returned after the 3 month testing period. The analysis of the radon detectors will be done by the National Radon Laboratory, along with analysis for the federal building testing projects.
Over 60 radon stakeholder engagements with Non-Governmental Organizations, the health professional, real estate and building industry, other departments and levels of government and the public were completed. Web traffic on the Health Canada (HC) radon pages increased by more than 50% and over 200,000 radon brochures were distributed across Canada. Radon information is available at all Service Canada centres across Canada.
HC is working to establish a certification program for radon measurement and mitigation service providers working in Canada. This program will ensure radon services provided to Canadian homeowners are of high quality and that providers of those services are properly trained. As part of this program, HC is working with the National Environmental Health Association National Radon Proficiency Program (NEHA-NRPP). A memorandum of agreement was established in 2009 to allow the Standards Council of Canada to begin assessment of NEHA-NRPP as a first step to having them accredited as a certifying body for the Canadian radon certification program.
In support of more accurate reporting, as well as easier compliance on air emissions: In 2009-2010, the 2007 national emissions inventory for air pollutants was published and data for 2008 was compiled; the 2008 facility level emissions for air pollutants compiled through the National Pollutant Releases Inventory was published; the compliant 2008 national emission summaries for air pollutants to the United Nations Economic Commission for Europe under the Convention on Long-Range Transboundary Air Pollution was submitted; and overall, existing institutional capacity to deliver an enhanced monitoring, accounting and reporting system to produce a UN compliant national GHG inventory system and national inventory report was maintained.
A single window reporting system was developed and launched to gather data for reporting GHG emissions. This tool is currently being considered as an option for gathering information on GHGs in cooperation with provinces and territories. EC has put in place a federal-provincial-territorial working group under the Canadian Council of Ministers of the Environment to discuss this initiative, to avoid duplication and lead to greater harmonization.
Canada has met the requirements of the Kyoto Protocol for the establishment of a national registry by launching the Canada’s Kyoto Protocol National Registry in February 2010. This registry connects directly to the International Transaction Log operated by the United Nations Framework Convention on Climate Change Secretariat and will allow Canada to participate in the international carbon market via its government accounts. General information on the National Registry was published under the EC internet website.
2009-2010 Successes
A proposal for a Comprehensive Air Management System was developed through a collaborative, multi-stakeholder process. Provinces, Territories, and stakeholders from a wide range of industrial activity sectors were involved in the effort to develop the air pollutant framework.
Canada has met the requirements of the Kyoto Protocol for the establishment of a national registry and can participate in the international carbon market via its government accounts by the launched of Canada’s Kyoto Protocol National Registry.
Improvements were made to air quality models that will help inform regulatory activities. In addition, the new EC air quality forecast model became operational in November 2009. This model brings new technology to EC's numerical prediction operations, with Canada being the first country to adopt a meteorological model with embedded chemistry as part of its operational suite. It is the next generation of model that will support the efforts to address smog issues in Canada.
A significant number of papers have been prepared, presented, and published in peer-reviewed journals and at scientific conferences on CARA research and measurement activities demonstrating the creditability and relevance of the scientific information in support of air pollutant and GHGs emissions activities.
Finalized and implemented regulations to limit VOC concentrations in automotive refinishing products and architectural coatings that will contribute to reduction in the formation of ground-level ozone and smog in Canada.
2009-2010 Risks and Challenges
The key challenge facing Canada in establishing a broad approach to climate change is the need to remain flexible enough and have analysis to be prepared to align to the approach that will ultimately be followed in the U.S. Various pieces of legislation setting out different economy-wide approaches, including for cap-and-trade, have been released. In the absence of the final passage of any of these, the U.S. Environmental Protection Agency is also proceeding with sector-specific GHG regulations. Canada will only adopt a cap-and-trade regime if the U.S. signals that it will do the same. This position on harmonization applies equally to regulation. Canada has already completed much of the extensive foundational analysis and consultation work required to prepare for both of those options.
Managing the coordination and communication amongst a number of key players on a very tight timeline is challenging on most of the CARA activities.
| Theme's total funding approved under the CAA | Theme's Planned Spending in 2009-2010 | Theme's Actual Spending in 2009-2010 |
|---|---|---|
| $ 434,865,749 |
$ 132,926,327 | $ 96,156,461 |
Program: Industrial Sector Regulatory Actions
| Department |
Environment Canada |
|---|---|
| Departmental Program Activity |
3.3 Clean Air Program |
2009-2010 Program's Expected Achievements
See the 2009-2010 Horizontal Report on Plans and Priorities at: http://www.tbs-sct.gc.ca/rpp/2009-2010/CARA_1
2009-2010 Program's Achieved Results
Progress was made in 2009-2010 in continuing to implement approaches to managing air pollution and greenhouse gas emissions from transport, industry and other sources. The Government of Canada aligned its national GHG reduction target (17% below 2005 levels by 2020) with that of the US and inscribed it in the Copenhagen Accord.
Progress was made with respect to advancing approaches to reducing GHG emissions from industrial sectors in the context of a North American cap-and-trade system:
- A draft set of rules and guidance for Canada’s Offset System published in June 2009
- A single window reporting system was developed and launched to gather data for reporting GHG emissions;
- Canada’s National Registry, a requirement under the Kyoto Protocol, which connects directly to the International Transaction Log operated by the United Nations Framework Convention on Climate Change secretariat, was launched in March 2010.
While much analysis on a North American cap-and-trade system has been conducted, a key point guiding Canada’s approach to climate change is that the North American economy is integrated to the point where harmonizing and aligning a range of principles, policies, regulations and standards makes sense. For that reason, Canada will only adopt a cap-and-trade regime if the U.S. signals that it will do the same. This position on harmonization applies equally to regulation. Canada has already completed much of the extensive foundational analysis and consultation work required to prepare for both of those options.
Environment Canada (EC) has also been working closely with provinces and territories as our approach to reducing GHG emissions continues to be developed. Agreements in Principle on climate change have been signed with Nova Scotia, Saskatchewan and British Columbia.
This past fall, renewed consultations with the provinces were undertaken through the Canadian Council of Ministers of the Environment to identify guiding principles to support the development of a single window system for reporting on GHGs. A list of guiding principles was finalized in January 2010 and is used to develop bi-lateral agreements with Provinces.
The federal government completed its work with representatives from provinces, industry and non-governmental organizations to develop a proposal for a new air management framework to reduce air pollutant emissions. The Comprehensive Air Management System (CAMS) proposes national ambient air quality standards, national industrial emission requirements and air pollution management that takes into consideration local and regional air quality. As such, it provides a good foundation for moving forward. By including an element focused on improving local and regional air quality, CAMS directly addresses a shortcoming identified by stakeholders in the governments proposed approach announced in the Turning the Corner Plan (April 2007). The proposed CAMS framework was submitted for consideration to the federal, provincial and territorial Ministers.
The 2007 status report on the Notice requiring the preparation and implementation of Pollution Prevention Plans from base metals smelters and refineries and zinc plants was published in May 2009. It demonstrates that the implementation of pollution prevention plans is reducing releases of air pollutants from the sector, and that most facilities are expected to meet their 2008 targets.
The Particulate Matter combustion survey for wood products sector was completed in collaborations with the industry. It leads to re-assessment of the Air Pollutant Emissions Inventory for PM, PM10 and PM2.5 and serves as basis to evaluate future regulatory actions for the wood products sector.
The funding for Regulatory Capacity Development and Management Systems supported the delivery of training for the EC community of regulators as part of the department’s strategy to implement the Cabinet Directive on Streamlining Regulations. This resulted in enhanced capacity and promoted knowledge development for federal regulators.
| Total Funding Approved Under the CAA | Program's Planned Spending in 2009-2010 | Program’s Actual Spending in 2009-2010 |
|---|---|---|
| $ 91,846,667 | $ 31,160,570 | $ 17,978,917 |
Program: Transportation Sector Regulatory Actions
| Department |
Environment Canada |
|---|---|
| Departmental Program Activity |
3.3 Clean Air Program |
2009-2010 Program's Expected Achievements
See the 2009-2010 Horizontal Report on Plans and Priorities at: http://www.tbs-sct.gc.ca/rpp/2009-2010/CARA_2a
2009-2010 Program's Achieved Results
Consultations with stakeholders were completed on final regulations for marine spark-ignition engines and off-road recreational vehicles. Proposed regulations are being updated to maintain harmonization with the United States.
Consultations were held on the draft amendments to regulations for heavy-duty on-road and off-road diesel engines.
On-going implementation for vehicle and engine emission regulations. This includes the administration of statutory obligations under CEPA 1999 such as registering and tracking temporary importation declarations and registering Notices of Defect. EC is working closely with the U.S. Environmental Protection Agency (US EPA) and Enforcement on regulatory administration activities to avoid duplication.
EC conducted over 100 emissions tests on 89 vehicles and engines resulting in over 50 referrals to Enforcement. EC also collaborated with the US EPA in testing vehicles and engines and in sharing results.
EC officials participated in meetings of the World Forum for Harmonization of Vehicle Regulations and of its working group on pollution and energy in support of the United Nation’s “Agreement Concerning the Establishing of Global Technical Regulations for Wheeled Vehicles, Equipment and Parts which can be fitted and/or used on Wheeled Vehicles”, to which Canada is a signatory.
The Clean Air Regulatory Agenda set out that Transport Canada would develop fuel consumption regulations for cars and light trucks under the Motor Vehicle Fuel Consumption Standards Act. In March 2009, EC was tasked to develop greenhouse gas emission regulations under Canadian Environmental Protection Act 1999. The department announced the development of regulations in April 2009 and a Notice of Intent was published in the Canada Gazette, Part I.
| Total Funding Approved Under the CAA | Program's Planned Spending in 2009-2010 | Program’s Actual Spending in 2009-2010 |
|---|---|---|
| $ 31,474,967 | $ 10,897,521 |
$ 7,072,653 |
Program: Transportation Sector Regulatory Actions
| Department |
Transport Canada |
|---|---|
| Departmental Program Activity |
2.1 Clean Air from Transportation |
2009-2010 Program's Expected Achievements
See the 2009-2010 Horizontal Report on Plans and Priorities at: http://www.tbs-sct.gc.ca/rpp/2009-2010/CARA_2b
2009-2010 Program's Achieved Results
Proposed Air Emission Reductions (Rail)
Continued to support the Memorandum of Understanding (MOU) with the Railway Association of Canada on emission reductions in the rail sector. The MOU, in force from 2006 to 2010, has delivered substantial reductions in air pollutant emissions. In 2008, there was an improvement of 23.3% in the greenhouse gas (GHG) emission intensity of total freight train operations, compared
with the 1990 baseline.
TC supported preparation of the annual Locomotive Emissions Monitoring report for 2008. The 2008 report is expected to be released in mid 2010. Furthermore, the department continued work on the development of locomotive emission regulations for 2011 under the Railway Safety Act.
Proposed Air Emission Reductions (Ships)
TC continued technical consultations to develop regulations under the Canada Shipping Act 2001 to implement stricter standards for air pollutant emissions.
The department supported the development of a North American Emission Control Area, in collaboration with the United States and France, including presenting the proposal at the International Maritime Organization. In addition, the department continued its participation at the International Maritime Organization to advance uniform, global measures to reduce GHGs from marine
vessels.
Proposed Air Emission Reductions (Motor Vehicles)
Responsibility for the development of air emission regulations for light-duty vehicles was transferred to Environment Canada effective April 1, 2009. In 2009-2010, TC launched two initiatives to improve data and modeling:
- Development of a comprehensive on-road vehicle fleet database to facilitate policy analysis, using primary information from existing data sources; and
- Development of the TC Transportation Energy Use and Emissions Model , which covers all modes of transportation. The model now includes a light-duty vehicles choice module that was developed in order to analyze non-regulatory initiatives for new vehicles, such as economic incentives.
| Total Funding Approved Under the CAA | Program's Planned Spending in 2009-2010 | Program’s Actual Spending in 2009-2010 |
|---|---|---|
| $ 19,170,216 |
$ 3,715,603 | $ 2,263,577 |
Program: Transportation Sector Regulatory Actions
| Department |
Natural Resources Canada |
|---|---|
| Departmental Program Activity |
2.1 Clean Energy |
2009-2010 Program's Expected Achievements
See the 2009-2010 Horizontal Report on Plans and Priorities at: http://www.tbs-sct.gc.ca/rpp/2009-2010/CARA_2c
2009-2010 Program's Achieved Results
In April, 2009, the Government of Canada changed its regulatory approach for light duty vehicles from that of using the Motor Vehicle Fuel Consumption Standards Act to using the Canadian Environmental Protection Act (CEPA), 1999. Transfer of the regulations under CEPA in 2009 was considered the preferred approach as the emphasis shifted from fuel consumption to tailpipe emissions, an approach that was more in line with domestic policy goals. This decision resulted in responsibility for these regulations being transferred from Transport Canada to Environment Canada (EC).
In 2009-2010, Natural Resources Canada reviewed the labelling requirements for new vehicles under a regulatory regime and developed and presented options for EC to consider. Draft regulations were published by EC in the Canada Gazette, Part I, in April 2010, but did not include specific labelling provisions.
| Total Funding Approved Under the CAA | Program's Planned Spending in 2009-2010 | Program’s Actual Spending in 2009-2010 |
|---|---|---|
| $ 3,200,000 |
$ 400,000 | $ 344,628 |
Program: Consumer and Commercial Products Regulatory
| Department |
Environment Canada |
|---|---|
| Departmental Program Activity |
3.3 Clean Air Program |
2009-2010 Program's Expected Achievements
See the 2009-2010 Horizontal Report on Plans and Priorities at: http://www.tbs-sct.gc.ca/rpp/2009-2010/CARA_3a
2009-2010 Program's Achieved Results
Two regulations controlling Volatile Organic Compounds (VOC) concentrations in automotive refinishing products and architectural coatings were finalized in Canada Gazette II, and will contribute to reduction in the formation of ground-level ozone and smog in Canada. The third regulation that will limit emissions from products was published as a proposal in Canada Gazette I in 2008 and will be finalized in 2010-2011.
Other categories of consumer and commercial products were analyzed for inclusion in the longer term Federal Agenda for VOC reductions. Consultations on this approach were held in March 2010 which will inform the identification of the next group of consumer and commercial products to target for VOC reductions.
Participated in the update of the Canadian Standard Association performance standards for wood burning appliances and completed technical studies to improve the Department’s understanding of this industry.
| Total Funding Approved Under the CAA | Program's Planned Spending in 2009-2010 | Program’s Actual Spending in 2009-2010 |
|---|---|---|
| $ 12,000,000 |
$ 3,260,000 | $ 2,232,712 |
Program: Consumer and Commercial Products Regulatory
| Department |
Natural Resources Canada |
|---|---|
| Departmental Program Activity |
2.1 Clean Energy |
2009-2010 Program's Expected Achievements
See the 2009-2010 Horizontal Report on Plans and Priorities at: http://www.tbs-sct.gc.ca/rpp/2009-2010/CARA_3b
2009-2010 Program's Achieved Results
- Implementation of Amendment 10 was monitored with particular attention paid to the requirements concerning home heating systems and light bulb labelling requirements.
- Consultation with the light industry and stakeholders continued with respect to the coming into force of the light bulb standard in 2012.
- Analyses and consultation with respect to Amendment 11 were completed and pre- publication is expected in June 2010.
- Compliance and monitoring activities were continued for all products subject to standards, and regulated and voluntary labels.
- ENERGY STAR registrations of participating companies reached over 1100; an increase of 10% over the previous reporting period.
- Major product demonstrations occurred in the areas of street lighting, general area outdoor lighting and adaptive control for street lighting. A major review of standards that could be implemented in North American jurisdictions was conducted and 40 additional standards for the period up to 2020 were identified. Results were communicated to provinces and utilities and coordinated planning efforts continue.
- In September 2009, amendments increasing the scope and flexibility of the Energy Efficiency Act came into force.
| Total Funding Approved Under the CAA | Program's Planned Spending in 2009-2010 | Program’s Actual Spending in 2009-2010 |
|---|---|---|
| $ 32,000,000 |
$ 7,550,000 | $ 7,578,076 |
Program: Indoor Air Quality Management Actions
| Department |
Health Canada |
|---|---|
| Departmental Program Activity |
3.1.2, 3.1.6 |
2009-2010 Program's Expected Achievements
See the 2009-2010 Horizontal Report on Plans and Priorities at: http://www.tbs-sct.gc.ca/rpp/2009-2010/CARA_4
2009-2010 Program's Achieved Results
Indoor Air Quality Management Actions
Biological and chemical contaminants
Further understanding of the health impacts of exposure to indoor air contaminants (released from household products, building materials, combustion appliances, or entering the home from outside) is vital given that Canadians spend 90% of their time indoors. Few tools are available to public health practitioners for guiding interventions aimed at improving indoor air
quality and reducing negative health impacts. Specific key activities carried out in 2009-2010 to meet these objectives include:
- Exposure studies investigating the levels and sources of indoor air contaminants in Canadian homes were conducted in Halifax and Edmonton which will be used, alongside data from previous residential studies conducted in other Canadian cities, to develop a national picture of Canadians' exposure to indoor pollutants and will inform the assessment of the need for management actions.
- Testing program for formaldehyde levels in 800 homes was provided to homeowners who had installed a banned urea-formaldehyde foam insulation product. Targeted information materials on health risks and recommended actions to reduce levels of formaldehyde were developed for homeowners.
- Health Canada (HC) provided advice, based on expertise developed through conducting recent indoor exposure and monitoring studies and developing health risk assessments, to the World Health Organization (WHO) European working group on indoor air quality guidelines and multi-departmental committees on indoor air quality. This ongoing knowledge exchange will lead to: increased harmonization of standards and guideline development; minimization of duplication of effort to assess particular substances; and, provides the opportunity to assess the applicability of the WHO guidelines to the Canadian situation.
- Health risk assessments and guideline development, including consideration of actions to reduce exposure, were undertaken for the following indoor air contaminants:
- carbon monoxide and ozone - final guidelines completed;
- toluene - proposed guideline completed;
- fine particulate matter, nitrogen dioxide, benzene, and naphthalene - assessments initiated;
- Legionella and house dust mites – assessments initiated; and,
- CO2 as an indicator of ventilation efficiency – initiated.
- Content and messaging on indoor air pollutants, including mould and carbon monoxide was included as a key focus of HC’s new HazardCheck and First Nations Environmental Health Guide public awareness campaigns.
Radon Strategy
In 2009-2010 the National Radon Laboratory built, maintained and managed the inventory, shipping, deployment and analysis of the radon detectors for the cross-Canada radon survey and federal building testing projects. The laboratory built and shipped 35,000 and analyzed 25,000 detectors in 2009-2010.
In 2009-2010 approximately 9000 participants were recruited for the cross-Canada radon survey. HC shipped out 9000 kits to the participants including instructions, a questionnaire and a radon detector. Approximately 75% were returned after the 3 month testing period.
In 2009-2010 HC completed over 60 radon stakeholder engagements with Non-Governmental Organizations, the health professional, real estate and building industry, other departments and levels of government and the public. Web traffic on the HC radon pages increased by more than 50% and over 200,000 radon brochures were distributed across Canada. Radon information is available at all Service Canada centres across Canada.
A Canadian Certification program was initiated by HC for the certification of radon measurement and mitigation professionals, laboratories performing radon analysis and radon instrumentation. The development of the Canadian program is expected to be completed by the end of 2010. Canada’s certification program is being developed in partnership with National Environment Health Association, National Radon Safety Board and the Standards Council of Canada.
- Progress to date:
- Canadian measurement and mitigation exams are both completed;
- Course curriculum for measurement and mitigation is in development; and,
- Engagement of Canadian training organizations to encourage course development and availability is underway.
| Total Funding Approved Under the CAA | Program's Planned Spending in 2009-2010 | Program’s Actual Spending in 2009-2010 |
|---|---|---|
| $ 17,500,000 | $ 5,478,000 | $ 6,425,899 |
Program: Science in Support of Regulatory Activities and Accountability
| Department |
Environment Canada |
|---|---|
| Departmental Program Activity |
3.3 Clean Air Program |
2009-2010 Program's Expected Achievements
See the 2009-2010 Horizontal Report on Plans and Priorities at: http://www.tbs-sct.gc.ca/rpp/2009-2010/CARA_5a
2009-2010 Program's Achieved Results
Due to the delay in the peer-review process, the Summary for Policy-Makers of the Canadian Smog Assessment will be published in the summer of 2010. This assessment is the scientific underpinning of the development of the new National Ambient Air Quality Standards for Particulate Matter and ozone. It is also an Environment Canada (EC) deliverable to the Canadian Council of
Ministers of the Environment. The Canadian Smog Assessment will be published in 2011.
Particulate Matter and Ozone ambient air maps were produced using 2001-2007 data from the National Air Pollution Surveillance network, Canadian Air and Precipitation Monitoring network and United States networks.
EC expanded acid deposition monitoring and completed a large scale lake survey in western Canada to assess the sensitivity of this region to acid deposition and to determine the capacity of the lakes to withstand inputs of acid causing pollutants without harm to the ecosystem. (i.e., determine the critical loads). These critical load values define the Government of Canada target value for acid causing emissions; a value that should not be exceeded in western Canada.
In order to better define the air quality, human health and environmental impacts of domestic and international emissions, the National Air Pollution Surveillance network (an EC led federal-provincial monitoring network that focuses on urban air quality) continued to upgrade data management and monitoring systems, and enhanced analytical capacity; and the Canadian Air and Precipitation Monitoring (CAPMoN) network (monitoring air quality at rural and background locations) continued to add new sites and additional analytical capacity. These air quality networks provide information that is essential for “setting-the-baseline” to describe effectiveness of regulations and to evaluate the impact of past regulatory and policy decisions.
EC’s ability to measure air pollutants at high elevation has expanded in order to quantify transboundary contributions to Canada’s air quality from North American and global sources.
Our understanding of population exposure to criteria air pollutants in South-Western Ontario continued to increase resulting in improvements to air quality models which allow for more accurate air quality forecasts and greater confidence for policy application.
EC completed a suite of food web (a network of organisms that are related through their role as prey or predator), waterbird and habitat studies assessing the levels and effects of acid-causing pollutants and mercury at sites located downwind of large, point-source emitters and background sites in order to "set-the-baseline" to assess the efficacy of proposed
domestic and international acid-causing pollutants and mercury regulations.
Improvements were made to the air quality models (AURAMS and GEM-MACH), specifically, these improvements increased the resolution of the models so that they could better address local emissions, introduced improvements in our understanding of chemical and physical interactions of pollutants in the atmosphere and improved our assessment of the impact of intercontinental
transport of pollutants, which will help inform regulatory activities. A new prototype based on AURAMS was developed to assess impact of climate change on ozone and particle pollution in the context of the Canadian regulatory framework.
The improved Global Atmospheric Mercury Model was used to assess the impact of a range of regulatory options to address mercury release from coal-fired power plants and products from both domestic and international emitters on levels of mercury deposited in Canada. This work supported domestic regulatory development and the development of Canada's position at the upcoming negotiations for a legally-binding mercury agreement under United Nations Environment Programme.
EC launched the 2012 Canadian Mercury Science Assessment which will be the first comprehensive national description of mercury in the Canadian environment. The assessment is intended to inform decision-making by policy-makers and research managers and establish a baseline against which the effectiveness of domestic and international policy-making can be assessed.
| Total Funding Approved Under the CAA | Program's Planned Spending in 2009-2010 | Program’s Actual Spending in 2009-2010 |
|---|---|---|
| $ 47,985,868 | $ 16,913,673 | $ 13,315,524 |
Program: Science in Support of Regulatory Activities and Accountability
| Department |
Health Canada |
|---|---|
| Departmental Program Activity |
3.1.2 |
2009-2010 Program's Expected Achievements
See the 2009-2010 Horizontal Report on Plans and Priorities at: http://www.tbs-sct.gc.ca/rpp/2009-2010/CARA_5b
2009-2010 Program's Achieved Results
In 2009-2010 Health Canada (HC) conducted research and health risk assessments to better understand the impacts of air quality on the health of Canadians. By providing a better understanding of the sources and magnitude of the health effects of air pollution, this work will help in developing regulations that more effectively protect the health of Canadians, including vulnerable populations. Additionally, economic analysis of the social costs of air pollution, and consultation with industry and Non-Governmental Organizations, will help ensure that regulations are developed in a cost-effective manner, and that they provide net benefits to the quality of life of Canadians. Specific key activities carried out in 2009-2010 to meet these objectives include the following:
- HC collaborated with Environment Canada (EC), provinces/territories, industry and NGOs in the ongoing development of a national air quality management system. Through these discussions, HC has been contributing to the development of industrial air pollution emission reduction targets, and national air quality objectives. As part of this process, HC developed a methodology to help set national air quality objectives for particulate matter (PM) and ozone based on the additional proportion of the Canadian population who would derive health benefits. HC is working with partners to determine appropriate levels for the objectives.
- HC completed a thorough review of the health impacts of PM and ground level ozone. Results of this review were summarised for inclusion in the Canadian Smog Assessment to be available in 2010. The assessment will provide Canadians and policy makers with a better understanding of the impacts of smog on human health in order to take action to reduce exposure.
- Risk assessments of carbon monoxide, sulphur dioxide, and nitrogen dioxide were initiated. Once completed, these assessments will provide the health basis for revisions to existing ambient air quality guidelines, objectives, and standards.
- HC initiated an assessment of the human health impacts associated with the production, transportation, storage and use of different biodiesel blends. In addition, through participation in an interdepartmental working group, and in collaboration with industry, HC continued to investigate the potential health impacts of different vehicle fuel additives and fuel characteristics. This ongoing work will help ensure that Canadian fuel standards work in harmony with US standards and that any possible health impacts are considered as new products are brought forward for introduction into the Canadian market.
- Emerging greenhouse gas mitigation technologies were prioritized for assessment in consultation with governments, industry and academia. Carbon capture and storage (CCS) and the use of biomass in power generation were identified as key processes and assessments of these technologies have been initiated. A review of CCS technologies applied to coal-fired power generation and their associated air pollutant emission factors was completed. An analysis of resulting air pollutant emissions and human exposures is underway. A review of biomass technologies used in Canada and development of associated emission factors for air pollutants was completed.
- HC conducted a number of studies to determine the exposure of Canadians to different air pollutants, from different sources, and to study their impacts on human health. This longer-term work, often taking three to four years to complete, provides the basis for considering the need for management actions on individual pollutants and industrial sectors to improve the
health of Canadians such as children and those with cardio-vascular or respiratory illnesses. These studies included:
- A published science assessment of the human health impacts of airborne manganese.
- A study in Windsor, Ontario, which determined that vehicle emissions are the primary source of human exposure to air pollution in the region.
- A study in the Annapolis Valley, Nova Scotia, which determined that 50% of all particulate matter in the region comes from wood smoke.
- A traffic study in Toronto that found a positive relationship between long term cumulative exposure to pollution from vehicles, and the exacerbation of asthma in children.
- A study in Montreal to estimate the impacts of emissions from oil refineries on the respiratory health of children continued. Other sector specific studies were initiated to assess the health impacts of emissions from the pulp & paper, electrical power generation, aluminum, iron & steel, and cement sectors.
- A cohort study was set up which will use remote sensing to study the relationship between exposure to common smog pollutants (PM and ozone) and the incidence of cancer and premature mortality. An additional study is ongoing to investigate the relationship between particulate matter exposure and effects on the respiratory, cardiovascular, and nervous systems.
- Based on findings of a possible association between appendicitis and air pollution, new research was initiated to look at the possible relationship between air pollution exposure and a broad range of health problems such as migraines, stroke, Chrohn’s disease, and serious skin conditions.
- Economic studies were conducted to determine how illnesses caused by air pollution impact quality of life. Studies included literature reviews on the economic costs of asthma development, and mould exposure. This research on socio-economic impacts will help ensure that air quality regulations are developed and implemented in a cost-effective manner.
- HC applied the air quality benefits assessment tool (AQBAT) to assess the potential health and economic impacts of a number of proposed air quality regulations. The modelling tool was also updated to include more current economic and health research results. HC also used the Air Health Indicator (AHI) tool in order to track spatial and temporal changes in air quality and related health impacts. An AHI has been developed for ozone and for particulate matter, and refinement of the methodology used in the AHI is ongoing.
| Total Funding Approved Under the CAA | Program's Planned Spending in 2009-2010 | Program’s Actual Spending in 2009-2010 |
|---|---|---|
| $ 71,300,000 | $ 24,304,600 | $ 20,751,732 |
Program: Emissions Reporting
| Department |
Environment Canada |
|---|---|
| Departmental Program Activity |
3.3 Clean Air Program |
2009-2010 Program's Expected Achievements
See the 2009-2010 Horizontal Report on Plans and Priorities at: http://www.tbs-sct.gc.ca/rpp/2009-2010/CARA_6
2009-2010 Program's Achieved Results
The Greenhouse Gas National Inventory Report for 2007 was submitted to the United Nations Framework Convention on Climate Change Secretariat in April 2009.
Greenhouse Gas Reporting Program (GHGRP) system was enhanced and migrated from Statistics Canada to Environment Canada (EC). In addition, Section 46 GHGRP data was published on the EC website in December 2009.
An internet-based information gathering tool was built to support electronic information gathering on greenhouse gas (GHG) emissions in Canada. This tool is currently being considered as an option for gathering information on GHGs in cooperation with provinces and territories. This past fall, renewed consultations with the provinces were undertaken through the Canadian Council of Ministers of the Environment to identify guiding principles to support the development of a single window system for reporting on GHGs. A list of guiding principles was finalized in January 2010 and is used to develop bi-lateral agreements with Provinces. The use of a single window for submitting information on emissions will contribute towards reducing the reporting and data management burden on industry and government.
EC published the 2007 national emissions inventory for air pollutants and compiled 2008 data; and also published the 2008 facility level emissions for air pollutants compiled through the National Pollutant Releases Inventory.
The department submitted the compliant 2008 national emission summaries for air pollutants to the United Nations Economic Commission for Europe as required by the reporting obligations ratified by Canada under the Convention on Long-Range Transboundary Air Pollution. Overall, existing institutional capacity to deliver an enhanced monitoring, accounting and reporting system
to produce a United Nations compliant national GHG inventory system and national inventory report was maintained.
Improved emission inventories, trends, and projections for air pollutants obtained through technical studies, emission estimation model improvements, and measurements.
Developed quantification, reporting and verification protocols for estimating air pollutant emissions from the aluminum, power generation and steel manufacturing sectors; and developed tools to accelerate the processing and the creation of the emission data files for the air quality models.
Collected facility-level emissions through an enhanced on-line application as part of the single window reporting system.
In close collaboration with sector experts, programs and enforcement services, the quality of the data reported under the Canadian Environmental Protection Act Section 71, Clean Air Regulatory Agenda (CARA) Notice has been assessed for each implicated industrial sectors notice.
A Common Secured Protected B network infrastructure to manage, provide access, use and manipulate in a secure manner, the confidential information collected for CARA is currently under development.
Comparative analysis of quantification reporting and verification requirements specified in various North American mandatory GHG reporting programs (i.e., United States Environmental Protection Act Mandatory Reporting Rule, Western Climate Initiative, Alberta and other provinces) is on going.
| Total Funding Approved Under the CAA | Program's Planned Spending in 2009-2010 | Program’s Actual Spending in 2009-2010 |
|---|---|---|
| $ 57,800,202 | $ 16,325,127 | $ 12,255,442 |
Program: Emissions Trading
| Department |
Environment Canada |
|---|---|
| Departmental Program Activity |
3.3 Clean Air Program |
2009-2010 Program's Expected Achievements
See the 2009-2010 Horizontal Report on Plans and Priorities at: http://www.tbs-sct.gc.ca/rpp/2009-2010/CARA_7
2009-2010 Program's Achieved Results
Trading Program Development
- Environment Canada (EC) provided policy advice regarding greenhouse gases (GHGs) based on emerging United States policy and our assessment of potential implications for Canada. In addition, analytical and consultative preparatory work required for a national or linked North American GHG cap and trade system was done, primarily including the publication of draft rules for Canada’s Offset System for GHGs. This work also included policy analysis and consultation on potential compliance mechanisms for the regulatory framework, including a technology fund and pre-certified investment concepts.
Canada 's Kyoto Protocol (KP) National Registry
- The Registry went into full production (i.e., "went live") with the International Transaction Log (ITL) in February 2010. Canada issued its first commitment period Assigned Amount Units and deposited them in the Government of Canada holding account in the national registry. Canada paid its ITL fees for the 2009 and 2010 calendar years.
- EC published a web page on its internet site providing general information on the National Registry, as well as account holder and transaction information as required by the KP.
Domestic Credit Tracking System (DCTS)
- Because of the delay in implementing a Canadian GHG emissions trading system and the Offsets System, sufficient time was available in 2009-2010 to go beyond a “manual DCTS” and develop an on-line database tracking system for tradable GHG compliance units, such as allowances and Offset Credits. Thus, the department completed the design phase of the DCTS with the production of a functional specification, list of requirements and sample web site screen shots.
| Total Funding Approved Under the CAA | Program's Planned Spending in 2009-2010 | Program’s Actual Spending in 2009-2010 |
|---|---|---|
| $ 32,656,213 | $ 8,486,395 | $ 3,387,888 |
Program: Enforcement advice and Reporting on Progress
| Department |
Environment Canada |
|---|---|
| Departmental Program Activity |
3.3 Clean Air Program |
2009-2010 Program's Expected Achievements
See the 2009-2010 Horizontal Report on Plans and Priorities at: http://www.tbs-sct.gc.ca/rpp/2009-2010/CARA_8
2009-2010 Program's Achieved Results
Receptor modelling study was conducted for two rural sites in Ontario and Quebec (Simcoe and Saint Anicet). The comparisons of urban and rural areas provide important information on the spatial variation of PM2.5 sources and the contributions of local and regional scale sources. Overall result of this research should support development of more effective control strategies for ambient pollutants.
In October 2009, Environment Canada hosted a national Particulate Matter (PM) Measurement meeting that was attended by over 30 participants representing 12 different Canadian and international monitoring jurisdictions. The meeting provided an update on progress towards transitioning the PM2.5 network to instruments that meet the National Air Pollution Surveillance Network-Canada-Wide Standard (NAPS-CWS) performance criterion for PM2.5, and provided recommendations for a national method for transforming data from instruments that do not meet this criterion. As a follow-up, it was also recommended that an ad hoc group (NAPS agencies) develop transformation methods for consideration by NAPS and the Canadian Council of Ministers of the Environment in the near future.
The program did not proceed with the other planned initiatives due to a reorientation of government policy, engaging instead in policy and support activities to develop the basis for an accountable comprehensive national approach to air emissions reduction.
| Total Funding Approved Under the CAA | Program's Planned Spending in 2009-2010 | Program’s Actual Spending in 2009-2010 |
|---|---|---|
| $ 7,000,000 | $ 1,742,000 | $ 886,797 |
Program: Policy Development, Analysis and Coordination
| Department |
Environment Canada |
|---|---|
| Departmental Program Activity |
3.3 Clean Air Program |
2009-2010 Program's Expected Achievements
See the 2009-2010 Horizontal Report on Plans and Priorities at: http://www.tbs-sct.gc.ca/rpp/2009-2010/CARA_9
2009-2010 Program's Achieved Results
In terms of policy development, progress was also made in completing much of the analytical and consultative preparatory work required for a North American cap and trade system.
Preliminary policy analysis was undertaken on equivalency agreements and the potential for agreements to be based on equivalency of environmental outcomes. Additional analysis examined existing control programs (regulations, permitting/approval processes, voluntary measures) in a number of provinces.
Analytical support to overall policy development produced several key deliverables.
- An energy, emissions and economic baseline was developed to serve as a reference point for the analysis of proposed climate change policy and approaches. This baseline provided a consistent benchmark for the analysis of policy options.
- The emissions and economic impacts of approaches to reduce emissions in selected industries (e.g., oil and gas, and electricity generation) and end-use sectors (e.g., passenger vehicles) were examined. Analysis was also undertaken to support the Government’s revised goal of 17% below 2005 by 2020.
Analysis of alternative options for a North American cap-and-trade regime was also undertaken.
Economic profiles for key industrial sectors were developed (Pipelines; Pulp and Paper; Chemical; Petroleum Refining; Cement; Lime & Gypsum; Iron and Steel; Aluminum and Smelting; Iron Ore, Potash and Other Mining; Conventional Oil and Gas; Electricity Generation; Oil Sands).
Economic analysis was provided to support the development of Regulatory Assessment Impact Statements for biofuels and passenger cars and light-duty trucks.
As part of the joint work to develop an alternative framework for managing air quality, consultations with all provinces and territories via the Canadian Council of Ministers of the Environment committees and Non-Governmental Organizations via the Canadian Environmental Network raised awareness of three elements of the alternative framework and the detailed options under consideration. The proposed framework includes a foundation of industrial emission requirements for sulphur dioxide, nitrogen oxide, volatile organic compounds and particulate matter. Analysis was undertaken to estimate the potential benefits from implementing the preliminary emission targets relative to the targets proposed under the 2007 framework.
Canada participated in the North American Air Working Group of the Committee for Environmental Cooperation.
Canada has continued to engage the United States on national and regional levels on the transboundary movement of air pollution.
Internationally, Canada has made progress in participating in negotiations on amendments to the 1999 Gothenburg Protocol.
| Total Funding Approved Under the CAA | Program's Planned Spending in 2009-2010 | Program’s Actual Spending in 2009-2010 |
|---|---|---|
| $ 10,078,576 | $ 2,692,838 | $ 1,662,616 |
Theme: Clean Energy
| Lead Department |
Natural Resources Canada |
|---|---|
| Federal Theme Partners |
Indian and Northern Affairs |
Expected Results from Theme's Programming
Immediate Outcomes
- Partnerships and collaborative agreements with stakeholders to promote clean energy activities that result in lower emissions of greenhouse gases (GHG) and criteria air contaminants (CACs).
- Involvement by industry in developing and using energy efficiency products, services, and processes that result in lower emissions of GHGs and CACs.
- Transfer and/or use of clean energy technologies and practices leading to lower emissions of GHGs and CACs.
- Awareness and understanding among stakeholders of the potential for, and methods of, reducing GHGs and CACs through energy production and use.
- Policy and monitoring that supports GHG and CAC reductions.
Intermediate Outcomes
- Adoption of energy efficient products and services that result in reduced GHGs and CACs.
- Adoption of renewable energy products and services, and strengthened infrastructure, resulting in reduced GHGs and CACs.
- Availability of innovative, market-ready energy processes, products and services that result in reduced GHGs and CACs.
Final Outcomes
- Reduced emissions of GHGs and CACs from clean energy activities.
2009-2010 Expected Achievements
See the 2009-2010 Horizontal Report on Plans and Priorities at: http://www.tbs-sct.gc.ca/rpp/2009-2010/CE_Theme
2009-2010 Achieved Results
Programs under the Clean Energy Theme continued to surpass expectations in 2009-2010. Investments achieved concrete benefits for Canadians by continuing to increase energy efficiency and renewable energy production, and by promoting emerging technologies. These achievements have resulted in tangible GHG reductions across the country.
Immediate Outcomes
As detailed in the program reports, the Clean Energy Theme experienced unprecedented demand for its products and services:
- 49 new contribution agreements were signed under the ecoENERGY for Renewable Power program, half of the program’s 3-year total of 98.
- More than 1000 industrial energy managers, more than 6,500 professionals in the building and housing industries, and more than 1900 representatives from small and medium organizations participated in information sessions, workshops and training regarding energy efficiency this year.
- 30 renewable energy, energy efficiency and community energy planning workshops were supported in 29 Aboriginal and northern communities, more than in years past.
- More than 86,000 calls were made to Service Canada regarding the ecoENERGY Retrofit Program, and the program has processed more than 12,000 emails received through contact websites.
- Domestic and international stakeholders benefitted from products developed in whole or in part by the Clean Energy Theme, including a wind technology roadmap, an Off-Grid Communities Framework, information on emerging technologies, building and housing codes, the Carbon Budget Model, energy models, energy efficiency training tools, and others.
- The Theme contributed to such Government of Canada reports as “Canada’s 5th National Communication on Climate Change: 2010,” “Canada’s National Inventory Report 1990-2008,” and “A Climate Change Plan for the Purposes of the Kyoto Protocol Implementation Act, 2009.”
- It supported its 2009-2010 achievements with strategic policy advice, analytical products and communications support to Natural Resources Canada and Indian and Northern Affairs Canada senior officials and Ministers to support their decision-making, and by accurately reporting on Clean Energy activities through the HMARF and other government reports.
Intermediate Outcomes
Adoption of energy efficient products and services that result in reduced GHG and air pollutant emissions:
- As a result of the Clean Energy programs, Canadians are purchasing more energy efficient products for their homes. More than 275,000 homeowners have received grants under the ecoENERGY Retrofit – Homes program as of the end of 2009-2010, and the energy-efficient upgrades they have made will reduce their annual energy consumption by 22%. The total as of the end of 2008-2009 was 94,000.
- The way buildings and houses are marketed is changing. More than half a million new and existing homes have been rated and labelled for energy efficiency under the ecoENERGY programs, which will help to steer the Canadian housing market toward increased efficiency. As well, 77% of new LEED-certified (Leadership in Energy Efficient Design) buildings have been certified using the ecoENERGY for Building and Houses program’s Design Validation methodology.
- Federal Clean Energy programs are working collaboratively with provincial and territorial governments. All but one territory fully or partially match federal home retrofit grant contributions, facilitating the adoption of energy efficient products by homeowners. As well, six provinces have announced changes to their housing codes that will make them more energy efficient.
- Business owners have also been engaged on energy efficiency. This year, small and medium organization signed 517 contribution agreements for energy efficient upgrades, and more than 6,000 building industry professionals participated in training on energy efficient tools and practices. As well, a survey has shown that most participants in the Canadian Industry Program for Energy Conservation (CIPEC) use the network and the CIPEC tools to implement energy efficiency measures. More than 2,200 companies are registered CIPEC Leaders; 321 joined in 2009-2010, the most yet in a single year under the ecoENERGY for Industry program.
- Aboriginal and northern communities have been active on clean energy too. Support from the ecoENERGY for Aboriginal and Northern Communities program has helped 10 projects be successfully commissioned. These projects are helping to increase renewable energy production and increase energy efficiency in Aboriginal and northern communities.
Adoption of renewable energy projects and services, and strengthened infrastructure, resulting in reduced GHGs and CACs:
- The ecoENERGY for Renewable Power program saw 26 of its projects commissioned this year, which has increased the renewable energy capacity in Canada by 1042.6 megawatts (MW) and will receive approximately $338 million in federal support. Overall, 55 of the 98 projects with contribution agreements under the program have been commissioned to date. These 55 represent an increase in Canadian renewable energy capacity of more than 2,600 MW, and the installations have produced 8.2 terawatts (TWh) of renewable electricity to date.
- Interest in the ecoENERGY for Renewable Heat program remained very high in 2009-2010. The program supported the installation of 283 solar thermal systems in the institutional, commercial and industrial sectors, more than in years previous and greatly exceeding the planned target of 175. In the residential sector, 466 systems were installed this year, bringing the program total up to 563. In addition, a national survey this year indicated that the geoexchange industry grew by 65% in 2009 compared to 2007.
- The ecoENERGY Technology Initiative supported the demonstration of hydrogen fuel cells, with 20 fuel cell buses operating in Vancouver’s Olympic Village during the 2010 Winter Olympics. These buses are expected to operate for up to 20 years.
- The renewable programs met all their Horizontal Report on Plans and Priorities commitments except for one: delays in the commissioning of some projects supported by the ecoENERGY for Renewable Power program resulted in less than 3,000 MW commissioned in total. The delayed projects are expected to be commissioned in 2010-2011 instead.
Final Outcomes
The Clean Energy programs have resulted in tangible reductions of GHG emissions.
- The ecoENERGY for Buildings and Houses, Retrofit, and Industry programs collectively reduced emissions by an estimated 3.22 megatonnes (Mt) in 2009-2010.
- In 2009-2010, commissioned projects in the ecoENERGY for Renewable Power and Heat programs resulted in 2.94 Mt of GHG reductions.
2009-2010 Successes
Programs in the Clean Energy Theme continued to be highly visible and popular in 2009-2010.
- The ecoENERGY Retrofit – Homes program has now reached one in twenty existing households and is accessible in all regions of Canada, with an average energy savings of 22% and 3 tonnes per house. Demand for the program was so strong that the budget was increased five-fold before intake was completed in March 2010. The Small and Medium Organizations component of the program was initially targeting 800 projects over 4 years, but that target has been exceeded after only 3 years with 848 projects approved to date as of March 31, 2010.
- In 2009, the United States recognized the success of the ecoENERGY for Industry program’s CIPEC industry-government partnership model. It received the American Council for Energy-Efficient Economy award for Champion of Energy Efficiency in Industry.
- Interest in the ecoENERGY for Aboriginal and Northern Communities Program continues to build, evidenced through inquiries received from Aboriginal and northern communities, federal programs, provincial and territorial governments, industry and utilities. It is expected that the Program will be fully subscribed by November 2010.
- Scientific research this year under the ecoENERGY Technology Initiative has been used to inform codes, standards and regulations facilitating the adoption of new technology. One such example is the changes to be incorporate in the Canadian Electrical Code, that will reduce the risk of investing in wind energy generation.
- The Clean Energy programs were featured in several major government reports released in 2009-2010. These included “Canada’s 5th National Communication on Climate Change: 2010” and “A Climate Change Plan for the Purposes of the Kyoto Protocol Implementation Act, 2009.”
- Senior officials from Canadian provinces and from major GHG emitting countries (US, Russia, China and Brazil) were briefed on Canada’s approach to forest carbon monitoring. As well, the Clean Energy theme assisted Russia to successfully undertake national-scale analyses (>700 million hectares) using a Canadian modelling tool.
2009-2010 Risks and Challenges
- Complementary programs in provinces have helped to increase the visibility and reach of federal Clean Energy initiatives, but this increased interest can pose a challenge for the program resources. This has been the experience of the Retrofit-Homes and Aboriginal and Northern Communities programs.
- The completion of the pre-retrofit evaluation phase of the ecoENERGY Retrofit – Homes program has made the retention of the energy advisor network a challenge. Advisors are needed to ensure that homeowners have access to post-retrofit assessments until March 31, 2011.
- The economic downturn posed a challenge to some Clean Energy programs, as some industrial participants were not in a position to take advantage of federal incentives. In the case of the ecoENERGY for Renewable Heat program, however, complementary provincial programs and an increase to the maximum federal incentive per project helped to keep demand strong.
| Theme's total funding approved under the CAA | Theme's Planned Spending in 2009-2010 | Theme's Actual Spending in 2009-2010 | 2009-2010 Theme Actual Spending Reported within the Economic Action Plan (EAP) |
|---|---|---|---|
| $ 1,462,000,000 | $ 446,255,606 | $ 433,767,156 |
$ 231,653,448 (ecoENERGY Retrofit Program) |
Program: ecoENERGY for Buildings and Houses
| Department |
Natural Resources Canada |
|---|---|
| Departmental Program Activity |
2.1 Clean Energy |
2009-2010 Program's Expected Achievements
See the 2009-2010 Horizontal Report on Plans and Priorities at: http://www.tbs-sct.gc.ca/rpp/2009-2010/CE_1
2009-2010 Program's Achieved Results
The ecoENERGY for Buildings and Houses program supports code development, rating, labelling and training to encourage the construction and retrofit of energy efficient houses and buildings. The program was launched in 2007-2008.
Immediate Outcomes
Partnerships and collaborative agreements with stakeholders to promote clean energy activities that result in lower emissions of greenhouse gases (GHG) and criteria air contaminants (CACs).
- Over 25 provincial/territorial/municipal and utilities and other industry stakeholders offer complementary new and existing housing programs that build on the core tools developed at Natural Resources Canada.
- As of the end of 2009-2010 six provinces have announced changes to their housing codes to achieve the EnerGuide Rating System 80 level by 2012.
- The Buildings component supported making the Model National Energy Code for Buildings 2011 25% more stringent than the 1997 reference document with 11 of the 13 provinces and territories participating in the process.
Awareness and understanding among stakeholders of the potential for, and methods of, reducing GHGs and CACs through energy production and use.
- In 2009-2010 over 529,000 existing homes and 12,000 new homes were rated and labelled. Labelling provides potential home buyers with information regarding the energy efficiency rating of a house. Providing this information makes energy efficient homes relatively more visible and attractive, and steers the market toward increased efficiency. The number of homes labelled annually has steadily increased over the course of the program, given that 180,000 existing and 11,500 new homes were rated and labelled in 2008-2009.
- Seven pilot benchmarking/labelling projects are currently underway with organizations across Canada. Since the launch of the program, 359 labels have been issued as part of the pilot program.
- A program for commissioning and re-commissioning commercial/institutional buildings to ensure that buildings operate in an energy efficient manner was discussed at the Energy and Mines Ministers meeting in 2009.
- Energy efficient practices for buildings and homes were promoted via 147 communications and marketing products, including trade/association publications websites, communiqués, HeadsUP Newsletters, and brochures.
- In 2009-2010, more than 1700 building professionals took part in technical support workshops and over 4700 housing professionals, builders, and energy advisors were trained on software tools and energy efficiency techniques. This greatly exceeds the program goal of 3500 professionals trained per year.
- In 2009-2010, the program delivered 285 workshops to building and housing professionals (exceeding a program target of 205 workshops for the year).
Final Outcomes
Reduced emissions of GHGs and CACs from clean energy activities.
- Since program inception, an estimated 1.07 megatonnes of GHGs were reduced as the result of this program.
| Total Funding Approved Under the CAA | Program's Planned Spending in 2009-2010 | Program’s Actual Spending in 2009-2010 |
|---|---|---|
| $ 61,000,000 | $ 16,533,000 | $16,308,095 |
Program: ecoENERGY Retrofit
| Department |
Natural Resources Canada |
|---|---|
| Departmental Program Activity |
2.1 Clean Energy |
2009-2010 Program's Expected Achievements
See the 2009-2010 Horizontal Report on Plans and Priorities at: http://www.tbs-sct.gc.ca/rpp/2009-2010/CE_2
2009-2010 Program's Achieved Results
The ecoENERGY Retrofit Initiative provides grants to homeowners (Homes component) and transfer payments to owners of small and medium organizations (SMO component) for energy efficiency retrofits. The program was launched in 2007-2008.
Immediate Outcomes
Partnerships and collaborative agreements with stakeholders to promote clean energy activities that result in lower emissions of greenhouse gases (GHG) and criteria air contaminants (CACs).
- At the end of 2009-2010, agreements had been signed with nine provinces, two territories and 8 utilities for the sharing of information and administrative support tools in order to enable a single point of entry for homeowners wanting information to participate in joint or collaborative initiatives.
- All regions of Canada, except one territory, have full or partially matching programs that provide homeowners with seamless access to both orders of government support for home retrofits.
Transfer and/or use of clean energy technologies and practices leading to lower emissions of GHGs and CACs.
- As of March 31st, 2010, more than 275,000 homeowners received grants under the ecoENERGY Retrofit-Homes program by completing a pre-retrofit evaluation and thus received recommendations specific to their home on how to reduce energy consumption and which new technologies could be incorporated in their retrofit plans.
Adoption of renewable energy products and services, and strengthened infrastructure, resulting in reduced GHGs and CACs.
- As of the end of 2009-2010, approximately 25% of Retrofit-Homes participants installed renewable energy technologies and/or water conservation equipment. This is an improvement on the approximately 20% of Retrofit-Homes participants who installed water conservation equipment and/or renewable energy technologies in 2008-2009.
Awareness and understanding among stakeholders of the potential for, and methods of, reducing GHGs and CACs through energy production and use.
- In 2009-2010 alone, over 86,000 calls were responded to by Service Canada, in addition to an unrecorded number of emails to various contact websites, of which 12,000 have been processed. By comparison, over 48,000 calls were received in 2008-2009.
- In 2009-2010, over 1900 participants attended SMO info sessions.
Intermediate Outcomes
Adoption of energy efficiency products and services that result in reduced GHGs and CACs.
- As of the end of 2009-2010, over 275,000 homeowners received grants in support of energy efficiency upgrades that will reduce their annual energy consumption by 22% and corresponding CO2 emissions by 3 tonnes per house per year. Grants averaged $1,390 per household in 2009-2010, compared to an average of $1,305 over the life of the program.
- 517 contribution agreements were signed in 2009-2010 with SMOs in support of energy efficiency upgrades. (SMOs have fewer than 500 employees or less than 20,000 square metres in their buildings.) Last year, the program signed 279 agreements with SMOs.
Final Outcomes
Reduced emissions of GHGs and CACs from clean energy activities.
- As of the end of 2009-2010, the ecoENERGY Retrofit program has resulted in an estimated 1.05 Megatonnes of GHG savings (0.90 Mt from Retrofit-Homes; 0.156 Mt from Retrofit-SMO).
| Total Funding Approved under the CAA | Program's Planned Spending in 2009-2010 | Program’s Actual Spending in 2009-2010 | Actual Spending in 2009-2010 within Economic Action Plan (EAP) |
|---|---|---|---|
| $ 805,000,000 | $ 291,897,900 | $ 290,045,555 | $231,653,448 |
Program: ecoENERGY for Industry
| Department |
Natural Resources Canada |
|---|---|
| Departmental Program Activity |
2.1 Clean Energy |
2009-2010 Program's Expected Achievements
See the 2009-2010 Horizontal Report on Plans and Priorities at: http://www.tbs-sct.gc.ca/rpp/2009-2010/CE_3
2009-2010 Program's Achieved Results
The ecoENERGY for Industry program provides information and tools to encourage the accelerated deployment of energy-saving investments by industry. The program was launched in 2007-2008.
Immediate Outcomes
Involvement by industry in developing and using energy efficiency products, services, and processes that result in lower emissions of Greenhouses Gases (GHGs) and Criteria Air Contaminants (CACs).
- In fiscal year 2009-2010, 321 new companies registered their commitment to improved energy efficiency and became Canadian Industry Program for Energy Conservation (CIPEC) leaders. In comparison, 191 and 156 companies joined CIPEC in 2008-2009 and 2007-2008 respectively. Over 2,200 companies are registered CIPEC Leaders.
- 35 network meeting were held in 2009-2010, and 77 meetings were held in 2008-2009. In both years, the target of 30 network meetings was exceeded.
Awareness and understanding among stakeholders of the potential for, and methods of, reducing GHGs and CACs through energy production and use.
- In fiscal year 2009-2010, 1,060 industrial energy managers attended "Dollars to $ense" workshops. By comparison, 760 industrial energy managers attended Dollars to $ense workshops in 2008-2009. These workshops provide information on finding and realizing energy savings. Attending workshops is one facet of CIPEC participation.
- Three benchmarking studies, technical guides and other tools were developed in 2009-2010, leading to improved energy efficiency in Canadian Industry, reaching the yearly target. Six tools were created in 2008-2009.
Intermediate Outcomes
Adoption of energy efficiency products and services that result in reduced GHGs and CACs
- A survey of the 156 new CIPEC Leaders from 2007-2008, the first year of the ecoENERGY Industry program, indicated that:
- Of the new Corporate members that registered their corporate energy efficiency commitments, 83% have energy reduction targets;
- 83% of the respondents indicated an increase in level of awareness and knowledge of energy savings opportunities and practices in their companies as a result of the CIPEC tools and services; and
- 74% of the respondents indicated CIPEC tools and services resulted in the implementation of energy efficiency measures by their companies.
- Five advanced energy assessment studies (Process Integration and Computational Fluid Dynamics studies) were funded in 2009-2010 with the objective of identifying energy-saving opportunities. To date, 24 of these energy assessment studies have been completed. The target for the program by the end of March 2011 is 36 studies. Industry feedback shows that these studies identify energy savings of 10-25%.
- The program funded 3 data and analysis studies in 2009-2010: an Impact Attribution Study, Upstream Oil and Gas Study, and Electricity Generation Study.
Final Outcomes
Reduced emissions of GHGs and CACs from clean energy activities.
- Since program inception, ecoENERGY for Industry has led to an estimated 1.1 Megatonnes of GHG savings, which falls in the target range of 0.4-1.7 Mt GHGs. The lower end of the target range includes only those industries which are not slated for GHG regulations. The upper end of the target range includes all industries.
| Total Funding Approved Under the CAA | Program's Planned Spending in 2009-2010 | Program’s Actual Spending in 2009-2010 |
|---|---|---|
| $ 18,000,000 | $ 4,300,000 | $ 4,348,323 |
Program: ecoENERGY for Renewable Heat
| Department |
Natural Resources Canada |
|---|---|
| Departmental Program Activity |
2.1 Clean Energy |
2009-2010 Program's Expected Achievements
See the 2009-2010 Horizontal Report on Plans and Priorities at: http://www.tbs-sct.gc.ca/rpp/2009-2010/CE_5
2009-2010 Program's Achieved Results
The ecoENERGY for Renewable Heat program provides incentives and training and supports standards development to promote the increased use of renewable energy technologies in space heating and cooling and water heating applications in buildings.
Immediate Outcomes
Transfer and/or use of clean energy technologies and practices leading to lower emissions of greenhouse gases (GHG) and criteria air contaminants (CACs).
- 3 contribution agreements for residential pilot projects were signed in 2009-2010. Combined with the 11 signed in 2008-2009, the Program had 14 contribution agreements in place at the end of 2009-2010, surpassing the planned target of 8 contribution agreements. If all of the committed systems are installed, it will result in 6,100 solar domestic water heaters by the end of 2010-2011. However, due to regulatory issues and the impact of the changes to the ecoENERGY Retrofit – Houses program, discussed below, the residential pilot incentive is now expected to see the installation of only 3000 systems by the end of the program on March 31, 2011.
- In the industrial/commercial/institutional (ICI) sectors, 252 contribution agreements were signed in 2009-2010. Combined with those signed previously, 831 contribution agreements have been signed and these will lead to the installation of 972 systems, surpassing the Program target of 700 systems. Note that some contribution agreements cover more than one system.
Awareness and understanding among stakeholders of the potential for, and methods of, reducing GHGs and CACs through energy production and use.
- New versions of the Canada Standards Association (CSA) F379 and F383 standards were published in 2008-2009. In 2009-2010, amended versions of CSA F379 and F383 were developed, but publication of the amended standards will be in 2010-2011. Significant development of a new version of F378 took place in 2009-2010 and publication in 2010-2011 is expected. F379 is a CSA standard for packaged solar domestic hot water equipment testing and F383 details how the systems should be installed.
- Since program inception, agreements have been signed with 9 companies for the certification of domestic solar water heating systems. These agreements are intended to defray the costs for these certifications and encourage growth within the industry. Two of these systems were certified in 2009-2010, meeting the planned target and bringing the total to 5 certified systems. Also, one of the previously certified systems added a double-wall heat exchanger model to their certification listing. In certain jurisdictions in Canada, British Columbia for one, building inspectors require double-wall heat exchangers.
- Enerpool and Watsun software design tools were upgraded, meeting the planned target. Upgrading of the Swift software is nearing completion. These tools provide system designers with realistic predictions of performance of solar thermal systems prior to purchase and construction, and allow the impact of design choices to be evaluated in advance. In this way, the tools lead to the application of better performing, more cost-effective systems.
- Three occupational standards for designers and installers were developed and published in 2009-2010. These standards form the basis for the development of quality solar thermal, photovoltaic and geoexchange training and certification programs.
Intermediate Outcomes
Adoption of renewable energy products and services, and strengthened infrastructure, resulting in reduced GHGs and CACs.
- 283 solar thermal systems were installed in the ICI sectors in 2009-2010 (155 solar air systems and 128 solar water systems). This is compared to 259 (178 solar air, 81 solar water) systems were installed in 2008-2009, and 195 (171 solar air, 24 solar water) systems installed in 2007-2008.
- The planned target of 175 systems was met.
- 466 systems were installed as part of the residential pilot projects in 2009-2010. An additional 97 were installed in 2008-2009 bring the total to 563 systems.
- An annual national survey was completed for the solar thermal and geoexchange industries. This survey indicated a growth of 65% for the geoexchange industry in 2009 over 2007.
Final Outcomes
Reduced emissions of GHGs and CACs from clean energy activities
- The systems installed under the program in 2009-2010 are expected to result in energy savings of 90,278 gigajoules (GJ)/year, which translates to 8.56 kilotonnes (Kt) of GHG reductions per year. In 2008-2009 a different mix of energy sources displaced (natural gas, propane or electricity) resulted in that year’s energy saving of 91,018 GJ yield 5.5 Kt of GHG reductions.
- This exceeds the planned target of 0.09 petajoules (90,000 GJ) worth of energy savings and a reduction of approximately 5 Kt of GHG emissions.
- By comparison, the systems installed under the program in 2008-2009 and 2007-2008 are expected to result in annual savings of 91,018 GJ of energy and 5.5 Kt of GHGs, and 52,236 GJ of energy 3.3 kt of GHGs respectively.
- To date, the program is estimated to save an estimated 233,532 GJ of energy and 17.36 kt of GHGs per year.
| Total Funding Approved Under the CAA | Program's Planned Spending in 2009-2010 | Program’s Actual Spending in 2009-2010 |
|---|---|---|
| $ 36,000,000 | $ 8,090,000 | $ 6,849,640 |
Program: ecoENERGY for Renewable Power
| Department |
Natural Resources Canada |
|---|---|
| Departmental Program Activity |
2.1 Clean Energy |
2009-2010 Program's Expected Achievements
See the 2009-2010 Horizontal Report on Plans and Priorities at: http://www.tbs-sct.gc.ca/rpp/2009-2010/CE_4
2009-2010 Program's Achieved Results
The ecoENERGY for Renewable Power program provides power production incentives to support emerging renewable energy sources (e.g., wind, hydro, solar, biomass). Projects supported through this program include, for example, wind energy projects larger than 1 megawatts (MW). Incentives continue up to 2021.
Immediate Outcomes
Transfer and/or use of clean energy technologies and practices leading to lower emissions of greenhouse gases (GHG) and criteria air contaminants (CACs).
- 20 new notices of application were registered between April 1, 2009 and March 31, 2010, for a total of 239 registered projects under the program to date. By comparison, the program received 68 notices of application in 2008-2009.
- 49 new contribution agreements with power production companies were signed during the year, representing projects that will generate 1,660 MW of new renewable power capacity in Canada and 5,032 gigawatt hours (GWh) per year of additional production. In 2008-2009, the program signed 40 contribution agreements. As of the end of 2009-2010, the program had signed contribution agreements with 98 proponents in total.
Intermediate Outcomes
Increased production of clean electricity from renewable sources such as wind, biomass, hydro and solar energy resulting in reduced GHGs and CACs.
- 26 projects were commissioned in 2009-2010. These have increased the renewable energy capacity in Canada by 1042.6 MW and will receive approximately $338 million in support under the ecoENERGY for Renewable Power program, thereby exceeding the planned target. Projects commissioned in 2008-2009 represented 849 MW of capacity.
- The 26 projects commissioned this year are expected to generate approximately 3.4 terawatt hours (TWh) of electricity annually.
- Overall, 55 of the program’s 98 projects with signed agreements have been commissioned as of the end of 2009-2010, representing 2634.6 MW in generating capacity. These commissioned projects have generated 8.2 TWh of low-impact renewable energy since program inception (includes full yearly production from 2007-2008 and 2008-2009 and partial production in fiscal year 2009-2010).
- The program has committed approximately $821 million of incentive support to its 55 commissioned projects. The 98 signed contribution agreements represent an anticipated $1.346 billion of federal funding.
Final Outcomes
Reduced emissions of GHGs and CACs from clean electricity production
- The 26 projects commissioned this year are expected to avoid 1.58 megatonnes (Mt) of CO2 equivalent annually during each of the ten years they will receive the incentive.
- The expected GHG reduction from all 55 commissioned projects during 2009-2010 was 2.92 Mt of CO2 equivalent, based on annual production from projects commissioned in 2007-2008 and 2008-2009, and partial production of projects commissioned in 2009-2010. When all 55 commissioned projects are producing for a full year, the expected annual GHG emission reductions will be about 3.83 Mt/year or 38.3 Mt over 10 years.
- Once all 98 projects are commissioned, the expected GHG emission reductions will be about 6.27 Mt per year. This would be in line with the program target to reduce GHG emissions by 6 - 6.7 Mt per year by 2012.
| Total Funding Approved Under the CAA | Program's Planned Spending in 2009-2010 | Program’s Actual Spending in 2009-2010 |
|---|---|---|
| $276,000,000 | $67,214,000 | $59,076,622 |
Program: ecoENERGY Technology Initiative
| Department |
Natural Resources Canada |
|---|---|
| Departmental Program Activity |
2.1 Clean Energy |
2009-2010 Program's Expected Achievements
See the 2009-2010 Horizontal Report on Plans and Priorities at: http://www.tbs-sct.gc.ca/rpp/2009-2010/CE_6
2009-2010 Program's Achieved Results
The ecoENERGY for Technology Initiative (ecoETI) supports the research, development and demonstration of clean energy technologies (e.g., carbon capture and storage (CCS), hydrogen, and biomass).
Immediate Outcomes
Partnerships and collaborative agreements with stakeholders to promote clean energy activities that result in lower emissions of greenhouse gases (GHG) and criteria air contaminants (CACs).
- ecoETI has completed all calls for proposals and its funds are fully committed. Contribution agreements for eight carbon capture and storage projects (in British Columbia, Alberta and Saskatchewan) have been signed, and all projects are now underway in the engineering and storage characterization stage.
Transfer and/or use of clean energy technologies and practices leading to lower emissions of GHGs and CACs.
- Significant progress in broad range of research and development projects to reduce technical (and other) risks in the areas of low emission industrial processes, energy efficient built environment, clean transportation systems, distributed power generation, sustainable bioenergy, and clean coal and CCS. For example:
- Commencement of front-end engineering studies and demonstrations of integrated carbon capture and storage projects in partnership with the private sector and provincial agencies. The Capital Power FEED (Front End Engineering Design) project is complete.
- Completion of a successful wind technology roadmap that will set out guidelines for future federal involvement in the technical development of wind energy in Canada, including utility offshore wind systems.
- Progress has been achieved on production of inventories of existing, new, and opportunity forest and agriculture biomass resources, in a single database (GIS-based web portal).
- Demonstration and integration of pre-commercial hydrogen and fuel cell technologies and infrastructure for successful vehicle demonstration fleet, including 20 fuel cell Olympic Village hydrogen buses now in regular service which are expected to operate for up to 20 years.
- Development of tools, improved process design, bench scale testing, and partner site validation to reduce the energy/emissions footprint for industry and 13 projects are now underway.
- Seven Bitumen Oil and Gas projects – related primarily to tailings technologies, water management, extraction processes, and air emissions – are progressing as scheduled and are expected to be completed in 2010‑2011.
- Successful determination of thermodynamic parameters governing hydrocarbon partitioning, and quantification of naphtha in the tailings fractions progressing towards improvement of solvent recovery systems in oil sands operations and consequently improved air quality through reduced loss of Volitile Organic Compounds to the atmosphere.
- Progress has begun on implementation of partnerships with municipalities, builders and developers covering elements of planning and construction of highly energy efficient buildings and communities through the successful negotiation of the ecoEquilibrium Communities initiative with Canada Mortgage and Housing Corporation. Projects will cover early stage community planning as well as building construction projects.
- Produced many science and technology publications, reports and workshops, targeted at stakeholders operating at the next stage of the innovation continuum.
- Development of Community Energy Solutions Roadmap on behalf of the Demand Side Management Working Group of the Council of Energy Ministers. Roadmap was released in Fall 2009.
| Total Funding Approved Under the CAA | Program's Planned Spending in 2009-2010 | Program’s Actual Spending in 2009-2010 |
|---|---|---|
| $ 226,440,000 | $ 48,172,706 | $ 48,166,167 |
Program: Policy, Communications, Monitoring and Reporting
| Department |
Natural Resources Canada |
|---|---|
| Departmental Program Activity |
2.1 Clean Energy |
2009-2010 Program's Expected Achievements
See the 2009-2010 Horizontal Report on Plans and Priorities at: http://www.tbs-sct.gc.ca/rpp/2009-2010/#CE_7
2009-2010 Program's Achieved Results
Immediate Outcomes
Policy
Policy and monitoring that supports greenhouse gases (GHG) and criteria air contaminants (CACs).
- Provided timely strategic advice, information, analysis of policy options and recommendations to the Minister and senior officials on climate change and clean air issues in support of policy and program development and decision making.
- Provided high-quality advice and recommendations that influenced refinements to the Regulatory Framework for Industrial Greenhouse Gas Emissions.
- Continued to provide policy and economic analysis and advice on carbon capture and storage (CCS). Also facilitated collaboration among CCS stakeholders such as Natural Resource Canada (NRCan) officials, other federal departments, provincial governments, non-governmental organizations, and CCS project proponents.
- Worked closely with Environment Canada (EC) and other federal departments and agencies on climate change modelling activities; reference case development on GHG emissions, and energy production and consumption; and sectoral economic assessments for the Clean Air Regulatory Agenda.
- Coordinated and led departmental input to major Government of Canada reports, including “Canada’s 5th National Report on Climate Change” and “A Climate Change Plan for the Purposes of the Kyoto Protocol Implementation Act.”
- Led horizontal reporting for NRCan’s Clean Air Agenda programs.
- Prepared a new projection of Canada's energy demand and supply to 2030 titled “Canada's Energy Outlook to 2030: The Reference Case 2010.” The report has benefited from extensive consultations with different sectors of NRCan, other federal departments, provincial and territorial government, some utilities and major industry associations.
- Continued to enhance NRCan's modelling capacity (MAPLE-C).
Strategic Communications
Awareness and understanding among stakeholders of the potential for, and methods of, reducing GHGs and CACs through energy production and use.
- 96 announcements including ministerial events related to ecoENERGY programming were organized. Drafted 63 sets of speaking notes to support these events.
- Production of a series of fact sheets on CCS.
- Responded to 112 media calls related to the ecoENERGY Initiatives.
- Development of web information to communicate energy conservation tips to the general public.
- Effective issues management including pro-active issues identification and planning and implementation of appropriate communications responses.
- Production of marketing and outreach material to support the expansion of the ecoENERGY Retrofit-Homes initiative.
Forest Policy and Monitoring
Transfer and/or use of clean energy technologies and practices leading to lower emissions of GHGs and CACs.
- Strong interest continued in use of the Carbon Budget Model (CBM-CFS3) with total downloads of the model since it first became available rising to over 675 from 500 in 2008-2009, and the number of countries involved rising from 42 to 45.
- Three workshops on the model in 2009-2010 were attended by 57 trainees from 5 countries (Canada, Mexico, Italy, Spain, and South Korea). Interest in these training workshops has become exceptionally high in Canada, with all seats booked within days of announcement, mostly by Canadian forest industry participants.
- Joint projects continued with Russia and Mexico on using the model, and new projects were initiated with Italy, South Korea, and Australia (Tasmania).
- Invited keynote presentations were given at international carbon workshops in Japan, China, and Korea as well as invited presentations at Intergovernmental Panel on Climate Change (IPCC) experts meetings in Brazil and Japan.
Awareness and understanding among stakeholders of the potential for, and methods of, reducing GHGs and CACs through energy production and use.
- Eleven high impact publications in scientific literature.
- Canadian Forest Service (CFS) science and policy experts engaged stakeholders directly to encourage forest sector GHG mitigation action by giving numerous presentations and participating in meetings across Canada and internationally. As a result, interest in forest sector mitigation actions and awareness of the challenges and opportunities involved was greatly enhanced.
- CFS scientists engaged the scientific community across Canada, in the United States, and around the world by taking on an increasingly leadership role in organizations, including the Intergovernmental Panel on Climate Change, the Global Network for Forest Science Cooperation, the International Boreal Forest Research Association, the International Energy Agency, Canadian Carbon Program, North American Carbon Program, and others. All provinces and territories were engaged to improve understanding of forest carbon, improve carbon monitoring and reporting, and to build capacity at the provincial/territorial level.
Policy and monitoring that supports GHG and CAC reductions.
- Continued discussion and joint technical policy analysis with provinces and territories through the federal/provincial/territorial National Forest Sinks Committee, including initiation of a multi-year workplan to assess the potential and policy options related reducing emissions and increasing removals in Canada’s managed forest.
- Analysis on-going to inform Canada’s negotiating position on rules for post-2012 international accounting for forests. Canadian leadership in developing improved accounting rules for the Land use, land-use change and forestry sector to incent greater mitigation activity was acknowledged both informally by negotiating teams from other United Nations Framework Convention on Climate Change (UNFCCC) parties and indirectly by them having adopted Canadian approaches in their own analyses.
- Provision of forest-related information on areas and GHG emissions and removals for 1990‑2008 to Environment Canada for inclusion in the 2010 National GHG inventory submission to the UNFCCC and Canada’s first national reporting accounting under the Kyoto Protocol (for the year 2008).
- Canada’s National Forest Carbon Monitoring, Accounting and Reporting System development continued, including ongoing migration toward state of the art data management and computing system architecture and improved protocols for exchange of data and information between CFS, EC, and Agriculture and Agri-Foods Canada to ensure the business needs of all three departments are met.
| Total Funding Approved Under the CAA | Program's Planned Spending in 2009-2010 | Program’s Actual Spending in 2009-2010 |
|---|---|---|
| $ 24,560,000 | $ 6,298,000 | $ 5,169,053 |
Program: ecoENERGY for Aboriginal and Northern Communities
| Department |
Indian and Northern Affairs |
|---|---|
| Departmental Program Activity |
Community Infrastructure |
2009-2010 Program's Expected Achievements
See the 2009-2010 Horizontal Report on Plans and Priorities at: http://www.tbs-sct.gc.ca/rpp/2009-2010/CE_8
2009-2010 Program's Achieved Results
The ecoENERGY for Aboriginal and Northern Communities program continues to provide support to Aboriginal and Northern communities working on clean energy projects, including the approximately 150 remote communities that rely on diesel power generation. Through funding agreements, the program equips Aboriginal and northern communities with the knowledge and tools to increase the energy efficiency of community infrastructure, to access renewable energy opportunities and to implement cost effective renewable energy projects. The 30 renewable energy, energy efficiency and community energy planning projects supported by the program in 2009-2010 will help to reduce the communities’ reliance on diesel fuel, lower their energy costs, contribute to the reduction of greenhouse gases (GHG) and criteria air contaminants (CAC) in Canada, and most importantly, assume a role in improving the health of their members. Not only does the Program promote environmentally sustainable communities, but it provides funding to enable Aboriginal and northern communities to access economic development opportunities that will directly benefit their communities.
Immediate Outcomes
Transfer and/or use of clean energy technologies and practices leading to lower emissions of (GHG and CACs.
- In 2009-2010, Indian and Northern Affairs Canada (INAC) provided $2.57 million in contributions to 30 renewable energy, energy efficiency and community energy planning projects within 29 of the approximately 650 Aboriginal and northern communities within Canada. By comparison, the program provided $2.69 million in contributions for 25 projects in 24 communities in 2008-2009. The 30 funded projects include 17 Renewable Energy projects, 7 Energy Efficiency projects, and 6 Community Energy Planning projects.
- Funding contributions were provided for a range of renewable energy and energy efficiency projects. Examples of projects receiving funding include the installation of photovoltaic systems, waste heat recovery systems, and ground source heat pumps; wind energy and hydro generation projects.
- As of March 31, 2010, a total of 76 projects in 64 Aboriginal and northern communities had received $7.3 million in federal funding through the Program. The 76 funded projects include 13 community energy planning projects, 14 energy efficiency projects, and 49 renewable energy projects.
Awareness and understanding among stakeholders of the potential for, and methods of, reducing GHGs and CACs through energy production and use.
- The ecoENERGY for Aboriginal and Northern Communities Program continues to gain momentum. Since the beginning of the Program on April 1, 2007, the number of funding applications received has steadily increased: 24 applications in 2007-2008, 34 applications in 2008-2009, and 53 applications in 2009-2010. It is anticipated that the Program will again receive in excess of 50 applications during 2010-2011 and it is expected that the Program will be fully subscribed by November 2010.
- In 2009-2010, 30 out of the 53 applications received were approved and received funding. These projects provided the resources for 29 communities, including 11 off-grid, to equip them with the knowledge and tools to increase energy efficiency and to access renewable energy opportunities within their communities. Since April 1, 2007, a total of 64 Aboriginal and northern communities have benefited from 76 projects funded by the program.
- Interest in the ecoENERGY for Aboriginal and Northern Communities Program continues to build, evidenced through inquiries received from Aboriginal and northern communities, federal programs, provincial and territorial governments, industry and utilities. It is anticipated that with rising global fuel costs and the associated energy sustainability challenges faced by Aboriginal and northern communities, the need for this type of programming will continue beyond March 31, 2011.
- An Off-Grid Communities Framework was developed in 2009-2010, which will assist INAC to facilitate the implementation of future renewable energy and energy efficiency projects within the over 150 off-grid Aboriginal and northern communities. Departmental and National Off-Grid Communities working groups were established to discuss the challenges being faced by off-grid communities across Canada and collaborate on solutions to address the challenges. INAC co-chairs the National Off-Grid Communities Working Group with the Government of British Columbia and the National Research Council of Canada (NRC). Members of the working group include various sectors within INAC (headquarters and regional offices), federal departments and agencies (Natural Resources Canada, Industry Canada, Canada Mortgage and Housing Corporation, Canadian Northern Economic Development Agency, Public Works and Government Services Canada), provincial and territorial governments, as well as Aboriginal and northern community members.
- INAC’s Ontario regional office has developed a detailed workplan to address the large number of First Nations actively pursuing energy projects. First Nation interest in clean energy projects is due in part to the Ontario Green Energy Act which facilitates Aboriginal involvement and/or ownership in renewable energy projects. INAC’s funding provides critical early stage funding that allows First Nations to pursue environmentally beneficial energy projects.
Intermediate Outcomes
Adoption of energy efficient products and services that result in reduced GHGs and CACs. Adoption of renewable energy products and services, and strengthened infrastructure, resulting in reduced GHGs and CACs.
- Of the renewable energy and energy efficiency projects funded since April 1, 2007, 10 have been successfully commissioned to date and it is anticipated that another 13 projects will be fully commissioned by the program end date of March 31, 2011. It is anticipated that the commissioned projects will result in reductions of GHG emissions of 0.001 Megatonnes (MT) during 2009 and another 0.009 Mt during 2010. These projects include renewable energy installations and energy efficiencies that are being incorporated into community infrastructure, such as recreational complexes, arenas, community centres, district heating and smart metering.
Final Outcomes
- It is projected that the renewable energy and energy efficiency projects supported by the ecoENERGY for Aboriginal and Northern Communities Program in 2009-2010 will result in a reduction of 1.481 Mt CO2 (over a 20-year period) once the projects are commissioned. Since April 1, 2007, the total anticipated reduction of GHG emissions by projects funded by the program is 4.196 Mt (over a 20-year period). Once commissioned, these projects will create new sources of renewable power and reduce the reliance of Aboriginal and northern communities on fossil fuels and therefore result in a decrease of GHG emissions.
| Total Funding Approved Under the CAA | Program's Planned Spending in 2009-2010 | Program’s Actual Spending in 2009-2010 |
|---|---|---|
| $ 15,000,000 | $ 3,750,000 | $ 3,803,701 |
Theme: Clean Transportation
| Lead Department |
Transport Canada |
|---|---|
| Federal Theme Partners |
Natural Resources Canada, Environment Canada, Human Resources and Skills Development Canada |
Expected Results from Theme's Programming
Immediate Outcomes
- Informed positions on policies and programs influencing transportation technologies and practices;
- Increased uptake of technologies that reduce energy consumption, greenhouse gases (GHG) and criteria air contaminants (CACs);
- Increased participation by target audience in emission reducing activities through partnerships and other program activities; and
- Increased capacity by target audience to undertake initiatives that reduce energy consumption or greenhouse gases (GHG) or criteria air ccntaminants (CAC) or release of toxic substances.
Intermediate Outcomes
- Use of transportation technologies and alternative modes that reduce energy consumption or GHG or CAC; and
- Use of transportation best practices that reduce energy consumption or GHG or CAC.
Final Outcomes
- Reductions in energy consumption or GHG or CAC from transportation.
2009-2010 Expected Achievements
See the 2009-2010 Horizontal Report on Plans and Priorities at: http://www.tbs-sct.gc.ca/rpp/2009-2010/CT_Theme
2009-2010 Achieved Results
In 2009-2010, the Clean Transportation programs continued to address the challenges of pollution and GHG emissions from the movement of goods and people in Canada and they are on track to reduce emissions by almost 2.4 Megatonnes in 2012. The progress occurred despite the economic recession, which reduced the financial capacity of program stakeholders such as industry, municipal governments and non-governmental organizations. The Clean Transportation Theme focused on reducing financial and information barriers to the uptake of clean technologies and best practices.
Harmonization of regulations and standards also play an important role in reducing emissions. The Clean Transportation Theme programs contributed to the development of international environmental standards, practices and guidelines under the auspices of the International Marine Organization and the International Civil Aviation Organization. In addition, significant foundational work supported the implementation of heavy truck speed limiter regulations in two provinces.
More specifically, the Clean Transportation Theme programs have achieved significant results that are grouped under the following five outcome categories:
Informed positions on policies and programs
- With the federal/provincial/territorial Sustainable Transportation Task Force, a national data strategy was launched to further develop the knowledge base of the transportation sector.
- Two modules were added to the Transportation Energy Use and Emissions Model to enable the analysis of program and regulatory initiatives to improve light-duty passenger vehicle fuel efficiency and to assess the proposed regulation of railway emissions.
- The goal to complete research studies on opportunities to reduce emissions from the trucking sector was met. Studies were completed on real-life experiences with idle-reduction options, the use of aerodynamic devices for heavy-duty trucks and the heavy-duty truck tires (examining tire traction in winter conditions and the purchasing process used by companies).
- The ecoTECHNOLOGY for Vehicles program helped inform the development of new practices and codes and standards for advanced technology vehicles. For example, the program promoted the development of codes and standards to measure the exhaust emissions and fuel economy of plug-in hybrid electric vehicles; developed Canadian performance data for battery electric vehicles, plug-in hybrid and clean diesel technologies to inform the development of regulations; and conducted a study on low-rolling resistance tires to inform the work of governments, tire manufacturers, industry and other stakeholders.
Increased uptake of emission-reducing technologies
- The ecoTECHNOLOGY for Vehicles program tested and evaluated the environmental and safety performance of eight different advanced technology vehicles.
- The implementation of new regulations in Ontario and Quebec to mandate the activation of heavy-duty trucks speed limiter (max 105km/h) was completed;
- To date $6.5 million (M) was contributed to freight transportation organizations through the Freight Technology Incentive program to help them purchase and install proven emission-reducing technologies. Over 180 applications were received for the second round of funding, representing a three-fold increase from the first round and a significant expansion in the range of technologies to be addressed by the program.
- The Port Metro Vancouver project to demonstrate shore-based power which allows cruise ships to shut down their electric generator engines was completed and results are being measured and documented.
Increased participation by the target audience in emission-reducing activities
- The Vehicle Scrappage program provided incentives to consumers to retire 64,000 old, high-polluting vehicles of model year 1995 and earlier, resulting in a reduction of 2900 tonnes of smog-forming pollutants. This exceeded the target of 50,000 vehicles. The incentive cost to the Canadian government is about 7% of the equivalent cost to the United States government for a similar program that ran from July to August 2009. Fifty-seven per cent of the program participants said that the program prompted them to get rid of their vehicle sooner than they otherwise would have.
- The ecoAUTO Rebate Program ended after the 2008 model year. The analysis conducted, based on existing surveys, indicates that during the ecoAUTO Rebate Program implementation period, Canadians became aware that there is a link between personal vehicle use and the environment, and that increasing the number of fuel‑efficient vehicles on the road will help both the environment and reduce their fuel costs.
- The ecoENERGY for Fleets program exceeded its target by signing collaborative agreements under which the trucking industry will retrofit over 500 tractors and trailers with fuel efficient components to demonstrate their use in Canada. This is expected to save nearly 3 million litres of fuel and 7,000 tonnes of GHG emissions annually.
Increased capacity by the target audience to undertake emission-reducing initiatives
- The ecoMobility program delivered several learning events and activities that reached at least 850 municipal practitioners of Transportation Demand Management (TDM) to improve their ability to implement and measure the effectiveness of TDM policies and programs.
- Environment Canada developed a national Code of Practice for responsible recycling of vehicles, with audits to ensure compliance. It also held training sessions for vehicle recyclers across Canada, and implemented an on-line training tool.
- The ecoENERGY for Personal Vehicles program exceeded its target by providing in-class training on fuel efficient driving practices to over 350,000 new drivers. It also published the 2010 Energuide for Vehicles fuel consumption guide and the Most Fuel Efficient Vehicles List. The program funded nine proposals out of 36 received, and distributed $1.7 million to enable recipients to deliver outreach activities aimed at increasing consumers’ awareness and adoption of energy efficient practices. Of the 580,000 drivers who have received training since the inception of this program, 290,000 are expected to actively use fuel efficient driving techniques to save more than 17 million litres of fuel and 40,000 tonnes of GHGs.
- The ecoENERGY for Fleets program exceeded its targets by training nearly 14,000 transportation professionals on fuel efficient driving, maintenance and business practices. This is expected to save nearly 45 million litres of fuel and 100,000 tonnes of GHG emissions annually. The program provided training at 88 workshops and by providing access to decision-support and information sources, such as the aerodynamics guide On the Road to a Fuel Efficient Truck, the program website (which received 47,000 hits), and two idle reduction campaigns. In addition, the program completed funding agreements that will allow 11 fleets to demonstrate and adopt fuel efficient fleet technologies with a total contribution of $1.6 M.
Increased awareness, knowledge and acceptance of energy efficient transportation technologies and best practices
- The Freight Technology Demonstration Fund contributed $4.1 million towards the purchase, installation and demonstration of new and under utilized emission-reducing technologies in the freight industry. The ecoFREIGHT programs have also allowed an indirect uptake of technology from recipients who have extended the demonstrated technologies to a bigger part of their fleet.
- The ecoFreight Partnerships program sponsored three events to facilitate the transfer of information and knowledge about emissions reduction technologies and practices to the freight industry: the Supply Chain and Logistics (SCL) Association seven-city briefing tour, Globe’s 2010 Low Carbon Shipping Session and the Strategy Institute’s Lean and Green Supply Chain Strategies Summit. In addition, this program sponsored the Green Supply Chain Award and the ecoFREIGHT Transportation Award, presented at SCL’s Annual Conference and at Globe 2010 respectively, to recognize outstanding industry efforts.
- The ecoFREIGHT Partnerships program published on its website information and decision tools for freight shippers and forwarders. Visitors to the website increased from 12,932 in 2008 to 26,649 in 2009.
- The ecoTECHNOLOGY for Vehicles program had showcase exhibits at 22 major events to increase public awareness about advanced technology vehicles and to offer ride and drive opportunities.
A theme-level program evaluation started in 2009-2010 and is continuing in 2010-2011. It will address issues of relevance, performance and cost-effectiveness.
2009-2010 Successes
Light Duty Vehicle and Urban Transportation Programs
- In accordance with a Memorandum of Understanding with the ecoENERGY for Personal Vehicles Program, the Province of Ontario incorporated fuel efficiency as part of the province's mandatory driver training curriculum in 2009-2010. As a result, over 150,000 new drivers will be educated regarding fuel efficiency each year, using materials developed by ecoENERGY for Personal Vehicles.
- In 2009-2010, the Vehicle Scrappage program activities led to the retirement of over 64,000 old, high-polluting vehicles.
- The ecoMobility program has succeeded in supporting modal shifts by establishing a strong and active network of TDM practitioners across Canada, to complement the investments made during the 2009-2010 in public transit through federal infrastructure funding.
- The test results of the ecoTechnology for Vehicle program were essential in ensuring that Canadian-specific cold weather climate issues were addressed in the development of electric vehicle (EV) energy consumption and range test procedures by the Society of Automotive Engineers’ (SAE J1634) Committee. These procedures will be essential in determining Canadian energy label values for EVs, and how an EV’s range is communicated to Canadian consumers.
Freight Transportation Programs
- Since 2008, the Freight Technology Incentives Program, the Freight Technology Demonstration Fund, the Marine Shore Power Program and the ecoEnergy for Fleets program have supported industry in the purchase of over 3,100 emission-reducing pieces of equipment in the transportation sector.
- The ecoENERGY for Fleets program has put in place four MOUs with provinces and territories, and is negotiating with five more. Under these agreements, the province or territory will incorporate knowledge of fuel efficient driving techniques as a requirement in commercial driver licensing for novice drivers and the ecoENERGY for Fleets program will provide the necessary educational and information materials.
- During 2009-2010, Ontario and Quebec, representing 60% of trucking activity in Canada, implemented heavy-duty truck speed limiter regulations for all trucks operating within their jurisdictions.
2009-2010 Risks and Challenges
- The economic recession is having broad effects on the uptake of programs. It has reduced the funds that freight companies are currently able to invest in new fuel efficient technologies, particularly where there is significant financial or technological risk. It has reduced the availability of leveraged investments from traditional program stakeholders such as municipal governments, and non-governmental organizations which have either reduced their outreach activities or ceased operations altogether.
- With respect to the National Harmonization Initiative for the Trucking Industry, there remain a number of provinces that do not support mandatory implementation of regulations requiring speed limiting devices. The federal government’s ability to foster full national implementation is thus constrained.
- While the emissions benefits of marine shore power are being demonstrated, the complexity of such projects, including the need to establish a cost-effective relationship with electricity suppliers to support the technology and to establish a sustainable business case has limited the number of ports who are in a position to test out the technology within the timelines
of the Marine Shore Power Program.
| Theme's total funding approved under the CAA | Theme's Planned Spending in 2009-2010 | Theme's Actual Spending in 2009-2010 |
|---|---|---|
| $ 463,000,000 | $ 70,528,017 | $ 52,992,779 |
Program: ecoMOBILITY
| Department |
Transport Canada |
|---|---|
| Departmental Program Activity |
2.1 Clean Air from Transportation |
2009-2010 Program's Expected Achievements
See the 2009-2010 Horizontal Report on Plans and Priorities at: http://www.tbs-sct.gc.ca/rpp/2009-2010/CT_1
2009-2010 Program's Achieved Results
As the ecoMOBILITY program enters its fourth year, it has become a well-established program with relationships with its target audience including provinces, municipalities and other organizations. These people provide valuable information to the program on the information gaps and barriers affecting their ability to implement Transportation Demand Management (TDM) projects. In response to this feedback, the program has identified the activities that will be undertaken until the end of the program.
Financial support
In 2009-2010, under the EcoMOBILITY program, 12 municipalities and regional transportation authorities had a contribution agreement in place for 13 projects to implement TDM projects across Canada. One approved project’s Contribution Agreement remains to be signed in 2010-11. The total contribution for those projects is $3 million (M) under the Program, which has
leveraged an additional $6 M from other partners.
The funding provided for these projects contributed to reach the program’s immediate outcome to increase capacity by the target audience to undertake initiatives that reduce energy consumption or greenhouse gas (GHG) or criteria air contaminant (CAC) toxic substances and an increase in the number of program activities underway. The contribution component of the program supported the implementation and performance measurement of TDM projects to increase the use of sustainable transportation options such as transit, carpools, cycling and walking and reduced travel through telework. Through the program, the government is helping find ways to meet transportation needs while protecting the environment.
Partnerships and Networks
The ecoMOBILITY Program also developed a number of tools to support Green TDM project implementation, including the Canadian TDM Measurement Guidelines, a guide on Transportation Options for Small and Rural Communities, a Bike Sharing Guide and the document Workplace Travel Plans: Guidance for Canadian Employers.
A number of learning events and activities were organized or sponsored by the ecoMOBILITY program for municipal TDM practitioners and decision-makers. These events increased the participants’ knowledge to foster ongoing implementation and measurement of TDM policies and programs. Such events included:
- 8 webinars in both official languages between June 2009 and March 2010;
- 2 sessions sponsored at conferences : Social Marketing at Moving Minds Workshop at Transportation Association of Canada Conference (October 2009) and Implementing Sustainable Transportation Projects: New Guides for Municipalities at Federation of Canadian Municipalities Sustainable Communities Conference (February 2010);
- Fourteen new cases studies and issue papers;
- 2 national meetings to advance the practice of TDM; and,
- Workshop for funding recipients in March 2010 to share results and knowledge of Green TDM.
The webinars attracted a significant attendance and the program received good feedback in post-event surveys on the information that was shared during those events.
The tools developed and the learning events organized contributed to an immediate outcome of increased awareness, knowledge and acceptance of energy efficient transportation technologies and best practices and an increas in capacity to undertake TDM initiatives.
The direct reach of the ecoMOBILITY learning events listed above was 850 TDM practitioners, which exceeds the target participation of 200 practioners. In post-events surveys, these people reported being more knowledgeable of TDM as well as more aware of sustainable transportation options such as car sharing, public transit, active transportation, alternative transportation to single occupancy cars as a result of the events.
An expanded, more proactive approach to knowledge dissemination will be implemented 2010-2011, building on this experience. For example, a number of sessions focusing on ecoMOBILITY products will be organized at major conferences and a newsletter will be sent out to a comprehensive distribution list of over 2000 practioners to promote new resources and upcoming learning events. The program will expand its reach to a broader audience.
The tools developed and the learning events organized contributed to an immediate outcome of increased awareness, knowledge and acceptance of energy efficient transportation technologies and best practices and an increase in capacity to undertake TDM initiatives.
Intermediate Outcomes
The knowledge and increased capacity regarding Green TDM services, policies and programs from the above activities has laid a foundation for an increase among Canadian municipalities in the implementation of transportation best practices that reduce energy consumption and GHG or CAC emissions. The extent of this impact will be measured in 2011-2012.
Long-term Outcomes
It is too early in the program to provide information on the reduction of GHG and CAC emissions from program activities. The data required to assess results from the funded projects is currently being gathered by the funding recipients and will start to become available in 2010-2011.
An impact measurement strategy has been designed and will be completed in 2011-2012 to allow the program to roll-up the direct and indirect emission reductions achieved through the program. The program is expected to reduce emissions by 0.112 megatonne in 2012.
| Total Funding Approved Under the CAA | Program's Planned Spending in 2009-2010 | Program’s Actual Spending in 2009-2010 |
|---|---|---|
| $ 9,300,000 | $ 2,878,067 | $ 2,778,578 |
Program: ecoTECHNOLOGY for Vehicles
| Department |
Transport Canada |
|---|---|
| Departmental Program Activity |
2.1 Clean Air from Transportation |
2009-2010 Program's Expected Achievements
See the 2009-2010 Horizontal Report on Plans and Priorities (HRPP) at: http://www.tbs-sct.gc.ca/rpp/2009-2010/CT_2
2009-2010 Program's Achieved Results
Information and decision support
The ecoTECHNOLOGY for Vehicles (eTV) program has conducted tests and evaluations on 20 different advanced vehicle technologies (AVTs), 8 of them in 2009-2010 (exceeding the expectation of testing 5), in order to contribute to an immediate outcome of increased knowledge of energy efficient transportation technologies and informed positions on policies, and programs influencing transportation technologies. Test and evaluation results have increased knowledge of the performance of emerging vehicle technologies in Canada, helping to inform the development of fuel consumption and emissions standards, programs and policies in Canada. Results have also increased Canadians knowledge about advanced vehicle technologies through several outreach and educational activities.
These AVTs were selected from an assessment process to choose the technologies that have the greatest potential to reduce fuel consumption, greenhouse gas emissions (GHG), and criteria air contaminants (CAC), but also have the potential to be technically viable in Canada. Priority technologies were identified based on technology scans conducted by the program’s engineering staff and discussions with industry associations, manufacturers, government departments, and other stakeholders, in keeping with the technology areas outlined in the HRPP. More information about this strategic evaluation process can be found on the program website at www.tc.gc.ca/eTV - Biennial Report.
During 2009-2010, eTV also completed two studies to address potential barriers to the introduction of advanced vehicle technologies into the market, GHG or CAC. The study on low rolling resistance (LRR) tires will help to inform the work of the Government of Canada, tire manufacturers, industry and other stakeholders to reduce the regulatory barriers in the event that LRR tire regulations are considered in Canada. The program also worked with industry to identify and mitigate potential regulatory barriers to Fuel-cell vehicles, in anticipation of their commercialization, in a joint study with the National Research Council’s Institute for Fuel Cell Innovation and the Canadian Hydrogen and Fuel Cell Association. The study evaluated risks posed by the unintended venting of hydrogen from a light-duty vehicle within enclosed parking facilities.
Training and education
Consistent with the program’s 2009-2010 performance commitments, eTV delivered or contributed to 22 major public awareness raising events across Canada through hands-on demonstrations, information dissemination and ride and drive opportunities. The program continued to develop its extensive public website, providing Canadians with access to educational articles, videos, technical sheets and detailed test results. Using these outreach tools, eTV interacted with over 50,000 Canadians in 2009-2010 (more then 110,000 since the inception of the program) in its key target audience to increase their knowledge of the performance and environmental benefits of AVTs. The program’s education and training objectives were furthered in 2009-2010 through unique partnerships with educational institutions, including the Canadian Science and Technology Museum Corporation, to develop blended learning tools that integrate clean transportation and AVTs technologies into the secondary school curriculum. eTV also supported knowledge building with respect to AVTs in the automotive sector by disseminating test results at academic conferences, industry association meetings, colloquia, interdepartmental committees and other venues.
To evaluate the impact of eTV’s public outreach activities to increase public awareness about AVTs, the program utilized an exit feedback form that was distributed to visitors at eTV public outreach events. In 2009-2010, over 1000 visitors completed the feedback form. Results demonstrate that eTV has successfully and consistently increased knowledge of AVTs for more than 70% of attendees.
These training and education activities have contributed to its immediate outcome of increased awareness, knowledge and acceptance of energy efficient transportation technologies and best practices.
Partnerships and Networks
The eTV program activities have contributed to an immediate outcome of increased penetration of AVTs in Canada by identifying, and where possible, mitigating market barriers to AVTs at the consumer, codes & standards, regulatory, or vehicle/infrastructure interface level by:
- Working in partnership with industry, power utilities and within the department to mitigate regulatory barriers to facilitate the largest deployment and demonstration of battery electric vehicles (BEVs) in Canada. Results of this project will help proactively identify technical, consumer, regulatory and codes & standards barriers to battery electric vehicles (BEVs) in Canada, in advance of their commercialization in 2011-2012. Based on the results of demonstrations such as this, eTV will work in partnership with stakeholder to implement proactive measures to address identified barriers in 2010-2011.
- Developing Canadian-specific performance data for AVTs to inform the development of best practices, codes, standards and regulations. For example, eTV’s exploratory study on low-rolling resistance (LRR) tires will help to inform the work of the Government of Canada, tire manufacturers, industry and other stakeholders in the event that LRR tire regulations are considered in Canada.
- Identifying and mitigating consumer barriers to clean diesel, hydrogen and fuel cell and battery electric vehicle technologies as demonstrated by consumer feedback that had performance and reliability concerns about these technologies. Through the program’s educational and outreach activities, these consumer barriers were dispelled using eTV’s evaluation and test results.
Long Term Outcomes
The program’s activities will contribute to an intermediate outcome of increased use of technologies to reduce energy consumption and an ultimate outcome of reduced energy consumption and emissions.
The program is monitoring and evaluating the increase in AVTs in Canada using the department’s Vehicle Fuel Economy Information System (VFEIS), which captures Canadian motor vehicle fuel consumption and engine technology information, reported by automobile manufacturers and importers.
Final GHG reductions will be estimated in 2010-2011 using a methodology that includes analysing market sales data, and tracking the increased penetration of relevant advanced vehicle technologies. GHG and criteria air contaminants reductions will be derived using fuel efficiency data provided by the Canadian Fuel Consumption Guide, driving profiles available from the Canadian Transportation Survey and the department’s VFEIS.
The program is expected to reduce GHG emissions by 0.201 megatonnes in 2012.
| Total Funding Approved Under the CAA | Program's Planned Spending in 2009-2010 | Program’s Actual Spending in 2009-2010 |
|---|---|---|
| $ 14,100,000 |
$ 4,313,030 | $ 3,281,752 |
Program: National Harmonization Initiative for the Trucking Industry
| Department |
Transport Canada |
|---|---|
| Departmental Program Activity |
2.1 Clean Air from Transportation |
2009-2010 Program's Expected Achievements
See the 2009-2010 Horizontal Report on Plans and Priorities at: http://www.tbs-sct.gc.ca/rpp/2009-2010/CT_3
2009-2010 Program's Achieved Results
Information and Decision Support
Two provinces, Ontario and Quebec, implemented heavy truck speed limiter regulations in 2009. The Department completed significant foundational work under the National Harmonization Initiative for the Trucking Industry through a series of studies to support this initiative. Other provinces are considering speed limiter legislation; however no decision has been taken at this time on whether to proceed.
This supported the programs immediate and intermediate outcomes as a harmonized regulatory approach has been accepted by two neighbouring provinces (representing a large portion of trucking activity in Canada). In addition, a common approach was adopted for the removal of regulatory barriers as the same maximum speed limiter setting (105 kilometres per hour) as adopted by Ontario and Quebec and both provinces followed a uniform approach with respect to speed limiter enforcement policy and equipment.
Transport Canada also contributed to speed limiter compliance efforts of various enforcement authorities through the acquisition of technology to verify roadside compliance (e.g., hand-held readers to interface with truck computer to verify setting). Extensive consultations were undertaken to facilitate this process and encourage a harmonized approach with respect to the
use of this technology.
Financial Support
The program made funding available to the provinces and territories but this financial support was not required.
Long Term Outcomes
In addition, studies were completed relating to the assessment and testing of emerging environmental technologies to verify their environmental performance and compliance with regulatory requirements for on-road operation. For example, the program assessed the fuel efficiency improvements and regulatory compliance with safety standards of rear trailer fairings (boat tails) for on-road by Canadian fleets. A study was also completed investigating the feasibility of requiring protective side guards on large trucks and trailers operating in Canada, including the potential environmental benefits of flush-mounted side fairings.
This work may assist in removing barriers to the increased uptake of technologies that reduce trucking energy consumption and greenhouse gases (GHG). The impact of these technologies on GHG emissions will be estimated in the context of the ecoFreight demonstration fund and incentives program to avoid overlap or double-counts issues.
| Total Funding Approved Under the CAA | Program's Planned Spending in 2009-2010 | Program’s Actual Spending in 2009-2010 |
|---|---|---|
| $ 5,400,000 | $ 2,153,000 | $ 545,862 |
Program: Freight Technology Demonstration Fund
| Department |
Transport Canada |
|---|---|
| Departmental Program Activity |
2.1 Clean Air from Transportation |
2009-2010 Program's Expected Achievements
See the 2009-2010 Horizontal Report on Plans and Priorities at: http://www.tbs-sct.gc.ca/rpp/2009-2010/inst/doe/st-ts05-eng.asp#CT_4
2009-2010 Program's Achieved Results
Financial Support
In 2009-2010 the programs continued to fund and monitor the results of the 12 projects selected under the two rounds of project selection. These projects are eligible for up to $4 million (M) in funding towards the purchase, installation and demonstration of the effectiveness of new and underused emission-reducing technologies in the freight industry. This contribution has leveraged investments of $14 M from the proponents and their partners.
The selected portfolio of projects for both rounds of funding supports a mix of technologies and best practices such as: innovative port crane technologies, ultra low emitting Genset locomotives technology, route and mode optimization software, hybrid electric and advanced electric delivery vehicles, bundled advanced truck technologies (i.e., aerodynamic truck technologies, advanced auxiliary power technologies for trucks, advanced tire technologies, etc.) and driver training programs. Every Canadian region is represented in the selected portfolio.
Partnerships and Networks
The program provided information on technology so as to foster the broader uptake of clean transportation technologies and practices in Canada.
Among the key outputs of the Program were case studies distilled from the comprehensive reports provided by the successful project proponents. The case studies presented the technology demonstration objectives and results relative to the barriers identified. As projects concluded, case studies were generated and used for dissemination to decision-makers in the freight transportation industry to encourage them to invest in the most promising of these technologies. To-date 24 case studies from technology projects supported by Transport Canada (TC) have been published on TC’s ecoFREIGHT website detailing. This information was also disseminated at targeted sessions at freight industry conferences, annual general meetings and trade shows. The Freight Technology Demonstration Fund programs participated at the Globe 2010 event, the Atlantic truck show, the green marine event and the Supply Chain and Logistic Association/Canadian Industrial Transportation Association 2009 conference.
The demonstration and commercialization of new technologies in the freight industry can reduce both greenhouse gas emissions and air pollutants without inhibiting economic growth. Yet significant barriers to the wide-spread adoption of emissions-reducing technologies exist, including the cost to industry of technology trials, the risk to their financial bottom line in a highly competitive industry, concern about the impacts of new technologies on costly equipment and capital, the lack of an established track record for new technologies, and the lack of independent and “real world” information on technologies options.
The focus of the Freight Technology Demonstration Fund was in 2009-2010 to help industry invest in projects to demonstrate technologies that will both reduce emissions and lower operating costs over time, with robust measurement protocols in place so as to document the environmental and economic performance of the technologies. More specifically, the program supported
greater awareness and support within the Canadian freight transportation industry, and stimulated industry efforts to test and apply more innovative approaches.
Intermediate Outcomes
In 2009-2010, the Freight Technology Demonstration Fund activities have addressed both financial and information-based barriers to the use of transportation technologies and practices that reduce energy consumption and emissions. In addition, program results provided valuable information for the development of positions on policies and programs influencing transportation and will eventually play a role in the support of heavy-duty vehicle regulations.
Longer Term Outcomes
The Program is expected to reduce GHG emissions by 1.37 megatonnes in 2012.
| Total Funding Approved Under the CAA | Program's Planned Spending in 2009-2010 | Program’s Actual Spending in 2009-2010 |
|---|---|---|
| $ 9,300,000 |
$ 3,429,651 | $ 1,039,811 |
Program: Freight Technology Incentives Program
| Department |
Transport Canada |
|---|---|
| Departmental Program Activity |
2.1 Clean Air from Transportation |
2009-2010 Program's Expected Achievements
See the 2009-2010 Horizontal Report on Plans and Priorities at: http://www.tbs-sct.gc.ca/rpp/2009-2010/inst/doe/st-ts05-eng.asp#CT_5
2009-2010 Program's Achieved Results
Financial Support
Of the 32 projects selected to receive a total of $7.5 million in funding through rounds one and two of the incentives program, 28 are underway with contribution agreements in place and final reports expected in 2010-2011. Four selected projects have not gone forward due to the economic recession.
The selected portfolio of projects for both rounds of funding supports a mix of technologies that include: ultra low emitting Genset locomotives technology, alternative fuel for baggage tractors, bundled advanced truck technologies (i.e. aerodynamic truck technologies, auxiliary power technologies for trucks, wide based tire technologies and long combination vehicle options for trucks). Every Canadian region is represented in the selected portfolio.
Each recipient reports data on the implementation and performance of the selected technology, such data includes fuel use, time of operation, workload and distance travelled to, ultimately, enable them to calculate greenhouse gases (GHG) and criteria air contaminants emissions reductions.
The implementation of proven technologies in the freight industry can reduce both GHG emissions and air pollutants without inhibiting economic growth. Yet significant barriers to the wide-spread adoption of emissions-reducing technologies exist, including the cost to industry of technology trials.
The main activity of the Freight Technology Incentives program was to provide financial support to accelerate the purchasing and installing of proven technologies by freight transportation carriers. This greater adoption of technologies and best practices by the freight transportation industry is essential to a reduction of GHG emissions and air pollutants from the transportation sector and an improved efficiency in the transportation industry.
Intermediate Outcomes
In 2009-2010, the Freight Technology Incentives Program Fund activities addressed costs barriers to the use of transportation technologies that reduce energy consumption and emissions. In addition, program results provided valuable information for the development of positions on policies and programs influencing transportation and will eventually play a role in the support of heavy-duty vehicle regulations.
Longer Term Outcomes
The program is expected to reduce GHG emissions by 1.37 megatonnes in 2012.
| Total Funding Approved Under the CAA | Program's Planned Spending in 2009-2010 | Program’s Actual Spending in 2009-2010 |
|---|---|---|
| $ 9,350,000 |
$ 4,525,179 | $ 2,205,550 |
Program: ecoFREIGHT Partnerships
| Department |
Transport Canada |
|---|---|
| Departmental Program Activity |
2.1 Clean Air from Transportation |
2009-2010 Program's Expected Achievements
See the 2009-2010 Horizontal Report on Plans and Priorities at: http://www.tbs-sct.gc.ca/rpp/2009-2010/CT_6
2009-2010 Program's Achieved Results
In 2009-2010, the Program continued to contribute to the ecoFreight initiative’s environmental objectives, which are expected to reduce greenhouse gas (GHG) emissions by 1.37 megatonnes in 2012. Examples of achieved results include:
Partnerships and networks: national freight industry:
- The ecoFREIGHT Partnerships Program worked with key players in the freight transportation sector to reduce emissions from freight transportation activities.
- ecoFREIGHT Partnerships contributed financially to the Canadian Industrial Transportation Association’s (CITA) Core Survey Report for a fourth consecutive year. This survey reports on environmental considerations by CITA members in their decision-making process. Continued support and involvement with this survey has allowed the program to record industry trends towards environmental concerns. Sufficient data is now available to analyze the trends and inform Transport Canada (TC) on how and where it could influence the industry.
- ecoFREIGHT Partnerships worked with industry leaders using established communication networks to transfer knowledge and information on freight related emissions by sponsoring and supporting events such as: the Supply Chain and Logistic Association of Canada’s (SCL) Breakfast Briefing Tour 2009 which showcased the results of an Industry Canada led study on logistics and supply chain management; Globe 2010’s Low Carbon Shipping Session which consisted of a panel of experts highlighting and sharing what their respective companies are doing in order to reduce the environmental impacts associated with their transportation activities; and the Strategy Institute’s Lean and Green Supply Chain Strategies Summit which explored the benefits, environmental and financial, of greening the supply chain.
- The ecoFreight Program worked with organizations and associations to recognize industry leaders who have improved their environmental performance. As such, the Program sponsored the Green Supply Chain Award and the ecoFREIGHT Transportation Award presented at the SCL’s Annual Conference and at Globe 2010, respectively. The recognition of industry leaders and their accomplishments helps to encourage other stakeholders to follow in their steps.
- The results and knowledge gained from all the ecoFreight Program’s projects (Freight Technology Demonstration Fund, Freight Technology Incentives Program and Marine Shore Power) will be the subject of a case study that will be posted early in the 2010-2011 fiscal year on the ecoFREIGHT Partnerships website. Web trend analysis of the website showed a constant increase in visits: from 5,614 visits in 2007-2008 to 23,753 in 2008-2009 and 32,881 in 2009-2010.
Guidelines and Agreements: Transportation Industry
- Support for the Memorandum of Understanding (MOU) with the Railway Association of Canada on emission reductions in the rail sector continued. The railways have delivered substantial reductions in air pollutant emissions since 2006. In 2008, there was an improvement of 23.3% in the GHG intensity of total freight train operations, compared with the 1990 baseline. Transport Canada supported preparation of the annual Locomotive Emissions Monitoring report for 2008. The 2008 report is expected to be released in early 2010-2011 (June).
- Support for the MOU with the Air Transport Association of Canada on emission reductions in the aviation sector continued. The Canadian aviation industry has surpassed the MOU-established target of 1.1 percent annual average fuel efficiency improvement. The total annual average fuel efficiency improvement achieved by 2008 for passenger and cargo operations was 1.9 percent, as compared to the 1990 baseline. The 2008 Canadian Aviation Industry Report on Emissions Reductions is expected to be released in early 2010-2011 (May).
- TC participated in various expert conferences and events with the aviation and rail industries. Specific conferences / events included:
- Meetings of the International Civil Aviation Organization’s (ICAO) Committee on Aviation Environment Protection (CAEP). Voluntary agreements were a topic of discussion at the eighth meeting of CAEP, which was held in Montreal on February 12, 2010. TC took the opportunity to share lessons learned and successful practices related to the current MOU with the aviation industry.
- 2009 Rail-Government Interface organized by the Railway Association of Canada, held in Ottawa on May 12, 2009. Key themes of discussion included sharing information on successful practices to enhance sustainability and environmental performance in line with the current voluntary agreement.
- 2009 Railroad Environmental Conference, held at the University of Illinois at Urbana-Champaign on October 27-29, 2009. This conference included expert participation from industry, government and academia in North America. A key theme was sharing information and lessons learned on leveraging partnerships to drive industry improvement through regulatory and non-regulatory channels.
International Partnerships:
- During 2009-2010, TC had an increased presence at international fora and committees, resulting in: more informed positions on policies and programs influencing transportation decision-making in Canada; fostering of key relationships with other nations; and, the sharing of information and best practices related to the reduction of emissions and the overall improvement of the environmental footprint from the transportation sector. TC also had integral input into the development of negotiating positions, measures, standards, regulations, action plans, Declarations and outcome statements (e.g., United Nations Framework Convention on Climate Change, Conference of the Parties 15, high level meetings of ICAO and the International Maritime Organization (IMO)).
- TC also contributed financially and in-kind towards significant pieces of research related to transportation and environment.
Efficiency Program for Freight Shippers and Forwarders:
- TC initiated discussions with the United States Environmental Protection Agency to share information on a shipper's footprint calculator and possible future Canadian applications.
- The ecoFREIGHT Program has developed Success Stories highlighting efforts by 3 companies who have taken measures to reduce the environmental footprint of their supply chain. These success stories will be published on the ecoFREIGHT website.
- TC sponsored and facilitated a session on Low Carbon Shipping at the GLOBE 2010 international conference that attracted policy makers and business people from around the world. The session examined initiatives and options for shippers to select the best environmentally-friendly options for shipping their goods, and profiled companies on the leading edge of
environmental performance.
| Total Funding Approved Under the CAA | Program's Planned Spending in 2009-2010 | Program’s Actual Spending in 2009-2010 |
|---|---|---|
| $ 6,550,000 | $1,856,980 | $ 1,072,725 |
Program: Marine Shore Power Program
| Department |
Transport Canada |
|---|---|
| Departmental Program Activity |
2.1 Clean Air from Transportation |
2009-2010 Program's Expected Achievements
See the 2009-2010 Horizontal Report on Plans and Priorities at: http://www.tbs-sct.gc.ca/rpp/2009-2010/CT_7
2009-2010 Program's Achieved Results
Port and terminal operators are facing pressure from adjacent communities to clean up their operations and improve their air quality performance. Marine shore power enables ships to turn off their auxiliary diesel engines and reduce their emissions while docked and connect to the city’s electrical grid using specially designed equipment to power the ship's load (e.g., lighting, air conditioning, communication equipment, etc.).
Financial Support
In the first round of application, the program undertook to contribute funding to the Port Metro Vancouver for the Canada Place project. In 2009-2010 the program provided funding and continued to monitor the results of this project in collaboration with Port Metro Vancouver.
The Canada Place cruise ship shore power project is the third cruise ship shore power project in the world and the first of its kind in Canada. The Port Metro Vancouver installed shore power infrastructure at the east and west berths of the Canada Place Cruise Ship Terminal in Vancouver harbour. The total cost of this project is $9 million with up to $2 million (M) provided by Marine Shore Power program. Port Metro Vancouver has partnered with Holland America, Princess Cruises and BC Hydro for this endeavour. Transport Canada, Western Diversification Canada and British Columbia Ministry of Transportation are financial contributors to this major initiative.
A second call for proposals completed in 2009-2010 and a second shore power project was identified for funding. This project, specifically designed for container ships, compliments the other Marine Shore Power Program project, which was designed for the cruise ships. In addition to the important environmental benefits, the project will also help the proponent’s port to remain economically competitive with other port facilities offering similar shore power service. The project proponent is currently completing the financial plan for the project, at which time it will be announced and launched.
Partnerships and Networks
An important role of the program is to provide information on marine shore power technology to other Canadian ports so as to allow them to develop a business case for the implementation of this technology. In 2009-2010, the program should ongoing project information at events to enable the transfer of knowledge including through freight industry conferences, trade shows or workshops. In 2009-2010 the Marine Shore Power Program participated at the Globe 2010 event and the Green Marine event.
The main barriers to the implementation of marine shore power in Canadian ports include the initial cost of these installations for the port and terminal operators, the lack of experience in Canada with this technology, and the lack of a proven business case for the shore power in the marine industry. The Marine Shore Power Program projects are demonstrating how this
technology can be implemented and the results achieved and are providing the information to mitigate these barriers.
Longer Term Outcomes
The Marine Shore Power Program reduce greenhouse gas emissions by an expected by 4000 tonnes in 2012.
| Total Funding Approved Under the CAA | Program's Planned Spending in 2009-2010 | Program’s Actual Spending in 2009-2010 |
|---|---|---|
| $ 6,000,000 | $ 1,405,110 | $ 758,562 |
Program: Analytical and Policy Support
| Department |
Transport Canada |
|---|---|
| Departmental Program Activity |
2.1 Clean Air from Transportation |
2009-2010 Program's Expected Achievements
See the 2009-2010 Horizontal Report on Plans and Priorities at: http://www.tbs-sct.gc.ca/rpp/2009-2010/CT_8
2009-2010 Program's Achieved Results
In 2009-2010, Transport Canada (TC) achieved the following results:
- Updated a comprehensive list of transportation greenhouse gas (GHG) emission indicators for all modes using 2005 data, including: activity, energy intensity, GHG intensity, total fuel consumption and GHG emissions. This is the first time the data has been updated since these indicators were developed in the late 1990’s in the context of the work of the National Climate Change Strategy’s Transportation Table. These indicators provide comparable modal GHG indicators to properly analyze the environmental impacts of various transportation-related policies to inform decision-making. Discussions regarding a collaborative initiative with the United States (U.S.) government to develop comparable Canada/U.S. indicators are ongoing.
- Launched a collaborative effort in the context of the federal/provincial/territorial Sustainable Transportation Task Force to develop a comprehensive data strategy. High priority projects include improving data to support the development of fuel consumption or emission regulations.
- Continued to work on the development of the TC Transportation Energy Use and Emissions Model (TCTEEM), which covers road, rail, and air transportation. The model now includes a light-duty vehicle module that was developed to analyze non-regulatory initiatives for new vehicles, such as economic incentives. In addition, a scoping study was implemented to conceptualize a marine emissions module. Finally, TC added a new rail emissions module to the model. These modules enhance TC's ability to assess regulatory and non-regulatory options to reduce GHG emissions.
- Launched an initiative to develop and maintain an up-to-date comprehensive light‑duty vehicle fleet database using provincial vehicle registry and fuel consumption data that will facilitate regulatory and non-regulatory policy analysis as it relates to energy use and GHGs.
| Total Funding Approved Under the CAA | Program's Planned Spending in 2009-2010 | Program’s Actual Spending in 2009-2010 |
|---|---|---|
| $ 4,000,000 | $ 985,000 | $ 709,228 |
Program: ecoAUTO Rebate Program
| Department |
Transport Canada |
|---|---|
| Departmental Program Activity |
2.1 Clean Air from Transportation |
2009-2010 Program's Expected Achievements
See the 2009-2010 Horizontal Report on Plans and Priorities at: http://www.tbs-sct.gc.ca/rpp/2009-2010/CT_9a
2009-2010 Program's Achieved Results
Financial Support
In 2009-2010, analysis of the impact of the ecoAUTO Rebate Program on the following program outcomes and indicators was conducted:
- Canadian consumers and dealerships have increased awareness of alternatives with respect to fuel‑efficient vehicles;
- Number of consumers who would not have purchased fuel‑efficient vehicles without the rebate; and
- Estimated greenhouse gas (GHG) and air pollutant emission reductions from introduction of the ecoAUTO Rebate Program.
To report on these indicators, Transport Canada (TC) developed a methodology that relied on:
- Information collected through various existing opinion poll surveys and the ecoAUTO Rebate Program application form; and
- Market trends information from TC’s Vehicle Fuel Efficiency Information System and other commercially available data sources.
Using this information, an estimate was developed of what GHG emissions and vehicle sales would have occurred had the ecoAUTO Rebate Program not been introduced. These estimates were compared to actual sales data to develop estimates of the number of consumers who would not have purchased fuel‑efficient vehicles without the rebate and of the impact of the program on GHG emissions.
Awareness of alternatives with respect to fuel‑efficient vehicles
The analysis conducted based on existing opinion poll surveys indicates that, during the ecoAUTO Rebate Program implementation period, Canadians became aware that there is a link between personal vehicle use and the environment, and that increasing the number of fuel‑efficient vehicles on the road will help both the environment and reduce their fuel costs. The ecoAUTO Rebate Program helped to reinforce government messages about the need to take fuel efficiency into account when making a vehicle selection.
Number of consumers who would not have purchased fuel‑efficient vehicles without the rebate
Analysis based on market trends data suggest that the ecoAUTO Rebate Program had a positive impact on the sales of new fuel‑efficient vehicles, although there is insufficient data to determine the magnitude of the impact. This can be mostly attributed to the short time period that the program was in effect (March 2007 to December 2008) and to significant fluctuations in the price of fuel during this time (in March 2007, the price was 103.1¢ per litre, it reached a high of 136.2¢ per litre in July 2008, and a low of 76.1¢ per litre in December 2008).
Analysis of the responses to the ecoAUTO application form questionnaire determined with 80 percent of respondents stated that the program had an impact on their choice of model, although only 19 percent saying that they would have bought a different vehicle had there been no rebate. Note that while the ecoAUTO Rebate Program created an economic incentive to buy (or lease) fuel‑efficient vehicles, awareness of the importance of fuel efficiency also increased during the program period. Since greater awareness, lower vehicle prices (due to the rebate) and high fuel prices are positively correlated with fuel-efficient vehicle market share, it would be a challenge to assess accurately the individual impact of each of these influences. Ex ante analysis conducted using TC’s North American Feebate Analysis Model suggests that the program increased fuel efficient vehicle sales by 8,000 vehicles.
Estimated GHG and air pollutant emission reductions from introduction of the ecoAUTO Rebate Program
The following estimates were reported in the 2010 edition of the Climate Change Plan for the Purposes of the Kyoto Protocol Implementation Act report.
Reductions in GHG Emissions (Kilotonnes of CO2) –
Low, Expected and High Impact Cases
| 2008 | 2009 | 2010 | 2011 | 2012 | |
|---|---|---|---|---|---|
| Low/Expected Cases | 10 | 10 | 10 | 10 | 10 |
| High Case | 30 | 30 | 30 | 20 | 20 |
In 2009-2010 TC completed the processing of applications received in 2008-2009, the collection of survey information for analysis, archiving and shipping of ecoAUTO files to Library and Archives Canada, correspondence and reporting, and general program wrap-up activities.
| Total Funding Approved Under the CAA | Program's Planned Spending in 2009-2010 | Program’s Actual Spending in 2009-2010 |
|---|---|---|
| $ 252,700,000 | $ 1,943,000 | $ 919,841 |
Program: ecoAUTO Rebate Program
| Department |
Human Resources and Skills Development Canada |
|---|---|
| Departmental Program Activity |
4.1 Citizen Centered Service |
2009-2010 Program's Expected Achievements
See the 2009-2010 Horizontal Report on Plans and Priorities at: http://www.tbs-sct.gc.ca/rpp/2009-2010/CT_9b
2009-2010 Program's Achieved Results
Total program costs are approximately $264 million, with over 182,300 applications received, 169,800 applications approved, and $191.2 million in rebates paid1. It was announced in the 2008 federal budget that the ecoAUTO Rebate Program would not be offered for models beyond 2008 and that consumers would be able to collect the rebate on eligible vehicles until March 31, 2009.
_____________________________________
1 http://www.tc.gc.ca/eng/programs/environment-ecotransport-ecoauto-639.htm
| Total Funding Approved Under the CAA | Program's Planned Spending in 2009-2010 | Program’s Actual Spending in 2009-2010 |
|---|---|---|
| $ 11,300,000 | $ 300,000 | $ 285,482 |
Program: ecoENERGY for Personal Vehicles
| Department |
Natural Resources Canada |
|---|---|
| Departmental Program Activity |
2.1 Clean Energy |
2009-2010 Program's Expected Achievements
See the 2009-2010 Horizontal Report on Plans and Priorities at: http://www.tbs-sct.gc.ca/rpp/2009-2010/CT_10
2009-2010 Program's Achieved Results
Output targets for 2009-2010
Financial support – The program expected to receive 20 proposals under the ecoENERGY for Personal Vehicles funding opportunity, for funding of up to $1.7 million dollars. This target was exceeded. 36 proposals were received requesting $3.2 million in funding. Nine of the 36 proposals were funded and the $1.7 million in available funds was distributed.
Partnerships and networks – The program expected to hold two meetings with the Auto industry. This target was exceeded. Three meetings with the auto industry were held to discuss the annual Fuel Consumption Guide and associated data requirements, vehicle energy efficiency awards and auto shows.
Training and education – The program expected that 125,000 new drivers would be trained on fuel efficient driving practices. This target was exceeded. Over 350,000 new drivers received in class training on fuel efficient driver best practices.
Information and decision support/analysis - The program expected to target purchasers of new vehicles through the production of the 2010 EnerGuide for Vehicles fuel consumption guide and the Most Fuel Efficient Vehicles list. This target was met. Both information products were released in the winter of 2009.
Research studies – The program expected to prepare a report on the second interim goal (2008) of the Memorandum of Understanding with the Auto Industry to voluntarily reduce greenhouse gases (GHG) from light duty vehicles by 5.3 megatonnes (Mt) in 2010. However, the report on the first interim goal (2007) was delayed because the Joint
Government-Industry Committee had to work through a number of complicated methodological issues related to estimating emission reductions. After considerable time and effort, consensus was reached and the measurement and reporting framework for the Memorandum of Understanding was finalized during the reporting period. The 2007 report, which demonstrates significant emissions
reductions, will be released shortly.
Immediate Outcome targets for 2009-2010
Informed positions on policies and programs influencing transportation technologies and practices - The program expected that the preparation of a report on the 2008 interim goal of the Memorandum of Understanding with the Auto Industry would provide key information describing energy efficiency and consumption trends in the personal vehicle sector. While the report has yet to be published, the measurement and reporting framework that was finalized this year, combined with information collected to populate the framework, demonstrate and quantify the auto industry's efforts to reduce GHG emissions and energy use from passenger cars and light-duty trucks in Canada. The report on the first interim goal, which is to be published shortly, will demonstrate that the auto industry reduced GHG emissions by between 3.1 and 3.4 Mt, exceeding the 2007 interim goal of 2.4 Mt by a large margin, and also surpassing the 2008 interim goal of 3.0 Mt.
Increased participation in emission reducing activities through partnerships and other program activities - The program expected that increased participation in emission reducing activities would be achieved through signature of at least five new collaborative agreements. This target was exceeded. Nine new agreements were funded in 2009-2010 that will enable proponents to deliver training on fuel efficient driving practices.
Increased capacity to undertake initiatives that reduce energy consumption or greenhouse gas or criteria air contaminants or release of toxic substances - Nearly 230,000 of the 580,000 new drivers exposed to fuel efficient driving information wrote and passed a test that included questions to assess their knowledge of fuel efficient driving techniques as part of the licensing process. Following release of the 2009 Fuel Consumption Guide, over 300,000 copies were distributed at dealerships and auto shows, providing purchasers of new vehicles with the ability to consider fuel efficiency as part of their purchasing decision. Additionally, $1.7 million in funding provided to proponents under agreements for emissions-reducing projects enabling them to deliver targeted outreach to nearly 9 million consumers, increasing their awareness and adoption of energy efficient buying, driving, and maintaining practices for personal vehicles.
Intermediate Outcome targets for 2009-2010
Use of transportation best practices that reduce energy consumption or GHG or Criteria Air Contaminants (CAC)- As a result of 580,000 new drivers receiving training on better driving practices, over 290,000 of them are expected to be actively using fuel efficient driving techniques to save more than 17 million litres of fuel and 0.04 Mt of GHG emissions, based on program surveys that look at adoption and retention rates. Similarly, of the 9 million consumers reached under targeted awareness campaigns, over 800,000 Canadians are expected to have changed behaviours to save more than 2 million litres of fuel and nearly 5,000 tonnes of GHG emissions annually.
Final Outcome targets for 2009-2010
Reductions in energy consumption or GHG or CAC from transportation - As a result of activities undertaken by the ecoENERGY for Personal Vehicles Program since its launch in 2007, nearly 1.4 million new drivers have been exposed to fuel efficient driving information, and behaviour change campaigns have been conducted in communities that represent 46% of the Canadian population. Canadians reached in earlier years that have adopted fuel efficient practices will continue to save energy and reduce GHG emissions in the future. The cumulative effect of all activities by this program are estimated to be reducing energy use by 1.6 petajoules annually and GHG emissions by 0.1 Mt annually.
| Total Funding Approved Under the CAA | Program's Planned Spending in 2009-2010 | Program’s Actual Spending in 2009-2010 |
|---|---|---|
| $ 21,000,000 | $ 5,950,186 | $ 5,530,868 |
Program: ecoENERGY for Fleets
| Department |
Natural Resources Canada |
|---|---|
| Departmental Program Activity |
2.1 Clean Energy |
2009-2010 Program's Expected Achievements
See the 2009-2010 Horizontal Report on Plans and Priorities at: http: http://www.tbs-sct.gc.ca/rpp/2009-2010/inst/doe/st-ts05-eng.asp#CT_11
2009-2010 Program's Achieved Results
Output targets for 2009-2010
Financial support - The program expected to receive 10 proposals under the ecoENERGY for Fleets funding opportunity, with funding up to $2 million dollars. This target was exceeded. 29 proposals were received for funding of $1.6 million. The lower than expected amount of funding requested can be attributed to the fact that in order to be eligible, the fleets were required to contribute at least 50% of the project costs. The trucking industry was very hard hit by the economic downturn, which affected the capital available for projects that will reduce fuel consumption. However, the high level of interest, evidenced by the large number of proposals received, indicates that the industry is very interested in projects that will ultimately reduce their fuel costs.
Partnerships and networks - The ecoEnergy for Fleets Program expected to participate in 15 trade shows and 30 meetings with industry. The target for meetings with industry was exceeded. A total of 85 were held. The target for trade shows was not met, as the program participated in only 10 of 15 planned trade shows. The reasons for lower than planned participation at trade shows were that some trade shows were cancelled by industry due to the economic downturn, and in the case of two trade shows, the program deemed them to be not suitable as a means to address the program’s immediate audience based on trip reports from the previous year's shows.
Training and education - The program expected to train 2,200 transportation professionals, including drivers, driving instructors, mechanics and fleet managers on fuel efficient driving, maintenance and business practices in 2009-2010. This target was exceeded. Nearly 14,000 transportation professionals were trained. The higher than expected reach is predominantly amongst drivers, and can be attributed to uptake of the ecoENERGY for Fleets driver training materials by driver training schools across Canada.
Information and decision support/analysis - The program expected to produce information materials on fuel efficient practices targeting the off-road sector. This target was met. The program produced a report focused on the forestry off-road sector, titled Modeling the Fuel Consumption and Fuel Intensity of Forest Harvesting, Silviculture and Road Construction Operations.
Research studies - The program expected to develop research studies examining program options for idle-reduction devices, aerodynamics and tires, with the goal of gaining knowledge of new opportunities for reducing emissions from the trucking sector so that the program can plan outreach initiatives and more comprehensive messaging for the trucking sector. This target was met. Literature review and stakeholder surveys were commissioned to look at experiences with various idle-reduction program options and to identify best practices from previous and current programs. Research on aerodynamic devices for heavy trucks was compiled. Two studies were commissioned on heavy duty truck tires. One focused on tire traction in winter conditions and the other comprised a consumer survey to look at the purchasing process.
Immediate Outcome targets for 2009-2010
Informed positions on policies and programs influencing transportation technologies and practices - This target was met. As a result of research on aerodynamics, the Program became aware that these technologies are readily available, but aren’t widely used because of trucking industry perceptions about their durability and potential for return on investment. In response, the Program, in collaboration with provincial governments, published "On the Road to a Fuel-efficient Truck: A Guide for Purchasing Aerodynamics for Heavy-Duty Tractors and Trailers", which identifies key aerodynamic devices that can be installed on heavy-duty trucks to reduce fuel use and greenhouse gas (GHG) emissions. The guide gives truck owners and operators the information they need to select, install, maintain and drive with key aerodynamic devices, as well as how to calculate expected fuel savings and return on investment. As a result of the literature review and survey on idle-reduction programs, the program developed a best practices guide for developing idle-reduction programs, which was distributed to federal and provincial government partners, strengthening the cooperation, collaboration and alignment between jurisdictions on this issue. The findings of the two studies on tires will be used by the program to host a workshop in 2010-2011, to engage stakeholders on the issue of fuel efficient tires and involve them in developing a framework that could be used in Canada to promote fuel efficient tires to heavy duty truck tire purchasers.
Increased participation in emission reducing activities through partnerships and other program activities - The program expected to increase participation in emission reducing activities through signature of up to ten new collaborative agreements with fleets. This target has been exceeded. Eleven new collaborative agreements have been signed under which the trucking industry will retrofit over 500 tractors and trailers with fuel efficient components, for a demonstration of their use in Canada. The program will promote the results of these demonstrations to the trucking sector.
Increased capacity to undertake initiatives that reduce energy consumption or greenhouse gas or criteria air contaminants or release of toxic substances - The capacity of 14,000 transportation professionals (drivers, driver trainers, mechanics, and fleet managers) to address emissions through their decision making has been enhanced through information and training they received at 88 program workshops and through access to decision-support tools and information materials such as the aerodynamics guide "On the Road to a Fuel Efficient Truck", 47,000 hits to the program website, and two idle reduction campaigns. Additionally, the capacity of fleets to undertake emissions-reducing projects has been increased through provision of funding under agreements that will enable 11 fleets to create and implement action plans that include the demonstration and adoption of fuel efficient fleet technologies.
Intermediate Outcome targets for 2009-2010
Use of transportation technologies and alternative modes that reduce energy consumption or GHGs or criteria air contaminants (CAC) - As a result of eleven fleets receiving funding for demonstration and adoption of fuel efficient fleet technologies, over 500 tractors and trailers are receiving retrofits that are expected to save nearly 3 million litres of fuel and over 7,000 tonnes of GHG emissions annually.
Use of transportation best practices that reduce energy consumption or GHG or CAC - As a result of 14,000 transportation professionals receiving training on fuel saving techniques, these fleets and drivers are expected to be actively using fuel efficient driving and fleet management techniques to save nearly 45 million litres of fuel and 0.1 megatonne (Mt) of GHG emissions annually.
Final Outcome targets for 2009-2010
Reductions in energy consumption or GHG or CAC from transportation - As a result of activities undertaken by the ecoENERGY for Fleets Program since its launch in 2007, nearly 42,000 transportation professionals have been trained. Professionals trained in earlier years that have adopted fuel efficient practices will continue to save energy and reduce GHG
emissions in the future. The cumulative effect of all activities by this program are estimated to be reducing energy use by 4.24 petajoules annually and GHG emissions by 0.31 Megatonne annually.
| Total Funding Approved Under the CAA | Program's Planned Spending in 2009-2010 | Program’s Actual Spending in 2009-2010 |
|---|---|---|
| $ 22,000,000 | $ 6,030,814 | $ 5,335,790 |
Program: Vehicle Scrappage
| Department |
Environment Canada |
|---|---|
| Departmental Program Activity |
3.3 Clean Air Program |
2009-2010 Program's Expected Achievements
See the 2009-2010 Horizontal Report on Plans and Priorities at: http://www.tbs-sct.gc.ca/rpp/2009-2010/CT_12
2009-2010 Program's Achieved Results
- About 64,000 old, high-polluting vehicles of model year 1995 and earlier were retired through the program, known as Retire Your Ride, resulting in a reduction of 2900 tonnes of smog-forming emissions.
- Canadians in every province were offered one of a selection of rewards for retiring their older vehicles, including $300 cash, free transit passes, rebates on a bicycle or replacement vehicle, car sharing membership, etc. The cash reward is the most popular incentive, selected by 86% of participants.
- In August 2009, vehicle manufacturers began to offer program participants rebates ranging in value from $500 to $3000 on the purchase of one of their new vehicles. These rebates have had a significant and positive impact on program participation.
- About 300 recyclers (or 17% of the known Canadian automobile recycling companies) are collecting vehicles retired through Retire your Ride. To participate in the program, vehicle recyclers must respect Environment Canada’s national code of practice, which outlines environmental requirements for processing retired vehicles. Training sessions for participating vehicle recyclers were held across the country, and an on-line training tool was implemented.
| Total Funding Approved Under the CAA | Program's Planned Spending in 2009-2010 | Program’s Actual Spending in 2009-2010 |
|---|---|---|
| $ 92,000,000 |
$ 34,758,000 | $ 28,528,730 |
Theme: Indoor Air Quality
| Lead Department |
Health Canada |
|---|---|
| Federal Theme Partners |
National Research Council of Canada |
Expected Results from Theme's Programming
Immediate Outcomes
- Improved awareness by public, property managers, and governments of health risks and causes of reduced indoor air quality and strategies to improve it.
- Stronger interest in and basis for developing technological solutions for improving indoor air quality.
- Strengthened research capacity related to indoor air quality issues (IAQ).
Intermediate Outcomes
- Reduced health risks from poor IAQ.
- Development and effective application of regulations, guidelines and recommendations related to IAQ.
- Production and uptake of new products/techniques related to reducing health risks from poor IAQ.
Final Outcomes
- Adverse effects of poor indoor air on the health of Canadians are reduced.
2009-2010 Expected Achievements
See the 2009-2010 Horizontal Report on Plans and Priorities at: http://www.tbs-sct.gc.ca/rpp/2009-2010/IAQ_Theme
2009-2010 Achieved Results
To support stronger interest in, and basis for, the development of technological solutions for improving IAQ and strengthened research capacity, several results were achieved:
- A paper on an IAQ Solution technology, portable air cleaners, has been accepted for the 2010 IAQ, Ventilation and Energy Conservation in Buildings conference, and it will be submitted for publication in a scientific journal.
- As was targeted, three protocols for technology assessment (portable air cleaners, commercial duct cleaning and heat recovery ventilators) have been identified for technology assessment and were developed, evaluated and validated.
To support the reduction of health risks related to poor IAQ, the following results were achieved:
- The Indoor Air Research Laboratory designed interventions that were used to retrofit heat recovery ventilation systems to improve air flows and increase air exchange rates. Specifically, a Scientific Intervention Task Force has met 3 times to establish criteria and to select homes for interventions.
- Two field teams have investigated 111 homes with asthmatic children, which are under surveillance. 89 of the 111 homes have been investigated; ventilation and IAQ investigations were performed twice in 89 homes and three times in 21 homes. The intervention phase has already been initiated in 12 homes, and a set of 41 more homes that meet the intervention criteria have been identified, which meets the target of approximately 50% of homes undergoing an intervention.
In supporting the development and effective application of regulations, guidelines and recommendations related to IAQ, all planned results were achieved:
- A new national committee on IAQ and buildings began work on best-practice guides for defining acceptable IAQ and for accessing IAQ: the Canadian Committee on Indoor Air Quality and Buildings (CCIAQB). The CCIAQB reviewed and prioritized areas where studies are required to address knowledge gaps. The CCIAQB procured a report, which is an independent review of existing Volatile Organic Compounds (VOC) and Semi-volatile Organic Compounds sampling methods available for facility managers. The CCIAQB also developed a benchmark study (in the form of a questionnaire) to assess IAQ awareness and understanding of building owners and operators, which was an identified deliverable in the RMAF.
- Systematic on-site testing and screening of approximately 1500 federal buildings were done in 2009-2010, for actual radon levels and their comparison against the new radon guidelines.
To support the production and uptake of new products/techniques related to reducing health risks from poor IAQ, the following results were achieved:
- Testing of federal buildings for radon which began last year in 2008 in the National Capital Region, Quebec and Manitoba, will continue and the project was rolled-out to different regions of Canada. Large scale testing projects with the Department of National Defence to test buildings and Personal Married Quarters on Canadian Forces Bases and with First Nations and Inuit Health Branch to test federal buildings on reserves across Canada continued.
- Health Canada (HC) in partnership with international stakeholders completed a final draft of the radon mitigation guide for homes. This will be a valuable reference to help Canadians lower radon levels in their homes.
- HC gave a presentation to the Working Group for the Canada Labour Code (CLC); HC advocated for a revision to the CLC radon levels from the old guideline level of 800Bq/m3 to 200Bqm3, and the committee stated that they would support the revised Canadian guideline.
2009-2010 Successes
A theme level evaluation conducted by Government Consulting Services (GCS) examined the IAQ Theme’s relevance, effectiveness, efficiency/economy, and design/delivery, during the period from 2007-2008 to 2009-2010. Both the IAQ Research and Development Initiative and the Radon Strategy were found to be aligned with government priorities, and continue to reflect the needs of Canadians. According to the IAQ Evaluation conducted by GCS, most aspects of the IAQ R and D Initiative are being implemented as planned, and objectives are expected to be achieved within budget. The Radon Strategy is on track to achieve most objectives within budget.
Radon Strategy
Although some planned measures of Canadians’ radon awareness are not available, such as public opinion research, there was a 127% increase in public inquiries made to Health Canada.
Although slightly below the target of 2000, the 1500 federal buildings tested in 2009-2010 exceeds the total number tested in the previous two years, which provides confirmation that the process is improving. Measures are being taken to make the process of testing federal buildings more efficient; regional employees successfully trained federal departments to assist with
the deployment and retrieval of radon detectors.
Indoor Air Research and Development Initiative
Several activities related to the assessment of the impacts of improved indoor air ventilation and indoor air distribution on human health and indoor air quality were successful. In the ventilation study of asthmatic children, the house visits were conducted efficiently with about 13,300 indoor air quality samples. There has been a very low dropout rate with the current
participants involved in this study.
In addition, the Indoor Air Research Laboratory was opened in June 2009.
The Indoor Air Research Laboratory and the Indoor Air Research Development Initiative were the cover story in the first edition of Holmes on Homes Magazine November 2009, which will lead to increased exposure and awareness to Canadians in the areas of indoor air quality and ventilation.
Several activities in support of the evaluation of indoor air quality and technologies and solutions were successful. Workshops on duct cleaning and heat recovery ventilator held in November 2009 and March 2010 achieved the objective of soliciting advice from broad interests and input for development of the two planned protocols. IAQ solutions work has been highlighted in the Air Information Review, quarterly newsletter of the Air Infiltration and Ventilation Centre. (Vol. 30, No. 4, September 2009) and Holmes on Homes Magazine (Jan/Feb 2010 issue).
The establishment of a national committee focusing on indoor air was successful; the Canadian Committee on IAQ and Buildings established a VOC Sampling Report and preparations for an additional 4 studies are completed.
2009-2010 Risks and Challenges
Radon Strategy
The effectiveness of several activities which were planned to support improved awareness of public, property managers, and governments on health risks and the causes of reduced indoor air quality and associated strategies could not be measured directly using public opinion research. These activities included the second phase of the national radon awareness campaign and increased “informed” awareness of Canadians. In this case, as a mitigating strategy, the Radon Strategy will need to rely on available secondary sources of data.
The number of federal buildings tested fell short of planned projections. The original target over the four year period (2007-2008; 2010-2011) was to test 15,000 federal buildings, based on the listing from Treasury Board’s Directory of Federal Real Property (DFRP). As the project has progressed, it has become apparent that the actual number of buildings eligible for testing is significantly lower, as many buildings do not meet testing criteria.
Indoor Air Research and Development Initiative
In an effort to assess the impacts of improved indoor air ventilation and indoor air distribution on human health and IAQ, an intervention study of under-ventilated homes of asthmatic children was planned. Due to the slower pace in the recruitment of asthmatic children, the study is expected to be completed in the fall of 2010, instead of as planned for spring of 2010. This delay also means that some of the homes will only have two visits instead of three after the intervention. As a mitigating strategy, in order to increase the statistical significance, additional funding will be sought by Institut national de santé publique du Québec and National Research Council, in order to complete this third visit into the next fiscal year.
| Theme's total funding approved under the CAA | Theme's Planned Spending in 2009-2010 | Theme's Actual Spending in 2009-2010 |
|---|---|---|
| $ 23,000,000 | $5,700,000 | $5,670,780 |
Program: Radon Strategy
| Department |
Health Canada |
|---|---|
| Departmental Program Activity |
3.1 Healthy Environments and Consumer Safety |
2009-2010 Program's Expected Achievements
See the 2009-2010 Horizontal Report on Plans and Priorities at: http://www.tbs-sct.gc.ca/rpp/2009-2010/IAQ_2
2009-2010 Program's Achieved Results
Mapping
Many activities of the Radon Strategy’s mapping component have been successfully achieved, which serve to identify areas which may be at risk, due to local geological and climatic conditions associated with elevated radon levels. The mapping will enable public health and Health Canada (HC) officials to identify populations at risk.
In collaboration with Natural Resources Canada, soil radon gas data was collected for the map at more than 300 sites across Canada. While the targeted number of sites was 500, higher rates of precipitation meant that this weather-dependent activity could not be carried out as frequently as planned in 2009-2010. This will not impede the overall objective of radon potential mapping.
Aerial surveys of terrestrial radiation were completed for southern Ontario, the eastern townships of Quebec and part of southern Manitoba. These measurements now ensure that data exists for ~ 30% of Canada's geographic land area and covers approximately 75% of Canada's population.
Education and Awareness
The stand alone radon advertising campaign was cancelled and replaced with the Environmental Health campaign which was launched in March 2010. Radon was a primary issue in the campaign and in the printed guide. There was no public opinion research done by HC for radon in 2009-2010 to determine the increase in radon awareness. Therefore the team worked with Statistics Canada to include radon awareness questions in their 2009 household survey. This data will be available later in 2010.
Testing
Approximately 1500 federal buildings were tested in 2009-2010. This helps ensure that the federal government has fulfilled its legal responsibilities under the Canada Labour Code.
HC in partnership with international stakeholders completed a final draft of the radon mitigation guide for homes. The final guide will be completed in the fall of 2010, as was planned, and will be a valuable reference to help Canadians lower radon levels in their homes.
In a successful effort to revise the guidelines for radon levels in the Canada Labour Code (CLC), Health Canada gave a presentation to the Part X CLC Working Group in the fourth quarter of 2009-2010. Specifically, at this presentation HC advocated for a revision to the CLC radon levels from the old guideline level of 800 Becquerels per cubic metre (Bq/m3) to 200Bqm3, and
the committee stated that they would support the revised Canadian guideline. This supports HC’s expected achievement to ensure federal employees are not exposed to high levels of radon in the workplace.
| Total Funding Approved Under the CAA | Program's Planned Spending in 2009-2010 | Program’s Actual Spending in 2009-2010 |
|---|---|---|
| $15,000,000 | $3,700,000 | $3,671,018 |
Program: Indoor Air Research and Development Initiative
| Department |
National Research Council |
|---|---|
| Departmental Program Activity |
1.1 Research and Development |
2009-2010 Program's Expected Achievements
See the 2009-2010 Horizontal Report on Plans and Priorities at: http://www.tbs-sct.gc.ca/rpp/2009-2010/IAQ_1
2009-2010 Program's Achieved Results
Assessment of the Impacts of Improved Indoor Air Ventilation and Indoor Air Distribution on Human Health and Indoor Air Quality (IAQ)
- As of April 2010, 111 homes with asthmatic children were under surveillance. This allows a margin for additional attrition to ensure the target of 100 homes is met, and that the study will be completed with enough statistical significance.
- As planned, the house visits were conducted efficiently with about 13,300 IAQ
samples collected and analyzed.
- As planned in the expected achievements, most of the homes have been investigated; ventilation and IAQ investigations were performed twice in 89 homes and three times in 21 homes, and these participants have completed all related questionnaires.
- The Scientific Intervention Task Force, comprised of members from Canada Mortgage and Housing Corporation (chair), National Public Health Institute of Quebec (INSPQ), Health Canada (HC), l’Agence d’efficacité énergétique du Québec, and National Research Council of Canada (NRC) met 3 times to establish criteria and to select homes for interventions. The intervention phase, i.e., installation of Heat Recovery Ventilation (HRV) systems, has been initiated in 12 homes. A set of 41 more homes that meet the intervention criteria have been identified.
- The Indoor Air Research Laboratory (IARL) officially opened June 2009 by the Minister of Industry, Gary Goodyear, and NRC’s President. The IARL was successfully set up to model intervention scenarios as identified in the intervention phase.
- One peer reviewed conference abstract was presented and published at the Healthy Buildings Conference in Syracuse, New York 13-17 September, 2009, reporting on the findings re. the ventilation rates and scenarios, obtained with different methods.
Activity 2 – Evaluation of IAQ Technologies and Solutions
- A Technical Advisory Committee (TAC) was formed with representatives from Federal Partners (HC, Public Works and Government Services Canada, CMHC, NRC; Provincial agencies (IRSST, BC Centre for Disease Control/National Collaborating Centre for Environmental Health); Industry Associations (HRAI, BOMA); Non Government Organizations (Ontario Lung Association). Three TAC meetings were held.
- Together with the assistance of the TAC, 3 protocols (portable air cleaners, commercial duct cleaning & heat recovery ventilators) have been identified for technology assessment and developed, evaluated and validated. Research facilities (IARL and Full Scale Chamber) and the preparation of analytical instrumentation required to assess the technology impact have been completed for the portable air cleaner protocol and are under development for the commercial duct cleaning and heat recovery ventilator protocols.
- Workshops on duct cleaning and heat recovery ventilator were held in November 2009 and March 2010. The workshops achieved the objective of soliciting advice from broad interests and input for development of the two planned protocols.
- A technical paper on the first protocol (portable air cleaner) has been accepted for the 2010 Indoor Air Quality, Ventilation and Energy Conservation in Buildings conference, and it will be submitted for publication in a scientific journal. The related technical test report has undergone final amendments based on TAC comments and is currently under review.
Activity 3 - Establishment of a National Committee Focusing on Indoor Air
- As forecasted in the expected achievements, a new national committee on IAQ and buildings began work on best-practice guides for defining acceptable IAQ and for accessing IAQ. The Canadian Committee on IAQ & Buildings (CCIAQB) met once supported by 2 meetings of the Executive Committee and carried out extensive e-mail correspondence. The Committee reviewed and prioritized areas where studies are required to address knowledge gaps.
- The CCIAQB commissioned an independent scientific review of the existing Volatile Organic Compounds (VOC) and Semi-volatile Organic Compounds sampling methods. The review has been completed, is comprehensive, and includes the identification of knowledge gaps and recommendations on how to address them.
- The VOC Sampling Report has been received and preparations for an additional 4 studies are completed.
- The Committee also developed a benchmark study (in the form of a questionnaire) to assess IAQ awareness and understanding of building owners and operators (to be performed in FY 2010-2011).
| Total Funding Approved Under the CAA | Program's Planned Spending in 2009-2010 | Program’s Actual Spending in 2009-2010 |
|---|---|---|
| $ 8,000,000 | $ 2,000,000 | $ 1,999,762 |
Theme: International Actions
| Lead Department |
Environment Canada |
|---|---|
| Federal Theme Partners |
Natural Resources Canada, Department of Foreign Affairs and International Trade, Industry Canada |
Expected Results from Theme's Programming
Immediate Outcomes
- Canada has complied with its financial and other obligations under international climate change treaties and agreements.
- Canada’s positions for a future international climate change agreement are advanced.
- Increased consideration of domestic stakeholders’ interests in the development of Canada’s negotiating positions.
- Increased awareness of trade opportunities in climate-friendly technologies to reduce transboundary flows of air pollutants or to address climate change.
- Implementation of recommendations in the Clean Energy Dialogue Action Plan.
Intermediate Outcomes
- International climate change agreements are consistent with Canada’s interests.
- Canada’s profile as a provider of climate friendly technologies is enhanced.
- International air quality agreements are consistent with Canada’s interests.
- Increased collaboration between Canada and the United States (U.S.) on clean energy research, development, demonstration and broader engagement with the United States on developing compatible policy/regulatory frameworks consistent with Canada’s interests.
Final Outcomes
- International trends on climate change are consistent with Canada’s interests.
- Innovations related to reducing air pollution and addressing climate change have maintained Canadian competitiveness and provided economic benefits.
- Transboundary movement of air pollutants has been reduced.
Note: Revised Logic Model approved February 4, 2010.
2009-2010 Expected Achievements
See the 2009-2010 Horizontal Report on Plans and Priorities at: http://www.tbs-sct.gc.ca/rpp/2009-2010/Intl_Theme
2009-2010 Achieved Results
In 2009-2010 the International Actions (IA) Theme supported international organizations that play a key role in analyzing options related to an international climate change agreement. This information helped form Canada’s successful negotiating positions at the United Nations Framework Convention on Climate Change (UNFCCC) meetings.
Canada paid its annual fees to the UNFCCC thereby ensuring continuation of participation in international climate change actions and maintaining Canada’s reputation internationally. In addition, Canada contributed to the UNFCCC to support the poorest countries and countries most vulnerable to climate change.
2009-2010 was a year of intensive UNFCCC negotiations involving representation from IA Theme departments – Environment Canada (EC), Department of Foreign Affairs and International Trade (DFAIT) and Natural Resources Canada (NRCan) - at all UNFCCC negotiating sessions as well as at a variety of international climate change meetings, such as G8/G20 and the U.S. led Major Economies Forum, where climate change issues were on the agenda. In December 2009 Canada formally associated with the Copenhagen Accord, a comprehensive new international political agreement on key climate change issues. The Government announced a $400 million investment beginning in fiscal year 2010-2011 as Canada’s first step in delivering its’ fair share of the Accord’s commitment by advanced economies to provide financing assistance to developing countries to address climate change1. The Copenhagen Accord reflects key Canadian negotiating principles and objectives on a wide range of issues including mitigation, adaptation, finance and technology. In January 2010 Canada submitted an economy-wide emissions target for 2020 of 17 percent below 2005 levels as part of its commitment to the Copenhagen Accord.
EC led the coordination, preparation and publication of Canada’s Fifth National Communication on Climate Change: 2010, a requirement under UNFCCC membership.
The Asia Pacific Partnership (APP) program invested over $11 million (M) in 28 clean energy technology and services projects, leveraging $77 M in Canadian private sector investment. Canada is working with other APP countries to build Net Zero Energy demonstration homes based on Canada’s flagship project. Demonstration homes in Canada, Australia, India and Japan will accelerate the identification of clean energy technologies, improve conditions for innovation and transform the market.
Under the Methane to Markets program, Canada invested $884 thousand (K) in two clean technology projects in Mexico in the Oil and Gas and Landfill sectors, leveraging $2.5 M in contributions from project participants. As an active participant of the Renewable Energy and Energy Efficiency Partnership (REEEP) Canada contributed its annual dues of 70 K Euro which was used to transfer Canada’s expertise in Net Zero Energy Housing through design charrettes and supporting demonstration projects. These activities enhanced bilateral cooperation with Mexico.
The Canada-U.S. Clean Energy Dialogue (CED) is a new program under the IA Theme of the Clean Air Agenda in 2009. Its aim is to advance bilateral collaboration on clean energy technologies and support a long-term goal of reducing greenhouse gas emissions and addressing climate change. Three working groups were established involving EC and NRCan working jointly with the U.S. DFAIT participated in an advisory role. The CED Secretariat coordinated the preparation of the CED Action Plan which consisted of 20 projects. The Research and Development Working Group reviewed existing clean energy research and development collaboration between Canada and the U.S. and advanced the Clean Energy Research, Development and Demonstration Collaboration Framework.
Under the Canada-United States Air Quality Agreement (AQA), Canada and the U.S. have worked collaboratively on science and policy related activities in support of renewed discussion with the U.S. on a Particulate Matter (PM) Annex to the Canada-U.S. Air Quality Agreement. Canada has also been actively involved in negotiations to amend the Protocol on Acidification, Eutrophication and Ground-level Ozone and its annexes under the United Nations Convention on Long Range Transboundary Air Pollution (LRTAP).
The IA Theme was evaluated during the year and final results will be published in 2010-2011.
___________________________________________
1Government of Canada makes major investment to international climate change: http://www.ec.gc.ca/default.asp?lang=En&n=714D9AAE-1&news=FD27D97E-5582-4D93-8ECE-6CB4578171A9
2009-2010 Successes
Canada formally associated itself with the Copenhagen Accord in December 2009 and submitted, for inscription under the Accord, an economy-wide emissions target for 2020 of 17 % below 2005 levels. The Accord represents a solid basis for the development of a new international climate change agreement that is fair, effective and comprehensive, consistent with Canada’s overall climate change principles.
Canada’s APP Secretariat hosted the APP Annual Task Force Meetings and Workshops including the first joint meeting of four Task Forces, where participants identified emerging cross-cutting project opportunities.
2009-2010 Risks and Challenges
The 2-year timeframe for the CED program is challenging given the requirements of the projects and the collaborative efforts needed to get the projects started and implemented. While the program is moving towards completion of some of the goals, it has been challenging to maintain full U.S. engagement due to a number of competing initiatives in the clean energy sector.
Domestic air management decisions are being made both in Canada and the U.S. As these decisions will form the basis of achievement of the Canada-U.S. PM Annex goals, this program will not meet its goals in the current timeframe.
The program has operated under the challenge of a declining budget over the four year funding period. As the negotiations intensified for a post-2012 international climate change agreement in the lead-up to Climate Conference of the Parties (COP)15, this challenge resulted in:
- Increased monetary support to the UNFCCC for the extra meetings; and,
- Increased EC, NRCan and DFAIT resource requirements to attend the meetings both within the United Nations and in other key high-level fora addressing international climate change issues (e.g., the G8 and the Major Economies Forum).
APP disbursement requirements put considerable strain on the department’s internal capacity to manage and administer contributions in a timely manner. Some partners were not able to participate in their proposed APP projects due to lack of timely funding and others experienced complications as they spent their own funds at risk. This situation has been corrected for
ongoing years.
| Theme's total funding approved under the CAA | Theme's Planned Spending in 2009-2010 | Theme's Actual Spending in 2009-2010 |
|---|---|---|
| $ 57,174,617 | $ 16,768,131 | $ 19,471,808 |
Program: International Obligations
| Department |
Environment Canada |
|---|---|
| Departmental Program Activity |
3.3 Clean Air Program |
2009-2010 Program's Expected Achievements
See the 2009-2010 Horizontal Report on Plans and Priorities at: http://www.tbs-sct.gc.ca/rpp/2009-2010/Intl_1a
2009-2010 Program's Achieved Results
Canada met its requirement to pay fees to the United Nations Framework Convention on Climate Change (UNFCCC) for the International Transaction Log. Canada also made contributions to other international organizations to enhance Canada’s knowledge of options related to the development of future climate change agreements.
Through its participation in Methane to Markets Partnership (M2M) and Renewable Energy and Energy Efficiency Partnership (REEEP), Environment Canada (EC) has achieved significant success with modest investments, including:
- Demonstrating Canadian leadership in capturing fugitive methane emissions or overcoming barriers to renewable energy technology deployment;
- Positioning Canada as a leader in the implementation of clean technology solutions to reduce greenhouse gas emissions and enhance energy efficiency; and,
- Creating commercial opportunities for Canadian clean energy technologies in major emerging economies.
Canada’s active participation in these partnerships achieved the following:
- Invested in public-private clean energy technologies projects;
- Provided direction and leadership to the partnership through its existing governance structure; and,
- Used M2M and REEEP as a forum to support and help Mexico achieve its climate change goal.
Under M2M, Canada, in partnership with the private sector, invested $884 thousand (K) in two main clean technology projects in Mexico in the oil and gas, and landfill sectors. These projects leveraged more than $2.5 million in contributions from project participants which include domestic and international private sector, Mexican government agencies and the United States Environmental Protection Agency.
Under REEEP, Canada’s annual contribution (70,000 Euros) to the Organization’s Secretariat is being used to transfer Canada's expertise in Net Zero Energy Housing to Mexico. These strategic investments enabled EC to lead a capacity building, training and demonstration initiative to promote the development of zero energy housing demonstration projects in Mexico
and Canada is partnering with several Mexican builders on a number of projects that we expect to report on next year.
In 2009-2010, Canada was represented at the M2M Steering Committee and its participation contributed to the long-term direction of the partnership through leadership in policy and project development, and ensured that the partnership strategic direction to activities remained aligned with Canada’s interests and objectives. For example, Canada demonstrated leadership
during the negotiations of the new partnership’s terms of reference which took place in March 2010.
| Total Funding Approved Under the CAA | Program's Planned Spending in 2009-2010 | Program’s Actual Spending in 2009-2010 |
|---|---|---|
| $ 2,892,000 | $ 623,000 | $ 1,728,291 |
Program: International Obligations
| Department |
Department of Foreign Affairs and International Trade |
|---|---|
| Departmental Program Activity |
1.2 Diplomacy and Advocacy |
2009-2010 Program's Expected Achievements
See the 2009-2010 Horizontal Report on Plans and Priorities at: http://www.tbs-sct.gc.ca/rpp/2009-2010/Intl_1b
2009-2010 Program's Achieved Results
Department of Foreign Affairs and International Trade (DFAIT) ensured that Canada provided its assessed contribution to the United Nations Framework Convention on Climate Change (UNFCCC) in a timely manner. Additionally, DFAIT provided $158,650 to the United Nations Framework Convention on Climate Change to support the Least Developed Countries Experts Group and to build regional capacity for greenhouse gas inventories in Africa and $200,000 to the UNFCCC to host an informal workshop of the Nairobi Work Programme.
In addition to this, DFAIT supported bilateral engagement with strategic countries through its Missions abroad. DFAIT also supported the integration of climate change issues to the G8, the Arctic Council, Organization for Economic Co-operation and Development, the International Energy Agency and other multilateral fora.
| Total Funding Approved Under the CAA | Program's Planned Spending in 2009-2010 | Program’s Actual Spending in 2009-2010 |
|---|---|---|
| $1,908,000 | $ 477,000 | $ 477,000 |
Program: International Participation and Negotiations
| Department |
Environment Canada |
|---|---|
| Departmental Program Activity |
3.3 Clean Air Program |
2009-2010 Program's Expected Achievements
See the 2009-2010 Horizontal Report on Plans and Priorities at: http://www.tbs-sct.gc.ca/rpp/2009-2010/inst/doe/st-ts05-eng.asp#Intl_2a
2009-2010 Program's Achieved Results
Intense negotiations at the 2009 United Nations (UN) 15th Climate Conference of the Parties (COP) culminated with the Copenhagen Accord, a breakthrough in the global effort to address climate change. Canada formally associated itself with the Accord and, in January 2010, submitted an economy-wide emissions target for 2020 of 17% below 2005 levels, which is aligned with the United States (U.S.) target. The Government announced a $400 million investment beginning in fiscal year 2010-2011 as Canada’s first step in delivering its’ fair share of the Accord’s commitment by advanced economies to provide financing assistance to developing countries to address climate change1. Canada is continuing to engage in the UN process to negotiate a comprehensive post-2012 agreement based on the Copenhagen Accord. Canada’s engagement in the UN process was complemented by participation in the G8/G20 and other international processes including the U.S. led Major Economies Forum.
To increase consideration of Canadian stakeholders’ interests in developing Canada’s international climate change negotiation positions, policy dialogue sessions took place with provincial and territorial governments, Aboriginal groups and domestic stakeholders both before and after the COP15.
Canada continues to participate in two other key international activities to help advance Canada’s national interests and objectives related to climate change - the Canada-Mexico Partnership (CMP) and the Canada-China Working Group (CCWG). At CMP meetings in 2009-2010, the Environmental Group developed a work plan and began improvements to the Monitoring, Reporting and
Verification systems for the National greenhouse gas (GHG) Inventory; established projects to reduce GHG emissions under the umbrella of Methane to Markets in the oil and gas, landfill, and agriculture sectors; and began work to build Net Zero Housing demonstration houses. At the June 2009 CCWG meeting, Canada and China agreed on issues of common interest for further
discussion and cooperation including: market-based projects; national GHG inventories; carbon capture and storage; and clean technology.
Led the coordination, preparation and publication of Canada’s Fifth National Communication on Climate Change: 2010, a requirement under the UNFCCC membership. The report can be found at http://www.ec.gc.ca/Publications/default.asp?lang=En&xml=EB302ECB-BA4E-4387-A279-DFFD600EA3EE
___________________________________
1Government of Canada makes major investment to international climate change: http://www.ec.gc.ca/default.asp?lang=En&n=714D9AAE-1&news=FD27D97E-5582-4D93-8ECE-6CB4578171A9
| Total Funding Approved Under the CAA | Program's Planned Spending in 2009-2010 | Program’s Actual Spending in 2009-2010 |
|---|---|---|
| $ 11,400,000 | $ 2,800,000 | $ 4,622,272 |
Program: International Participation and Negotiations
| Department |
Department of Foreign Affairs and International Trade |
|---|---|
| Departmental Program Activity |
1.2 Diplomacy & Advocacy |
2009-2010 Program's Expected Achievements
See the 2009-2010 Horizontal Report on Plans and Priorities at: http://www.tbs-sct.gc.ca/rpp/2009-2010/inst/doe/st-ts05-eng.asp#Intl_2b
2009-2010 Program's Achieved Results
The Department of Foreign Affairs and International Trade (DFAIT) continued to provide substantive analytical and policy input for the formulation and presentation of Canadian positions for the negotiations under the United Nations Framework Convention on Climate Change (UNFCCC) and its Kyoto Protocol. Provision of timely and substantial input to senior officials has
enabled informed participation and engagement in international processes. DFAIT participated actively in the United Nations (UN) process, led negotiations on adaptation and coordinated negotiations on the Kyoto Protocol. DFAIT also enabled effective and timely communication between the Ambassador for Climate Change and Canada’s network of embassies and maintained
up-to-date information for the Embassies on the Intranet. DFAIT continued to support Canada’s role on the Least Developed Countries Expert Groug (LEG) through participation in scheduled meetings, and the provision of substantive input to analytical papers and training sessions. In addition, DFAIT advocated Canada’s positions within other multilateral processes,
e.g., the G8, G20, the Major Economies Forum process, Asia-Pacific Economic Cooperation, Arctic Council, Commonwealth, other UN events, and through bilateral channels through DFAIT’s network of embassies and other missions abroad. DFAIT also participated actively in the Intergovernmental Panel on Climate Change deliberations.
| Total Funding Approved Under the CAA | Program's Planned Spending in 2009-2010 | Program’s Actual Spending in 2009-2010 |
|---|---|---|
| $ 6,400,000 | $ 1,550,000 | $ 1,550,000 |
Program: International Participation and Negotiations
| Department |
Natural Resources Canada |
|---|---|
| Departmental Program Activity |
2.1.2 Domestic and International Clean Energy Policy |
2009-2010 Program's Expected Achievements
See the 2009-2010 Horizontal Report on Plans and Priorities at: http://www.tbs-sct.gc.ca/rpp/2009-2010/Intl_2c
2009-2010 Program's Achieved Results
- The Government of Canada formally associated with the Copenhagen Accord in January 2010 and committed to reduce emissions by 17% from 2005 levels by 2020.
- Natural Resources Canada (NRCan) leads for the Government of Canada on international technology negotiations under the United Nations Framework Convention on Climate Change (UNFCCC) as well as its associated Expert Group on Technology Transfer (EGTT). In this capacity, NRCan is working with other countries to develop a technology mechanism for a comprehensive post-2012 climate change agreement. Further, on technology financing, mitigation, and adaptation, NRCan ensured that departmental expertise in this area contributed to international discussions and activities including the Major Economies Forum, the G8 and Asia-Pacific Partnership on Clean Development and Climate (APP).
- NRCan has played a leadership role in facilitating developing country participation in advancing innovative financing objectives and encouraging the role of the private sector to meet long term financial needs to address global climate change. As a result of the partnerships that NRCan has built with key organizations such as the World Bank and the World Business Council for Sustainable Development, representatives of these organizations are now meeting with the EGTT and negotiators, including Canada, to speak to private sector interests in advancing action on climate change, particularly with respect to the development and deployment of clean technologies.
- Canada/NRCan represented the umbrella group of countries as a key member of the EGTT and has led in its efforts to address a range of issues including the work on innovative financing for project development and technology deployment. As part of its ongoing program of work, in 2009, the EGTT published three significant technical papers to inform negotiations on
technology in a new climate regime, including:
- Recommendations on future financing options for enhancing the development, deployment, diffusion and transfer of technologies under the Convention.
- Performance indicators to monitor and evaluate the effectiveness of the implementation of the technology transfer framework.
- A strategy paper for the long-term perspective beyond 2012, including sectoral approaches, to facilitate the development, deployment, diffusion and transfer of technologies under the Convention.
- Minister, Deputy Minister and other senior officials effectively represented NRCan and Canada in a range of strategically selected interdepartmental, bilateral, and multilateral meetings related to clean energy and climate change – both within and outside the UNFCCC.
- Canada was a founding member (as of 2009) of the Global Carbon Capture and Storage Institute (GCCSI), and has provided the Institute with Canadian knowledge and expertise on deployment of Carbon Capture and Storage (CCS) projects.
- In relation to the 2008 G8 commitment to launch 20 large-scale CCS demonstration projects, Canada (through NRCan) has been working with the International Energy Agency, the Carbon Sequestration Leadership Forum (CSLF), and the GCCSI to ensure recognition of Canada’s proportionally high support of CCS (relative to G8 counterparts).
- Ensured NRCan and broader Government of Canada interests are advanced in the context of various international fora, such as the G8, APP, and the United States-led Clean Energy Ministerial under the Major Economies Forum (major emitters) July 19-20, 2010.
- Continued to provide on-going policy input and departmental expertise to the Department of Foreign Affairs and International Trade for the development of key deliverables associated with the preparation for the G8 and G20 Summits hosted by Canada in June 2010.
- Provided expertise to the International Panel on Climate Change (IPCC) mitigation and adaptation working groups, contributing to the development of the IPCC’s 5th Assessment Report.
| Total Funding Approved Under the CAA | Program's Planned Spending in 2009-2010 | Program’s Actual Spending in 2009-2010 |
|---|---|---|
| $ 5,200,000 | $ 1,349,000 | $ 1,381,743 |
Program: Asia-Pacific Partnership
| Department |
Environment Canada |
|---|---|
| Departmental Program Activity |
3.3 Clean Air Program |
2009-2010 Program's Expected Achievements
See the 2009-2010 Horizontal Report on Plans and Priorities at: http://www.tbs-sct.gc.ca/rpp/2009-2010/Intl_3a
2009-2010 Program's Achieved Results
During 2009-2010, through modest and strategic investments, Canada demonstrated its leadership in various areas - including Zero Energy Housing which will result in Canada’s world class technology and expertise being showcased in design and demonstration projects in India, Mexico and China, including at the Shanghai World Expo.
These demonstration projects will lead to the large scale implementation of clean energy technologies which in turn will:
- Create real and verifiable greenhouse gas (GHG) emission reductions;
- Generate additional markets for Canadian products and practices in areas of domestic expertise;
- Placing Canada in a position to capitalize on global economic opportunities for its leading edge environmental services and technologies; and,
- Advance Canadian technological expertise and advance the commercialization of Canadian clean technologies.
Working with its Federal partners including Industry Canada (IC), Natural Resources Canada (NRCan) and the Department of Foreign Affairs and International Trade (DFAIT), the Canadian Asia Pacific Partnership (APP) Secretariat engaged Canadian private sector partners which include:
- Major corporations such as Minto, Enbridge, NovaScotia Power;
- Professional industry associations such as the Aluminum Association of Canada, the Cement Association of Canada, the Canadian Steel Producers Association, Canadian Geoexchange Coalition; and,
- Universities or research institutes such as the University of British Columbia, the University of Guelph, and St-Francis Xavier University.
Canada ensured that its participation in the APP aligned with the Government of Canada domestic and international priorities by emphasising Canada’s policies in energy efficiency and clean technology and ensuring consistency with Canada’s international climate change negotiating objectives.
In partnership with IC, NRCan, DFAIT and working continuously with professional and industry associations and international APP Partners, the Canadian APP Secretariat solicited project proposals from industry, developed a comprehensive criteria and evaluation grid and established a project review team to ensure the APP-funded projects promote the development, diffusion and deployment of clean technologies.
Canada influenced the scope and direction of the APP by participating in the Third APP Ministerial and Policy Implementation Committee meeting in Shanghai, China, chaired the Renewable Energy and Distributed Generation Task Force and co-chaired the Cement Task Force. Canada also hosted a joint APP Task Force.
To date, Canada, in partnership with the private sector, has invested $11.7 million (M) of a 4-year planned total of $15.4 M in 28 clean technology projects. These projects leveraged more than $77 M in contributions from project participants which include domestic and international private sector, foreign government agencies, and domestic and international research institutes.
2 of the 28 projects were completed in 2009-2010.
- The Aluminum Association of Canada established a training program to help Chinese aluminum smelters reduce their emissions of perfluorocarbon, a powerful GHG emitted during the production of aluminum, using Canadian expertise and best-practices.
- A Canadian team including a university, 2 companies and a foundation developed a workable and permanent solution for extinguishing underground coal seam fires in China. These underground fires currently plague the world and have been burning for over 45 years in China. The proposed Canadian solution is now being implemented on several coal mines in China.
| Total Funding Approved Under the CAA | Program's Planned Spending in 2009-2010 | Program’s Actual Spending in 2009-2010 |
|---|---|---|
| $ 18,882,664 | $ 5,738,166 | $ 6,385,940 |
Program: Asia-Pacific Partnership
| Department |
Natural Resources Canada |
|---|---|
| Departmental Program Activity |
2.1 Clean Energy |
2009-2010 Program's Expected Achievements
See the 2009-2010 Horizontal Report on Plans and Priorities at: http://www.tbs-sct.gc.ca/rpp/2009-2010/Intl_3b
2009-2010 Program's Achieved Results
Natural Resources Canada (NRCan) brought forward a number of project proposals for support through Canada’s Asia Pacific Partnership (APP) funding. These proposals were identified as initiatives that would advance Canada’s international clean energy objectives. Project areas included carbon capture and storage, energy efficiency, cleaner energy production and
sustainable development of natural resources.
Canada was represented at the APP’s 8th Policy Implementation Committee (PIC) meeting in Shanghai. NRCan’s presence at the PIC allowed it to further develop relationships with key international stakeholders, explore opportunities for partnerships in future projects, and promote Canadian priorities in clean energy.
In fiscal year 2009-2010, NRCan engaged in the Cleaner Fossil Energy, Power Generation and Transmission, and Coal Mining task forces while contributing technical expertise to the Renewable Energy and Distribution task force. This involvement in the APP required departmental representatives to attend task force meetings throughout the year and allowed for the advancement of
Canadian led projects with other member countries (e.g., Canada’s Coal Mine Health and Safety Project).
| Total Funding Approved Under the CAA | Program's Planned Spending in 2009-2010 | Program’s Actual Spending in 2009-2010 |
|---|---|---|
| $ 877,300 | $ 211,800 | $ 195,252 |
Program: Asia-Pacific Partnership
| Department |
Industry Canada |
|---|---|
| Departmental Program Activity |
2.3 Commercialization and R&D Capacity in Targeted Canadian Industries |
2009-2010 Program's Expected Achievements
See the 2009-2010 Horizontal Report on Plans and Priorities at: http://www.tbs-sct.gc.ca/rpp/2009-2010/Intl_3c
2009-2010 Program's Achieved Results
Industry Canada (IC) officers have contributed positively to Asia Pacific Partnership's (APP) investment of $12 million (M) in 28 clean technology projects by working with the private industrial sectors to submit proposals and to subsequently evaluate the proposals with other departmental colleagues. These projects have leveraged $77M in matching funds from the private sector. The result has shown the private sector’s interest in partnering with government to advance clean technology projects.
IC officers participated actively in the Aluminum, Cement, and Renewable Energy and Distributed Generation task forces meetings that took place in March 2010 in Vancouver on the margins of GLOBE 2010. IC also worked with other departments to take advantage of the Vancouver meetings to hold a Joint APP session to discuss common issues such as financing, flagship project
reviews, and opportunities for synergies between task forces. One of the important developments from the Joint Session was that there is potential for collaborative projects between all task forces.
| Total Funding Approved Under the CAA | Program's Planned Spending in 2009-2010 | Program’s Actual Spending in 2009-2010 |
|---|---|---|
| $ 240,000 | $ 50,000 | $ 30,232 |
Program: PM Annex
| Department |
Environment Canada |
|---|---|
| Departmental Program Activity |
3.3 Clean Air Program |
2009-2010 Program's Expected Achievements
See the 2009-2010 Horizontal Report on Plans and Priorities at: http://www.tbs-sct.gc.ca/rpp/2009-2010/Intl_4
2009-2010 Program's Achieved Results
- Canada has continued specific science and policy related activities in support of renewed discussion with the United States (U.S.) on a Particulate Matter Annex to the Canada-U.S. Air Quality Agreement.
- The federal government completed its work with representatives from provinces, industry and stakeholders to develop an alternative regulatory framework to improve air quality management. The proposed framework includes a foundation of industrial emission requirements for sulphur dioxide, nitrogen oxides, volatile organic compounds and particulate matter.
- The proposed Comprehensive Air Management System framework may assist in the development of the path forward that will help further discussions on a PM Annex to the Canada-U.S. Air Quality Agreement.
| Total Funding Approved Under the CAA | Program's Planned Spending in 2009-2010 | Program’s Actual Spending in 2009-2010 |
|---|---|---|
| $ 2,200,000 | $ 550,000 | $ 420,865 |
Program: U.S. - Canada Clean Energy Dialogue (CED)
| Department |
Environment Canada |
|---|---|
| Departmental Program Activity |
3.3 Clean Air Program |
2009-2010 Program's Expected Achievements
Note: This program was developed and approved after the publication of the 2009-2010 Horizontal Report on Plans and Priorities. The following are the program's expected results.
Clean Energy Dialogue Secretariat
Expected results for 2009-2010 were as follows:
- Coordinate a June 2009 Clean Energy Dialogue (CED) roundtable (including external experts and government officials) to discuss recommendations for the CED Action Plan;
- Identify and monitor milestones for key deliverables and coordinate between Canadian working group leads;
- Coordinate the preparation of the CED Action Plan and its presentation to Prime Minister Harper and President Obama;
- Prepare and brief the Minister of the Environment for bilateral meetings with United States (U.S.) officials; and,
- Monitor and coordinate with other related international clean energy initiatives, where appropriate.
Clean Energy Dialogue Research Development and Demonstration (RD&D) Working Group
Expected results for 2009-2010 were as follows:
- Developing a framework for Canada-U.S. clean energy RD&D collaboration, to provide mechanisms and resources for expanded joint initiatives;
- Identifying and describing, through a joint road mapping initiative, the technology and associated R&D policy pathways that will allow Canada and the U.S. to meet our respective 2050 greenhouse gas emissions reduction goals; and,
- Launching several collaborative projects immediately.
2009-2010 Program's Achieved Results
Clean Energy Dialogue Secretariat:
- Led preparation of the CED Action Plan that identifies 20 projects based on the priority themes identified at the CED roundtable (held in June 2009 in Washington);
- Facilitated implementation of the Action Plan by developing tools and products to monitor and track progress on key deliverables;
- Led preparation of the First Report to Leaders delivered to Prime Minister Harper and U.S. President Obama on September 16, 2009;
- Provided strategic advice to the Minister of the Environment; and,
- Facilitated linkages to other clean energy partnerships and initiatives, including the Asia-Pacific Partnership, the North American Leaders’ Summit (particularly with respect to the 2009 Declaration on Clean Energy and Climate Change), and other regional and bilateral initiatives.
Clean Energy Dialogue Research and Development Working Group
- Canada collaborated with the U.S. to advance the clean energy research and development commitments made in the CED Action Plan, with the goal of increasing R&D collaboration in the areas of advanced biofuels, clean engines and vehicles, and energy efficiency (including homes and buildings).
- Key achievements included:
- Review of existing clean energy R&D collaboration between Canada and the U.S. in the form of a scientometric study of peer-reviewed publications assessing collaborative strengths and key institutional players;
- Support for collaborative projects highlighted in the CED Action Plan, including work on algal biomass and lightweight materials for vehicles;
- Advancement of the Clean Energy R&D Collaboration Framework through the signing of collaborative R&D agreements and support for partnership development workshops; and,
- Advancement of the Clean Energy RD&D Roadmap through scoping the expansion of an energy system modeling initiative at the U.S. Department of Energy to involve Canada.
| Total Funding Approved Under the CAA | Program's Planned Spending in 2009-2010 | Program’s Actual Spending in 2009-2010 |
|---|---|---|
| $ 4,456,403 | $ 2,223,115 | $ 1,783,219 |
Program: U.S. - Canada Clean Energy Dialogue (CED)
| Department |
Department of Foreign Affairs and International Trade Canada |
|---|---|
| Departmental Program Activity |
|
2009-2010 Program's Expected Achievements
Note: This program was developed and approved after the publication of the 2009-2010 CAA Horizontal Report on Plans and Priorities. The following are the program's expected results.
Department of Foreign Affairs and International Trade Canada's (DFAIT) expected results for the initial 7 months of the program (Sept. 1, 2009 to March 31, 2010), (in support of the Clean Energy Dialogue) were as follows:
- Conduct targeted advocacy efforts to advance Canada’s objectives under the CED;
- Build and maintain relationships with key energy players in the United States (U.S.);
- Advance intelligence gathering and coordinate dissemination of updates on energy and climate change developments in the U.S., including economic, legal and policy analyses and reporting concerning Canada-U.S. climate change and energy relations;
- Expand Canada's voice within the U.S. regulatory processes on climate change and energy issues impacting Canada;
- Better leverage and coordinate Canada's existing presence at the state-level, through existing energy-focused resources in consulates to ensure consistent messaging; and,
- Facilitate the implementation of various projects and policy initiatives outlined in the CED Action Plan.
2009-2010 Program's Achieved Results
- Coordinated several successful Ministerial visits to Washington, including Minister Prentice (February 2010), and Minister Paradis (April 2010), that included outcalls on senior officials from the administration as well as legislators.
- Aggressively monitored and reported on potential for Low Carbon Fuel Standards in federal and state legislation in support of advocacy efforts by the Canadian consulates in targeted territories.
- Participated in numerous cleantech, energy and smart grid panels in Ottawa, Washington, Santa Clara, and Atlanta, to deliver clear consistent messaging on the CED and the broader energy relationship.
- In consultation with Natural Resources Canada, Environment Canada and Department of Foreign Affairs and International Trade, developed oil sands advocacy messages which included broader messaging on the role of the CED in enhancing Canada-U.S. collaboration on clean energy technologies.
- Provided support and assistance to the CED working groups to implement projects and policy initiatives outlined in the CED Action Plan, including through regular advocacy efforts and facilitating face-to-face meetings between working group members.
| Total Funding Approved Under the CAA | Program's Planned Spending in 2009-2010 | Program’s Actual Spending in 2009-2010 |
|---|---|---|
| $ 956,900 | $ 356,900 | $ 281,384 |
Program: U.S. - Canada Clean Energy Dialogue (CED)
| Department |
Natural Resources Canada |
|---|---|
| Departmental Program Activity |
2.1 Clean Energy |
2009-2010 Program's Expected Achievements
Note: This program was developed and approved after the publication of the 2009-2010 CAA Horizontal Report on Plans and Priorities. The following are the program's expected results.
2009-2010 Program's Achieved Results
Carbon Capture and Storage (CCS) Working Group
- A paper on regulatory issues for Canada-United States (U.S.) CCS projects was prepared to support work towards compatible rules, standards and practices.
- A paper on the development of a knowledge-sharing framework on collaboration on CCS demonstration projects was commissioned. It provides an overview of existing knowledge sharing frameworks, results of the consultation with Canadian large-scale CCS project proponents and select academia on knowledge sharing and learning dissemination, and high-level recommendations on the development of such a framework in Canada.
- A Next Generation CCS Technology Collaboration Plan was drafted. It outlines key priorities between Canada and the U.S. and provides context for a number of technological areas.
- A work program for the development of the Canadian portion of the North American Carbon Storage Atlas was submitted and accepted for 2010-2011 funding. A trilateral meeting of the North American Carbon Atlas Project was held in Mexico in March 2010 to discuss progress on the project. Agreement was reached on outstanding methodology-related issues and next steps.
- Work on the International Energy Agency Weyburn-Midale Project proceeded according to schedule. A new proposal for expanded work on the well integrity theme was accepted by both the Canadian and U.S. governments and combined additional funding of $5.2 million for this task was committed in January 2010.
Electricity Grid Working Group
- A Canada-U.S. Forum on “Building the Power Workforce of Tomorrow” was held in Toronto on February 17-18, 2010. It focused on training and recruitment issues in the electricity sector.
- A background paper on Realizing the Potential Power of Storage was completed in order to examine existing storage potential and identify market barriers to making more efficient use of storage. It has been distributed to key stakeholders and provincial government representatives and is available to the public upon request.
- Ongoing discussions and regular quarterly meetings between Natural Resources Canada and provincial and U.S. regulators have focused on reliability standards and cyber security. In addition, federal departments and agencies began addressing the smart grid interoperability standards.
| Total Funding Approved Under the CAA | Program's Planned Spending in 2009-2010 | Program’s Actual Spending in 2009-2010 |
|---|---|---|
| $1,761,350 | $ 839,150 | $ 615,610 |
Theme: Adaptation
| Lead Department |
Natural Resources Canada / Indian and Northern Affairs Canada |
|---|---|
| Federal Theme Partners |
Health Canada, Environment Canada, Public Health Agency of Canada |
Expected Results from Theme's Programming
Immediate Outcomes
- Increased availability of adaptation and air quality information and products;
- Increased awareness and understanding of the risks of climate change and of the impacts of air quality on health and of response strategies;
- Greater collaboration in place to address adaptation planning and air quality health impacts; and,
- Increased capacity to conduct and apply adaptation and air quality science.
Intermediate Outcomes
- Increased use of adaptation and air quality information and products;
- Increased capacity of Canadians to adapt to climate change and to reduce air quality related health impacts; and,
- Additional approaches to adapt to climate change are developed in targeted areas.
Final Outcomes
- Reduced vulnerabilities and risks to communities, infrastructure and health and safety of Canadians resulting from climate change; and,
- Reduced exposure to health risks due to air quality related health risks.
2009-2010 Expected Achievements
See the 2009-2010 Horizontal Report on Plans and Priorities at: http://www.tbs-sct.gc.ca/rpp/2009-2010/Adapt_Theme
2009-2010 Achieved Results
Immediate Outcomes
Increased availability of adaptation and air quality information and products
Adaptation and air quality information and products have been made widely available through innovative delivery mechanisms and unique partnerships. The Air Quality Health Index (AQHI) was implemented in six additional Census Metropolitan Areas (CMAs) in Atlantic Canada, Quebec and the Prairies to bring the total number of CMAs with access to the Index to 16. The program was promoted through a multi-year partnership with The Weather Network/Méteo-Média, social media, a DVD toolkit and a telephone system. To share information about heat, Health Canada (HC) held three webinars on a range of heat-related topics, averaging a participation rate of 60+ logons per webinar.
Many northern communities developed a range of adaptation and educational tools, including videos, books, publications and presentations. Some information and tools were disseminated through the delivery of a risk-management workshop, a webinar, documentation to share project successes, and training materials.
Information has also been provided to pilot communities on infectious diseases and adaptation to climate change, and contribution agreements are in place with five universities to increase knowledge and produce tools to enable prediction of areas and sub-populations at increased risk to specified infectious diseases.
Global and regional climate model outputs are disseminated to users via the Canadian Centre for Climate Modelling and Analysis data server. Research results are disseminated via interactive websites and publications.
A number of tools are also in development and under review. A Heat-Health Communications Toolkit, Extreme Heat Guidelines for Healthcare Workers, and Heat-Health Fact Sheets have been prepared for review by experts. As well, a regional climate model has been developed and testing and evaluation are underway. These are expected to be made available in the coming year of programming.
Increased awareness and understanding of the risks of climate change and of the impacts of air quality on health and of response strategies
The level of awareness and understanding of the risks of climate change has not been formally measured amongst all target audiences. There is evidence; however, that progress has been made as partners demonstrate an increased level of awareness.
Most communities that applied to HC for funding between 2008-2010 to conduct climate change and health adaptation planning in the North were applying for the first time, indicating an increased understanding of the risks of climate change to their communities. Over 20 projects were funded for the two years and they covered a range of topics. There has also been increased interest in Indian and Northern Affairs Canada’s (INAC) funding program. This resulted in 36 projects funded in 2009-10, compared to 24 projects funded in 2008-2009. It is anticipated that this will continue to increase in 2010-2011 and that the program will be fully subscribed by April 2010. The projects cover both territories and provinces.
Outreach partners of the AQHI have acquired regional and local evidence of increased awareness and understanding. HC and the University of British Columbia have focused on increasing awareness in certain target populations by delivering an e-learning course in 2009-2010 for physicians and other health professionals.
The use of available climate change models also increases awareness and understanding of risks of climate change at the global and regional level. The models provide updated climate change information.
Greater collaboration in place to address adaptation planning and air quality health impacts
The Adaptation Theme has made significant progress in establishing and strengthening collaborations with partners from other levels of government including international partners, non-governmental organizations and the private sector.
The Public Health Agency of Canada (PHAC) has developed a national network, with international linkages, through the development of an international Expert Advisory Committee. PHAC has also built networks within communities and regions that allow for greater exchange of information. Four community-based pilot projects, receiving $125 thousand in funding each, are using a community-based approach to assess infectious disease risk relative to climate change and response plans.
HC has collaborated internationally, with the Pan American Health Organization and the World Health Organization, as well as with the United States (U.S.) Centre for Disease Control; nationally, with the Red Cross to develop educational materials; and, with healthcare professionals from clinical, public health and research communities through the development of the Health Professional Intervention and Training Advisory Committee.
The AQHI has worked with provincial and municipal partners to promote the AQHI and disseminate educational material and advice on air quality and health. They have developed 11 Grants and Contributions with national and local non-governmental organizations to support implementation.
HC and INAC funded assessments and adaptation projects in the North have collaborated with youth and elders, academics, scientists, and Inuit, First Nation and northern organizations and governments.
Territorial governments are developing a pan-northern adaptation strategy to outline key priorities of the territories. INAC is working with territories to develop partnership agreements to define required support and collaboration to address these priorities.
Five Regional Adaptation Collaboratives (RACs) have been established in British Columbia, the Prairies, Ontario, Quebec and the Atlantic. The Northern RAC is under development and is expected to be established in 2010-2011. 15 sub-agreements have been put in place in BC and 20 in Quebec, bringing together partners who in many cases have not worked formally together.
The Canadian Climate Change Scenarios Network was expanded nationally and now includes regional nodes for the Pacific, the Prairies, Ontario, Quebec, and the North and negotiations have been completed for the Atlantic node.
Increased capacity to conduct and apply adaptation and air quality science
Although it is difficult to measure increased capacity, there have been efforts made to build capacity to conduct and apply adaptation and air quality science. Four workshops were held in communities to provide training on the use of Natural Resources Canada’s (NRCan) risk management guides. Workshops have also been held involving 13 universities to discuss knowledge and policy linkages for adaptation. Public health professionals have been trained on infectious disease and environmental/climate change. Training sessions have also been held on the use of climate change scenarios with participants from other government departments, provinces, territories, municipalities and the private sector. Course evaluations on these training sessions have been very positive, with additional information being requested.
New information has also been incorporated into existing systems to increase their effectiveness. Over 7000 climatic design values have been updated for the National Building Code of Canada, as well as maps for several national standards. Climate trend information on near extremes also continues to be added to the Atmospheric Hazards regional nodes used for emergency management and working with other partners, Environment Canada continues to develop new methodologies to incorporate climate change extremes analyses and uncertainties into future national codes and standards.
Intermediate Outcomes
Increased use of adaptation and air quality information and products
The training and dissemination of information discussed under the immediate outcomes will contribute to increased use of adaptation and air quality information and products.
Increased capacity of Canadians to adapt to climate change and to reduce air quality related health impacts
Capacity is difficult to measure, but tools have been developed to allow Canadians to use available information to adapt to climate change. The AQHI is available in 40 locations across Canada and relevant information on the Index is widely disseminated through The Weather Network and Méteo-Média. Pilot heat alert and response system plans have been prepared by four pilot communities, vulnerability assessments have been completed in two pilot communities, and tabletop exercises have been completed in the remaining two communities. Participant feedback indicated the assessments and exercises were successful in increasing awareness of heat as a health risk.
Additional approaches to adapt to climate change are developed in targeted areas
As of March 31, 2010, the INAC program has funded over 60 projects that will build adaptive capacity within 72 Aboriginal and northern communities, organizations and governments across the Canadian Arctic, South of 60, and nationally. These projects will also generate tools and information that can be shared and used by other communities across the country to support them in adapting to climate change impacts.
Under the AQHI, the development of an e-learning course through University of British Columbia and a pilot implementation project in Quebec City with a special focus on susceptible populations are some examples of new approaches to providing air quality index information to Canadians.
Final Outcomes
Reduced vulnerabilities and risks to communities, infrastructure and health and safety of Canadians resulting from climate change
Reduced exposure to health risks due to air quality related health risks
It is too early to clearly measure and demonstrate direct results on achieving both of these final outcomes. Programs have completed their second year of implementation and are working toward achieving results under these final outcomes in future years. Success will be dependent upon achievements under existing programming as well as continuation of these initiatives beyond
the current Clean Air Agenda time frame.
2009-2010 Successes
Considering that 2009-2010 was the first complete year of implementation, the Adaptation Theme has had many accomplishments in a short period of time. Some of the key achievements and results of the Theme to date include:
- Requests for funding were greater than the funding available for a number of programs;
- Through many programs, a number of communities across the country have conducted assessments, developed plans and tools, and have access to quality information that will support them in managing the challenge of climate change;
- 6 of 10 provinces have suspended their old air quality indices in favour of the AQHI, which has been identified as a relevant federal government program by key external stakeholders. AQHI forecasts are now available in 9 of 10 provinces;
- New partnerships developed under Adaptation Theme programs are generating innovative ideas and strong support from key stakeholders, including provincial and territorial governments, in each of the regions; and,
- A Canadian global climate model has been developed into an internationally competitive “earth system” model.
2009-2010 Risks and Challenges
The Adaptation Theme is the first suite of programs directly targeted toward supporting Canadians as they adapt to a changing climate. The departments implementing those programs did not receive approval before the second year of implementation of the Clean Air Agenda, and received funding half way through their first year of implementation in 2008-2009. Therefore, 2009-2010 was the first year where key outputs started to be achieved. As the year progressed, it became clear that although the Adaptation Theme programs were addressing some of the needs of Canadians as they adapt to climate change, the needs exceeded the scope of the existing programs and are growing.
Some of the risks and challenges encountered by Adaptation Theme programs include:
- Some departmental terms and conditions limit programs to providing single-year funding which has made it difficult to develop and implement meaningful research and planning projects;
- In many departments, processing of contribution agreements took considerable time and caused serious delays for proponents, compressing time available to deliver projects;
- For some programs, limited resources have limited their capacity to provide support and extend projects to key vulnerable populations or geographical locations;
- Despite requests for the programs, some proponents lacked capacity to participate fully at the outset. Thus, programs have adapted their implementation and worked with proponents to help them successfully design projects. This led to delayed, but more successful, implementation;
- A number of programs are oversubscribed and as programs deliver results, interest continues to increase;
- Some programs had to carry over funding into Fiscal Year 2011-2012 to provide necessary time for achievement of useful research and program outcomes; and,
- Retaining qualified staff remains a challenge for programs in absence of clear future direction.
| Theme's total funding approved under the CAA | Theme's Planned Spending in 2009-2010 | Theme's Actual Spending in 2009-2010 |
|---|---|---|
| $ 115,900,000 | $33,337,536 | $30,911,780 |
Program: Assist Northerners in Assessing Key Vulnerabilities and Opportunities
| Department |
Indian and Northern Affairs Canada |
|---|---|
| Departmental Program Activity |
5.3 Northern Lands and Resources |
2009-2010 Program's Expected Achievements
See the 2009-2010 Horizontal Report on Plans and Priorities at: http://www.tbs-sct.gc.ca/rpp/2009-2010/inst/doe/st-ts05-eng.asp#Adapt_1
2009-2010 Program's Achieved Results
The Indian and Northern Affairs Canada (INAC) Assist Northerners in Assessing Key Vulnerabilities and Opportunities program funded a total of 36 projects during 2009-2010. The range of projects funded include climate change risk assessments, climate change information needs and gaps analysis, community/regional adaptation planning, building capacity for adaptation planning, as well as support toward development of scenarios and strategies.
Immediate Outcomes
Increased availability of adaptation and air quality information and products.
Increased awareness and understanding of the risks of climate change and of the impacts of air quality on health and of response strategies.
Greater collaboration in place to address adaptation planning and air quality health impacts.
Increased capacity to conduct and apply adaptation and air quality science.
- INAC’s adaptation program continued to gain momentum during the year and the demand for the program is high. Since the beginning of the program on April 1, 2008, the program has seen a continual increase in funding applications and the overall number of funded projects. During 2009-2010, the program funded 36 projects, compared to 24 projects funded in 2008-2009. It is anticipated that the program will receive in excess of 40 applications during 2010-2011, and it is expected that the program will be fully subscribed by April 2010.
- The program was able to fund the work of partner organizations which looked at the climate change risks and adaptive capacity in Aboriginal communities South of 60°, and the development of a National Guideline on Permafrost, Climate Change and Community Infrastructure for application across Canada by the Canadian Standards Association. The assessment of Aboriginal communities South of 60° will be used to determine what level of programming will be required to address the climate change risks being felt in these communities.
- The program continued to work with local-level partners both North and South of 60°. In working with these partners, the program was able to fund 11 projects (out of 36) that generated knowledge, developed adaptation tools, and shared information. Examples of this work includes the delivery of a climate change risk management workshop; the development of training materials, including a webinar; development of territory wide climate change scenarios; and documentation that will be used to share the success of projects funded through the program. Through these projects, local-level northern and southern partners will be able to share their knowledge of climate change risks and how they plan to address these risks, which in turn will build adaptive capacity within communities.
- During 2009-2010, the program supported 10 adaptation planning projects (out of 36), that dealt with community-based climate change adaptation.
- The three territorial governments are currently developing a pan-northern adaptation strategy which will outline the key priorities of the territories in the context of increasing northern interests. INAC’s adaptation program has been working with the territorial governments to develop partnership agreements to define how INAC can support implementation of their key adaptation priorities.
- The program continued to work with the Government of Nunavut on its community climate change adaptation planning project, in collaboration with Natural Resources Canada (NRCan) and project partners. This project, also funded by the program in 2008-2009, will be used as a tool to apply to additional communities within the territory. To date, the project is addressing the needs of 12 communities in Nunavut.
- The program has been successful in strengthening relationships within INAC sectors, at headquarters and in regional offices, to maximize the success of the INAC Adaptation program. The program has also been able to increase the profile of adaptation within the department as it relates to departmental operations. INAC is undergoing a departmental climate change vulnerability assessment that will allow the Department to further integrate climate change considerations into its policies and programming. It is expected that the assessment will be completed by Fall 2010. The results of this assessment will be used to develop an integration tool for the department.
- INAC has worked with departmental partners at Health Canada, Environment Canada and NRCan to ensure that the programs are funding projects that are successful in building the necessary adaptive capacity within communities. Some of this work included the development of regional climate change scenarios in the Yukon, building capacity for community climate change adaptation planning in Nunavut, assisting in the planning and creation of the Regional Adaptation Collaborative for North of 60°, and participating in proposal review committees.
- The program funded 15 projects (out of 36) related to adaptation science and assessment of risk. These projects included work on permafrost monitoring and modeling, terrestrial and aquatic ecological monitoring, sea and freshwater ice monitoring, and vulnerability assessments. The results of these projects will be used in the development of climate change scenarios and the creation of climate change adaptation plans.
Intermediate Outcomes
Increased use of adaptation and air quality information and products.
Increased capacity of Canadians to adapt to climate change and to reduce air quality related health impacts.
Additional approaches to adapt to climate change are developed in targeted areas.
- Since April 1, 2008, INAC’s adaptation program has funded over 60 projects that will build adaptive capacity within 72 Aboriginal communities, across the Canadian Arctic, South of 60°, and nationally. As a result of these projects, there will be improved information sharing and risk identification; as well as an increased capacity within communities to allow them to address risks through the implementation of tools and measures to address climate change impacts.
Final Outcomes
Reduced vulnerabilities and risks to communities, infrastructure and health and safety of Canadians resulting from climate change.
| Total Funding Approved Under the CAA | Program's Planned Spending in 2009-2010 | Program’s Actual Spending in 2009-2010 |
|---|---|---|
| $ 14,000,000 | $ 5,400,000 | $ 5,346,299 |
Program: National Air Quality Health Index and Air Quality Forecast Program
| Department |
Environment Canada |
|---|---|
| Departmental Program Activity |
2.1.2 |
2009-2010 Program's Expected Achievements
See the 2009-2010 Horizontal Report on Plans and Priorities at: http://www.tbs-sct.gc.ca/rpp/2009-2010/Adapt_2a
2009-2010 Program's Achieved Results
The Air Quality Health Index (AQHI) was developed jointly by Environment Canada (EC) and Health Canada (HC), in collaboration with provincial/territorial and non-governmental stakeholders, to provide Canadians with daily local air quality conditions and forecasts, as well as information to promote healthy behaviour in response to air quality conditions.
Immediate Outcomes
Increased availability of adaptation and air quality information and products
- The AQHI was implemented in an additional six Census Metropolitan Areas (CMAs) in 2009-2010, to bring the total number of CMAs with access to the AQHI to 16. The six new CMAs included: Winnipeg, Saskatoon, Regina, St. John’s, the province of Prince Edward Island (PEI), and Cape Breton Island (including Sydney). A pilot implementation project was initiated in Quebec City with a special focus on susceptible populations. By the end of 2009-2010, the AQHI was available in 40 locations across Canada.
Increased awareness and understanding of the risks of climate change and of the impacts of air quality on health and of response strategies
- Outreach partners have acquired regional and local anecdotal evidence of increased awareness and understanding but the program is still in a pilot stage in many locations and as such cannot be assessed nationally.
Greater collaboration in place to address adaptation and air quality health impacts
- HC developed Memoranda of Agreement with provincial and municipal partners, including the British Columbia Ministry of Healthy Living and Sport, Toronto Public Health, Institut national de santé publique du Quebec, Nova Scotia Environment, Prince Edward Island Department of Health, and the City of Ottawa. As a result of these formal agreements, participation in AQHI outreach efforts including dissemination of educational material and advice on air quality and health to key public audiences was achieved. For example, partners were able to promote the use of the AQHI in their jurisdictions through various means: marketing the AQHI through social media such as Twitter and Facebook in BC, a DVD toolkit of outreach materials for the use of all partners in Toronto, and a telephone system in Quebec City designed to alert the most vulnerable members of the population to a forecasted AQHI of 6 or more.
- EC developed 11 Grants and Contributions with national and local non-governmental organizations to support local and national AQHI implementation with a focus on using the awareness of the AQHI to promote environmental improvement. Examples of some results achieved were: AQHI presentations in schools and a presence of the Olympic village through partnership with Clean Air Champions, enhancement of AQHI presence in the City of Toronto’s “20/20 Way to Clean Air” campaign and integration of the AQHI messaging into the Asthma Ambassador initiative of the Asthma Association of Canada.
No intermediate outcomes assessed at this time for reasons identified in Immediate Outcome 2.
| Total Funding Approved Under the CAA | Program's Planned Spending in 2009-2010 | Program’s Actual Spending in 2009-2010 |
|---|---|---|
| $21,300,000 | $5,800,000 | $5,568,987 |
Program: National Air Quality Health Index and Air Quality Forecast Program
| Department |
Health Canada |
|---|---|
| Departmental Program Activity |
3.1.2 |
2009-2010 Program's Expected Achievements
See the 2009-2010 Horizontal Report on Plans and Priorities at: http://www.tbs-sct.gc.ca/rpp/2009-2010/Adapt_2b
2009-2010 Program's Achieved Results
The Air Quality Health Index (AQHI) was developed jointly by Health Canada (HC) and Environment Canada (EC), in collaboration with provincial/territorial and non-governmental stakeholders, to provide Canadians with daily local air quality conditions and forecasts, as well as information to promote healthy behaviour in response to air quality conditions.
- The AQHI was implemented in an additional six Census Metropolitan Areas (CMAs) in 2009-2010, to bring the total number of CMAs with access to the AQHI to 16. The six new CMAs included: Winnipeg, Saskatoon, Regina, St. John’s, the province of Prince Edward Island, and Cape Breton Island (including Sydney). A pilot implementation project was initiated in Quebec City with a special focus on susceptible populations. By the end of 2009-2010, the AQHI was available in 40 locations across Canada.
- HC entered into a multi-year partnership with The Weather Network/Météo-Media to provide prominent placement of AQHI forecasts, current readings and related materials on various media platforms including television, web, wireless, desktop and newspapers as well as promoting the AQHI through tips, vignettes and news stories on their variety of mediums. The first tips were broadcasted in March 2010.
- HC worked with the University of British Columbia (UBC) to develop an accredited on-demand e-learning course entitled “Air Quality and Human Health and the AQHI” for physicians and other health professionals. This course allows the AQHI program to reach the direct target audience of health care providers, and indirectly to reach the target audience of the at-risk or sensitive population. Over 200 professionals had either enrolled in or completed the course by March 31, 2010.
- In 2009-2010, Memoranda of Agreement were developed with provincial and municipal partners, including the British Columbia Ministry of Healthy Living and Sport, Toronto Public Health, Institut national de santé publique du Quebec, Nova Scotia Environment, Prince Edward Island Department of Health, and the City of Ottawa. As a result of these formal agreements, participation in AQHI outreach efforts including dissemination of educational material and advice on air quality and health to key public audiences was achieved. For example, partners were able to promote the use of the AQHI in their jurisdictions through various means: marketing the AQHI through social media such as Twitter and Facebook in BC, a DVD toolkit of outreach materials for the use of all partners in Toronto, and a telephone system in Quebec City designed to alert the most vulnerable members of the population to a forecasted AQHI of 6 or more.
| Total Funding Approved Under the CAA | Program's Planned Spending in 2009-2010 | Program’s Actual Spending in 2009-2010 |
|---|---|---|
| $8,700,000 | $2,200,000 | $2,183,845 |
Program: Improved Climate Change Scenarios
| Department |
Environment Canada |
|---|---|
| Departmental Program Activity |
Improved Climate Change Scenarios |
2009-2010 Program's Expected Achievements
See the 2009-2010 Horizontal Report on Plans and Priorities at: http://www.tbs-sct.gc.ca/rpp/2009-2010/Adapt_3
2009-2010 Program's Achieved Results
Subcomponent 1
- Improvements to the Canadian global climate model continue to be made, such as improved representation of the sulphur and carbon cycles, radiative transfer, cloud physics, and ocean processes, leading to ongoing improvements in the capability to undertake historical climate simulations and future projections.
- Research on initialization of fully-coupled climate models and the application of such models for seasonal to inter-annual climate prediction also continue to be developed, such as through participation in the internationally-coordinated coupled system historical forecast project to evaluate model skill and compare to other state-of-the-art models.
- A new regional climate model that will be used to downscale global climate change projections has been developed, and testing and evaluation are well underway. These models continue to provide updated climate change information, contributing to the awareness and understanding of the risks of climate change as well as aiding in the development of climate policy at the global (e.g., through the Intergovernmental Panel on Climate Change (IPCC)) and regional level.
- Global and regional climate model output continues to be disseminated to users via the Canadian Centre for Climate Modelling and Analysis (CCCMA) data server and research results widely disseminated via interactive websites and publications.
Subcomponent 2 (Year 2)
- The Canadian Climate Change Scenarios Network (CCCSN) was expanded nationally and now includes regional nodes for: Pacific (University of British Columbia), Prairie (University of Regina), Ontario (University of Toronto), Quebec (McGill University), Northern (Yukon College), and negotiations were completed in 2009-2010 for the Atlantic node (University of Prince Edward Island).
- The CCCSN has been highly popular and has reached over 2 million visits. The most recent developments from all of the IPCC global and regional climate change models outputs have been analyzed and converted into useable information for Canadians. Ongoing improvements continue to be made and new scientific developments verified and quality controlled (e.g., Regional Climate Change Modelling from the University of Regina). Information is available at www.cccsn.ca.
- Training sessions continued to take place across Canada, including on request by stakeholders, on the use of climate change scenarios with participants from other government departments, provinces, territories, municipalities and the private sector. Course evaluations have been highly positive with request for more information.
- Tools were developed for use with climate change scenarios (e.g., downscaling statistical models, bioclimate profiles, Rapid Assessment of Impacts of Climate Change. These tools help users and decision-makers to interpret the complex, scientific outputs of climate change models in order to ensure informed decisions and to reduce the vulnerability of Canadians to climate change impacts and extreme weather.
- Output from the most recent versions of the Canadian Regional Climate Model, which is operated at Ouranos, continued to be incorporated into the CCCSN web site to increase the awareness of, availability of and access to new climate information.
Subcomponent 3 (Year 2)
- Updates and improvements to the Canadian Atmospheric Hazards Network (CAHN) websites were completed and all of the regional nodes went live as of March 31, 2010. Information is available at http://www.hazards.ca/. The CAHN is the national source for regional climate hazards information and is increasing in popularity as new regional nodes became active (already more than 1 million visits to the Ontario and Atlantic nodes, alone).
- Climate trend information on near term extremes continues to be added to the Atmospheric Hazards regional nodes used for emergency management, with plans to add future projections. In collaboration with Emergency Management Ontario, a survey of over 200 municipalities in Ontario was completed to determine the climatic events of highest risk for municipalities and priorities for emergency management planning. The study also included an assessment on how atmospheric hazards and risk assessments are being incorporated into Municipal emergency preparedness plans. Negotiations are underway to expand the survey to other regions of Canada.
- Through invited participation in national stakeholder committees, Environment Canada (EC) has been able to update, on a priority basis, over 7000 climatic design values for the National Building Code of Canada (NBCC) as well as maps for several national standards. Ongoing discussions with National Codes and Standards Committees, the Canadian Council of Professional Engineers, Transportation Association of Canada and many other stakeholder organizations are helping to shape new and innovative methodologies for inclusion of climate change science and uncertainties into future codes and standards (e.g., 2015 NBCC). As a result of consultations through the Canadian Standards Association, EC has contributed to new guides for planning and construction of foundations in permafrost regions and was the Lead for a National Guide on Use of Rainfall Intensity Duration Frequency information for stormwater infrastructure design.
- Significant efforts to expand stakeholder’s consultations were undertaken with a high degree of success.
| Total Funding Approved Under the CAA | Program's Planned Spending in 2009-2010 | Program’s Actual Spending in 2009-2010 |
|---|---|---|
| $15,000,000 | $ 4,899,641 | $ 4,168,985 |
Program: Climate Change and Health Adaptation in Northern/Inuit Communities
| Department |
Health Canada |
|---|---|
| Departmental Program Activity |
4.1 First Nations and Inuit Health Programming and Services |
2009-2010 Program's Expected Achievements
See the 2009-2010 Horizontal Report on Plans and Priorities at: http://www.tbs-sct.gc.ca/rpp/2009-2010/Adapt_4
2009-2010 Program's Achieved Results
All three planned workshops were completed in 2008-2009 and results were reported last year. In 2009-2010, availability of climate change and health-related adaptation plans were increased by conducting community visits and information sessions. Nine community visits were undertaken in the Yukon in collaboration with the Council of Yukon First Nations. Presentations on the program were delivered to Chiefs and Councils, and Health and natural resource departments. Information sessions were also given in Inuvik to the Young Leader’s Summit on Northern Climate Change (70 attendees), in Yellowknife at the 14th International Congress on Circumpolar Health where results of six of the 10 projects funded the previous year were also presented by the communities (650 attendees); and in Ottawa at the National Aboriginal Health Organization conference (700 attendees). In addition, reports from the 10 projects funded in 2008-2009 have been completed and the summaries have been included in the application guide material for 2010-2011.
Between 2008 and 2010, the program has funded 20 projects in three Inuit regions as well as NWT and the Yukon. The projects cover a range of topics and issues that affect health including changes to sea ice, permafrost decline and erosion, changes in drinking water and traditional food safety and security, changes in traditional medicine resources, changing temperatures and more unpredictable weather. Brochures and application guides for 2010-2011 were made available on the web and sent to northern communities with information on who to contact for further information for next year’s funding (2010-2011).
In 2009-2010, 15 communities/organizations applied for funding, 13 of which applied for the first time, thus indicating an increased awareness and understanding of the risks of climate change on health.
Of the 15 proposals, 14 met the criteria developed in the: "Climate Change and Health Adaptation in Northern First Nations and Inuit Communities Program 2009-2010 Funding Application Guide".
| Total Funding Approved Under the CAA | Program's Planned Spending in 2009-2010 | Program’s Actual Spending in 2009-2010 |
|---|---|---|
| $7,000,000 | $2,150,000 | $2,064, 571 |
Program: Innovative Risk Management Tools/Regional Adaptation Action Partnerships
| Department |
Natural Resources Canada |
|---|---|
| Departmental Program Activity |
3.1 Adapting to a changing climate and hazard risk management |
2009-2010 Program's Expected Achievements
See the 2009-2010 Horizontal Report on Plans and Priorities at: http://www.tbs-sct.gc.ca/rpp/2009-2010/Adapt_5
2009-2010 Program's Achieved Results
Innovative Risk Management Tools
Two tools to assess climate change risks were delivered as planned. The guides, one for Alberta and one for BC, assist local governments in assessing risks from a changing climate and identifying adaptation options. Four workshops were held, two in each province, to train communities in use of the guides, building capacity of these groups to use climate change information to plan for adaptation. The guides will be disseminated on the Natural Resources Canada (NRCan) adaptation website. The Canadian Institute of Planners made progress on assessing the need for new or updated land use planning tools in consultation with planners across the country and will complete the task in Fiscal Year 2010-2011. The Adaptation Working Group of the Canadian Council of Energy Ministers, supported by the Program, completed a review of the adaptive capacity of the Canadian electricity sector. The review used in-depth interviews with stakeholders from that sector. The results indicated that case studies demonstrating application of climate change information would be prefered to tools in helping build awareness and understanding of the issue in the sector.
Regional Adaptation Action Partnerships
Five Regional Adaptation Collaboratives (RACs) were established – in British Columbia (BC), the Prairies, Ontario, Quebec and the Atlantic. Working with the Provinces, the RACs bring together decision-makers from all levels of government, business as well as other stakeholders to work together on several priority adaptation issues. The level of collaboration required within each region to design and organize the delivery of a detailed work plan to address adaptation priorities has already yielded some of the immediate outcomes. For example, 15 sub-agreements are now in place in BC, and 20 in Quebec, each one directly involving partners, who in many cases did not formally work together before - overall increasing the formal collaborations in place to address adaptation. Also, within the Ontario RAC, a workshop involving 13 universities was held to discuss knowledge and policy linkages for adaptation increasing the capacity to appropriately target science and apply the results in decision-making. All RACs held workshops and other activities to engage the decision-making community in the projects. The northern RAC is under development by Territorial governments and is expected to become operational in fiscal year 2010-2011.
| Total Funding Approved Under the CAA | Program's Planned Spending in 2009-2010 | Program’s Actual Spending in 2009-2010 |
|---|---|---|
| $ 35,000,000 | $ 8,500,000 | $ 6,913,474 |
Program: Climate and Infectious Disease Alert and Response System to Protect the Health of Canadians
| Department |
Health Canada |
|---|---|
| Departmental Program Activity |
3.1 Healthy Environments and Consumer Safety |
2009-2010 Program's Expected Achievements
See the 2009-2010 Horizontal Report on Plans and Priorities at: http://www.tbs-sct.gc.ca/rpp/2009-2010/inst/doe/st-ts05-eng.asp#Adapt_6a
2009-2010 Program's Achieved Results
Information, Decision Support and Training (Output):
- Draft Heat-Health Communications Toolkit prepared for review by identified experts. The toolkit provided guidance to public health and emergency management officials on how to effectively communicate risks to health from extreme heat events.
- Draft Extreme Heat Guidelines for Healthcare Workers prepared for review by experts. The Guidelines were designed to address a critical information gap by providing education and training material for health care workers regarding extreme heat, particularly the prevention, diagnosis and treatment of heat-related illnesses.
- Three draft Heat-Health Fact Sheets prepared for review by identified experts and community partners. The fact sheets were developed to raise awareness of heat-health impacts and deliver information about effective measures that can be taken to protect health.
- Development of draft Heat Alert and Response System (HARS) Best Practices Guidebook initiated. The objective of the Heat Alert and Response System (HARS) Best Practices Guidebook was to provide public health and emergency management officials with information about the most effective interventions for reducing health risks from extreme heat events in Canada.
- Health Canada (HC) in collaboration with the Red Cross initiated the development of a new ‘heat-health’ module for inclusion in the Red Cross’ Expect the Unexpected series of activity booklets. The booklets are designed to provide a straightforward learning environment for children ages 7-13, their parents and educators, to discuss planning and responding to emergencies.
Tools, Processes, and Systems (Output):
- Pilot heat alert and response systems plans were implemented in four communities: Winnipeg, Manitoba; Assiniboine Regional Health Authority, Manitoba; Windsor, Ontario; and, Fredericton, New Brunswick.
- HC initiated a research initiative to develop a new approach to monitoring the four heat variables: wind, solar load, temperature and humidity. Monitors measuring these 4 heat variables were installed in the 4 pilot communities and data collected were analyzed.
Partnerships and Networks (Outputs):
- In 2009-2010 HC initiated the Health Professional Intervention and Training (HPIT) Advisory Committee holding two meetings in April and November, 2009. The principal objective of this Advisory Committee is to both provide strategic direction in the overall design and structure of the Guidelines for Healthcare Worker, as well as review of draft versions of this document. The HPIT Advisory Committee brings together healthcare professionals from the clinical, public health and research communities.
- In 2009-2010 HC hosted one meeting of the Heat Alert and Response Systems (HARS) Advisory Committee (November), with membership including representatives from: public health, emergency management, research/academia, workplace health and safety, social service agencies, and local government. The committee reviewed draft versions of a number of key documents, and provided strategic direction into the development of a dissemination strategy for these products.
- HC hosted 3 webinars on a range of heat-related topics: Developing Heat Resilient Communities and Individuals in Canada; Assessing Community Vulnerability to Heat; and, Heat-Health Communications. Participation averaged 60+ logons per webinar (with the understanding that more than one individual would view the webinar per logon). The webinars have proven to be an effective tool for promoting awareness building on heat and human health issues with public health, emergency management and other related public sector agencies and actors.
| Total Funding Approved Under the CAA | Program's Planned Spending in 2009-2010 | Program’s Actual Spending in 2009-2010 |
|---|---|---|
| $ 7,900,000 | $ 2,150,000 | $ 2,626,510 |
Program: Climate and Infectious Disease Alert and Response System to Protect the Health of Canadians
| Department |
Public Health Agency of Canada |
|---|---|
| Departmental Program Activity |
1.2 Disease Prevention and Control |
2009-2010 Program's Expected Achievements
See the 2009-2010 Horizontal Report on Plans and Priorities at: http://www.tbs-sct.gc.ca/rpp/2009-2010/#Adapt_6b
2009-2010 Program's Achieved Results
Memoranda of agreement are in place with 4 pilot communities, which have now begun community-based projects to assess infectious disease risk relative to climate change and develop response plans. Information on infectious diseases and adaptation to climate change has been provided to these communities.
Contribution agreements and contracts are in place with 5 universities to increase knowledge and ability to predict areas and sub-populations at increased risk as a result of changes to the incidence, prevalence and spread of specified infectious diseases occurring as a result of a changing climate.
Pilot communities have been put in contact with universities to permit liaison amongst university and community projects.
Results:
- Capacity built within Public Health Agency of Canada (staff) to project environmental impacts and prevent/mitigate the occurrence of human illness and outbreaks.
- Development of some tools for public health use (including refined Lyme disease risk maps for public health).
| Total Funding Approved Under the CAA | Program's Planned Spending in 2009-2010 | Program’s Actual Spending in 2009-2010 |
|---|---|---|
| $ 7,000,000 | $ 2,237,895 | $ 2,039,109 |
Theme: Partnerships
| Lead Department |
Environment Canada |
|---|---|
| Federal Theme Partners |
|
2009-2010 Expected Achievements
Not applicable due to cancellation of program.
2009-2010 Achieved Results
In 2009-2010, the Clean Air Community Partnerships (CACP) program was cancelled. The department determined that similar results could be achieved more cost-effectively through existing programs, such as the EcoAction Community Funding program. In the first three years of the CACP, $1.38 million went towards the development of program materials and tools, salaries for program staff and investments to support clean air and climate change projects already under consideration by the department in 2007-2008.
| Theme's total funding approved under the CAA | Theme's Planned Spending in 2009-2010 | Theme's Actual Spending in 2009-2010 |
|---|---|---|
| $ 12,000,000 | $ 3,000,000 | $ 37,025 |
Program: Partnerships
| Department |
Environment Canada |
|---|---|
| Departmental Program Activity |
Program was not launched |
2009-2010 Program's Expected Achievements
Not applicable due to cancellation of program.
2009-2010 Program's Achieved Results
In 2009-10, the Clean Air Community Partnerships program was cancelled. The department determined that similar results could be achieved more cost-effectively through existing programs, such as the EcoAction Community Funding program. In the first three years of the CACP, $1.38 million went towards the development of program materials and tools, salaries for program staff and investments to support clean air and climate change projects already under consideration by the department in 2007-2008.
| Total Funding Approved Under the CAA | Program's Planned Spending in 2009-2010 | Program’s Actual Spending in 2009-2010 |
|---|---|---|
| $ 12,000,000 | $ 3,000,000 | $ 37,025 |
Theme: Management and Accountability
| Lead Department |
Environment Canada |
|---|---|
| Federal Theme Partners |
Natural Resources Canada, Transport Canada, Health Canada, Department of Foreign Affairs and International Trade, Indian and Northern Affairs Canada, Public Health Agency of Canada, National Research Council, Industry Canada |
Expected results from Theme's programming
Immediate Outcomes
- Clear roles, responsibilities and accountabilities for implementing, managing and reporting on Clean Air Agenda (CAA) activities.
- Appropriate balance of departmental and horizontal CAA accountabilities.
- Coherent CAA program architecture.
- Effective alignment of resources to CAA priorities.
- Effective and timely collection and reporting of performance information.
Intermediate Outcomes
- Active engagement of partner departments and agencies in horizontal aspects of CAA activities.
- Effective decision-making regarding CAA activities.
- Improved accountability of federal government to parliamentarians and Canadians for CAA expenditures and activities.
Final Outcomes
- Increased ability to achieve CAA outcomes.
2009-2010 Expected Achievements
See the 2009-2010 Horizontal Report on Plans and Priorities at: http://www.tbs-sct.gc.ca/rpp/2009-2010/MA_Theme
2009-2010 Achieved Results
Over the past year, Environment Canada continued leading the implementation of the horizontal management, accountability and reporting framework (HMARF) for the 45 programs and 8 Themes of the CAA, with its focus on meeting targeted short term results and ensuring accountability for progress toward longer term CAA outcomes. This included beginning the evaluations of CAA Themes to identify strengths and weaknesses in performance, management and accountability at the mid-point of the CAA and to inform planning for the next tranche of CAA programming.
While the initial implementation of the HMARF focused on building the institutional context in which federal partners could work collectively, the work of this past year concentrated on developing ways to improve the processes for supporting accountability to decision-makers in a timely manner. This included providing comprehensive reports to central agencies on management of CAA resources and performance, as well as to Theme Leads as required.
The governance of the CAA was engaged, as needed, at the appropriate levels to discuss progress towards CAA outcomes. This included enabling senior management (Deputy Ministers, Assistant Deputy Ministers, Chief Financial Officers and Director Generals) to meet and discuss Agenda and Theme management challenges. Senior management were also engaged to review and approve annual planning and performance reports, as well as to approve the feature article on the CAA in Canada’s Performance Report for the second year.
To support continuous improvement of reporting on performance, the first two years of performance reports were reviewed to identify opportunities for improvement. This resulted in a better organized, more cohesive and principled approach to the ongoing collection and analysis of performance information and reporting of progress made against commitments. As these performance reports are published through the estimates reporting cycle, continued transparency is being well supported, and decision-makers and Parliament have ready access to information on CAA investments, across the horizontal framework in a significant level of detail.
Over 2009, support for the CAA framework was reinforced by additional investments made in CAA programming* as part of the 2009 Budget Economic Action Plan, and as part of the investments made in international efforts towards the long term federal climate change agenda. (*The new programming for the Clean Energy Dialogue was added to the CAA.)
| Theme's total funding approved under the CAA | Theme's Planned Spending in 2009-2010 | Theme's Actual Spending in 2009-2010 |
|---|---|---|
| $5,000,000 | $1,250,000 | $1,305,264 |
Program: Management and Accountability
| Department |
Environment Canada |
|---|---|
| Departmental Program Activity |
3.2 Clean Air Program |
2009-2010 Program's Expected Achievements
See the 2009-2010 Horizontal Report on Plans and Priorities at: http://www.tbs-sct.gc.ca/rpp/2009-2010/MA_1
2009-2010 Program's Achieved Results
Maintained comprehensive accountability to parliamentarians and Canadians about results achieved by Clean Air Agenda (CAA) programming through public reporting on estimates (Horizontal Report on Plans and Priorities, Horizontal Performance Report and input to Canada’s Performance Report).
Supported continuous improvement of this reporting through a third party assessment of 2007-2009 CAA performance reports applying best practices for rating criteria for performance reports. The results were shared with the CAA Theme Leads to support their leadership in reporting on CAA investments and to inform ongoing discussions about performance expectations.
Improved the processes supporting the development of performance reports by streamlining the data intake process and introducing efficiencies in document management based on lessons learned over 2007-2009.
Developed analyses of financial and non-financial performance data to support senior management reviews, providing comprehensive views from departmental, theme and program perspectives on the performance of CAA programming.
Engaged CAA-Horizontal Management, Accountability and Reporting Framework governance committees (Deputy Ministers, Assistant Deputy Ministers and Chief Financial Officers, Director Generals) in the ongoing management of the CAA through the processes for approving reports on plans and on performance. Supported meetings of Assistant Deputy Ministers and Director Generals that enabled discussion of horizontal management issues and emerging challenges by providing comprehensive analyses of performance data.
Led the development of four Theme level evaluations, involving where required, program evaluations, the engagement of central agencies and independent experts. Also contributed to progress of audits.
| Total Funding Approved Under the CAA | Program's Planned Spending in 2009-2010 | Program’s Actual Spending in 2009-2010 |
|---|---|---|
| $5,000,000 | $1,250,000 | $1,305,264 |
Green Procurement
Meeting Policy Requirements
Green Procurement Targets
1. Has the Department incorporated environmental performance considerations in its procurement decision-making processes?
| In progress |
2. Summary of initiatives to incorporate environmental performance considerations in procurement decision-making processes:
Environmental considerations are being incorporated in the following departmental processes:
- Integrated Investment Planning process
- Real Property Framework
- Accommodations Investment Planning and Accommodations Framework
3. Results achieved:
A review of the proposed departmental capital investments was undertaken in the Integrated Investment Planning process to assess the potential environmental impacts of any future annual or multi-year purchases, whether for fleet, building construction and/or renovations, accommodations and/or other large projects.
An analysis of departmental spending is underway, which will help identify potential goods and services that are in line with the priorities of the federal greening government operations agenda and Federal Sustainable Development Strategy targets.
Green procurement training is mandatory for all procurement and contracting employees. The most appropriate mechanism for tracking the participation rate of employees continues to be explored.4. Contributions to facilitate government-wide implementation of green procurement:
As a supporting partner department for the Green Procurement Policy, Environment Canada continues to fulfill its role as outlined in the Memorandum of Understanding, along with Treasury Board of Canada Secretariat (TBS), Public Works and Government Services Canada (PWGSC), and Natural Resources Canada (NRCan).
Environment Canada provides expertise and advice on policy, environmental aspects and impacts as well as environmental standards and sustainability considerations.
Environment Canada continues to support PWGSC on policy implementation and other supporting activities such as the review and update of the Canada School of Public Service Green Procurement course for government employees as well as the evaluation of the effectiveness of the Green Procurement Policy in its fifth year.
5. Has the Department established green procurement targets?
| In progress |
6. Summary of green procurement targets:
N/A
7. Results achieved:
N/A
Response to Parliamentary Committees and External Audits
| Response to Parliamentary Committees |
|---|
| Not applicable |
| Response to the Auditor General (including to the Commissioner of the Environment and Sustainable Development) |
|---|
|
2009 Spring Report of the Commissioner of the Environment and Sustainable Development (CESD) Chapter 1: Protecting Fish Habitat Summary: The audit examined how Fisheries and Oceans Canada and Environment Canada carry out their respective responsibilities for fish habitat protection and pollution prevention under the Fisheries Act. It also looked at their arrangements with others, such as provinces and stakeholders that support the administration and enforcement of these provisions. The audit found that Fisheries and Oceans Canada and Environment Canada cannot demonstrate that fish habitat is being adequately protected, as the Fisheries Act requires. The audit found that Environment Canada has not clearly identified what it has to do to fulfill its responsibility for the Fisheries Act provisions and that it does not have a systematic approach to addressing risks of non-compliance with the Act. Department Response: The audit made five recommendations either to, or that included Environment Canada. The Department has accepted all the recommendations and action to address them has already been completed or is under way. For more information on this audit, go to www.oag-bvg.gc.ca/internet/English/parl_cesd_200905_01_e_32511.html Chapter 2: Kyoto Protocol Implementation Act Summary: The audit examined whether the Department can demonstrate that its annual climate change plans meet the requirements set out in the Kyoto Protocol Implementation Act (KPIA). The audit found that the 2007 and 2008 climate change plans do not include all of the information required under the KPIA; the government could not demonstrate that reductions in emissions expected under the Regulatory Framework for Industrial Greenhouse Gas Emissions are based on an adequate rationale and the climate change plans overstate the emission reductions that can reasonably be expected from the Framework during the Kyoto period (2008–2012); the plans are not fully transparent as they do not disclose how expected reductions might be affected by such uncertain factors as future economic conditions; and while the Department has a system in place to report on Canada’s total greenhouse gas emissions, it has no system for reporting the actual emission reductions achieved from each measure in the annual climate change plans Department Response: With the exception of the recommendation on the Regulatory Framework for Industrial Greenhouse GasEmissions, which is no longer applicable as the Framework is no longer a part of the climate change plan, the issues raised in the recommendations have been addressed in the report entitle A Climate Change Plan for the Purposes of the Kyoto Protocol Implementation Act (2010). For more information on this audit, go to www.oag-bvg.gc.ca/internet/English/parl_cesd_200905_02_e_32512.html#hd5c 2009 Fall Report of the CESD Chapter 1: Applying the Canadian Environmental Assessment Act (CEAA) Summary: The audit examined whether 12 federal entities, including Environment Canada, are applying key provisions of the CEAA and regulations with due regard to the purposes of the Act. The audit made specific observations concerning the Canadian Environmental Assessment Agency but generalized its findings relative to the other federal entities examined. The audit found, in the case of screenings, that documentation supporting the determination of environmental effects is often weak, relying on checklists or generic statements, and providing limited or no analysis to demonstrate how effects were rated; and monitoring of mitigation measures and follow-up are insufficient. The audit also found that where there is more than one responsible authority, disputes about scope have caused serious delays, the Agency has not fully established a quality assurance program, and project files are maintained for most environmental assessments. Department Response: The audit directed all recommendations to the Agency, to ensure that corrective actions would be directed to the whole federal community. Chapter 2: Managing the Risks of Toxic Substances Summary: The objective of this audit was to determine whether Environment Canada and Health Canada have put in place an adequate risk management regime for seven selected toxic substances—lead, mercury, bis(2-ethylhexyl) phthalate or DEHP, chlorobiphenyls or PCBs, dioxins and furans, dichloromethane, and polybrominated diphenyl ethers or PBDEs. The audit found that although Environment Canada and Health Canada have implemented a number of control measures to manage the risks posed by lead and mercury, there are no consolidated risk management strategies for managing the overall risks of these substances and the two departments lacked a systematic process for periodically assessing overall progress made in managing the substances examined. The audit also noted that new biomonitoring initiatives are under way that address a significant gap identified by the CESD 2002 audit on toxic substances. Findings specific to Health Canada’s responsibilities for consumer product labelling were also made. Department Response: The audit made three recommendations that include Environment Canada. The Department has accepted all the recommendations and action to address them is under way. For more information on this audit, go to http://www.oag-bvg.gc.ca/internet/English/parl_cesd_200911_e_33253.html Chapter 3: National Pollutant Release Inventory (NPRI) Summary: The focus of the audit was to determine whether Environment Canada has adequate quality assurance systems and practices in place for the NPRI, so that the Department is assured that the data in the NPRI is fit for the intended uses of its clients. The audit found that while Environment Canada has carried out some activities to ensure that the data in the NPRI are relevant to the information’s intended purposes and users, it does not have a consistent approach to determining the information needs of users; and while it is working to improve data quality and make NPRI data accessible to users in a variety of ways on a timely basis, it does not have adequate systems and practices overall to ensure that NPRI data are fit for their intended uses. Department Response: The audit made five recommendations to Environment Canada. The Department has accepted all the recommendations and actions to address the identified issues are already part of either current or planned initiatives to improve the NPRI. For more information on this audit, go to http://www.oag-bvg.gc.ca/internet/English/parl_cesd_200911_e_33253.html Chapter 4: Environmental Petitions Summary: This chapter informs Parliament and Canadians about the use of the petitions process and describes the number, nature and status of petitions received, and the timeliness of responses from ministers. Of the 28 petitions submitted in 2008–2009, 23 were addressed to Environment Canada. The Department’s responses were late in eight cases. This is an annual statutory report and contains no audit work or formal recommendations. For more information on this audit, go to http://www.oag-bvg.gc.ca/internet/English/parl_cesd_200911_e_33253.html 2009 Fall Report of the Office of the Auditor General (OAG) Chapter 1: Evaluating the Effectiveness of Programs Summary: The objective of this audit was to determine whether selected departments and the Treasury Board of Canada Secretariat (TBS) are meeting the needs for effectiveness evaluation and are identifying and making improvements in effectiveness evaluation. The audit found that while the six selected departments followed systematic processes to plan their evaluations and completed most of them, each department’s evaluations covered a low proportion of its total program expenses; many of the effectiveness evaluations reviewed did not adequately assess program effectiveness, often in part because needed performance information was unavailable or not sufficiently reliable; and departments have not been able to hire enough qualified evaluation staff (due to a general shortage of experienced evaluators) and made extensive use of contractors to meet requirements. The audit also noted that that Environment Canada was the only department audited that has formal continuous improvement practices in place. Department Response: The audit made two recommendations that included Environment Canada. The Department has accepted the recommendations and action to address them has already been completed or is under way. For more information on this audit, go to http://www.oag-bvg.gc.ca/internet/English/parl_oag_200911_e_33252.html Chapter 6: Land Management and Environmental Protection on Reserves Summary: This audit focused on whether Indian and Northern Affairs Canada and Environment Canada have met their responsibilities for land management on reserves, specifically with respect to transferring control of land management and providing essential environmental protection on reserve lands. The audit found that while the federal government has the authority to regulate environmental threats on reserves, it has rarely used this authority to develop regulations to mitigate environmental threats that are regulated off reserves by provincial governments. Findings were also made that were specific to INAC’s responsibilities for monitoring and enforcing existing regulations, as well as for devolution. Department Response: Two of the five recommendations contained in the audit included Environment Canada. The Department agreed with the recommendations, and action to address them is under way. For more information on this audit, go to http://www.oag-bvg.gc.ca/internet/English/parl_oag_200911_e_33252.html |
| External Audits (Note: These refer to other external audits conducted by the Public Service Commission of Canada or the Office of the Commissioner of Official Languages) |
|---|
|
Audit of the Federal Student Work Experience Program (FSWEP) and subsequent appointments through bridging mechanisms Summary: The objective of the audit was to determine whether 11 selected federal organizations including Environment Canada complied with the legislative and policy framework when they hired students for the first time through the FSWEP and when they used bridging mechanisms to appoint graduates who were formerly hired as participants in this program. The audit also examined whether the organizations had an appropriate framework in place to plan and monitor bridging appointments. The audit found that overall, FSWEP is operating reasonably well as a staffing tool but identified areas for improvement. The findings, which do not identify individual departments, indicated that of the FSWEP appointments analyzed, 43 percent were satisfactory, 51 percent needed improvement and 6 percent were unsatisfactory. The audit also analyzed bridging appointments and noted that 38 percent were satisfactory, 24 percent needed improvement and 38 percent were unsatisfactory. The audit also noted that for the period under review, bridging appointment files were poorly documented, audited organizations had not integrated bridging appointments into their human resources plans and few of them monitored selection and appointment decisions to ensure that they respected the legislative framework and appointment values. Department Response: The audit made four recommendations to audited departments and agencies and one recommendation to TBS. EC agreed with the recommendations and action to address them is under way. For more information on this audit, go to http://www.psc-cfp.gc.ca/adt-vrf/rprt/2009/fswep-pfete/index-eng.htm |
Internal Audits and Evaluations
Internal Audits (current reporting period)
| 1. Name of Internal Audit | 2. Audit Type | 3. Status | 4. Completion Date |
|---|---|---|---|
| Accounts Receivable | Assurance | Completed | June 2009 |
| Occupational Health and Safety | Assurance | Completed | September 2009 |
| Efficiency of the Contracting Process | Assurance | Completed | September 2009 |
| Costing and Pricing Processes for Revenue | Assurance | Completed | January 2010 |
| Specified Purpose Accounts | Assurance | Completed | March 2010 |
| Hydrometric Monitoring Stations: Federal-Provincial Agreements | Assurance | Completed | March 2010 |
| Review of Employee Separation Clearance Process | Review | Completed | March 2010 |
| Governance of Information Management | Assurance | In progress | September 2010 |
| Information Technology (IT) Asset Management Audit: Office of Comptroller General (OCG) Horizontal Audit | Assurance | In progress | June 2010 |
| Governance of Specialized Information Technology (IT) Resources | Assurance | In progress | June 2010 |
| Physical Security | Assurance | In progress | June 2010 |
| Management of Additional Funding Received through Canada’s Economic Action Plan – Part I | Assurance | In progress | June 2010 |
| Professional Contracts | Assurance | In progress | June 2010 |
| Life-cycle Management (LCM) of Assets | Assurance | In progress | July 2011 |
Approved internal audit reports are available on Environment Canada’s website: www.ec.gc.ca/ae-ve/
Evaluations (current reporting period)
| 1. Name of Evaluation | 2. Program Activity | 3. Evaluation Type | 4. Status | 5. Completion Date |
|---|---|---|---|---|
| EcoAction Funding | Ecosystems Initiatives Program | Transfer Payment | Completed | May 2009 |
| Environmental Damages Fund | Ecosystems Initiatives Program | Transfer Payment | Completed | July 2009 |
| Grants to support Environmental Research Program | Internal Services | Transfer Payment | Completed | July 2009 |
| Contributions to support Environmental Research and Development | Ibid. | Transfer Payment | Completed | July 2009 |
| Contributions to support Environmental and Sustainable Development Initiatives | Ibid. | Transfer Payment | Completed | July 2009 |
| Contributions to support Canada's International Commitments | Internal Services | Transfer Payments | Completed | July 2009 |
| National Agri-Environmental Standards Initiatives | Ecosystems Initiatives Program | Direct Program Spending | Completed | July 2009 |
| Clean Air Regulatory Agenda Evaluation Plan | Clean Air Program | Evaluation Plan | Completed | October 2009 |
| Weather Predictions Evaluation Plan | Weather and Environmental Prediction Program | Evaluation Plan | Completed | October 2009 |
| Habitat Stewardship Contribution Program | Biodiversity and Wildlife Program | Transfer Payment | Completed | October 2009 |
| Invasive Alien Species Strategy | Biodiversity and Wildlife Program | Transfer Payment | Completed | October 2009 |
| Enforcement Program | Biodiversity and Wildlife Program Chemicals Management Program |
Direct Program Spending | Completed | October 2009 |
| Chemicals Management Plan: Performance Measurement and Evaluation Plan | Chemicals Management Program | Evaluation Plan | Completed | October 2009 |
| Strategic Environmental Assessment | Biodiversity and Wildlife Program Chemicals Management Program |
Direct Program Spending | Completed | October 2009 |
| Evaluation of the National Air Quality Health Index | Weather and Environmental Prediction Prgram | Direct Program Spending | Completed | February 2010 |
| Federal Species at Risk Evaluation Plan | Biodiversity and Wildlife Program | Evaluation Plan | Completed | February 2010 |
| Renewable Fuels Evaluation Plan | Clean Air Program | Evaluation Plan | Completed | April 2010 |
| Great Lakes Action Plan | Ecosystems Initiatives Program | Direct Program Spending | Completed | June 2010 |
| Freshwater Initiatives Evaluation Plan | Water Program | Evaluation Plan | Completed | June 2010 |
| Water Management Evaluation Plan | Water Programs | Evaluation Plan | In progress | July 2010 |
| Great Lakes Action Plan | Ecosystems Initiatives Program | Direct Program Spending | In progress | July 2010 |
| Freshwater Initiatives Evaluation Plan | Water Program | Direct Program Spending | In progress | July 2010 |
| Clean Air Agenda Theme | Clean Air Program | Direct Program Spending | In progress | July 2010 |
| Improved Climate Change Scenarios | Clean Air Program | Direct Program Spending | In progress | July 2010 |
| Clean Air Agenda Adaptation Theme | Clean Air Program | Direct Program Spending | In progress | October 2010 |
| Building Public Confidence in Pesticide Regulation and Improving Access to Pest Management Products | Legislation and Information Program | Direct Program Spending | In progress | October 2010 |
| Wildlife Habitat Canada Conservation Stamp Program | Biodiversity and Wildlife Program | Transfer Payment | In progress | October 2010 |
| Research and Development, Production and Monitoring in Support of Weather Predictions | Weather and Environmental Prediction Program | Direct Program Spending | In progress | October 2010 |
| Genomics Research and Design Initiatives (Interdepartmental; led by Natural Resources Canada) | Clean Air Program | Direct Program Spending | Planned | March 2011 |
| Meteorological Program for the 2010 Winter Games (interdepartmental led by Canadian Heritage) | Weather and Environmental Prediction Program | Direct Program Spending | Planned | March 2011 |
| Chemicals Management Plan Evaluation (Interdepartmental with Health Canada) | Chemicals Management Program | Direct Program Spending | Planned | March 2011 |
Approved evaluation reports are available on Environment Canada’s website: www.ec.gc.ca/ae-ve/