
Treasury Board of Canada Secretariat
www.tbs-sct.gc.ca
Common menu bar links
Breadcrumb Trail
ARCHIVED - Military Police Complaints Commission - Report
 This page has been archived.
Archived Content
Information identified as archived on the Web is for reference, research or recordkeeping purposes. It has not been altered or updated after the date of archiving. Web pages that are archived on the Web are not subject to the Government of Canada Web Standards. As per the Communications Policy of the Government of Canada, you can request alternate formats on the "Contact Us" page.
Section III: Supplementary Information
3.1 Financial Highlights
The financial highlights presented within this DPR are intended to serve as a general overview of the Commission’s financial position and operations. The Commission financial statements can be found on its website at: http://www.mpcc-cppm.gc.ca/300/300-eng.aspx
In examining the financial position and operations of the Commission, the most notable change over the previous year is the increase in financial activity due to the additional funding received for the public interest hearing. Traditionally, the Commission is authorized to spend approximately $3.4 million, spends approximately $2.9 million and returns approximately $500 thousand to the Consolidated Revenue Fund.
In 2009-10, the Commission was authorized to spend $6.99 million, spent $4.68 million and returned $2.31 million to the Consolidated Revenue Fund. The increases are due almost entirely to the public interest hearing. The supplementary funding received for the public interest hearing was $3.22 million of which $1.4 million was expended.
The tables below illustrate the increases over the previous year.
For the Period ending March 31, 2010.
Condensed Statement of Financial Position
| ($ thousands) | Percentage variance | 2010 | 2009 | |
|---|---|---|---|---|
| Assets | Total Assets | 38% | 248 | 180 |
| Liabilities | Total Liabilities | 28% | 1,052 | 824 |
| Equity | Total Equity | (25)% | (804) | (644) |
| Total | 38% | 248 | 180 | |
For the period ending March 31, 2010.
Condensed Statement of Financial Operations
| ($ thousands) | Percentage variance | 2010 | 2009 | |
|---|---|---|---|---|
| Expenses | Total Expenses | 15% | 4,676 | 4,072 |
| Revenues | Total Revenues | - | - | - |
| Net Costs Of Operations | 15% | 4,676 | 4,072 |
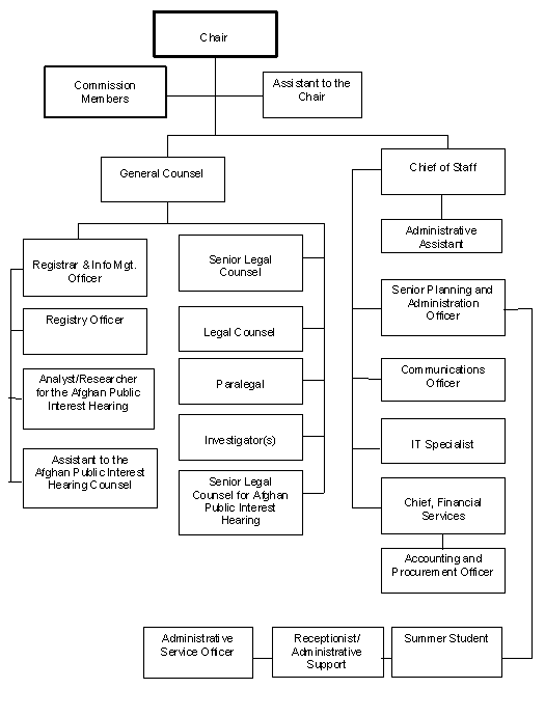
3.2 Organizational Information
The following organizational chart represents the Commission in relation to the restructuring of its program activities.
How to reach the Commission
- Call our information line:
(613) 947-5625 or toll free at 1-800-632-0566
- Send us a fax:
(613) 947-5713 or toll free at 1-877-947-5713
- Send us a letter:
Military Police Complaints Commission
270 Albert Street, 10th Floor
Ottawa, ON K1P 5G8
- Visit us at the above address for a private consultation – appointments are recommended
- E-mail us:
commission@mpcc-cppm.gc.ca
- Visit our website:
www.mpcc-cppm.gc.ca
- Media inquiries:
613) 947-5668 or e-mail media@mpcc-cppm.gc.ca