
Treasury Board of Canada Secretariat
www.tbs-sct.gc.ca
Common menu bar links
Breadcrumb Trail
ARCHIVED - 2007-2008 DPRs - Sources of Respendable and Non-Respendable Revenue
 This page has been archived.
Archived Content
Information identified as archived on the Web is for reference, research or recordkeeping purposes. It has not been altered or updated after the date of archiving. Web pages that are archived on the Web are not subject to the Government of Canada Web Standards. As per the Communications Policy of the Government of Canada, you can request alternate formats on the "Contact Us" page.
- Agriculture and Agri-Food Canada
- Atlantic Canada Opportunities Agency
- Canada Border Services Agency
- Canada Revenue Agency
- Canada School of Public Service
- Canadian Centre for Occupational Health and Safety
- Canadian Environmental Assessment Agency
- Canadian Food Inspection Agency
- Canadian Grain Commission
- Canadian Heritage
- Canadian Institutes of Health Research
- Canadian Intergovernmental Conference Secretariat
- Canadian International Development Agency
- Canadian Nuclear Safety Commission
- Canadian Radio-television and Telecommunications Commission
- Canadian Space Agency
- Canadian Transportation Agency
- Citizenship and Immigration Canada
- Correctional Service Canada
- Courts Administration Service
- Department of Finance Canada
- Department of Foreign Affairs and International Trade
- Department of Justice Canada
- Economic Development Agency of Canada for the Regions of Quebec
- Environment Canada
- Fisheries and Oceans Canada
- Hazardous Materials Information Review Commission
- Health Canada
- Human Resources and Social Development Canada
- Indian and Northern Affairs Canada and Canadian Polar Commission
- Industry Canada
- Library and Archives Canada
- National Defence
- National Energy Board
- National Film Board
- National Parole Board
- National Research Council Canada
- National Round Table on the Environment and the Economy
- Natural Resources Canada
- Natural Sciences and Engineering Research Council of Canada
- Northern Pipeline Agency
- Office of the Commissioner for Federal Judicial Affairs
- Office of the Registrar of Lobbyists
- Office of the Superintendent of Financial Institutions Canada
- Parks Canada
- Patented Medicine Prices Review Board
- Privy Council Office
- Public Health Agency of Canada
- Public Prosecution Service of Canada
- Public Service Commission of Canada
- Public Works and Government Services Canada
- Royal Canadian Mounted Police
- Social Sciences and Humanities Research Council
- Statistics Canada
- Supreme Court of Canada
- The National Battlefields Commission
- Transport Canada
- Treasury Board of Canada Secretariat
- Veterans Affairs Canada
- Western Economic Diversification Canada
Agriculture and Agri-Food Canada
Table 3: Sources of Respendable and Non-Respendable Revenue
| Respendable Revenue | ||||||
|---|---|---|---|---|---|---|
| ($ millions) | 2005-2006 | 2006-2007 | 2007-2008 | |||
| Actual Revenue | Actual Revenue | Main Estimates | Planned Revenue | Authorities | Actual Revenue | |
| Business Risk Management | ||||||
| Collaborative research agreements and research services | - | 0.0 | - | - | - | - |
| Canadian Agricultural Income Stabilization (CAIS) - Admin. Fees | 4.7 | 4.4 | 5.5 | 5.5 | 5.5 | 3.8 |
| Total – Business Risk Management | 4.7 | 4.4 | 5.5 | 5.5 | 5.5 | 3.8 |
| Food Safety and Food Quality | ||||||
| Collaborative research agreements and research services | 0.0 | 1.0 | 1.5 | 1.5 | 1.5 | 0.1 |
| Total – Food Safety and Food Quality | 0.0 | 1.0 | 1.5 | 1.5 | 1.5 | 0.1 |
| Markets and International | ||||||
| Collaborative research agreements and research services | - | 0.0 | - | - | - | - |
| Total – Markets and International | - | 0.0 | - | - | - | - |
| Environment | ||||||
| Collaborative research agreements and research services | - | 0.7 | 5.5 | 5.5 | 5.5 | 0.1 |
| Community Pastures | 12.9 | 17.0 | 18.0 | 18.0 | 18.0 | 18.0 |
| Total – Environment | 12.9 | 17.7 | 23.5 | 23.5 | 23.5 | 18.1 |
| Innovation and Renewal | ||||||
| Collaborative research agreements and research services | 2.6 | 5.1 | 15.0 | 15.0 | 15.0 | 9.8 |
| Total – Innovation and Renewal | 2.6 | 5.1 | 15.0 | 15.0 | 15.0 | 9.8 |
| Canadian Pari-Mutuel Agency | ||||||
| Canadian Pari-Mutuel Agency Revolving Fund | 13.8 | 14.0 | 15.0 | 15.0 | 15.0 | 13.9 |
| Total – Canadian Pari-Mutuel Agency | 13.8 | 14.0 | 15.0 | 15.0 | 15.0 | 13.9 |
| Total Respendable Revenue | 34.1 | 42.1 | 60.5 | 60.5 | 60.5 | 45.7 |
| Non-Respendable Revenue | ||||||
|---|---|---|---|---|---|---|
| ($ millions) | 2005-2006 | 2006-2007 | 2007-2008 | |||
| Actual Revenue | Actual Revenue | Main Estimates | Planned Revenue | Authorities | Actual Revenue | |
| Business Risk Management | ||||||
| Refund of Previous Years' Expenditures | 3.7 | 0.9 | N/A | 1.3 | N/A | 0.4 |
| Service and Service Fees | 1.0 | 0.9 | N/A | 0.8 | N/A | 0.9 |
| Privileges, Licences and Permits | 0.4 | 0.5 | N/A | 0.4 | N/A | 0.3 |
| Return on Investments | 1.4 | 1.5 | N/A | 0.4 | N/A | 1.0 |
| Proceeds from Sales of Crown Assets | 0.6 | 0.3 | N/A | 0.0 | N/A | 0.5 |
| Other non-tax revenues | 29.1 | 47.9 | N/A | 1.9 | N/A | 14.3 |
| Total Business Risk Management | 36.2 | 52.0 | N/A | 4.9 | N/A | 17.4 |
| Food Safety and Food Quality | ||||||
| Refund of Previous Years' Expenditures | 0.1 | 0.0 | N/A | 0.3 | N/A | 0.0 |
| Service and Service Fees | 0.3 | 0.0 | N/A | 0.3 | N/A | 0.0 |
| Privileges, Licences and Permits | 0.3 | 0.3 | N/A | 0.4 | N/A | 0.4 |
| Return on Investments | 0.5 | 0.6 | N/A | 0.2 | N/A | 0.5 |
| Proceeds from Sales of Crown Assets | 0.2 | 0.1 | N/A | 0.1 | N/A | 0.2 |
| Other non-tax revenues | 0.0 | 0.7 | N/A | 0.3 | N/A | 0.7 |
| Total Food Safety and Food Quality | 1.3 | 1.7 | N/A | 1.6 | N/A | 1.9 |
| Markets and International | ||||||
| Refund of Previous Years' Expenditures | 0.3 | 0.0 | N/A | 0.5 | N/A | 0.4 |
| Service and Service Fees | 0.0 | 0.0 | N/A | 0.0 | N/A | 0.0 |
| Privileges, Licences and Permits | 0.2 | 0.2 | N/A | 0.2 | N/A | 0.2 |
| Return on Investments | 0.8 | 1.1 | N/A | 0.5 | N/A | 1.0 |
| Proceeds from Sales of Crown Assets | 0.0 | 0.0 | N/A | 0.0 | N/A | 0.4 |
| Other non-tax revenues | 0.0 | 0.9 | N/A | 0.5 | N/A | 2.9 |
| Total Markets and International | 1.4 | 2.3 | N/A | 1.7 | N/A | 4.5 |
| Environment | ||||||
| Refund of Previous Years' Expenditures | 0.3 | 0.2 | N/A | 1.4 | N/A | 0.3 |
| Service and Service Fees | (0.0) | 0.0 | N/A | 0.0 | N/A | 0.0 |
| Privileges, Licences and Permits | 0.5 | 0.9 | N/A | 0.9 | N/A | 0.8 |
| Return on Investments | 2.0 | 3.0 | N/A | 1.2 | N/A | 2.6 |
| Proceeds from Sales of Crown Assets | 0.6 | 0.5 | N/A | 0.6 | N/A | 0.6 |
| Other non-tax revenues | 0.1 | 2.2 | N/A | 1.3 | N/A | 3.2 |
| Total Environment | 3.4 | 6.9 | N/A | 5.3 | N/A | 7.7 |
| Innovation and Renewal | ||||||
| Refund of Previous Years' Expenditures | 0.4 | 0.1 | N/A | 1.2 | N/A | 0.4 |
| Service and Service Fees | 0.0 | 0.0 | N/A | 0.0 | N/A | 0.0 |
| Privileges, Licences and Permits | 0.6 | 5.1 | N/A | 4.6 | N/A | 4.5 |
| Return on Investments | 2.3 | 2.6 | N/A | 1.1 | N/A | 2.3 |
| Proceeds from Sales of Crown Assets | 6.1 | 1.8 | N/A | 1.7 | N/A | 2.0 |
| Other non-tax revenues | 0.1 | 2.0 | N/A | 1.1 | N/A | 2.9 |
| Total Innovation and Renewal | 9.4 | 11.7 | N/A | 9.8 | N/A | 12.1 |
| Rural and Co-operatives Secretariats | ||||||
| Refund of Previous Years' Expenditures | 0.0 | 0.0 | N/A | 0.1 | N/A | 0.0 |
| Service and Service Fees | 0.0 | - | N/A | 0.0 | N/A | 0.0 |
| Privileges, Licences and Permits | - | - | N/A | 0.0 | N/A | 0.0 |
| Return on Investments | - | - | N/A | 0.1 | N/A | 0.2 |
| Proceeds from Sales of Crown Assets | - | - | N/A | 0.0 | N/A | 0.0 |
| Other non-tax revenues | 0.0 | 0.1 | N/A | 0.1 | N/A | 0.3 |
| Total Rural and Co-operatives Secretariats | 0.0 | 0.1 | N/A | 0.3 | N/A | 0.6 |
| National Farm Products Council | ||||||
| Refund of Previous Years' Expenditures | - | 0.0 | N/A | 0.0 | N/A | 0.0 |
| Service and Service Fees | - | - | N/A | 0.0 | N/A | 0.0 |
| Privileges, Licences and Permits | - | - | N/A | 0.0 | N/A | 0.0 |
| Return on Investments | - | - | N/A | 0.0 | N/A | 0.0 |
| Proceeds from Sales of Crown Assets | - | - | N/A | 0.0 | N/A | 0.0 |
| Other non-tax revenues | - | - | N/A | 0.0 | N/A | 0.0 |
| Total National Farm Products Council | - | 0.0 | N/A | 0.1 | N/A | 0.1 |
| Total Non-Respendable Revenue | 51.7 | 74.7 | N/A | 23.7 | N/A | 44.3 |
| Total Respendable and Non-Respendable Revenue | 85.7 | 116.8 | 60.5 | 84.2 | 60.5 | 89.9 |
Notes:
Respendable revenues are generated by the Community Pastures Program, collaborative research agreements and research services, administration fees related to the Canadian Agricultural Income Stabilization (CAIS) program, and the Canadian Pari-Mutuel Agency Revolving Fund. In accordance with Treasury Board policy, the Department can generate and spend up to 125 percent
of its vote-netted revenue authority. Respendable revenues have increased mainly due to revenue collected under the collaborative research agreements and research services.
Non-respendable revenues include such items as refunds of previous years' expenditures, proceeds from the sales of Crown Assets, privileges, licenses and permits. Non-respendable revenues are lower this year mainly due to the fact that adjustments to prior year's payables were less in 2007-08 than in 2006-07.
The figures in the above tables have been rounded to the nearest millions of dollars. For this reason, figures that cannot be listed in millions of dollars are shown as 0.0.
Due to rounding, figures may not add to the totals shown.

Atlantic Canada Opportunities Agency
Table: Sources of Non-Respendable Revenue
|
|
2005-2006 |
2006-2007 |
2007-2008 ($ millions) |
|||
|---|---|---|---|---|---|---|
|
Main |
Planned |
Total |
Actual |
|||
|
Fostering the development of institutions and enterprises, with emphasis on those of small and medium size |
||||||
|
- Repayable Contributions |
59.5 |
57.3 |
55.0 |
55.0 |
56.2 |
56.2 |
|
- All Other(1) |
7.8 |
8.2 |
2.0 |
2.0 |
5.3 |
5.3 |
|
Total |
67.3 |
65.5 |
57.0 |
57.0 |
61.5 |
61.5 |
(1) All Other revenue includes refunds of prior years’ expenditures, return on investment from direct loans, services fees, proceeds from the disposal of Crown assets, interest revenues and other miscellaneous revenues.
Canada Border Services Agency
Sources of Respendable and Non-respendable Revenue
Table 3.5: Sources of the Canada Border Services Agency's (CBSA) Respendable Revenue
| (Thousands of dollars) | ||||||
| Program Activity | 2005–2006 Actual | 2006–2007 Actual | 2007–2008 | |||
|---|---|---|---|---|---|---|
| Main Estimates | Planned Revenue | Total Authorities | Actual | |||
| Access | ||||||
| Rights and privileges | 1,440 | 1,867 | 814 | 814 | 1,520 | 1,520 |
| Services of a regulatory nature | 2,604 | 4,516 | 4,238 | 4,238 | 5,524 | 5,524 |
| Services of a non-regulatory nature | 10,894 | 14,125 | 12,355 | 12,355 | 13,070 | 13,070 |
| Total Access | 14,938 | 20,508 | 17,407 | 17,407 | 20,114 | 20,114 |
| Science- and Technology-based Innovation | ||||||
| Rights and privileges [1] | 389 | 390 | 303 | 303 | 620 | 620 |
| Total Science- and Technology-based Innovation | 389 | 390 | 303 | 303 | 620 | 620 |
| Total Respendable Revenue | 15,327 | 20,898 | 17,710 | 17,710 | 20,734 | 20,734 |
[1] The actual amounts for 2005–2006 and 2006–2007 were classified as non-respendable.
The major items accounting for the $3 million increase between the planned revenue and the actual are the following:
- NEXUS program: $1.7 million
- Contractual agreements and non-core services: $1.1 million
Table 3.6: Sources of the CBSA’s Non-respendable Revenue
| (Thousands of dollars) | ||||||
| Program Activity | 2005–2006 Actual | 2006–2007 Actual | 2007–2008 | |||
|---|---|---|---|---|---|---|
| Main Estimates | Planned Revenue | Total Authorities | Actual | |||
| Access | ||||||
| Sale of goods and services | ||||||
| Public building and property rental | 363 | 296 | 297 | 337 | ||
| Total Access | 363 | 296 | 297 | 337 | ||
| Security | ||||||
| Adjustments to previous year’s expenditures | 4,689 | 4,200 | 1,745 | 2,605 | ||
| Sale of goods and services | ||||||
| Services of a regulatory nature | 2,783 | 1,926 | 2,177 | 1,863 | ||
| Services of a non-regulatory nature | 898 | |||||
| Sale of goods and services – total | 3,681 | 1,926 | 2,177 | 1,863 | ||
| Miscellaneous | ||||||
| Goods and services tax/ harmonized sales tax, customs import duties, excise and the Air Travellers Security Charge | 3,251 | 2,824 | 2,845 | 2,899 | ||
| Sundries | ||||||
| Court fines | 1,717 | 1,037 | 709 | 1,212 | ||
| Seizures | 8,780 | 15,727 | 22,682 | 21,735 | ||
| Interest and penalties | 16,282 | 26,785 | 9,773 | 30,154 | ||
| Other | 5,230 | 1,859 | 1,991 | 1,822 | ||
| Miscellaneous – total | 35,260 | 48,232 | 38,000 | 57,822 | ||
| Total Security | 43,630 | 54,358 | 41,922 | 62,290 | ||
| Total Non-respendable Revenue | 43,993 | 54,654 | 42,219 | 62,627 | ||
Canada Revenue Agency
Table 4 Sources of Respendable and Non-Respendable Non-Tax Revenue
By virtue of its mandate, the Canada Revenue Agency (CRA) is responsible for collecting tax revenue; these are described earlier in the Audited Financial Statements – Administered Activities. The CRA is also responsible for collecting non-tax revenue, similar to other government departments and agencies; these are detailed below, divided between respendable and non-respendable.
Table 4.1 Respendable Non-Tax Revenue
|
Ruling Fees[Footnote 1]
|
|||||||
|
Administration of Provincial Programs[Footnote 2]
|
|||||||
|
Services to Other Government Departments (OGD)[Footnote 3]
|
|||||||
|
Less: Amounts Recovered on behalf of OGDs[Footnote 4]
|
|||||||
|
Revenues credited to Vote 1[Footnote 5]
|
|||||||
|
Canada Pension Plan (CPP) administration work[Footnote 6]
|
|||||||
|
Employment Insurance (EI) administration work[Footnote 6]
|
|||||||
Table 4.2 Non-Respendable Non-Tax Revenue[Footnote 1]
Canada School of Public Service
Table 3: Sources of Respendable and Non-respendable Revenue
Respendable Revenues:
Planned Revenues are those forecasted to be collected at the time of the publication of the 2007-2008 Report on Plans and Priorities.
Total Authorities are the revenues collected in 2007-2008 plus the carry forward of collected revenues in 2006-2007 pursuant to section 18(2) of the Canada School of Public Service Act.
The Actuals are the expenditures incurred in fiscal year 2007-2008 in order to bring in revenues. The $14.4 million variance between Total Authorities and the Actuals will be carried forward to year two (i.e. 2008-2009)
| 2007–2008 | ||||||
| ($ thousands) | Actual 2005-2006 | Actual 2006-2007 | Main Estimates | Planned Revenue | Total Authorities | Actual |
| Develop, manage, disseminate knowledge products1 | $3,093 | - | - | - | - | - |
| Manage the provision of learning services1 | $16,381 | - | - | - | - | - |
| Public servants able to perform in their current job, take on the challenges of the next job in a dynamic, bilingual environment | - | $19,123 | $10,233 | $10,233 | $53,983 | $41,319 |
| Public Service has strong leaders delivering results for Canadians | - | $5,261 | $4,731 | $4,731 | $7,785 | $7,435 |
| Public Service organizations innovate to achieve excellence in delivering results for Canadians | - | $2,366 | $5,036 | $5,036 | $5,187 | $3,789 |
| Total Respendable Revenue | $19,474 | $26,750 | $20,000 | $20,000 | $66,955 | $52,543 |
1Adjustments have been made to the program activity architecture for the Canada School of Public Serviced due to a change in focus of its mandate. As a result, the program activity Develop, Manage, Disseminate Knowledge Products and the program activity Manage the Provision of Learning Services have been replaced by three new program activities which better reflect the business model of the School.
Non-Respendable Revenues:
The Actuals reflected for 2005-2006 are based on the previous Canadian Centre for Management Development (CCMD) non-respendable revenue forecasts. The Actuals reflected for 2006-2007 are revenues collected which were not eligible to be respent by the Canada School of Public Service. These revenues had to be returned to the consolidated revenue fund (CRF) since they were collected after CSPS' cut off for carry forward eligibility.
The Total Authorities in 2007-2008 are also revenues collected which are not eligible to be respent by the CSPS. These revenues have to be returned to the CRF since they were collected after CSPS' cut off for carry forward eligibility.
| 2007–2008 | ||||||
| ($ millions) | Actual 2005-2006 | Actual 2006-2007 | Main Estimates | Planned Revenue | Total Authorities | Actual |
| Canada School of Public Service | $6,143 | $480 | N/A | N/A | $498 | N/A |
| Total Non-respendable Revenue | $6,143 | $480 | N/A | N/A | $498 | N/A |
Canadian Centre for Occupational Health and Safety
Table 5
| 2007-08 | |||||
| Business Line | Actual 2005-06 | Actual 2006-07 | Planned Revenue | Total Authorities | Actual |
| CCOHS | 3.8 | 3.9 | 4.3 | 4.3 | 3.9 |
| Total | 3.8 | 3.8 | 4.3 | 4.3 | 3.9 |
Respendable revenues represent monies generated from the sale of goods and services. CCOHS generates approximately 45% of its operating budget from its cost-recovery activities. Sales of goods and services are impacted by general market conditions, foreign exchange fluctuations, government budgets, changes in technology, and competition.
Canadian Environmental Assessment Agency
Table 3: Sources of Respendable and Non-Respendable Revenue
| Respendable Revenue | ||||||
|---|---|---|---|---|---|---|
| ($000s) | 2005-2006 Actual | 2006-2007 Actual | 2007-2008 | |||
| Main Estimates | Planned Revenue | Total Authorities | Total Actuals | |||
| Effective and Efficient Environmental Assessment | ||||||
| Cost recovery for environmental assessment services | 4,167.7 | 6,305.1 | 3,351.0 | 3,351.0 | 7,751.0 | 6,027.9 |
| Cost recovery for publications, training and education materials (federal) | 85.8 | 120.6 | 75.0 | 75.0 | 100.0 | 109.8 |
| Cost recovery for publications, training and education materials (external) | 153.3 | 166.7 | 75.0 | 75.0 | 150.0 | 147.9 |
| Total Respendable Revenue | 4,406.8 | 6,592.4 | 3,501.0 | 3,501.0 | 8,001.0 | 6,285.6 |
| Non-Respendable Revenue | ||||||
| ($000s) | 2005-2006 Actual | 2006-2007 Actual | 2007-2008 | |||
| Main Estimates | Planned Revenue | Total Authorities | Total Actuals | |||
| Effective and Efficient Environmental Assessment | 18.4 | 261.8 | — | — | 168.0 | 168.0 |
| Total Non-Respendable Revenue | 18.4 | 261.8 | — | — | 168.0 | 168.0 |
| Total Revenues | 4,425.2 | 6,854.2 | 3,501.0 | 3,501.0 | 8,169.0 | 6,453.6 |
The Agency has authority to recover costs for environmental assessment services, publications, training and education material. However, it should be noted that the use of this authority is dependent on the level of review panel activity that is eligible for cost recovery. As such, the level of revenue tends to fluctuate from year to year. The Agency has received additional authority in 2007-2008.
Canadian Food Inspection Agency
Canadian Grain Commission
Table 3: Sources of Respendable Revenue
| ($ thousands) | Actual 2005-06 | Actual 2006-07 | 2007-2008 | |||
|---|---|---|---|---|---|---|
| Main Estimates | Planned Revenue | Total Authorities | Actual | |||
| Deliver inspection and testing services | ||||||
| Inspection, registration, and cancellation | 26 023 | 28 838 | 28 153 | |||
| Other | 1 629 | 1 271 | 1 246 | |||
| Total | 27 652 | 30 109 | 31 135 | 31 135 | 31 135 | 29 399 |
| Deliver weighing services | ||||||
| Weighing, registration, and cancellation | 10 634 | 12 101 | 11 966 | |||
| Other | 42 | |||||
| Total | 10 676 | 12 101 | 9 270 | 9 270 | 9 270 | 11 966 |
| Conduct research to understand and measure grain quality | ||||||
| Other | - | - | - | - | - | - |
| Total | - | - | - | - | - | - |
| Protect producers' rights | ||||||
| Licences | 392 | 503 | 438 | |||
| Service fees | 17 | 1 | ||||
| Other | 33 | 2 | 2 | |||
| Total | 442 | 506 | 860 | 860 | 860 | 440 |
| Total Respendable Revenue | 38 770 | 42 716 | 41 265 | 41 265 | 41 265 | 41 805 |
This table identifies all sources of revenue generated, excluding appropriation. Respendable revenues represent funds generated through fees and contracts for services rendered by the CGC. These revenues are used to offset a portion of the costs of providing these services.
Canadian Heritage
Table 4: Sources of Respendable and Non-Respendable Revenue
| ($ millions) | Actual 2005–06 |
Actual 2006–07 |
2007–08 | |||
|---|---|---|---|---|---|---|
| Main Estimates |
Planned Revenue |
Total Authorities |
Actual |
|||
| Program Activity 2: Sustainability of Cultural Expression and Participation |
||||||
| Canadian Audio-Visual Certification Office (CAVCO) | 3.4 | 3.5 | 3.3 | 3.3 | 3.3 | 3.5 |
| Program Activity 3: Preservation of Canada's Heritage |
||||||
| Canadian Conservation Institute (CCI) | 0.5 | 0.3 | 0.9 | 0.9 | 0.9 | 0.4 |
| Program Activity 4: Access and Participation in Canada's Cultural Life |
||||||
| Canadian Conservation Institute (CCI) | 1.0 | 0.9 | 1.0 | 1.0 | 1.0 | 1.4 |
| Total Respendable Revenue | 4.9 | 4.7 | 5.2 | 5.2 | 5.2 | 5.3 |
| ($ millions) | Actual 2005–06 |
Actual 2006–07 |
2007–08 | |||
|---|---|---|---|---|---|---|
| Main Estimates |
Planned Revenue |
Total Authorities |
Actual |
|||
| Non-Respendable Revenue | ||||||
| Federal-Provincial Lottery Agreement | 62.1 | 62.8 | N/A | 62.1 | N/A | 62.8 |
| Total Non-Respendable Revenue | 62.1 | 62.8 | 0.0 | 62.1 | 0.0 | 62.8 |
| Total Revenue | 67.0 | 67.5 | 5.2 | 67.3 | 5.2 | 69.1 |
Canadian Institutes of Health Research
Table 8: Sources of Respendable and Non-Respendable Revenue
Non-Respendable Revenue
| ($ millions) | Actual 2005-2006 |
Actual 2006-2007 |
2007-2008 | |||
| Main Estimates |
Planned Revenue |
Total Authorities |
Actual | |||
| Fund health research | ||||||
| Refunds of Previous Years' Expenditures | 2.2 | 1.3 | N/A | 1.5 | N/A | 1.7 |
| Fund health researchers and trainees | ||||||
| Refunds of Previous Years' Expenditures | 1.1 | 0.6 | N/A | 0.8 | N/A | 0.8 |
| Fund research resources, collaboration and other grants to strengthen the health research community | ||||||
| Refunds of Previous Years' Expenditures | 0.3 | 0.2 | N/A | 0.2 | N/A | 0.2 |
| Develop and support a strong health research community through national and international alliances and priority setting | ||||||
| Refunds of Previous Years' Expenditures | 0.1 | 0.1 | N/A | 0.1 | N/A | 0.0 |
| Inform research, clinical practice and public policy on ethical, legal and social issues (ELSI) related to health and health research | ||||||
| Refunds of Previous Years' Expenditures | 0.1 | 0.0 | N/A | 0.0 | N/A | 0.1 |
| Support activities on knowledge translation, exchange, use and strategies to strengthen the health system | ||||||
| Refunds of Previous Years' Expenditures | 0.2 | 0.1 | N/A | 0.1 | N/A | 0.2 |
| Support national efforts to capture the economic value for Canada of health research advances made at Canadian Institutions | ||||||
| Refunds of Previous Years' Expenditures | 0.1 | 0.1 | N/A | 0.1 | N/A | 0.1 |
| Total Non-Respendable Revenue | 4.1 | 2.4 | N/A | 2.8 | N/A | 3.1 |
Canadian Intergovernmental Conference Secretariat
Table 5: Source of Non-Respendable Revenue
($ millions)| Actual 2005-2006 | Actual 2006-2007 |
2007-2008 |
||||
| Main Estimates | Planned Revenue | Total Authorities |
Actual |
|||
| Canadian Intergovernmental Conference Secretariat | ||||||
| Transfer payments from other governments (See Table 5a) | 1.1 | 1.2 | 1.2 | 1.2 | 1.2 | 1.1 |
| Miscellaneous Revenues | 0.0 | 0.0 | 0.0 | 0.0 | 0.0 | 0.0 |
| Total | 1.1 | 1.2 | 1.2 | 1.2 | 1.2 | 1.1 |
Canadian International Development Agency
Table 2: Source of respendable and non-respendable revenue
| ($ millions) | Actual 2005-2006 |
Actual 2006-2007 |
2007-2008 | |||
|---|---|---|---|---|---|---|
| Main Estimates | Planned Spending | Total Authorities | Actual | |||
| Gain for revaluation at year end of International Financial Institutions liabilities | 29.6 | 9.3 | 0.0 | 0.0 | 0.0 | 89.1 |
| Refund of previous year expenditures | 13.9 | 10.9 | 0.0 | 0.0 | 0.0 | 3.3 |
| Return on investments | 2.7 | 2.9 | 0.0 | 0.0 | 0.0 | 2.4 |
| Miscellaneous | 1.0 | 0.2 | 0.0 | 0.0 | 0.0 | 0.5 |
| Total Non-respendable Revenue | 47.2 | 23.4 | 0.0 | 0.0 | 0.0 | 95.3 |
The Agency's revenues totalled $95.3 million in 2007-2008 compared to only $23 million in the previous fiscal year. This difference is explained by the variation in the gain for revaluation due to the value fluctuation of the Canadian dollar.
Canadian Nuclear Safety Commission
Table 3: Sources of Non-Respendable Revenue
Non-Respendable Revenue
|
2007–2008 |
||||||
| ($ millions) |
Actual |
Actual |
Main |
Planned |
Total |
Actual |
|
Nuclear Regulation |
||||||
|
Cost Recovery Revenue |
52.6 |
60.0 |
0.0 |
61.4 |
0.0 |
72.6 |
|
Total Non-Respendable Revenue |
52.6 |
60.0 |
0.0 |
61.4 |
0.0 |
72.6 |
Canadian Radio-television and Telecommunications Commission
Sources of Respendable and Non-Respendable Revenue
| ($ millions) | Actual 2005- 2006 |
Actual 2006- 2007 |
2007-2008 | |||
|---|---|---|---|---|---|---|
| Main Estimates |
Planned Revenue |
Total Authorities |
Actual | |||
Respendable Revenue (note 1) |
||||||
Regulation of Commu-nications in the Public Interest |
||||||
| Broadcasting Licence Fees Part I | 20.0 | 20.5 | 20.6 | 20.6 | 20.7 | 20.7 |
| Telecommunications Fees | 18.6 | 19.4 | 19.6 | 19.5 | 19.5 | 19.5 |
Total Respendable Revenue |
38.6 | 39.9 | 40.2 | 40.1 | 40.2 | 40.2 |
Non-Respendable Revenue (note 2) |
||||||
| Broadcasting Licence Fees | ||||||
| Part I | 5.1 | 6.5 | 2.9 | 7.4 | 7.4 | 7.4 |
| Part II (note 3) | 112.2 | 121.9 | 0.7 | 0.7 | ||
| Telecommun-ications Fees | 5.5 | 7.2 | 2.8 | 6.6 | 6.6 | 6.6 |
| Other Revenue (note 4) | 0.3 | 0.3 | 1.3 | 1.3 | ||
Total Non-Respendable Revenue |
123.1 | 135.9 | 5.7 | 14.0 | 16.0 | 16.0 |
Total Revenue (note 5) |
161.7 | 175.8 | 45.9 | 54.1 | 56.2 | 56.2 |
Note 1: The CRTC retains respendable revenue to fund its operating budget (i.e. vote-netted revenue).
Note 2: Non-respendable revenue for Part I broadcasting licence fees and CRTC telecommunications fees recover the costs incurred by other federal government departments for services (excluding Industry Canada spectrum management) rendered without charge to the CRTC as well as the statutory costs of employee benefit plans. Part II broadcasting fees are also considered to be non-respendable revenue.
Note 3: The CRTC collected $674,000 in outstanding Part II licence fees pertaining to the 2005 and 2006 return years. The Commission did not assess or collect any revenues for Part II licence fees for 2007–2008 as a result of the Federal Court decision in effect at that time.
Note 4: Other revenue is comprised of adjustment to prior years’ revenues and payables, deferred revenues and miscellaneous revenue such as interest on outstanding fees.
Note 5: All revenues are credited to the Consolidated Revenue Fund.
Canadian Space Agency
3.3.1) Sources of Respendable and Non-Respendable Revenue
Non-Respendable Revenue
| ($ in millions) | Actual Revenue 2005-2006 |
Actual Revenue 2006-2007 |
2007-2008 | |||
| Main Estimates |
Planned Revenue |
Total Authorities |
Actual Revenue |
|||
| Space Based Earth Observation | ||||||
| Royalty Revenues | 3.1 | 3.3 | N/A | 4.1 | N/A | 4.0 |
| Miscellaneous revenues | 0.0 | 4.0 | N/A | - | N/A | - |
| Generic Space Activities in support of EO, SE & SC | ||||||
| Testing Facilities and Services of the David Florida Laboratory | 1.7 | 0.9 | N/A | 0.7 | N/A | 3.2 |
| Satellite Communications | ||||||
| Royalties from intellectual property | 0.0 | 0.0 | N/A | 0.1 | N/A | 0.1 |
| Total Non-Respendable Revenue | 4.9 | 8.2 | N/A | 4.9 | N/A | 7.3 |
|
Notes:
|
Canadian Transportation Agency
Sources of Non-respendable Revenue
|
2005-2006 |
2006-2007 |
2007-2008 |
||||
|---|---|---|---|---|---|---|
|
($ thousands) |
Actual |
Actual |
Main Estimates |
Planned Revenue |
Total Authorities |
Actual |
|
Refunds of previous years' expenditures |
104.7 |
48.1 |
0.0 |
0.0 |
10.6 |
10.6 |
|
Administrative Monetary Penalties |
24.0 |
40.0 |
0.0 |
0.0 |
1.0 |
1.0 |
|
Sales of Goods and Services |
0.1 |
4.1 |
0.0 |
0.0 |
30.1 |
30.1 |
|
Total Non-respendable revenue |
128.8 |
92.2 |
0.0 |
0.0 |
41.7 |
41.7 |
Citizenship and Immigration Canada
Sources of Non-Respendable Revenue
|
Program Activity |
Actual |
Actual |
2007–2008 |
|
|
Planned |
Actual |
|||
| Immigration Program | ||||
| Immigration Cost-Recovery Fees for Permanent Residents | 130.1 | 164.9 | 152.2 | 174.3 |
| Immigration Rights Fees [a] | 145.0 | 74.1 | 87.0 | 79.5 |
| Interest on the Immigrant Loans Program | 0.8 | 0.7 | 1.0 | 0.7 |
| Temporary Resident Program | ||||
| Immigration Cost-Recovery Fees for Temporary Residents | 142.7 | 147.2 | 172.4 | 161.6 |
| Canada’s Role in International Migration | Nil | Nil | Nil | Nil |
| Refugee Program | ||||
| Immigration Cost-Recovery Fees for Refugees | 11.2 | 14.0 | 8.0 | 9.0 |
| Integration Program | Nil | Nil | Nil | Nil |
| Citizenship Program | ||||
| Citizenship Cost-Recovery Fees | 38.1 | 27.6 | 24.0 | 24.0 |
| Right of Citizenship Fees | 26.9 | 18.4 | 16.0 | 16.6 |
| Subtotal Cost Recovery and Rights Fee Revenue [b] | 494.8 | 446.9 | 460.6 | 465.7 |
| Other Revenues | ||||
| Access to Information Fees | 0.1 | 0.1 | 0.1 | 0.1 |
| Refunds of Previous Years’ Expenditures [c] | 5.7 | 4.0 | Nil | 16.9 |
| Miscellaneous | 0.2 | 0.6 | Nil | 0.4 |
| Total Revenue | 500.8 | 451.6 | 460.7 | 483.1 |
[a] As of May 3, 2006, the Right of Permanent Residence Fee was reduced from $975 to $490 which resulted in lower revenues in 2006–2007 and 2007–2008.
[b] 2007–2008 Actual Revenue of $465.7M is marginally higher than the 2007–2008 Planned Revenue of $460.6M, primarily due to higher than planned levels of immigration applications.
[c] Refunds of previous years’ expenditures include recovery of bad debts, adjustments to prior years’ payables and refunds of previous years’ expenditures.
Notes:
- Fees are charged in recognition of full Government of Canada costs of providing services.
- All revenue is deposited into the Consolidated Revenue Fund and is not available for re-spending by the Department.
- A listing of Citizenship and Immigration Canada fees can be found at www.cic.gc.ca/english/information/fees/fees.asp.
Correctional Service Canada
Table 4- Sources of Respendable and Non-respendable Revenue
Respendable Revenue
| ($ million) | Actual 2005-2006 |
Actual 2006-2007 |
2007-2008 | |||
|---|---|---|---|---|---|---|
| Main Estimates | Planned Revenue | Total Authorities | Actual | |||
| Care and Custody | 0.0 | 0.0 | 0.0 | 0.0 | 1.9 | 0.9 |
| Rehabilitation | 0.0 | 0.0 | 0.0 | 0.0 | 0.0 | 0.1 |
| CORCAN Revolving Fund | 69.1 | 83.0 | 77.5 | 77.5 | 77.5 | 94.3 |
| Total Respendable Revenue (1) | 69.1 | 83.0 | 77.5 | 77.5 | 79.4 | 95.3 |
Non-Respendable Revenue
| ($ million) | Actual 2005-2006 |
Actual 2006-2007 |
2007-2008 | |||
|---|---|---|---|---|---|---|
| Main Estimates | Planned Revenue | Total Authorities | Actual | |||
| Care and Custody | 12.0 | 8.6 | N/A | 6.5 | 6.5 | 10.2 |
| Rehabilitation | 1.4 | 1.0 | N/A | 0.9 | 0.9 | 1.4 |
| CORCAN Revolving Fund | 0.0 | 0.0 | N/A | 0.0 | 0.0 | 0.0 |
| Total Non-Respendable Revenue (2) | 13.4 | 9.6 | N/A | 7.4 | 7.4 | 11.6 |
2 The main sources of these revenues are: offender canteen sales, revenues such as contracted offender temporary detention; offender board and lodgings; and miscellaneous revenues
Courts Administration Service
Table 3: Sources of Respendable and Non-Respendable Revenue
Non-Respendable Revenue
| ($ millions) | Actual 2005-20061 |
Actual 2006-20072 |
2007-2008 | |
| Planned Revenue3 | Planned Actual | |||
| Provide Registry Services | ||||
| Refund of previous years' expenditures | 0.1 | 0.1 | 0.0 | 0.1 |
| Services fees | 1.7 | 1.7 | 1.6 | 1.8 |
| Court fines | 0.0 | 0.0 | 0.0 | 3.7 |
| Miscellaneous non-tax revenues | 3.2 | 2.7 | 3.2 | 2.6 |
| Total Non-Respendable Revenue | 5.0 | 4.5 | 4.8 | 8.1 |
Notes:
- Source 2005-06 DPR.
- Source 2006-07 DPR.
- Source 2007-08 RPP.
- At the Courts Administration Service, non respendable revenues consist primarily of fees levied for filing documents within the registries, for sales of photocopies of judgments and other revenues such as fines. CAS has no control over court fines, as they are imposed by judicial officers. Predicting these fines is entirely dependent on the cases being brought before the judiciary.
- Miscellaneous non-tax revenues consist primarily of other revenues, but are primarily derived from the Employment Insurance (EI) account. The total cost allocated by the Courts Administration Service (CAS) for handling EI cases is expended against the Employment Insurance account of Canada. As such, HRSDC, the department responsible for the EI account, shows an EI expense and CAS shows an equivalent, non-respendable revenue item. The purpose of this accounting exercise is to more accurately reflect the total cost of running the federal government's EI program and it is strictly internal to the government.
- Numbers in columns may not add up due to rounding.
Department of Finance Canada
Table 4: Sources of Respendable and Non-Respendable Revenue
Respendable Revenue
| ($ thousands) |
Actual 2005–06 |
Actual 1 2006–07 |
2007–08 | |||
|
Main Estimates |
Planned Revenue |
Total Authorities |
Actual | |||
| Tax Policy | ||||||
| Sale of departmental documents | 0 | 0 | 128 | 128 | 128 | 18 |
| Economic and Fiscal Policy | ||||||
| Sale of departmental documents | 0 | 0 | 59 | 59 | 59 | 8 |
| Financial Sector Policy | ||||||
| Sale of departmental documents | 0 | 0 | 71 | 71 | 71 | 10 |
|
Economic Development and Corporate Finance |
||||||
| Sale of departmental documents | 0 | 0 | 32 | 32 | 32 | 5 |
|
Federal-Provincial Relations and Social Policy |
||||||
| Sale of departmental documents | 0 | 0 | 48 | 48 | 48 | 7 |
| International Trade and Finance | ||||||
| Sale of departmental documents | 0 | 0 | 62 | 62 | 62 | 9 |
| Total respendable revenue* | 0 | 0 | 400 | 400 | 400 | 58 |
* Due to rounding, figures may not add to totals shown.
Note:
1. Respendable revenue for the Department includes amounts received for the sale of documents. During 2006–07, approximately $117 thousand was received and identified under non-respendable revenue
Non-Respendable Revenue
| ($ thousands) | Actual 2005–06 |
Actual 2006–07 |
2007–08 | |||||||||
| Main Estimates |
Planned Revenue |
Total Authorities |
Actual | |||||||||
| Tax Policy | ||||||||||||
| Refunds of previous years' expenditures—Refund of salaries, goods, and services | 31 | 6 | __ | __ | __ | 28 | ||||||
| Adjustments to prior year's payables | 296 | 64 | __ | __ | __ | 271 | ||||||
| Sales of goods and services—Sale of other publications | 11 | 35 | __ | __ | __ | 19 | ||||||
| Fees—Access to information | 1 | 4 | __ | __ | __ | 2 | ||||||
| Public Works and Government Services Canada—Consulting and Audit Canada Revolving Fund | 0 | 11 | __ | __ | __ | 50 | ||||||
| Optional Services Revolving Fund | 9 | 0 | __ | __ | __ | 0 | ||||||
| Proceeds from the disposal of surplus Crown assets | 2 | 6 | __ | __ | __ | 2 | ||||||
| Economic and Fiscal Policy | ||||||||||||
| Refunds of previous years' expenditures—Refund of salaries, goods, and services | 15 | 3 | __ | __ | __ | 13 | ||||||
| Adjustments to prior year's payables | 143 | 30 | __ | __ | __ | 124 | ||||||
| Sales of goods and services—Sale of other publications | 5 | 16 | __ | __ | __ | 9 | ||||||
| Fees—Access to information | 1 | 2 | __ | __ | __ | 1 | ||||||
| Public Works and Government Services Canada—Consulting and Audit Canada Revolving Fund | 0 | 5 | __ | __ | __ | 23 | ||||||
| Optional Services Revolving Fund | 4 | 0 | __ | __ | __ | 0 | ||||||
| Proceeds from the disposal of surplus Crown assets | 1 | 3 | __ | __ | __ | 1 | ||||||
| Financial Sector Policy | ||||||||||||
| Refunds of previous years' expenditures—Refund of salaries, goods, and services | 16 | 4 | __ | __ | __ | 16 | ||||||
| Adjustments to prior year's payables | 158 | 43 | __ | __ | __ | 150 | ||||||
| Sales of goods and services—Sale of other publications | 6 | 23 | __ | __ | __ | 10 | ||||||
| Fees—Access to information | 1 | 3 | __ | __ | __ | 1 | ||||||
| Public Works and Government Services Canada—Consulting and Audit Canada Revolving Fund | 0 | 8 | __ | __ | __ | 28 | ||||||
| Optional Services Revolving Fund | 5 | 0 | __ | __ | __ | 0 | ||||||
| Proceeds from the disposal of surplus Crown assets | 1 | 4 | __ | __ | __ | 1 | ||||||
| Cash and accounts receivable—Cash—Chartered banks | 27,120 | 46,004 | __ | __ | __ | 60,048 | ||||||
| Cash and accounts receivable—Cash—Short-term deposits | 143,420 | 237,066 | __ | __ | __ | 225,791 | ||||||
| Cash and accounts receivable—Cash—Receiver General balance at the Bank of Canada | 41,598 | 68,160 | __ | __ | __ | 74,822 | ||||||
| Foreign exchange accounts—International reserves held in the Exchange Fund Account—Transfer of profit | 1,394,534 | 1,765,275 | __ | __ | __ | 1,828,151 | ||||||
| Foreign exchange accounts—International Monetary Fund—Subscriptions—Transfer of profit | 49,895 | 22,753 | __ | __ | __ | 9,292 | ||||||
| Loans, investments, and advances—Bank of Canada—Transfer of profit | 1,735,610 | 1,983,529 | __ | __ | __ | 1,921,014 | ||||||
| Loans, investments, and advances—Financial Consumer Agency of Canada | 112 | 166 | __ | __ | __ | 125 | ||||||
| Miscellaneous non-tax revenues—Transfer from the following accounts that were unclaimed or outstanding for 10 years or more: Outstanding Imprest Account—Unclaimed cheques | 31,057 | 25,929 | __ | __ | __ | 30,087 | ||||||
| Miscellaneous non-tax revenues—Unclaimed balances received from the Bank of Canada in respect of chartered banks | 3,829 | 3,951 | __ | __ | __ | 1,449 | ||||||
| Miscellaneous non-tax revenues—Mortgage interest premium | 8,836 | 10,517 | __ | __ | __ | 13,851 | ||||||
| Miscellaneous non-tax revenues—Sundries | 1,551 | 215 | __ | __ | __ | 8 | ||||||
| Farm Credit Canada | 0 | 0 | __ | __ | __ | 19,945 | ||||||
| Business Development Bank of Canada | 0 | 0 | __ | __ | __ | 1,870 | ||||||
| Economic Development and Corporate Finance |
||||||||||||
| Refunds of previous years' expenditures—Refund of salaries, goods, and services | 8 | 2 | __ | __ | __ | 7 | ||||||
| Adjustments to prior year's payables | 75 | 16 | __ | __ | __ | 69 | ||||||
| Sales of goods and services—Sale of other publications | 3 | 9 | __ | __ | __ | 5 | ||||||
| Fees—Access to information | 0 | 1 | __ | __ | __ | 0 | ||||||
| Public Works and Government Services Canada—Consulting and Audit Canada Revolving Fund | 0 | 3 | __ | __ | __ | 13 | ||||||
| Optional Services Revolving Fund | 2 | 0 | __ | __ | __ | 0 | ||||||
| Proceeds from the disposal of surplus Crown assets | 0 | 2 | __ | __ | __ | 1 | ||||||
| Loans, investments, and advances—Canada Development Investment Corporation—Dividend | 199,000 | 156,000 | __ | __ | __ | 234,200 | ||||||
| Miscellaneous non-tax revenues—Sale of real property to Canada Lands Company Limited | 2,126 | 2,070 | __ | __ | __ | 5,184 | ||||||
| Federal-Provincial Relations and Social Policy |
||||||||||||
| Refunds of previous years' expenditures—Refund of salaries, goods, and services | 13 | 3 | __ | __ | __ | 11 | ||||||
| Adjustments to prior year's payables | 122 | 35 | __ | __ | __ | 102 | ||||||
| Sales of goods and services—Sale of other publications | 5 | 19 | __ | __ | __ | 7 | ||||||
| Fees—Access to information | 1 | 2 | __ | __ | __ | 1 | ||||||
| Public Works and Government Services Canada—Consulting and Audit Canada Revolving Fund | 0 | 6 | __ | __ | __ | 19 | ||||||
| Optional Services Revolving Fund | 4 | 0 | __ | __ | __ | 0 | ||||||
| Proceeds from the disposal of surplus Crown assets | 1 | 3 | __ | __ | __ | 1 | ||||||
| International Trade and Finance | ||||||||||||
| Refunds of previous years' expenditures—Refund of salaries, goods, and services | 16 | 3 | __ | __ | __ | 14 | ||||||
| Adjustments to prior year's payables | 152 | 32 | __ | __ | __ | 131 | ||||||
| Sales of goods and services—Sale of other publications | 6 | 17 | __ | __ | __ | 9 | ||||||
| Fees—Access to information | 1 | 2 | __ | __ | __ | 1 | ||||||
| Public Works and Government Services Canada—Consulting and Audit Canada Revolving Fund | 0 | 6 | __ | __ | __ | 24 | ||||||
| Optional Services Revolving Fund | 5 | 0 | __ | __ | __ | 0 | ||||||
| Proceeds from the disposal of surplus Crown assets | 1 | 3 | __ | __ | __ | 1 | ||||||
| Public Debt | ||||||||||||
| Miscellaneous non-tax revenues—Transfer from matured debt outstanding | 4,965 | 2,463 | __ | __ | __ | 5,436 | ||||||
| Domestic Coinage | ||||||||||||
| Domestic coinage | 212,942 | 226,843 | __ | 233,517 | __ | 203,566 | ||||||
| Transfer Payments to Provinces and Territories |
||||||||||||
| Loans, investments, and advances—Federal-provincial fiscal arrangements | 59 | 59 | __ | __ | __ | 59 | ||||||
| Loans, investments, and advances—Municipal Development and Loan Board | 173 | 42 | __ | __ | __ | 5 | ||||||
| International Financial Organizations | ||||||||||||
| Loans, investments, and advances—United Kingdom—United Kingdom Financial Agreement Act, 1946—Deferred interest | 1,013 | 335 | __ | __ | __ | 0 | ||||||
| Loans, investments, and advances—International Monetary Fund—Poverty Reduction and Growth Facility | 16,874 | 13,679 | __ | __ | __ | 14,111 | ||||||
| Net gain on exchange | 1,088,319 | 74,444 | __ | __ | __ | 44,420 | ||||||
| Total non-respendable revenue* | 4,964,155 | 4,639,937 | 233,517 | 4,694,598 | ||||||||
* Due to rounding, figures may not add to totals shown.
Department of Foreign Affairs and International Trade
Table 4: Sources of Respendable and Non-Respendable Revenue
4-A: Respendable Revenue
|
($ millions) |
Actual |
Actual |
2007–2008 |
|||
|
Main Estimates |
Planned Revenue |
Total Author- |
Actual |
|||
| Strategic Policy and Planning | ||||||
| International Youth Exchange | 1.2 | 1.4 | N/A | 1.5 | 5.5 | 4.5 |
| International Business Development | ||||||
| Trade fairs and investment/ technology missions | 0.7 | 1.1 | N/A | 3.1 | 3.1 | 0.7 |
| Common Services and Infrastructure (Support from Headquarters) | ||||||
| Training services | 5.0 | 5.1 | N/A | 6.2 | 5.9 | 5.1 |
| Real property services abroad | 7.7 | 1.1 | N/A | 9.3 | 9.3 | 2.5 |
| Telecommunication services | 0.7 | 1.2 | N/A | 0.9 | 2.1 | 1.1 |
| Shared services from the Department of Foreign Affairs and International Trade (International Trade) | 1.4 | N/A | N/A | N/A | N/A | N/A |
| Common Services and Infrastructure (Missions Abroad) | ||||||
| Shared services from the Department of Foreign Affairs and International Trade (International Trade) | 29.2 | N/A | N/A | N/A | N/A | N/A |
| Consular Affairs | ||||||
| Specialized consular services | 3.1 | 3.2 | N/A | 3.2 | 3.2 | 3.6 |
| Passport Canada Special Operating Agency (Revolving Fund) | ||||||
| Passport Fees 1 | 195.9 | 237.5 | N/A | 239.2 | 239.2 | 318.6 |
| Total Respendable Revenue | 244.9 | 250.6 | N/A | 263.4 | 268.3 | 336.1 |
1. Includes an amount of $31.7 received from Treasury Board to fund capital projects, principally for National Security Initiatives and to address recommendations from the Office of the Auditor General.
Due to rounding, figures may not add to totals shown.
4-B: Non-Respendable Revenue
|
($ millions) |
Actual |
Actual |
2007–2008 |
||||||||||
|
Main Estimates |
Planned Revenue |
Total Author- |
Actual |
||||||||||
| Strategic Policy and Planning 1 | 4.7 | 0.3 | N/A | - | - | - | |||||||
| International Security 1 | - | 1.5 | N/A | - | - | - | |||||||
| Global Issues 1 | 3.1 | 0.6 | N/A | - | - | - | |||||||
| Bilateral Relations 1 | - | 1.0 | N/A | - | - | - | |||||||
| Protocol 1 | - | 0.5 | N/A | - | - | - | |||||||
| Trade Policy and Negotiations | |||||||||||||
| Import and export permit fees | 7.7 | 8.7 | N/A | 12.5 | 9.5 | 9.5 | |||||||
| International Business Development | |||||||||||||
| Contributions repaid under the Program for Export Market Development | 1.6 | 0.9 | N/A | 0.8 | 1.0 | 1.0 | |||||||
|
- - - - |
350.0 78.4 16.5 115.9 |
N/A N/A N/A N/A |
- - - - |
250.0 76.5 8.1 - |
250.0 76.5 8.1 - |
|||||||
| Common Services and Infrastructure (Support from Headquarters) | |||||||||||||
| Adjustment to Previous Year's Expenditures 2 | 9.5 | 2.0 | N/A | 2.2 | 4.0 | 4.0 | |||||||
| Employee rental shares 2 | 1.1 | - | N/A | - | - | - | |||||||
| Common Services and Infrastructure (Missions Abroad) | |||||||||||||
| Sales of properties and other assets | 15.6 | 6.2 | N/A | 63.8 | 49.0 | 49.0 | |||||||
| Employee rental shares 2 | 15.7 | 17.3 | N/A | 20.6 | 23.3 | 23.3 | |||||||
| Gain on foreign exchange | 4.0 | 6.8 | N/A | - | 18.3 | 18.3 | |||||||
| Services provided to Passport Canada | 4.4 | 4.4 | N/A | 4.4 | 4.4 | 4.4 | |||||||
| Adjustment to Previous Year's Expenditures and other 2 | 6.6 | 7.4 | N/A | 3.0 | 2.6 | 2.6 | |||||||
| Consular Affairs | |||||||||||||
| Consular Fees | 64.9 | 76.2 | N/A | 64.9 | 96.3 | 96.3 | |||||||
| Adjustment to Previous Year's Expenditures | 1.0 | 0.4 | N/A | - | - | - | |||||||
| Total Non-Respendable Revenue | 139.9 | 695.0 | N/A | 172.2 | 543.0 | 543.0 | |||||||
1. Amounts represent: Adjustment to Previous Year's Expenditures.
2. Items previously listed individually have been combined for presentation purposes.
Due to rounding, figures may not add to totals shown.
Department of Justice Canada
Table 3: Sources of Respendable and Non-Respendable Revenue
| Respendable Revenue ($ millions) | 2007–2008 | |||||
| Actual 2005–06 |
Actual 2006–07 |
Main Estimates |
Planned Revenue |
Total Authorities |
Actual | |
| Providing legal advisory, litigation and legislative services to government | ||||||
| Client Departments |
-
|
-
|
-
|
-
|
182.0 | 182.0 |
| Total Respendable Revenue [Note 2] |
-
|
-
|
-
|
-
|
182.0 | 182.0 |
| Non-Respendable Revenue ($ millions) | 2007–2008 | |||||
| Actual 2005–06 |
Actual 2006–07 |
Main Estimates |
Planned Revenue |
Total Authorities |
Actual | |
| Developing policies and laws | ||||||
| Family Order and Agreements Enforcement Assistance Program |
6.6
|
6.2
|
|
7.9
|
7.9 | 7.3 |
| Central Registry of Divorce Proceedings |
0.8
|
0.7
|
|
0.9
|
0.9 | 0.9 |
| Developing and Implementing programs | ||||||
| Miscellaneous Revenues [Note 1] |
7.5
|
3.8
|
-
|
-
|
- | - |
| Providing legal advisory, litigation and legislative services to government | ||||||
| Legal Services - Crown Corp. EBP |
|
|
|
31.7
|
31.7 | 31.7 |
| Legal Services - Crown Corp. |
1.3
|
1.0
|
|
0.4
|
0.4 | 0.2 |
| Client-Departments Cost Recoveries |
153.6
|
154.5
|
-
|
0.7
|
0.7 | 0.3 |
| Miscellaneous Revenues [Note 1] |
2.5
|
3.2
|
|
0.5
|
0.5 | 4.3 |
| Providing prosecution services | ||||||
| Legal Services – Crown Corp. | 0.2 | |||||
| Client Departments Cost Recoveries | 5.2 | |||||
| Fines and forfeitures | 2.9 | 1.0 | ||||
| Miscellaneous Revenues [Note 1] | .3 | 0.8 | ||||
| Total Non-Respendable Revenue [Note 3] |
175.5
|
176.6
|
-
|
42.1
|
42.1 | 44.6 |
Note 1: Miscellaneous revenues have been applied to proper program activities in 2006 and 2007.
Note 2: Respendable revenue under net vote authority
Note 3:Non-Respendable Revenues include refunds and reversal of previous years expenditures. Under accrual accounting (see Departmental Financial Statements - Table 15), these refunds and reversals are excluded from revenues and reported with expenses.
Economic Development Agency of Canada for the Regions of Quebec
Table 4: Sources of non-respendable revenue
This table1 shows revenue over time. Revenue consists primarily of repayments of repayable contributions awarded by the Agency.
| Program activity (in thousands of dollars) |
Actual revenue 2005-2006 | Actual revenue 2006-2007 | 2007-2008 | |
|---|---|---|---|---|
| Planned revenue | Actual revenue | |||
| Development of communities | ||||
|
— | — | 4,250 | 8,196 |
|
— | — | — | 563 |
| Infrastructure | ||||
|
— | — | — | — |
|
— | — | — | 43 |
| Special intervention measures | ||||
|
— | — | — | — |
|
— | — | — | — |
| Competitiveness of enterprises (SMEs) | ||||
|
— | — | 36,125 | 40,769 |
|
— | — | — | 1,982 |
| Competitive positioning of regions | ||||
|
— | — | 2,125 | 1,995 |
|
— | — | — | 331 |
| Policies, programs and initiatives | ||||
|
— | — | — | — |
|
— | — | — | 27 |
| Total non-respendable revenue | 45,791 | 50,211 | 42,500 | 53,906 |
1 This table is presented based on the new Program Activity Architecture. Actual revenues from 2005-2006 and 2006-2007 have not been categorized.
2 All other revenue includes refunds of prior years’ expenditures, adjustments to prior years’ accruals, service fees, proceeds from the disposal of Crown assets, interest revenues and other miscellaneous revenues.
Environment Canada
Sources of Respendable and Non-Respendable Revenue
Respendable Revenue
|
Actual 2005-2006 (1) |
Actual 2006-2007 (1) |
2007-2008 | ||||
| ($ millions) | Main Estimates | Planned Revenue | Total Authorities | Actual | ||
| Biodiversity is conserved and protected | ||||||
| Information Products | 0.1 | 0.0 | 0.0 | 0.0 | 0.0 | 0.0 |
| Realty (Accommodation) | 0.1 | 0.2 | 0.1 | 0.1 | 0.1 | 0.2 |
| Regulatory Services | 0.2 | 0.0 | 0.3 | 0.3 | 0.3 | 0.3 |
| Scientific and Professional Services | 0.6 | 0.5 | 0.8 | 0.8 | 0.8 | 0.2 |
| Subtotal | 1.0 | 0.7 | 1.2 | 1.2 | 1.2 | 0.7 |
| Water is clean, safe and secure | ||||||
| Information Products | 0.2 | 0.1 | 0.0 | 0.0 | 0.0 | 0.2 |
| Realty (Accommodation) | 0.1 | 0.1 | 0.1 | 0.1 | 0.1 | 0.2 |
| Scientific and Professional Services | 2.1 | 2.5 | 4.3 | 4.3 | 4.3 | 3.2 |
| Subtotal | 2.4 | 2.7 | 4.4 | 4.4 | 4.4 | 3.7 |
| Canadians adopt approaches that ensure the sustainable use and management of natural capital and working landscapes | ||||||
| Information Products | 0.1 | 0.0 | 0.1 | 0.1 | 0.1 | 0.0 |
| Realty (Accommodation) | 0.2 | 0.0 | 0.0 | 0.0 | 0.0 | 0.3 |
| Regulatory Services | 0.2 | 0.0 | 0.0 | 0.0 | 0.0 | 0.0 |
| Scientific and Professional Services | 1.3 | 0.1 | 0.0 | 0.0 | 0.0 | 0.0 |
| Subtotal | 1.9 | 0.1 | 0.1 | 0.1 | 0.1 | 0.3 |
| Improved knowledge and information on weather and environmental conditions influences decision-making | ||||||
| Information Products | 20.7 | 6.7 | 1.5 | 1.5 | 1.6 | 6.5 |
| Realty (Accommodation) | 0.3 | 0.4 | 0.7 | 0.7 | 0.7 | 1.6 |
| Scientific and Professional Services | 6.9 | 8.7 | 12.4 | 12.4 | 12.4 | 8.0 |
| Subtotal | 27.9 | 15.8 | 14.6 | 14.6 | 14.6 | 16.0 |
| Canadians are informed of, and respond appropriately to, current and predicted environmental conditions | ||||||
| Information Products | 22.8 | 37.0 | 39.0 | 39.0 | 39.0 | 37.2 |
| Realty (Accommodation) | 0.4 | 0.4 | 0.7 | 0.7 | 0.7 | 2.1 |
| Scientific and Professional Services | 7.8 | 3.2 | 3.7 | 3.7 | 3.7 | 3.1 |
| Subtotal | 31.0 | 40.5 | 43.4 | 43.4 | 43.4 | 42.4 |
| Risks to Canadians, their health and their environment, posed by toxic and other harmful substances, are reduced | ||||||
| Realty (Accommodation) | 0.1 | 0.0 | 0.1 | 0.1 | 0.1 | 0.2 |
| Regulatory Services | 1.8 | 0.2 | 2.1 | 2.1 | 2.1 | 1.7 |
| Scientific and Professional Services | 4.1 | 4.5 | 2.2 | 2.2 | 2.2 | 1.1 |
| Subtotal | 6.1 | 4.8 | 4.4 | 4.4 | 4.4 | 3.0 |
| Canadians adopt sustainable consumption and production approaches | ||||||
| Regulatory Services | 0.2 | 0.0 | 0.0 | 0.0 | 0.0 | 0.0 |
| Scientific and Professional Services | 0.4 | 0.0 | 0.0 | 0.0 | 0.0 | 0.0 |
| Subtotal | 0.6 | 0.0 | 0.0 | 0.0 | 0.0 | 0.0 |
| Risks to Canadians, their health and their environment from air pollutants and greenhouse gas emissions are reduced | ||||||
| Scientific and Professional Services | 0.1 | 0.0 | 0.0 | 0.0 | 0.0 | 0.3 |
| Subtotal | 0.1 | 0.0 | 0.0 | 0.0 | 0.0 | 0.3 |
| Total Respendable Revenue | 71.0 | 64.8 | 68.2 | 68.2 | 68.2 | 66.4 |
Totals may differ between and within tables due to rounding of figures.
Non-Respendable Revenue
|
Actual 2005-2006 (1) |
Actual 2006-2007 (1) |
2007-2008 | ||||
| ($ millions) | Main Estimates | Planned Revenue | Total Authorities | Actual | ||
| Biodiversity is conserved and protected | ||||||
| Licenses and Permits | 3.2 | 3.1 | 4.2 | 4.2 | 4.2 | 3.1 |
| Proceeds from the Disposal of Surplus Crown Assets | 0.1 | 0.0 | 0.0 | 0.0 | 0.0 | 0.0 |
| Regulatory Services | 0.2 | 0.1 | 0.2 | 0.2 | 0.2 | 0.1 |
| Miscellaneous | 0.3 | 1.6 | 0.0 | 0.0 | 0.0 | 0.1 |
| Subtotal | 3.8 | 4.8 | 4.4 | 4.4 | 4.4 | 3.4 |
| Water is clean, safe and secure | ||||||
| Proceeds from the disposal of surplus Crown assets | 0.0 | 0.0 | 0.0 | 0.0 | 0.0 | 0.1 |
| Miscellaneous | 0.0 | 0.1 | 0.0 | 0.0 | 0.0 | 0.1 |
| Third Party Agreements | 0.2 | 0.3 | 0.2 | 0.2 | 0.2 | 0.2 |
| Subtotal | 0.2 | 0.4 | 0.2 | 0.2 | 0.2 | 0.4 |
| Canadians adopt approaches that ensure the sustainable use and management of natural capital and working landscapes | ||||||
| Miscellaneous | 0.1 | 0.0 | 0.0 | 0.0 | 0.0 | 0.1 |
| Subtotal | 0.2 | 0.0 | 0.0 | 0.0 | 0.0 | 0.1 |
| Improved knowledge and information on weather and environmental conditions influences decision-making | ||||||
| Information Products | 0.8 | 0.1 | 0.7 | 0.7 | 0.7 | 0.5 |
| Proceeds from the Disposal of Surplus Crown Assets | 0.1 | 0.1 | 0.0 | 0.0 | 0.0 | 0.2 |
| Miscellaneous | 1.6 | 0.6 | 0.4 | 0.4 | 0.4 | 1.2 |
| Royalties | 0.2 | 0.4 | 0.4 | 0.4 | 0.4 | 0.4 |
| Scientific and Professional Services | 0.0 | 0.0 | 0.9 | 0.9 | 0.9 | 0.0 |
| Subtotal | 2.6 | 1.2 | 2.4 | 2.4 | 2.4 | 2.3 |
| Canadians are informed of, and respond appropriately to, current and predicted environmental conditions | ||||||
| Information Products | 0.9 | 0.6 | 1.3 | 1.3 | 1.3 | 0.7 |
| Proceeds from the Disposal of Surplus Crown Assets | 0.1 | 0.0 | 0.0 | 0.0 | 0.0 | 0.0 |
| Miscellaneous | 1.8 | 3.9 | 2.9 | 2.9 | 2.9 | 3.8 |
| Royalties | 0.2 | 0.0 | 0.0 | 0.0 | 0.0 | 0.0 |
| Subtotal | 3.0 | 4.5 | 4.2 | 4.2 | 4.2 | 4.5 |
| Risks to Canadians, their health and their environment, posed by toxic and other harmful substances, are reduced | ||||||
| Proceeds from the Disposal of Surplus Crown Assets | 0.2 | 0.5 | 0.0 | 0.0 | 0.0 | 0.0 |
| Miscellaneous | 0.3 | 0.1 | 0.0 | 0.0 | 0.0 | 0.1 |
| Royalties | 0.1 | 0.2 | 0.0 | 0.0 | 0.0 | 0.2 |
| Subtotal | 0.6 | 0.7 | 0.0 | 0.0 | 0.0 | 0.3 |
| Canadians adopt sustainable consumption and production approaches | ||||||
| Miscellaneous | 0.0 | 0.0 | 0.0 | 0.0 | 0.0 | 0.1 |
| Royalties | 0.0 | 0.0 | 0.0 | 0.0 | 0.0 | 0.0 |
| Subtotal | 0.0 | 0.0 | 0.0 | 0.0 | 0.0 | 0.1 |
| Risks to Canadians, their health and their environment from air pollutants and greenhouse gas emissions are reduced | ||||||
| Proceeds from the Disposal of Surplus Crown Assets | 0.0 | 0.0 | 0.0 | 0.0 | 0.0 | 0.5 |
| Miscellaneous | 0.0 | 0.0 | 0.0 | 0.0 | 0.0 | 0.1 |
| Royalties | 0.1 | 0.0 | 0.0 | 0.0 | 0.0 | 0.0 |
| Subtotal | 0.1 | 0.0 | 0.0 | 0.0 | 0.0 | 0.6 |
| Total Non-Respendable Revenue | 10.7 | 11.7 | 11.1 | 11.1 | 11.1 | 11.7 |
| Total Respendable and Non-Respendable Revenue | 81.7 | 76.6 | 79.3 | 79.3 | 79.3 | 78.1 |
Totals may differ between and within tables due to rounding of figures.
This table lists various sources of respendable and non-respendable revenue. To clarify the types of revenues that fall under these sources, short definitions are given below:
Scientific and Professional Services: research and analysis, telecommunications, hydrometrics, consulting services, training and wildlife studies and surveys.
Information Products: data extracts and access, publications and hydrometric and weather products.
Miscellaneous: Employee Benefit Plan (EBP) recoveries and student parking fees.
Regulatory Services: ocean disposal permit applications and monitoring fees, new chemical notification, and other permits and fees.
Realty (Accommodation): living accommodations, rentals, entry fees, concessions and National Water Research Institute building recoveries.
Royalties: revenues collected from the licensing of intellectual property.
Co-Marketing Initiatives: marketing and advertising sales.
Licences and Permits: Migratory bird hunting permit & stamps and taxidermy and aviculture permits.
Fines: fines levied under the Canadian Environmental Protection Act, 1999 and other miscellaneous fines.
Third Party agreements: agreements for water management services under the authority for Lake of the Woods Control Board (salaries) and the Ottawa River Regulation Secretariat (salaries).
Proceeds from the Disposal of Surplus Crown Assets: gains on the sale of non-capital assets and proceeds from the sale of capital assets, excluding real property.
(1) Due to the change in reporting structure, the amounts by program activity were calculated based on our departmental crosswalk. Refer to Environment Canada's previous departmental performance reports for detailed financial information.
Respendable Revenues
The most significant decline in anticipated revenue is due to a change in the accounting treatment for the funds the Department receives from Natural Resources Canada for the Program of Energy Research and Development (PERD). Beginning in 2006-2007, transactions related to this program are now accounted for in an OGD suspense account rather than vote-netted revenues (VNR). We have also seen a decline in revenues under the contract between Environment Canada and NAV CANADA as well as with our interdepartmental agreements with the Canadian Coast Guard and National Defence (DND). Some projects from DND Search and Rescue funds entered the Department through the Supplementary Estimates rather than VNR. The other minor variances are mainly due to lower overall commercial revenues.
Fisheries and Oceans Canada
Sources of Respendable and Non-respendable Revenue
All revenues collected by departments are credited to the Consolidated Revenue Fund (CRF) of Canada. The CRF is the account into which taxes and revenue are deposited and from which funds are withdrawn. When a department collects revenues, it has no authority from Parliament to respend those revenues, and the revenues are considered non-respendable revenues. Non-respendable revenues are credited to the CRF and offset the total expenditures approved by Parliament for the government as a whole.
Departments may however seek specific authority from Parliament to apply revenues collected against the program from which they are raised. If Parliament grants such approval, the revenues are considered respendable.
The following table provides the Department's actual revenue by program activity for 2005-2006, 2006-2007 and 2007 2008. The table also presents, for 2007-2008, Main Estimates, Planned Revenue and Total Authorities.
Respendable and Non-respendable Revenue by Program Activity, 2007-2008 ($ millions)
| Program Activity | Actual Revenue 2005-2006 | Actual Revenue 2006-2007 | Main Estimates 2007-2008 | Planned Revenue 2007-2008 | Total Authorities 2007-2008 | Actual Revenue 2007-2008 |
|---|---|---|---|---|---|---|
| Respendable Revenue | ||||||
| Canadian Coast Guard | ||||||
| Maintenance Dredging Services Tonnage Fees in the St. Lawrence Shipping Channel | 4.3 | 5.2 | 4.6 | 4.6 | 4.6 | 5.4 |
| Marine Navigation Services Fees | 32.1 | 29.5 | 27.8 | 27.8 | 27.8 | 30.7 |
| Coast Guard Radio Tolls | 0.0 | 0.0 | 0.1 | 0.1 | 0.1 | 0.0 |
| Employee Deductions for Employee Housing | — | — | 0.0 | 0.0 | 0.0 | — |
| Icebreaking Services Fee | 5.8 | 5.0 | 13.8 | 13.8 | 13.8 | 5.2 |
| Canadian Coast Guard College | 0.5 | 1.6 | 3.7 | 3.7 | 3.7 | — |
| Sundries | 0.4 | 0.5 | — | — | — | 0.4 |
| Total Respendable Revenue | 43.2 | 41.8 | 50.1 | 50.1 | 50.1 | 41.7 |
| Non-respendable Revenue | ||||||
| Canadian Coast Guard | ||||||
| Aids to Navigation in the Deep Water Channel between Montreal and Lake Erie | — | 0.2 | 0.2 | 0.2 | 0.2 | 0.2 |
| Rental of Land, Buildings and Equipment | — | — | 0.2 | 0.2 | 0.2 | 0.0 |
| Miscellaneous | 0.1 | 0.0 | — | — | — | — |
| Small Craft Harbours | ||||||
| Small Craft Harbour Revenue | 1.6 | 1.5 | 1.2 | 1.2 | 1.2 | 1.5 |
| Science - Safe and Accessible Waterways | ||||||
| Sale of Charts and Publications | 2.1 | 1.9 | 1.8 | 1.8 | 1.8 | 2.0 |
| Technology Transfer Licences | 0.7 | 0.7 | 0.3 | 0.3 | 0.3 | 1.2 |
| Fisheries Management | ||||||
| Commercial Licences | 45.2 | 44.8 | 35.0 | 35.0 | 35.0 | 38.0 |
| Recreational Licences | — | — | 5.1 | 5.1 | 5.1 | 5.2 |
| Conservation Stamps | — | — | 1.4 | 1.4 | 1.4 | 1.3 |
| Rental of Land, Buildings and Equipment | 0.2 | 0.1 | 0.2 | 0.2 | 0.2 | 0.2 |
| Science - Sustainable Fisheries and Aquaculture | ||||||
| Technology Transfer Licences | 0.1 | 0.1 | — | — | — | 0.2 |
| Habitat Management | ||||||
| Rental of Land, Buildings and Equipment | 0.1 | 0.1 | 0.2 | 0.2 | 0.2 | 0.1 |
| Science - Healthy and Productive Aquatic Ecosystems | ||||||
| Technology Transfer Licences | — | — | 0.1 | 0.1 | 0.1 | — |
| Sub-total Non-Respendable Revenue | 49.9 | 49.4 | 45.8 | 45.8 | 45.8 | 49.8 |
| Unplanned Revenue | ||||||
| Internal Revenues | 0.6 | 0.8 | 1.7 | |||
| Return on Investments | 0.1 | 0.1 | 0.1 | |||
| Refunds/Adjustments of Previous Year's Expenditures | 3.1 | 5.0 | 3.5 | |||
| Sale of Surplus Crown Assets | 0.9 | 2.0 | 3.7 | |||
| Sale of Garden City | 5.0 | — | — | |||
| Miscellaneous (Seizures and Forfeitures, Fines and Sundries) | 6.6 | 2.7 | 2.6 | |||
| Sub-total Unplanned Revenue | 16.4 | 10.7 | 11.7 | |||
| Total Non-Respendable Revenue | 66.3 | 60.1 | 45.8 | 45.8 | 45.8 | 61.5 |
| Total Revenues | 109.5 | 101.9 | 95.8 | 95.8 | 95.8 | 103.2 |
Note: Because of rounding, figures may not add to the totals shown. Figures that cannot be presented in millions of dollars are shown as 0.0.
Changes between Planned Revenue and Actual Revenue
Actual respendable revenue in 2007-2008 was $41.7 million, $8.4 million less than planned respendable revenue of $50.1 million. Actual respendable revenue has decreased from 2005-2006 and 2006-2007, when it was $43.2 million and $41.8 million respectively.
The shortfall is primarily due to an $8.6 million shortfall in the Icebreaking Services Fees and a $3.7 million shortfall for the Coast Guard College. The shortfalls were offset by increased collections of $4.1 million in other areas of respendable revenue. Planned revenues for the Icebreaking Services Fees are based on a fee structure that has been implemented only partially, which causes the yearly shortfall.
Actual non-respendable revenues exceeded planned non-respendable revenue by $4.0 million in 2007-2008. The difference is due mainly to the sale of commercial licences under Fisheries Management and the sale of charts and publications and technology transfer licences under Science — Safe and Accessible Waterways.
Hazardous Materials Information Review Commission
Table 3: Sources of Non-Respendable Revenue ($ thousands)
| 2007–2008 | |||||||
|---|---|---|---|---|---|---|---|
| 2005–06 Actual | 2006–07 Actual | Main Estimates |
Planned Spending |
Total Authorities |
Actual | ||
| Claims Exemption Process | |||||||
| Fees charged on claims for exemption | (1)570 | 591 | 570 | 570 | 570 | (2)570 | |
| Fees Charged on Appeals | - | - | - | - | - | 2 | |
| Total Non-Respendable Revenue | 570 | 591 | 570 | 570 | 570 | 572 | |
(1) 2005-06: The $570,000 actual revenues are comprised of $486,260 of fees collected plus $83,740 of Health Canada's frozen allotment.
(2) 2007-08: The $570,000 actual revenues are comprised of $500,395 of fees collected plus $69,605 of Health Canada's frozen allotment.
Health Canada
Table 3: Sources of Respendable and Non-Respendable Revenue - (Millions of Dollars)
A variety of respendable revenues are collected which include Medical Devices, Radiation Dosimetry, Drug Submission Evaluation, Veterinary Drugs, Pest Management Regulation, Product Safety, hospital revenues resulting from payments for services provided to First Nations and Inuit Health hospitals, which are covered under provincial or territorial plans, and for the sale of drugs and health services for First Nations communities.
| 2005-2006 | 2006-2007 | 2007-2008 | ||||
|---|---|---|---|---|---|---|
| Revenus réels | Actual Revenues | Main Estimates | Planned Revenues | Total Authorities | Actual Revenues | |
| Program Activity / Branch | ||||||
| Health Products and Food | ||||||
| Health Products and Food Branch |
37.7
|
40.7
|
41.2
|
41.2
|
41.2
|
40.7
|
| Healthy Environments and Consumer Safety | ||||||
| Healthy Environments and Consumer Safety Branch |
12.0
|
12.5
|
15.7
|
15.7
|
15.7
|
14.7
|
| Pest Control Product Regulation | ||||||
| Pest Management Regulatory Agency |
5.9
|
7.4
|
7.0
|
7.0
|
7.0
|
8.2
|
| First Nations and Inuit Health | ||||||
| First Nations and Inuit Health Branch |
3.4
|
3.2
|
5.4
|
5.4
|
5.4
|
4.1
|
| Total Respendable Revenues |
58.9
|
63.8
|
69.3
|
69.3
|
69.3
|
67.7
|
| 2005-2006 | 2006-2007 | 2007-2008 | ||||
|---|---|---|---|---|---|---|
| Revenus réels | Actual Revenues | Main Estimates | Planned Revenues | Total Authorities | Actual Revenues | |
| Program Activity / Branch | ||||||
| Main Classification and Source | ||||||
| Non-tax revenues: | ||||||
| Refunds of expenditures |
10.0
|
40.2
|
32.0
|
|||
| Sales of goods and services |
2.6
|
3.5
|
5.8
|
|||
| Other fees and charges |
7.0
|
7.9
|
8.9
|
8.9
|
10.4
|
|
| Proceeds from the disposal of surplus Crown assets |
0.2
|
0.2
|
0.3
|
|||
| Miscellaneous non-tax revenues |
0.0
|
0.0
|
||||
| Total Non-Respendable Revenues |
19.8
|
51.8
|
0.0
|
8.9
|
8.9
|
48.5
|
| Total Revenues |
78.7
|
115.6
|
69.3
|
78.2
|
78.2
|
116.2
|
This table excludes amounts related to the Public Health Agency of Canada (PHAC).
Human Resources and Social Development Canada
TABLE 4: Sources of Respendable and Non-respendable Revenue
| TABLE 4: SOURCES OF RESPENDABLE AND NON-RESPENDABLE REVENUES | ||||||
| (millions of dollars) | 2005-2006 | 2006-2007 | 2007-2008 | |||
| Actualb | Actuala | Main Estimates | Planned Revenues | Authorities | Actual | |
| Respendable Revenue | ||||||
| Policy, Research and Communication | ||||||
| Employment Insurance Recovery | n/a | 160.4 | 132.0 | 132.0 | 159.8 | 157.3 |
| Canada Pension Plan Recovery | n/a | - | 5.7 | 5.7 | 6.5 | 2.3 |
| Labour Market | ||||||
| Employment Insurance Recovery | n/a | 32.2 | 31.9 | 31.2 | 33.3 | 28.5 |
| Workplace Skills | ||||||
| Employment Insurance Recovery | n/a | 48.0 | 34.6 | 34.7 | 47.6 | 38.6 |
| Learning | ||||||
| Employment Insurance Recovery | n/a | 33.0 | 22.2 | 22.2 | 28.0 | 22.5 |
| Labour | ||||||
| Worker's Compensation - OGD | n/a | 87.1 | 79.4 | 79.4 | 96.4 | 96.4 |
| Employment Insurance Recovery | n/a | 0.6 | 0.6 | 0.6 | 0.6 | 0.6 |
| Social Investment | ||||||
| Canada Pension Plan Recovery | n/a | 41.7 | 51.9 | 51.9 | 51.7 | 42.8 |
| Seamless, Citizen-Centred Service | ||||||
| Employment Insurance Recovery | n/a | 234.7 | 191.1 | 191.1 | 217.1 | 213.0 |
| Canada Pension Plan Recovery | n/a | 98.9 | 102.7 | 102.7 | 63.6 | 63.5 |
| PAPS - OGD | n/a | - | - | - | 5.0 | 3.0 |
| Integrity | ||||||
| Employment Insurance Recovery | n/a | 558.1 | 752.7 | 752.7 | 666.1 | 664.9 |
| Canada Pension Plan Recovery | n/a | 121.1 | 89.0 | 88.9 | 141.0 | 138.8 |
| Collaborative, Networked Government Service | ||||||
| Employment Insurance Recovery | n/a | 223.0 | 218.1 | 218.1 | 217.6 | 217.4 |
| Canada Pension Plan Recovery | n/a | 0.2 | - | - | - | - |
| Total Respendable Revenue | 1,695.6 | 1,639.0 | 1,711.9 | 1,711.2 | 1,734.3 | 1,689.6 |
| By Type: | ||||||
| Total Employment Insurance Recovery | 1,377.6 | 1,290.0 | 1,383.2 | 1,382.6 | 1,370.1 | 1,342.8 |
| Total Canada Pension Plan Recovery | 241.4 | 261.9 | 249.3 | 249.2 | 262.8 | 247.4 |
| Total Worker's Compensation - OGD | 76.6 | 87.1 | 79.4 | 79.4 | 96.4 | 96.4 |
| Total PAPS - OGD | - | - | - | - | 5.0 | 3.0 |
| Non-Respendable Revenue | ||||||
| Total EBP Recovery from EI | 140.9 | 127.9 | 134.0 | 134.0 | 132.5 | 132.5 |
| Total EBP Recovery from CPP | 29.0 | 29.6 | 19.9 | 20.0 | 27.7 | 27.7 |
| Adjustment to Prior Years' Payables | 8.7 | 8.5 | - | - | 9.0 | 9.0 |
| Canada Student Loans | 360.6 | 497.4 | - | 517.6 | 575.9 | 575.9 |
| Actuarial Surplus - Government Annuities Account | 3.5 | 2.9 | - | - | 2.6 | 2.6 |
| User Fees | ||||||
| Federal Workers' Compensation Administrative Fees | 2.1 | 2.2 | 2.3 | 2.3 | 2.2 | 2.2 |
| Labour Fire Protection Engineering Service Fees | 0.1 | 0.1 | - | - | - | - |
| Searches of the CPP and Old Age Security data bank to locate individuals | 0.1 | 0.2 | 0.1 | 0.1 | 0.2 | 0.2 |
| Social Insurance Number replacement card fee | 1.9 | 2.0 | 1.9 | 1.9 | 1.9 | 1.9 |
| Miscellaneous Items | 7.1 | 11.3 | - | - | 29.0 | 29.0 |
| Total Non-Respendable Revenue | 554.0 | 682.1 | 158.2 | 675.9 | 781.0 | 781.0 |
| a. 2006-2007 Actual have been restated to be comparable to the new Program Activity Architecture (PAA) approved. | ||||||
| b. Due to the numerous organizational changes that have occurred since 2005-2006, financial information from 2005-2006 cannot be presented on the basis of the 2007-2008 program activities included in this report. For historical information on actual expenditures in 2005-2006, please visit http://www.tbs-sct.gc.ca/dpr-rmr/2006-2007/index-eng.asp. | ||||||
Indian and Northern Affairs Canada and Canadian Polar Commission
Sources of Non-Respendable Revenue
| ($ millions) | Actual 2005–06 | Actual 2006–07 | 2007–08 | |||
|---|---|---|---|---|---|---|
| Main Estimates | Planned Revenue | Total Authorities | Actual Revenue | |||
| Indian and Northern Affairs Canada | ||||||
| Governance and Institutions of Government | ||||||
| Refunds of previous years' expenditures | 2.3 | 6.8 | 2.3 | 2.3 | 2.3 | 3.5 |
| Miscellaneous revenues | — | 0.1 | — | — | — | 0.4 |
| Co-operative Relationships | ||||||
| Refunds of previous years' expenditures | 1.0 | 0.9 | 1.0 | 1.0 | 1.0 | 1.5 |
| Return on investments | 9.4 | 7.3 | 9.4 | 9.4 | 9.4 | 6.7 |
| Miscellaneous revenues | — | 0.1 | — | — | — | 0.1 |
| Claims Settlements | ||||||
| Refunds of previous years' expenditures | — | — | — | — | — | 1.0 |
| Return on investments | — | — | — | — | — | 3.0 |
| Miscellaneous revenues | — | — | — | — | — | 0.2 |
| Northern Governance | ||||||
| Refunds of previous years' expenditures | — | — | — | — | — | 0.1 |
| Managing Individual Affairs | ||||||
| Refunds of previous years' expenditures | — | — | — | — | — | 0.1 |
| Education | ||||||
| Refunds of previous years' expenditures | 3.0 | 5.9 | 3.0 | 3.0 | 3.0 | 7.3 |
| Miscellaneous revenues | — | 0.2 | — | — | — | 1.0 |
| Social Development | ||||||
| Refunds of previous years' expenditures | 6.1 | 9.2 | 6.1 | 6.1 | 6.1 | 8.5 |
| Miscellaneous revenues | — | 0.2 | — | — | — | 1.9 |
| Healthy Northern Communities | ||||||
| Refunds of previous years' expenditures | 0.1 | 0.2 | — | — | — | 0.2 |
| Clarity of Title to Land and Resources | ||||||
| Refunds of previous years' expenditures | 0.2 | — | 0.2 | 0.2 | 0.2 | 0.1 |
| Responsible Federal Stewardship | ||||||
| Refunds of previous years' expenditures | 0.2 | 0.5 | 0.2 | 0.2 | 0.2 | 2.1 |
| First Nations Governance over Land, Resources and the Environment | ||||||
| Refunds of previous years' expenditures | 2.2 | 0.1 | 2.2 | 2.2 | 2.2 | 0.2 |
| Other non-tax revenues | 0.1 | — | — | — | — | — |
| Northern Land and Resources | ||||||
| Return on investments: | ||||||
| — Norman Wells Project profits | 131.9 | 123.3 | 113.0 | 113.0 | 113.0 | 115.8 |
| — Other | — | — | 0.5 | 0.5 | 0.5 | — |
| Refunds of previous years' expenditures | 0.2 | 0.5 | 1.2 | 1.2 | 1.2 | 1.8 |
| Adjustments of Prior Year's Payables at Year End | 0.3 | 0.2 | 1.1 | 1.1 | 1.1 | 0.1 |
| Canada mining | 77.9 | 18.7 | 32.0 | 32.0 | 32.0 | 63.6 |
| Quarrying royalties | 0.1 | 0.1 | 0.2 | 0.2 | 0.2 | 0.4 |
| Oil and gas royalties | 14.5 | 15.4 | 18.0 | 18.0 | 18.0 | 23.6 |
| Land, building and machinery rentals | 0.2 | 0.1 | — | — | — | 0.3 |
| Rights and Privileges | — | — | 4.1 | 4.1 | 4.1 | — |
| Other non-tax revenues | 29.5 | 32.0 | 1.7 | 1.7 | 1.7 | 28.8 |
| Economic and Employment Opportunities for Aboriginal People | ||||||
| Refunds of previous years' expenditures | 0.1 | — | 0.1 | 0.1 | 0.1 | — |
| Economic Development | ||||||
| Refunds of previous years' expenditures | 0.8 | 2.6 | 0.8 | 0.8 | 0.8 | 1.7 |
| Return on investments | 0.4 | 3.4 | 0.4 | 0.4 | 0.4 | 0.4 |
| Miscellaneous revenues | 6.6 | 6.7 | — | — | — | 0.2 |
| Community Infrastructure | ||||||
| Refunds of previous years' expenditures | 4.7 | 11.5 | 4.7 | 4.7 | 4.7 | 7.0 |
| Return on investments | 1.2 | 1.4 | 1.2 | 1.2 | 1.2 | 1.6 |
| Miscellaneous revenues | — | 0.2 | — | — | — | 0.7 |
| Northern Economy | ||||||
| Refunds of previous years' expenditures | 0.4 | 0.3 | — | — | — | 0.2 |
| Co-operative Relations | ||||||
| Refunds of previous years' expenditures | 0.4 | 0.2 | 0.4 | 0.4 | 0.4 | 0.9 |
| Departmental Management and Administration | ||||||
| Refunds of previous years' expenditures | 5.3 | — | 5.3 | 5.3 | 5.3 | — |
| Miscellaneous revenues | 0.7 | — | 0.7 | 0.7 | 0.7 | — |
|
|
||||||
| Total | 299.8 | 248.3 | 209.7 | 209.7 | 209.7 | 284.9 |
| Canadian Polar Commission | ||||||
| N/A | — | — | — | — | — | — |
| Due to rounding, figures may not add to totals shown. | ||||||
Industry Canada
Table 2: Sources of Respendable and Non–Respendable Revenue*
| ($ millions) | Actual 2005–06 |
Actual 2006–07 |
2007–08 | |||
|---|---|---|---|---|---|---|
| Main Estimates |
Planned Spending |
Total Authorities |
Actual | |||
| A Fair, Efficient and Competitive Marketplace | ||||||
| Operations Sector – Marketplace | ||||||
| Bankruptcy and Insolvency Administration | 31.9 | 32.3 | 31.9 | 31.9 | 31.9 | 31.9 |
| Corporations Regulation | 7.9 | 8.6 | 8.4 | 8.4 | 8.6 | 8.6 |
| Competition Bureau | ||||||
| Competition Law and Policy | 10.4 | 10.5 | 10.5 | 10.5 | 10.5 | 10.5 |
| Canadian Intellectual Property Office – Revolving Fund ** | 137.3 | 148.5 | 139.1 | 139.1 | 139.1 | 149.0 |
| Subtotal | 187.5 | 199.9 | 189.9 | 189.9 | 190.1 | 200.0 |
| An Innovative Economy | ||||||
| Communications Research Centre Canada | ||||||
| Communications Research | 8.4 | 8.9 | 8.7 | 8.7 | 10.8 | 10.8 |
| Subtotal | 8.4 | 8.9 | 8.7 | 8.7 | 10.8 | 10.8 |
| Total Respendable Revenue | 195.9 | 208.8 | 198.5 | 198.5 | 200.9 | 210.8 |
*Minor differences are due to rounding.
** As a Special Operating Agency within Industry Canada, with a revolving fund authority, the Canadian Intellectual Property Office finances its operations entirely from revenues generated by fees received from the provision of intellectual property (IP) services.
| ($ millions) | Actual 2005–06 |
Actual 2006–07 |
2007–08 | |||
|---|---|---|---|---|---|---|
| Main Estimates |
Planned Spending |
Total Authorities |
Actual | |||
| A Fair, Efficient and Competitive Marketplace | ||||||
| Operations Sector – Marketplace | ||||||
| Bankruptcy and Insolvency Supervision | 1.0 | 2.7 | 4.1 | 4.9 | ||
| Corporations Regulations (including NUANS) | 1.6 | 3.2 | 2.8 | 7.1 | ||
| Trade Measurement Regulation | 1.6 | 1.2 | 1.6 | 1.0 | ||
| Prior Year Refunds, interest and others *** | 26.7 | 24.6 | – | 19.3 | ||
| Competition Bureau – Marketplace | ||||||
| Fines | 8.1 | 6.6 | – | 14.7 | ||
| Consumer Labelling and Advertising Regulation | 0.1 | 0.1 | 0.1 | 0.1 | ||
| Prior Year Refunds, interest and other *** | 2.2 | 4.3 | – | 4.9 | ||
| Spectrum, Information Technologies and Telecommunications Sector – Marketplace ** | 205.6 | 205.0 | 210.9 | 205.6 | ||
| Office of Consumer Affairs – Prior Year Refunds, interest and other | 0.1 | |||||
| Subtotal | 247.0 | 247.7 | 219.6 | 257.7 | ||
| An Innovative Economy | ||||||
| Communications Research Centre Canada | ||||||
| Communications Research | 1.5 | 3.0 | 1.5 | 2.0 | ||
| Technology Partnerships Canada – Special Operating Agency | ||||||
| Receipts from Repayable Contributions | 79.9 | 92.0 | 101.8 | 140.3 | ||
| Prior Year Refunds, interest and other *** | 11.3 | 22.9 | – | 12.2 | ||
| Spectrum, Information Technologies and Telecommunications Sector | ||||||
| Receipts from Repayable Contributions | – | 5.7 | ||||
| Prior Year Refunds, interest and other *** | – | 0.3 | ||||
| Subtotal | 92.8 | 117.9 | 103.3 | 160.5 | ||
| Competitive Industries and Sustainable Communities | ||||||
| Spectrum, Information Technologies and Telecommunications Sector – Economic Development | 2.1 | 1.9 | – | 0.7 | ||
| Operations Sector – Economic Development | ||||||
| Small Business Loans Act (SBLA)/Canada Small Business Financing Act (CSBFA) Service Fees | 59.3 | 60.0 | 59.3 | 56.6 | ||
| Receipts from Repayable Contributions | 20.3 | 7.9 | 12.0 | 7.8 | ||
| Return on Investment | 18.2 | 21.1 | 21.0 | 21.7 | ||
| Prior Year Refunds, interest and other *** | 3.0 | 16.0 | – | 2.7 | ||
| Industry Sector – Economic Development | ||||||
| Receipts from Repayable Contributions | 32.9 | 40.1 | 41.1 | 47.8 | ||
| Prior Year Refunds, interest and other *** | 9.9 | 9.7 | – | 13.7 | ||
| Subtotal | 145.7 | 156.7 | 133.5 | 151.0 | ||
| Total Non–Respendable Revenue | 485.4 | 522.3 | 456.3 | 569.2 | ||
*Minor differences are due to rounding.
** Revenues do not include deferred revenues being realized in relationship to the amortization of licence fee revenue received in previous years.
*** Certain non-respendable revenue cannot be planned for given the nature of the revenue.
Library and Archives Canada
Table 4: Sources of Respendable and Non-Respendable Revenue
Respendable Revenue
|
($ thousands) |
Actual 2005-2006 |
Actual 2006-2007 |
2007-2008 |
|||
|---|---|---|---|---|---|---|
|
Main Estimates |
Planned Revenue |
Total Authorities |
Actual |
|||
|
Making the documentary heritage known and accessible for use |
|
|
|
|
|
|
|
Service Fees |
487.0 |
415.1 |
550.0 |
550.0 |
550.0 |
441.7 |
|
Total Respendable Revenue |
487.0 |
415.1 |
550.0 |
550.0 |
550.0 |
441.7 |
Non-respendable Revenue
|
($ thousands) |
Actual 2005-2006 |
Actual 2006-2007 |
2007-2008 |
|||
|---|---|---|---|---|---|---|
|
Main Estimates |
Planned Revenue |
Total Authorities |
Actual |
|||
|
Managing the disposition of the Government of Canada Records of continuing value |
|
|
|
|
|
|
|
Refunds of previous years, expenditures |
11.1 |
8.9 |
- |
- |
- |
1.2 |
|
Adjustments to prior year's payable |
15.1 |
6.9 |
- |
- |
- |
14.5 |
|
Proceeds from the disposal of surplus Crown Assets |
23.1 |
12.8 |
- |
- |
14.8 |
10.5 |
|
Miscellaneous revenues |
4.6 |
4.5 |
- |
3.2 |
- |
5.0 |
|
Other adjustment |
1.7 |
(0.3) |
- |
- |
- |
1.3 |
|
Managing the documentary heritage of interest to Canada |
|
|
|
|
|
|
|
Refunds of previous year's expenditures |
54.3 |
30.7 |
- |
- |
- |
20.5 |
|
Adjustments to prior year's Payables |
76.7 |
19.8 |
- |
- |
- |
78.1 |
|
Proceeds from the disposal of surplus Crown Assets |
116.4 |
75.1 |
- |
- |
84.7 |
36.3 |
|
Miscellaneous revenues |
23.3 |
25.4 |
- |
17.8 |
- |
28.5 |
|
Other adjustment |
8.3 |
(1.4) |
- |
- |
- |
7.7 |
|
Making the documentary heritage known and accessible for use |
|
|
|
|
|
|
|
Refunds of previous years, expenditures |
13.2 |
24.8 |
- |
- |
- |
7.4 |
|
Adjustments to prior year's payables |
24.4 |
6.1 |
- |
- |
- |
55.8 |
|
Proceeds from the disposal of surplus Crown Assets |
37.1 |
24.9 |
- |
- |
58.4 |
37.9 |
|
Miscellaneous revenues |
10.1 |
8.7 |
- |
12.0 |
- |
21.1 |
|
Other adjustment |
2.7 |
(0.4) |
- |
- |
- |
5.2 |
|
Total Non-Respendable Revenue |
422.1 |
246.5 |
0 |
33.0 |
157.9 |
331.1 |
|
Total Revenue |
909.1 |
661.6 |
550.0 |
583.0 |
707.9 |
772.8 |
National Defence
Table 2: Sources of Respendable and Non-Respendable Revenue
Respendable Revenue
| ($ thousands) | Actual 2 2005-2006 | Actual 2006-2007 | 2007-2008 | |||
|---|---|---|---|---|---|---|
| Main Estimates | Planned Revenues | Total Authorities |
Actual 1 | |||
| Generate and Sustain Relevant, Responsive and Effective Combat-Capable Integrated Forces | ||||||
| Recoveries from Members |
122,441 |
124,849 |
118,888 |
118,888 |
132,345 |
132,345 |
| Recoveries from OGDs |
6,071 |
5,432 |
12,272 |
12,272 |
5,708 |
5,708 |
| Recoveries from Other Governments/UN/NATO |
19,642 |
16,993 |
4,900 |
4,900 |
889 |
889 |
| Other Recoveries |
43,570 |
45,965 |
25,991 |
25,991 |
41,077 |
41,077 |
| Subtotal |
191,725 |
193,239 |
162,051 |
162,051 |
180,019 |
180,019 |
| Conduct Operations | ||||||
| Recoveries from Members |
3,403 |
3,470 |
1,592 |
1,592 |
2,362 |
2,362 |
| Recoveries from OGDs |
780 |
697 |
296 |
296 |
522 |
522 |
| Recoveries from Other Governments/UN/NATO |
23,376 |
20,224 |
7,577 |
7,577 |
18,617 |
18,617 |
| Other Recoveries |
3,496 |
3,688 |
899 |
899 |
1,673 |
1,673 |
| Subtotal |
31,055 |
28,079 |
10,364 |
10,364 |
23,175 |
23,175 |
| Contribute to Canadian Government, Society and International Community in Accordance with Canadian Interests and Values | ||||||
| Recoveries from Members |
815 |
831 |
1,005 |
1,005 |
616 |
616 |
| Recoveries from OGDs |
11,365 |
10,168 |
6,959 |
6,959 |
7,330 |
7,330 |
| Recoveries from Other Governments/UN/NATO |
226,613 |
196,052 |
208,883 |
208,883 |
211,517 |
211,517 |
| Other Recoveries |
5,921 |
6,247 |
5,686 |
5,686 |
21,584 |
21,584 |
| Subtotal |
244,714 |
213,298 |
222,533 |
222,533 |
241,047 |
241,047 |
| Total Respendable Revenue |
467,494 |
434,616 |
394,948 |
394,948 |
444,242 |
444,242 |
Non-Respendable Revenue 3
| ($ thousands) | Actual 2 2005-2006 |
Actual 2006-2007 |
2007-2008 | |||
|---|---|---|---|---|---|---|
| Main Estimates | Planned Revenues | Total Authorities |
Actual 1 | |||
| Generate and Sustain Relevant, Responsive and Effective Combat-Capable Integrated Forces | ||||||
| Return on investments |
18,568 |
9,030 |
N/A |
- |
- |
4,669 |
| Refunds of previous years' expenditures |
86,870 |
64,535 |
N/A |
- |
- |
48,421 |
| Proceeds from disposal of surplus Crown assets |
15,898 |
19,200 |
N/A |
- |
- |
15,149 |
| Other revenue |
10,174 |
9,674 |
N/A |
- |
- |
28,903 |
| Subtotal |
131,510 |
102,439 |
- |
- |
- |
97,143 |
| Conduct Operations | ||||||
| Return on investments |
144 |
70 |
N/A |
- |
- |
93 |
| Refunds of previous years' expenditures |
13,941 |
10,357 |
N/A |
- |
- |
10,214 |
| Proceeds from disposal of surplus Crown assets |
823 |
994 |
N/A |
- |
- |
1,688 |
| Other revenue |
1,595 |
1,516 |
N/A |
- |
- |
5,576 |
| Subtotal |
16,503 |
12,937 |
- |
- |
- |
17,571 |
| Contribute to Canadian Government, Society and International Community in Accordance with Canadian Interest and Values | ||||||
| Return on investments |
617 |
300 |
N/A |
- |
- |
25 |
| Refunds of previous years' expenditures |
3,896 |
2,894 |
N/A |
- |
- |
5,330 |
| Proceeds from disposal of surplus Crown assets |
229 |
276 |
N/A |
- |
- |
563 |
| Other revenue |
1,014 |
964 |
N/A |
25,584 |
25,584 |
3,515 |
| Subtotal |
5,756 |
4,435 |
- |
25,584 |
25,584 |
9,433 |
| Total Non-Respendable Revenue |
153,769 |
119,811 |
- |
25,584 |
25,584 |
124,147 |
| Total Revenue |
621,263 |
554,427 |
394,948 |
420,532 |
469,826 |
568,388 |
* Due to rounding, figures may not add up to totals shown
Notes:
- The Respendable Revenues are $49.3 million higher than initial Planned Revenues due to the following: an increase in Revenue of $32.8 million associated with increased recoveries from foreign militaries for training, fuel, facilities operating costs, communications and North Warning System cost sharing arrangements, increased revenue for facility rentals were $6.0 million over planned estimates and Other Revenue increase $10.5 million from a number of diverse financial recovery areas.
- The Respendable Revenue allocation by PAA is different than the 2005-2006 Actual reported in Table 7 Sources of Respendable and Non-Respendable Revenue in the 2006-2007 RPP due to an improved methodology used for the allocation by PAA.
- The planned Non-Respendable Revenue of $25.6 million relating to the payment due from Germany for its share of the costs of any future cleanup of the training area at CFB Shilo of unexploded ordinance was received in 2007-2008 and the majority of the Non-Respendable Revenue was recorded under Generate and Sustain Relevant, Responsive and Effective Combat-Capable Integrated Forces.
National Energy Board
Table 10: Sources of Non-Respendable Revenue
| Non-Respendable Revenue ($ millions) | ||||||
|
Actual 2005-06 |
Actual 2006-07 |
2007-2008 | ||||
|
Main Estimates |
Planned Revenue |
Total Authorities |
Actual | |||
| Energy Regulation and Advice | 38.6 | 35.6 | 39.6 | 39.6 | 39.6 | 41.6 |
| Total Non-respendable Revenue | 38.6 | 39.4 | 39.6 | 39.6 | 39.6 | 41.6 |
The NEB is an independent regulatory agency, established in 1959 under the NEB Act. The NEB Act authorizes the Board to charge those companies it regulates costs attributable to the NEB’s operations in carrying out its related responsibilities.
National Film Board
Table 4 : Sources of Respendable Revenue
| ($ thousands) | Actual 2005 2006 | Actual 2006-2007 | 2007–2008 | |||
| Main Estimates | Planned Revenue | Total Authorities | Actual | |||
| Production | 960 | 831 | 2,133 | 2,133 | 2,133 | 1,151 |
| Distribution | 7,173 | 5,257 | 5,811 | 5,811 | 5,811 | 5,267 |
| Accessibility | 534 | 462 | 177 | 177 | 177 | 470 |
| Research | 215 | 80 | 172 | 172 | 172 | 16 |
| Total Respensable Revenue | 8,882 | 6,630 | 8,293 | 8,293 | 8,293 | 6,904 |
National Parole Board
Respendable Revenue
The Board does not have any Respendable Revenue.
Non-respendable Revenue
There is a $50.00 user fee for the processing of pardon applications. Of the $50.00, the Board can access $35.00. The remaining $15.00 go to the RCMP. The Board is not allowed to respend revenues from this fee in the year they are collected. It can, however, access these revenues the following fiscal year through the Supplementary Estimates process. In 2007-08, the pardon user fee generated revenues of $1,438,491. Of this total, the Board could access 70% or $1,006,944 in 2008-09.
| Actual 2005-06 | Actual 2006-07 | 2007-08 | ||||
|---|---|---|---|---|---|---|
| Main Estimates | Planned Revenue | Total Authorities | Actual | |||
| Pardon user fees | 714 | 969 | N/A | 700 | N/A | 1,438 |
| Total Non-respendable Revenue | 714 | 969 | N/A | 700 | N/A | 1,438 |
National Research Council Canada
|
|
|
2007-2008 |
|||
|---|---|---|---|---|---|---|
Program Activity |
Actual 2005-06 |
Actual 2006-07 |
Main Estimates |
Planned Revenue |
Total Authorities |
Actual |
Research and Development |
|
|
|
|
|
|
| Fee for Service |
38.7 |
54.0 |
45.9 |
45.9 |
49.5 |
49.5 |
| Rentals |
3.1 |
3.0 |
3.6 |
3.6 |
3.8 |
3.8 |
| Royalties |
6.3 |
5.5 |
3.8 |
3.8 |
8.6 |
8.6 |
| Publications |
3.0 |
4.6 |
|
|
3.1 |
3.1 |
| Other |
3.1 |
|
3.5 |
3.5 |
0.0 |
0.0 |
Revenues Available for Use from Prior Years |
|
|
|
|
72.4 |
|
|
|
|
|
|
|
|
Technology and Industry Support |
|
|
|
|
|
|
| Fee for Service |
6.1 |
7.8 |
27.4 |
27.4 |
12.6 |
12.6 |
| Rentals |
0.1 |
|
0.2 |
0.2 |
|
|
| Royalties |
|
|
|
|
|
|
| Publications |
21.3 |
15.5 |
|
|
2.2 |
2.2 |
| Other |
1.6 |
2.7 |
|
|
4.9 |
4.9 |
Revenues Available for Use from Prior Years |
|
|
|
|
5.7 |
|
|
|
|
|
|
|
|
Total Respendable Revenues |
83.3 |
93.1 |
84.4 |
84.4 |
162.7 |
84.6 |
|
|
|
|
|
|
|
Notes
|
||||||
2007-08 |
|||
|---|---|---|---|
Organization |
Research and Development |
Technology and Industry Support |
Total |
Research Institutes |
|
|
|
Main Estimates |
459.5 |
|
459.5 |
Planned Spending |
492.3 |
|
492.3 |
Total Authorities |
636.4 |
|
636.4 |
Actuals |
549.5 |
|
549.5 |
Industrial Research Assistance Program |
|
|
|
Main Estimates |
|
146.0 |
146.0 |
Planned Spending |
|
150.8 |
150.8 |
Total Authorities |
|
157.3 |
157.3 |
Actuals |
|
152.0 |
152.0 |
Scientific and Technical Information |
|
|
|
Main Estimates |
|
60.0 |
60.0 |
Planned Spending |
|
62.0 |
62.0 |
Total Authorities |
|
64.7 |
64.7 |
Actuals |
|
62.5 |
62.5 |
Technology Centres |
|
|
|
Main Estimates |
|
6.9 |
6.9 |
Planned Spending |
|
7.1 |
7.1 |
Total Authorities |
|
7.5 |
7.5 |
Actuals |
|
7.2 |
7.2 |
TOTAL |
|
|
|
Main Estimates |
459.5 |
212.9 |
672.4 |
Planned Spending |
492.3 |
220.0 |
712.3 |
Total Authorities |
636.4 |
229.5 |
865.9 |
Actuals |
549.5 |
221.6 |
771.1 |
|
|||
Notes
|
|||
National Round Table on the Environment and the Economy
Table 3: Sources of Respendable and Non-Respendable Revenue
| ($ millions) |
Actual 2005–2006 |
Actual 2006–2007 |
2007–2008 | |||
| Main Estimates | Planned Revenue | Total Authorities | Actual | |||
| Provide advice on environment and economy issues | ||||||
| Sale of publications pursuant to Paragraph 29.1(1) of the Financial Administration Act | 2.9 | .9 | 20 | 20 | 20 | .9 |
| Total Respendable Revenue | 2.9 | .9 | 20 | 20 | 20 | .9 |
Under the NRTEE Act and Paragraph 29.1(1) of the Financial Administration Act, the NRTEE has the authority to spend any revenues received.
Natural Resources Canada
5. Sources of Respendable and Non-Respendable Revenues by Program Activity
Respendable Revenue
| ($ millions) | Actual 2005–06 | Actual 2006–07 | 2007–08 | |||
|---|---|---|---|---|---|---|
| Main Estimates | Planned Revenue | Total Authorities | Actual | |||
| Earth Sciences * | 19.7 | 13.5 | 6.7 | 6.7 | 6.7 | 6.0 |
| Energy | 7.7 | 9.2 | 10.8 | 12.8 | 12.8 | 11.3 |
| Forest | 1.7 | 1.4 | 2.0 | 2.0 | 2.0 | 1.2 |
| Minerals and Metals | 7.4 | 7.0 | 7.6 | 7.6 | 7.6 | 7.8 |
| Total Respendable Revenue | 36.5 | 31.1 | 27.1 | 29.1 | 29.1 | 26.3 |
Non-Respendable Revenue
| ($ millions) | Actual 2005–06 | Actual 2006–07 | 2007–08 | |||
|---|---|---|---|---|---|---|
| Main Estimates | Planned Revenue | Total Authorities | Actual | |||
| Earth Sciences * | 2.2 | 3.3 | 0.3 | 0.3 | 3.0 | 3.0 |
| Energy | 560.5 | 463.4 | 498.2 | 1,041.1 | 1,887.6 | 1,887.6 |
| Forest | 1.6 | 0.9 | 0.0 | 0.0 | 1.3 | 1.3 |
| Minerals and Metals | 0.6 | 0.7 | 0.2 | 0.2 | 2.7 | 2.7 |
| Total Non-Respendable Revenue | 564.9 | 468.3 | 498.7 | 1,041.6 | 1,894.6 | 1,894.6 |
* Includes Earth Sciences – Geomatics Canada Revolving Fund.
Natural Sciences and Engineering Research Council of Canada
NSERC Sources of Respendable and Non-Respendable Revenue
| Natural Sciences and Engineering Research Council ($ millions) | Actual | Actual | 2007–2008 | |||
|---|---|---|---|---|---|---|
| 2005–2006 | 2006–2007 | Main Estimates | Planned Revenue | Total Authorities | Actual | |
| Refunds of previous years' expenditures | -$1.1 | -$1.6 | N/A | -$1.0 | N/A | $0.0 |
| Total Non-Respendable Revenue | -$1.1 | -$1.6 | N/A | -$1.0 | N/A | $0.0 |
Northern Pipeline Agency
Table 4 - Non-Respendable Revenues
| 2007-2008 | |||||
|---|---|---|---|---|---|
| Actual 2005-06 |
Actual 2006-07 |
Planned Revenue |
Total Authorities |
Actual | |
| Northern Pipeline Agency | 951 | 595 | 290 | 313 | 28 |
| Unplanned | - | - | - | - | - |
| Total Non-Respendable Revenue | 951 | 595 | 290 | 313 | 28 |
| Total Revenues(1) | 951 | 595 | 290 | 313 | 28 |
(1) Refer to Note 1 on page 10.
Office of the Commissioner for Federal Judicial Affairs
Table: Sources of Respendable and Non-Respendable Revenue
| ($ millions) | Actual 2005-06 | Actual 2006-07 | 2007-2008 | |||
|---|---|---|---|---|---|---|
| Main Estimates | Planned Revenue | Total Authorities | Actual | |||
| Federal Judicial Affairs | ||||||
| Office of the Umpire for Employment Insurance | .05 | .05 | .05 | .05 | .05 | .05 |
| Administrative Agreement with Canadian International Development Agency | .076 | .123 | .225 | .225 | .124 | .124 |
| Total Respendable Revenue | .121 | .173 | .275 | .275 | .174 | .174 |
| ($ millions) | Actual 2005-06 | Actual 2006-07 | 2007-2008 | |||
|---|---|---|---|---|---|---|
| Main Estimates | Planned Revenue | Total Authorities | Actual | |||
| Payments Pursuant to the Judges Act | ||||||
| Judges’ Contributions to Pension Fund | 10.5 | 12.5 | 13.8 | 13.8 | 12.1 | 12.1 |
| Total Non-Respendable Revenue | 10.5 | 12.5 | 13.8 | 13.8 | 12.1 | 12.1 |
Office of the Registrar of Lobbyists
Table 3: Sources of Non-Respendable Revenue
| (in dollars) | Actual 2005-2006* | Actual 2006-2007 | 2007-2008 | |||
|---|---|---|---|---|---|---|
| Main Estimates | Planned Revenue | Total Authorities | Actual | |||
| Registration of Lobbyists | ||||||
| Registration fees | - | 750 | N/A | 2 000 | N/A | 900 |
| Other | - | - | N/A | - | N/A | 111 |
| Sub-Total | - | 750 | N/A | 2 000 | N/A | 1 011 |
| Education and Research | ||||||
| Other | - | 5 | N/A | - | N/A | 10 |
| Total Non-Respendable Revenue | - | 755 | N/A | 2 000 | N/A | 1 021 |
* Actual revenue information for fiscal year 2005-2006 was reported under Industry Canada.
Office of the Superintendent of Financial Institutions Canada
Table 3: Sources of Respendable and Non-Respendable Revenue
This table identifies revenues by program activity received from sources both internal and external to the government. For 2007-2008, OSFI’s total revenues were $90.5 million, including non-respendable revenue of $374 thousand for the collection of Late and Erroneous Filing Penalties. The respendable revenues are largely comprised of asset- or premium-based industry assessments, surcharge assessments to staged institutions, and user fees for specific services related to Regulatory Approvals. The majority of cost-recovered services in Regulation and Supervision of Federally Regulated Financial Institutions relates to implementing the internal ratings-based approach of the New Basel Capital Accord.
Respendable Revenues
The increase in respendable revenues in 2007-2008 from the previous year is largely due to increases in Base Assessment revenue and increases in Pension Fee Revenue. The 2007-2008 Pension Fee rate was $24.00 per member, 45% higher than the 2006-2007 rate. This rate increase was required in order to recover an accumulated deficit from the last 3 years as a result of directing incremental resources to problem pension plans.
| ($ thousands) | Actual 2005-2006 |
Actual 2006-2007 |
2007‑2008 | |||
| Main Estimates |
Planned Revenues |
Total Authorities |
Actual | |||
| (1) Regulation and Supervision of Federally Regulated Financial Institutions | ||||||
| Base Assessments | 67,726 | 60,375 | 70,489 | 70,489 | 70,489 | 70,080 |
| User Fees and Charges | 6,268 | 3,588 | 2,147 | 2,147 | 2,147 | 3,226 |
| Cost-Recovered Services | 3,515 | 4,248 | 3,278 | 3,278 | 3,278 | 3,403 |
| (2) Regulation and Supervision of Federally Regulated Private Pension Plans | ||||||
| Pension Plan Fees | 3,809 | 5,281 | 6,513 | 6,513 | 6,513 | 7,220 |
| (3) International Assistance | ||||||
| Base Assessments | - | 93 | 519 | 519 | 519 | - |
| Cost-Recovered Services | 1,378 | 1,610 | 1,507 | 1,507 | 1,507 | 1,582 |
| (4) Office of the Chief Actuary | ||||||
| User Fees and Charges | 96 | 145 | 35 | 35 | 35 | 21 |
| Cost-Recovered Services | 3,993 | 3,919 | 5,247 | 5,247 | 5,247 | 4,527 |
| Total Respendable Revenues | 86,784 | 79,259 | 89,735 | 89,735 | 89,735 | 90,059 |
Non-Respendable Revenues
The non-respendable revenues are all related to late and erroneous filing penalties. Effective 2002-2003, OSFI began collecting late and erroneous filing penalties from financial institutions that submit late and/or erroneous financial and corporate returns. On August 31, 2005 the Administrative Monetary Penalties (OSFI) Regulations came into force. These Regulations implement an administrative monetary penalties regime pursuant to which the Superintendent can impose penalties in respect of specific violations, as designated in the schedule to the Regulations. These Regulations incorporate the late and erroneous filing penalty regime and replace the Filing Penalties (OSFI) Regulations.These penalties are billed quarterly, collected and remitted to the Consolidated Revenue Fund. By regulation, OSFI cannot use these funds to reduce the amount that it assesses the industry in respect of its operating costs.
| ($ thousands) | Actual 2005- 2006 |
Actual 2006- 2007 |
2007-2008 | |||
| Main Estimates |
Planned Revenues |
Total Authorities |
Actual | |||
| Regulation and Supervision of Federally Regulated Financial Institutions | ||||||
| Filing Penalties | 805 | 227 | 450 | 450 | 450 | 374 |
| Total Non-Respendable Revenues | 805 | 227 | 450 | 450 | 450 | 374 |
Parks Canada
Sources of Respendable Revenue (in thousands of dollars)
| Program Activity | Actual 2005‑2006 |
Actual 2006‑2007 |
2007‑2008 | |||
| Main Estimates |
Planned Revenue |
Total Authorities |
Actual | |||
| Promote Public Appreciation and Understanding | ||||||
| *Heritage Presentation Programs | 756 | 785 | 0 | 0 | 0 | 0 |
| 756 | 785 | 0 | 0 | 0 | 0 | |
| Enhance Visitor Experience | ||||||
| Entrance Fees | 42,869 | 48,958 | 45,180 | 45,180 | 50,199 | 50,199 |
| Camping Fees | 14,578 | 14,748 | 18,131 | 18,131 | 16,713 | 16,713 |
| Lockage and Mooring Fees | 2,316 | 2,548 | 2,728 | 2,728 | 2,688 | 2,688 |
| Pools | 3,577 | 3,847 | 3,603 | 3,603 | 4,099 | 4,099 |
| *Heritage Presentation Programs | 796 | 796 | 796 | 796 | ||
| Other Recreational Fees | 3,070 | 3,060 | 3,867 | 3,867 | 2,962 | 2,962 |
| 66,409 | 73,161 | 74,358 | 74,358 | 77,457 | 77,457 | |
| Townsite Management | ||||||
| Municipal Service Fees | 2,663 | 2,716 | 2,676 | 2,676 | 2,890 | 2,890 |
| 2,663 | 2,716 | 2,676 | 2,676 | 2,890 | 2,890 | |
| Other Revenue | ||||||
| Real Property Rentals and Business Fees | 17,269 | 17,248 | 17,614 | 17,614 | 17,624 | 17,624 |
| Miscellaneous | 13,320 | 13,587 | 9,352 | 9,352 | 9,357 | 9,357 |
| 30,589 | 30,835 | 26,966 | 26,966 | 26,981 | 26,981 | |
| Total Respendable Revenue | 100,418 | 107,496 | 104,000 | 104,000 | 107,328 | 107,328 |
*Note: The variance between 2006-2007 and 2007-2008 actual revenues for Promote Public Appreciation and Understanding is attributable to the realignment of
Heritage Presentation Program revenues to Enhance Visitor Experience.
Totals may not agree due to rounding.
Patented Medicine Prices Review Board
Financial Table 3: Sources of Non-Respendable Revenue
| ($ thousands) | Actual 2005-2006 |
Actual 2006-2007 |
2007-2008 | |||
|---|---|---|---|---|---|---|
| Main Estimates | Planned Revenue | Total Authorities | Actual | |||
| Patented Medicine Prices Review Board | ||||||
| Source of non-respendable revenue(1) | ||||||
| Voluntary Compliance Undertakings | 1,413.3 | 210.0 | - | - | - | 10,566.5 |
| Total Non-Respendable Revenue | 1,413.3 | 210.0 | - | - | - | 10,655.5 |
(1) The money reported as non-respendable revenue does not represent revenues generated by the PMPRB. This money is a result of payments made by patentees to the Government of Canada through Voluntary Compliance Undertakings (VCUs) or Board orders to offset excess revenues. The Minister may enter into agreements with any province respecting the distribution to that province of amounts received by the Receiver General, less any costs incurred in relation to the collection and distribution of those amounts.
Privy Council Office
Table 4: Sources of Non-Respendable Revenue
| Actual 2005-2006 |
Actual 2006-2007 |
2007-2008 | |||
| Planned Revenue | Total Authorities | Actual | |||
| (thousands of dollars) | |||||
| Support for Cabinet decision making and the legislative agenda | |||||
| Refunds of previous year’s expenditures | 4 | 2 | 5 | 5 | - |
| Adjustments to prior year’s payables | 22 | 52 | 5 | 5 | 24 |
| Other revenues | 1 | 1 | 1 | 1 | 2 |
| Sub total | 27 | 55 | 11 | 11 | 26 |
| Advice to the Prime Minister and ministers on issues, policies, machinery and appointments | |||||
| Refunds of previous year’s expenditures | 58 | 46 | 118 | 118 | 23 |
| Adjustments to prior year’s payables | 301 | 605 | 105 | 105 | 310 |
| Sale of statutory instruments pursuant to the Statutory Instruments Act | 1 | 1 | 1 | 1 | 1 |
| Revenues pursuant to the Access to Information Act and Privacy Act | 1 | 2 | 4 | 4 | 1 |
| Other revenues | 10 | 8 | 11 | 11 | 21 |
| Sub total | 371 | 662 | 239 | 239 | 356 |
| Provide Cabinet with sound advice on the development, coordination and implementation of the policy agenda | |||||
| Refunds of previous year’s expenditures | 33 | 13 | 26 | 26 | 2 |
| Adjustments to prior year’s payables | 114 | 255 | 34 | 34 | 111 |
| Revenues pursuant to the Access to Information Act and Privacy Act | - | 1 | - | - | 1 |
| Other revenues | 8 | 3 | 5 | 5 | 8 |
| Sub total | 155 | 272 | 65 | 65 | 122 |
| As its head, the Clerk leads the Public Service in effectively supporting Cabinet and serving Canadians | |||||
| Refunds of previous year’s expenditures | 6 | 3 | 6 | 6 | 0 |
| Adjustments to prior year’s payables | 31 | 93 | 7 | 7 | 36 |
| Proceeds from sales | 5 | 9 | 7 | 7 | 3 |
| Other revenues | 1 | 1 | 1 | 1 | 3 |
| Sub total | 43 | 106 | 21 | 21 | 42 |
| Provide the Prime Minister’s Office and the offices of the portfolio ministers with financial and administrative support | |||||
| Refunds of previous year’s expenditures | 38 | 20 | 45 | 45 | 19 |
| Adjustments to prior year’s payables | 181 | 421 | 40 | 40 | 196 |
| Revenues pursuant to the Access to Information Act and Privacy Act | 1 | 1 | - | - | 1 |
| Proceeds from sales | 1 | - | - | - | - |
| Other revenues | 6 | 6 | 8 | 8 | 12 |
| Sub total | 227 | 448 | 93 | 93 | 228 |
| Provide commissions of inquiry with appropriate administrative support | |||||
| Refunds of previous year’s expenditures | 3 | - | 11 | 11 | 3 |
| Adjustments to prior year’s payables | 430 | 38 | 410 | 410 | 1,057 |
| Proceeds from sales | - | - | - | - | 1 |
| Other revenues | - | - | - | - | 2 |
| Sub total | 433 | 38 | 421 | 421 | 1,063 |
| Total - Refunds of previous year’s expenditures | 142 | 84 | 211 | 211 | 47 |
| Total - Adjustments to prior year’s payables | 1,079 | 1,464 | 601 | 601 | 1,734 |
| Total - Sale of statutory instruments pursuant to the Statutory Instruments Act | 1 | 1 | 1 | 1 | 1 |
| Total - Revenues pursuant to the Access to Information Act and Privacy Act | 2 | 4 | 4 | 4 | 3 |
| Total - Proceeds from sales | 6 | 9 | 7 | 7 | 4 |
| Total - Other revenues | 26 | 19 | 26 | 26 | 48 |
| Total Non-respendable Revenue | 1,256 | 1,581 | 850 | 850 | 1,837 |
Public Health Agency of Canada
Respendable Revenue
| ($ millions) | Actual 2005‑06 |
Actual 2006‑07 |
2007–08 | |||
| Main Estimates |
Planned Revenue |
Total Authorities |
Actual | |||
| Emergency Preparedness and Response* Sale to federal and provincial/territorial departments and agencies, airports and other federally regulated organizations of first aid kits to be used in disaster and emergency situations ($45,057) |
0.1 | 0.1 | 0.1 | 0.1 | 0.1 | 0.1 |
| Total Respendable Revenue | 0.1 | 0.1 | 0.1 | 0.1 | 0.1 | 0.1 |
* New 2007-08 program activity. For 2005-06 and 2006-07, the Agency had only one program activity called Population and Public Health.
Non-respendable Revenue
| ($ millions) | Actual 2005–06 |
Actual 2006–07 |
2007–08 | |||
| Main Estimates |
Planned Revenue |
Total Authorities |
Actual | |||
| Services of a non-regulatory nature: | ||||||
| Sale of first aid kits / net vote revenue surplus | 0.1 | 0.0 | 0.0 | 0.0 | 0.0 | 0.0 |
| Royalties and other miscellaneous revenues | 0.0 | 0.1 | 0.0 | 0.0 | 0.0 | 0.2 |
| Other – credit card rebates | 0.1 | 0.2 | 0.0 | 0.0 | 0.0 | 0.3 |
| Total Non-respendable Revenue | 0.2 | 0.3 | 0.0 | 0.0 | 0.0 | 0.5 |
Public Prosecution Service of Canada
Table 3: Sources of Respendable and Non-Respendable Revenue
| Respendable Revenue ($ thousands) | 2007–2008 | |||||
|
Actual 2005–06 |
Actual 2006–07 |
Main Estimates |
Planned Revenue |
Total Authorities |
Actual | |
| Prosecution of drug, organized crime and Criminal Code offences |
N/A
|
N/A
|
N/A
|
N/A
|
N/A
|
N/A
|
| Prosecution of federal offences to protect the environment, natural resources, economic and social health |
N/A
|
N/A
|
N/A
|
N/A
|
N/A
|
N/A
|
| Net voted revenue (Legal Services) |
|
|
11,342
|
11,342
|
10,809
|
10,809
|
| Addressing criminal issues to contribute to a safer world for Canada |
N/A
|
N/A
|
N/A
|
N/A
|
N/A
|
N/A
|
| Promoting a fair and effective justice system that reflects Canadian values within a prosecutorial context |
N/A
|
N/A
|
N/A
|
N/A
|
N/A
|
N/A
|
| Total Respendable Revenue |
-
|
-
|
11,342
|
11,342
|
10,809
|
10,809
|
| Non-Respendable Revenue ($ thousands) | 2007–2008 | |||||
|
Actual 2005–06 |
Actual 2006–07 |
Main Estimates |
Planned Revenue |
Total Authorities |
Actual | |
| Prosecution of drug, organized crime and Criminal Code offences |
N/A
|
N/A
|
N/A
|
N/A
|
N/A
|
N/A
|
| Lease and Use of Public Properties |
N/A
|
N/A
|
0 | 0 | 0 | 316 |
| Miscellaneous |
N/A
|
N/A
|
0 | 0 | 0 | 4 |
| Prosecution of federal offences to protect the environment, natural resources, economic and social health |
N/A
|
N/A
|
N/A
|
N/A
|
N/A
|
N/A
|
| Fine and Forfeitures |
N/A
|
N/A
|
0 | 0 | 0 | 910 |
| Addressing criminal issues to contribute to a safer world for Canada |
N/A
|
N/A
|
N/A
|
N/A
|
N/A
|
N/A
|
| Promoting a fair and effective justice system that reflects Canadian values within a prosecutorial context |
N/A
|
N/A
|
N/A
|
N/A
|
N/A
|
N/A
|
| Total Non-Respendable Revenue |
-
|
-
|
-
|
-
|
- | 1,230 |
Public Service Commission of Canada
Source of Respendable and Non-Respendable Revenues
Respendable Revenues ($ thousands)
| Program Activity | Actual 2005-2006 |
Actual 2006-2007 |
Main Estimates 2007-2008 |
Planned Revenue 2007-2008 |
Total Budget Authorities 2007-2008 |
Actual 2007-2008 |
|---|---|---|---|---|---|---|
| Staffing Services and Assessment: Assessment and Counselling Services and Products (Note 1) |
- | 6,477 | 6,000 | 6,000 | 9,500 | 9,367 |
| Total Respendable Revenues | - | 6,477 | 6,000 | 6,000 | 9,500 | 9,367 |
Non-Respendable Revenues ($ thousands)
| Program Activity | Actual 2005-2006 |
Actual 2006-2007 |
Main Estimates 2007-2008 |
Planned Revenue 2007-2008 |
Total Budget Authorities 2007-2008 |
Actual 2007-2008 |
|---|---|---|---|---|---|---|
| Staffing Services and Assessment: Assessment and Counselling Services and Products (Note 1) |
4,795 | - | - | - | - | |
| Staffing Services and Assessment: Miscellaneous Revenues |
- | 29 | - | - | - | 1,385 |
| Appointment Integrity and Political Neutrality: Miscellaneous Revenues |
- | 5 | - | - | - | - |
| Total Non-Respendable Revenues |
4,795 | 34 | - | - | - | 1,385 |
| Total Revenues | 4,795 | 6,511 | 6,000 | 6,000 | 9,500 | 10,752 |
Note 1: In 2005-2006, the PSC obtained approval to respend the revenues attributable to the Assessment and Counselling Services and Products. This authority, however, was not brought into legal effect due to the federal election call and the dissolution of Parliament. Consequently, these revenues are reflected as non-respendable revenues. Since 2006-2007, the PSC has had the authority to re-spend revenues and these are reflected as part of the respendable revenues.
Public Works and Government Services Canada
Table 5: Sources of Respendable and Non-Respendable Revenue
(in millions of dollars)
| 2007-2008 | |||||
|---|---|---|---|---|---|
| Government Services - Program Activity |
Actual 2005-2006
|
Actrual 2006-2007
|
Planned Revenues | Total Authorities | Actual |
| Respendable Revenues | |||||
| Real Property | |||||
| Federal Accommodation and Holdings | |||||
| Rentals and Concessions |
436.3
|
472.3
|
286.8
|
756.4
|
756.4
|
| Real Property Stewardship |
1.7
|
2.0
|
1.9
|
3.3
|
3.3
|
| Real Property Services Revolving Fund | |||||
| Recoveries of disbursements on behalf of clients |
742.3
|
831.4
|
734.7
|
734.7
|
891.6
|
| Fee revenues from real property related common services | 170.0 | 153.4 | 157.6 | 157.6 | 144.6 |
|
912.3
|
984.8
|
892.3
|
892.3
|
1,036.2
|
|
| Real Property Disposition Revolving Fund | |||||
| Sales of real properties | 6.7 | 8.9 | 12.0 | 12.0 | 11.2 |
| Total – Real Property | 1,357.0 | 1,468.0 | 1,193.0 | 1,664.0 | 1,807.1 |
| Acquisitions | |||||
| Acquisition Services | |||||
| Major Crown Projects |
12.1
|
16.9
|
6.6
|
15.5
|
15.5
|
| Acquisitions |
19.2
|
19.6
|
14.8
|
36.8
|
36.8
|
| Canadian General Standards Board |
2.1
|
2.3
|
2.3
|
2.8
|
2.8
|
| Crown Assets Distribution |
2.6
|
2.5
|
-
|
2.4
|
2.4
|
| Seized Property Management |
6.5
|
6.7
|
6.5
|
7.1
|
7.1
|
| Others | 12.7 | 12.5 | 12.2 | 17.8 | 17.8 |
|
55.2
|
60.5
|
42.4
|
82.4
|
82.4
|
|
| Supply Operations Stewardship |
7.4
|
3.7
|
8.5
|
4.7
|
4.7
|
| Optional Services Revolving Fund | |||||
| Traffic and Vaccine |
83.3
|
85.8
|
90.0
|
90.0
|
96.1
|
| Crown Assets Distribution (Note 1) |
-
|
-
|
-
|
-
|
-
|
| Communication Procurement |
4.5
|
3.1
|
4.1
|
4.1
|
3.6
|
| Locally Shared Support Services |
6.2
|
6.3
|
6.3
|
6.3
|
5.1
|
| Software Brokerage / Benchmarking | - | - | - | - | - |
| 94.0 | 95.2 | 100.4 | 100.4 | 104.8 | |
| Total – Acquisitions | 156.6 | 159.4 | 151.3 | 187.5 | 191.9 |
| Information Technology | |||||
| IM/IT Services |
219.0
|
196.0
|
212.5
|
249.6
|
249.6
|
| IM/IT Stewardship |
3.2
|
0.8
|
0.6
|
1.1
|
1.1
|
| Telecommunications and Informatics Common Services Revolving Fund | 131.5 | 168.2 | 134.3 | 134.3 | 196.6 |
| Total – Information Technology |
353.7
|
365.0
|
347.4
|
385.0
|
447.3
|
| Receiver General and Public Service Compensation | |||||
| Receiver General Services | 4.8 | 3.4 | 2.2 | 2.4 | 2.4 |
| Receiver General Stewardship | 14.2 | 18.0 | 13.5 | 19.5 | 19.5 |
| Public Service Compensation | 2.9 | 2.6 | 2.9 | 3.4 | 3.4 |
| Public Service Pay Stewardship | 6.9 | 7.8 | 3.8 | 6.7 | 6.7 |
| Public Service Pension Stewardship | 48.9 | 52.6 | 37.9 | 74.2 | 74.2 |
| Total – Receiver General and Public Service Compensation | 77.7 | 84.4 | 60.3 | 106.2 | 106.2 |
| Government Information | |||||
| Government Information Services | 14.8 | 9.2 | 11.0 | 5.8 | 5.8 |
| Government Information Stewardship | 0.2 | - | - | - | - |
| Total – Government Information | 15.0 | 9.2 | 11.0 | 5.8 | 5.8 |
| Business Integration | |||||
| Business Integration Services | 15.4 | 22.9 | 22.3 | 28.2 | 28.2 |
| Business Integration - Performance Management | 38.2 | 34.6 | 30.0 | 38.6 | 38.6 |
| Total – Business Integration | 53.6 | 57.5 | 52.3 | 66.8 | 66.8 |
| Consulting and Audit Canada | |||||
| Consulting and Audit Canada Revolving Fund | 103.6 | 71.9 | 53.7 | 53.7 | 35.3 |
| Translation Bureau | |||||
| Translation Bureau Revolving Fund | |||||
| Translation Services | 200.7 | 202.7 | 211.1 | 211.1 | 210.4 |
| Interpretation Services | 2.9 | 3.0 | 2.8 | 2.8 | 3.2 |
| Terminology Services | 1.3 | 1.4 | 1.0 | 1.0 | 1.7 |
| Total – Translation Bureau | 204.9 | 207.1 | 214.9 | 214.9 | 215.3 |
| Office of Green Government Operations | |||||
| Office of Green Government Operations Services | - | - | - | - | - |
| Office of Green Government Operations Stewardship | - | 5.4 | 4.8 | 2.0 | 2.0 |
| Total Office of Green Government Operations | - | 5.4 | 4.8 | 2.0 | 2.0 |
| Total Respendable Revenues | 2,322.1 | 2,427.9 | 2,088.6 | 2,685.9 | 2,877.7 |
| Non-Respendable Revenues | |||||
| Dry Docks | 5.1 | 5.5 | 5.0 | 6.4 | 6.4 |
| Net proceeds from sale of seven (7) office complexes and lands (Note 1) | - | - | - | 1,335.8 | 1,335.8 |
| Miscellaneous Non-tax Revenues | |||||
| Seized Properties | 17.2 | (4.4) | - | 0.8 | 0.8 |
| Other non-tax revenue | 45.1 | 62.7 | 15.9 | 74.3 | 74.3 |
| Total Non-Respendable Revenues | 67.4 | 63.8 | 20.9 | 1,417.3 | 1,417.3 |
| DEPARTMENT TOTAL | 2,389.5 | 2,491.7 | 2,109.5 | 4,103.2 | 4,295.0 |
|
Note 1: Gross sale price from the Sale and Leaseback of buildings are $1,411.1M. From that amount, $57.8M is related to a lease inducement and $17.5M for various expenses attributable to the transaction such as consulting fees, legal fees, and insurance premiums. The net amount of $1,335.8 has been deposited in the Consolidated Revenue Fund. Note 2: Totals may not add up due to rounding. |
|||||
Royal Canadian Mounted Police
Table 3: Sources of Respendable and Non-Respendable Revenue
| Revenues by Business Line ($ millions) | ||||||
| Respendable Revenues* | 2006-2007 | |||||
| Program Activity | Actual 2005-2006 |
Actual 2006-2007 |
Main Estimates |
Planned Revenue |
Total Authorities |
Actual |
| Federal and International Operations | 6.8 | 7.7 | 0.6 | 0.6 | 10.8 | 8.5 |
| Protective Policing Services | 1.5 | 5.4 | 0.1 | 0.1 | 10.4 | 7.9 |
| Community, Contract and Aboriginal Policing | 1,167.1 | 1,252.1 | 1,397.0 | 1,397.0 | 1,439.0 | 1,323.0 |
| Criminal Intelligence Operations | 0.8 | 0.9 | 0.1 | 0.1 | 1.2 | 0.9 |
| Technical Policing Operations | 1.9 | 2.1 | 0.2 | 0.2 | 4.2 | 2.4 |
| Policing Support Services | 0.8 | 0.9 | 0.1 | 0.1 | 1.2 | 0.9 |
| National Policing Services | 6.8 | 7.8 | 4.7 | 4.7 | 7.5 | 8.1 |
| Total Respendable Revenues | 1,185.7 | 1,276.9 | 1,402.8 | 1,402.8 | 1,474.3 | 1,351.7 |
| Non-Respendable Revenues |
2006-2007 |
|||||
| Program Activity | Actual 2005-2006 |
Actual 2006-2007 |
Main Estimates |
Planned Revenue |
Total Authorities |
Actual |
| Privileges, Licences and permits | 29.1 | 17.5 | 13.2 | 13.2 | 13.2 | 17.6 |
| Refund of Prior Years' Expenditures | 3.9 | 5.4 | 4.5 | 4.5 | 4.5 | 6.7 |
| Return On Investments | 0.0 | 0.0 | 0.1 | 0.1 | 0.1 | 0.0 |
| Miscellaneous | 7.3 | 4.3 | 4.5 | 4.5 | 4.5 | 3.4 |
| EBP – Recoveries Not Respendable *** | 61.0 | 66.6 | 79.0 | 79.0 | 79.0 | 72.6 |
| Proceeds for Sales | 1.4 | 0.9 | 1.7 | 1.7 | 1.7 | 5.0 |
| Proceeds from Asset Disposal | 4.5 | 4.6 | 4.5 | 4.5 | 4.5 | 4.2 |
| Total Non-Respendable Revenues | 107.2 | 99.3 | 107.5 | 107.5 | 107.5 | 109.5 |
| Total Revenues | 1,292.9 | 1,376.2 | 1,510.3 | 1,581.6 | 1,581.8 | 1,416.2 |
|
Note: Respendable revenues are primarily generated by the provision of policing services under contract to provinces, territories and municipalities. Other revenues related to payment for courses and accommodation at the Canadian Police College and for technological services including access to police data bases * Formerly "Revenues Credited to the Vote" ** Unplanned revenue represents credits from the disposal of surplus Crown assets. *** Employee Benefit Plan |
||||||
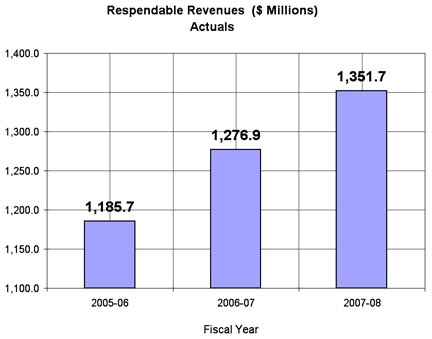
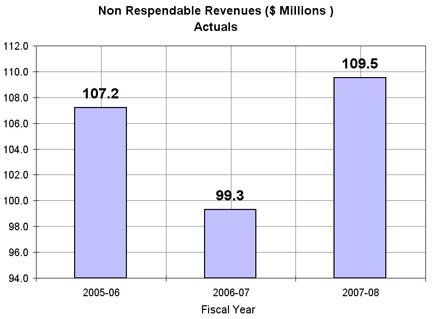
Canada Firearms Centre
Table 3: Source of Non-Respendable Revenue
| 2007-2008 ($ millions) | ||||||
| ($ millions) | Actual 2005-2006 |
Actual 2006-2007 |
Main Estimates |
Planned Revenue |
Total Authorities |
Actual |
| Registration, Licensing and Supporting Infrastructure | ||||||
| Licence Applications/ Renewal activities | 18.2 |
5.8 | N/A | 2.0 | N/A | 5.2 |
| Non-Resident Declarations | 1.9 | 2.0 | N/A | 1.9 | N/A | 1.9 |
| Miscellaneous (as per Public Accounts) | 1.8 | 0.0 | N/A | 0.4 | N/A | 0.0 |
| Total Non-Respendable Revenue | 21.9 | 7.8 | N/A | 4.3 | N/A | 7.1 |
Social Sciences and Humanities Research Council
Table 3: Sources of Respendable and Non-Respendable Revenue
| Support of Research and Scholarship in the Social Sciences and Humanities ($ millions) | 2005-06 Actual | 2006-07 Actual | 2007-08 | |||
| Main Estimates | Planned Spending | Total Authorities | Actual | |||
| Refunds of previous years' expenditures | 1.8 | 1.7 | N/A | 1.8 | N/A | 1.7 |
| Total Non-Respendable Revenue | 1.8 | 1.7 | N/A | 1.8 | N/A | 1.7 |
Non-Respendable Revenue
Non-respendable revenues are funds flowing to SSHRC from sources other than its parliamentary appropriation. Refunds of previous years' expenditures are passed on to the Receiver General for Canada and cannot be spent on programs or operations.
Statistics Canada
| Actual 2005/2006 | Actual 2006/2007 | 2007/2008 | ||||
|---|---|---|---|---|---|---|
| Main estimates | Planned revenue | Total authorities | Actual | |||
| $ thousands | ||||||
| Economic Statistics | ||||||
| Statistical services and products | 27,933 | 20,974 | 28,528 | 28,528 | 24,664 | 19,618 |
| Social Statistics | ||||||
| Statistical services and products | 43,064 | 56,257 | 66,401 | 66,401 | 72,928 | 57,767 |
| Census Statistics | ||||||
| Statistical services and products | 10,542 | 36,551 | 35,071 | 35,071 | 32,408 | 25,771 |
| Total respendable revenue | 81,539 | 113,782 | 130,000 | 130,000 | 130,000 | 103,155 |
| Note: Because of rounding, figures may not add to totals shown. | ||||||
| Actual 2005/2006 | Actual 2006/2007 | 2007/2008 | ||||
|---|---|---|---|---|---|---|
| Main estimates | Planned revenue | Total authorities | Actual | |||
| $ thousands | ||||||
| Economic Statistics | ||||||
| Statistical services and products | 274 | 0 | … | 0 | … | 0 |
| Social Statistics | ||||||
| Statistical services and products | 423 | 2,212 | … | 800 | … | 800 |
| Census Statistics | ||||||
| Statistical services and products | 103 | 749 | … | 0 | … | 0 |
| Total non-respendable revenue | 800 | 2,961 | … | 800 | … | 800 |
| … not applicable | ||||||
Supreme Court of Canada
Sources of Respendable & Non-Respendable Revenue
|
2007-2008
|
||||||
| ($ millions) |
Actual 2005-06 |
Actual 2006-07 |
Main Estimates
|
Planned Revenue
|
Total Authorities
|
Actual
|
| Process hearings and decisions |
|
|
|
|
|
|
| Non-Respendable Revenues |
|
|
|
|
|
|
| Judges' contributions towards annuities |
0.1 |
0.1 |
- |
0.1 |
- |
0.1 |
| Sales of Goods, Services and Information Products |
0.1 |
0.1 |
- |
0.1 |
- |
0.1 |
| Other |
0.1 |
0.1 |
- |
- |
- |
0.1 |
| Total Non-Respendable Revenue |
0.3 |
0.3 |
- |
0.2 |
- |
0.3 |
| Total Revenue |
0.3 |
0.3 |
- |
0.2 |
- |
0.3 |
The National Battlefields Commission
Table 5: Sources of Respendable Revenue
Respendable Revenue
Transport Canada
Table 4: Sources of Respendable and Non-Respendable Revenue
|
($ thousands) |
||||||
|---|---|---|---|---|---|---|
|
Respendable Revenue1 |
Actual 2005‑06 |
Actual 2006‑07 |
2007-08 |
|||
|
Main Estimates |
Planned Revenue |
Total Authorities |
Actual |
|||
| Policies, rulemaking, monitoring and outreach in support of a safe and secure transportation system | ||||||
| Canadian aviation regulation user fees |
8,291 |
8,090 |
8,375 |
8,375 |
8,375 |
8,362 |
| Aircraft maintenance and flying services |
29,700 |
34,369 |
23,770 |
23,770 |
33,770 |
35,260 |
| Marine safety regulation user fees |
8,313 |
8,170 |
7,621 |
7,621 |
7,621 |
8,240 |
| Revenues from the Registrar of Imported Vehicles Program |
2,423 |
4,600 |
755 |
755 |
6,256 |
7,460 |
| Inspections and certifications |
2,119 |
1,751 |
379 |
379 |
379 |
1,307 |
| Lease payments from the Motor Vehicle Test Center2 |
290 |
257 |
280 |
280 |
155 |
- |
| Rentals and concessions |
840 |
981 |
808 |
808 |
808 |
273 |
| Sales and training |
1,071 |
823 |
812 |
812 |
812 |
783 |
| Research and development |
- |
1,117 |
- |
- |
- |
252 |
| Miscellaneous |
698 |
632 |
75 |
75 |
184 |
84 |
| Sub-total |
53,746 |
60,790 |
42,875 |
42,875 |
58,360 |
62,019 |
| Policies, programs and infrastructure in support of a market-based framework | ||||||
| Air services forecasts revenues |
235 |
221 |
160 |
160 |
160 |
239 |
| Public port revenues from user fees and wharf permits |
9,032 |
8,553 |
8,415 |
8,415 |
8,643 |
8,265 |
| Airport revenues from user fees and service contracts |
5,038 |
4,991 |
5,150 |
5,150 |
5,150 |
5,230 |
| Airports Authorities – lease and chattel payments |
288,320 |
302,513 |
298,048 |
298,048 |
298,048 |
295,386 |
| Research and development |
2,550 |
1,406 |
1,154 |
1,154 |
1,154 |
759 |
| Rentals and concessions |
8,124 |
6,895 |
7,105 |
7,105 |
7,105 |
6,632 |
| Sales and training |
112 |
129 |
110 |
110 |
110 |
105 |
| Inspection and certification |
- |
3 |
- |
- |
- |
11 |
| Miscellaneous |
263 |
146 |
120 |
120 |
63 |
76 |
| Sub-total |
313,675
|
324,857
|
320,262
|
320,262
|
320,433
|
316,702
|
| Policies and programs in support of sustainable development | ||||||
| Rentals and concessions |
39
|
78
|
102 |
102 |
102 |
184 |
| Sales and training | - |
6
|
- |
- |
- |
- |
| Miscellaneous |
8 |
13
|
10 |
10 |
10 |
- |
| Sub-total |
47 |
97
|
112 |
112 |
112 |
184 |
| Total Respendable Revenue |
367,468 |
385,745
|
363,249 |
363,249 |
378,905 |
378,905 |
|
($ thousands) |
||||||
| Non-Respendable Revenue 3 |
Actual 2005‑06 |
Actual 2006‑07 |
2007-08 |
|||
|---|---|---|---|---|---|---|
|
Main Estimates |
Planned Revenue |
Total Authorities |
Actual
|
|||
| Non-navigational assets – St. Lawrence Seaway 4 |
10,385 |
7,461 |
5,200 |
5,200 |
8,078 |
8,078 |
| Canada Port Authority stipends |
11,698 |
12,033 |
12,986 |
12,986 |
12,826 |
12,826 |
| Royalties from research and development |
61 |
23 |
- |
- |
50 |
50 |
| Hopper cars (leases, damage settlements and demurrage charges) |
17,701 |
12,716 |
15,000 |
15,000 |
33,332 |
33,332 |
| Return on investments- Crown Corporations5 |
- |
87,865 |
- |
- |
56,170 |
56,170 |
| Return on investments – Others 6 |
5,882 |
70 |
- |
- |
34 |
34 |
| Refunds of previous year’s expenditures |
16,225 |
426 |
- |
- |
2,358 |
2,358 |
| Adjustments to previous year’s payables |
6,794 |
7,234 |
- |
- |
20,708 |
20,708 |
| Permits for transportation of explosives |
37 |
33 |
- |
- |
54 |
54 |
| Fines and penalties |
893 |
898 |
- |
- |
1,527 |
1,527 |
| Proceeds from disposal of surplus Crown assets |
963 |
1,369 |
- |
- |
3,040 |
3,040 |
| Proceeds from sale of real property |
5,059 |
6,614 |
- |
- |
1,059 |
1,059 |
| Interest revenue from divested airports |
20 |
- |
- |
- |
- |
- |
| Gift to the Crown7 |
- |
- |
- |
- |
3,000 |
3,000 |
| Miscellaneous |
410 |
545 |
- |
- |
354 |
354 |
| Total Non-Respendable Revenue |
76,128 |
137,287 |
33,186 |
33,186 |
142,589 |
142,589 |
Due to rounding, columns may not add to total shown.
Notes:
- For consistency with amounts published in the Public Accounts (Details of Respendable Amounts), the respendable revenue categories include a share of departmental administration’s respendable revenue.
- Due to an oversight in the revenue recording process, the Motor Vehicle Test Centre revenues ($258,274) were not recorded as respendable revenues. Corrective measures have been taken to avoid this situation from occurring again in the future.
- Respendable revenues are on a modified cash basis and do not necessarily correspond to Public Accounts, Form E, which is prepared on an accrual basis.
- Revenues from the St. Lawrence Seaway Management Corporation for managing Real Property Operations.
- Dividends received from Canada Post Corp. $47.67M, Canada Lands Co. $7.5 million and Royal Canadian Mint $1.0M.
- Remittance from Andrew Ferry on the St. Lawrence Seaway. The 2005-06 actual revenues included remittances from Jacques Cartier and Champlain Bridges Corp for the proceeds from the disposal of fixed assets ($5.85 million).
- The Pearson Airport Authority purchased the Highway 409 lands and subsequently transferred the lands to the Crown in order to have the permission to build the runway
Treasury Board of Canada Secretariat
Table 1: Sources of Respendable and Non-Respendable Revenue
| 2007-08 | ||||||
|---|---|---|---|---|---|---|
| Program Activity | Actual 2005-06 |
Actual 2006-07 |
Main Estimates |
Planned Revenue |
Total Authorities |
Actual |
|
Management Policy Development and Oversight |
||||||
|
Secretariat Operations |
|
|
|
|
|
|
|
Revenue related to the administration of the Public Service Superannuation Act (PSSA)1 |
2,535 |
2,734 |
― |
― |
3,942 |
2,681 |
|
Expenditure Management and Financial Oversight |
||||||
|
Centrally Managed Funds |
|
|
|
|
|
|
|
Revenue related to Public Service Insurance2&3 |
157,726 |
165,250 |
142,200 |
142,200 |
280,817 |
280,817 |
|
Total Respendable Revenue |
160,261 |
167,984 |
142,200 |
142,200 |
284,759 |
283,498 |
1. Respendable revenue is used to cover salaries and operating costs from Public Service Superannuation in respect of chargeable costs associated with administering the PSSA. Treasury Board approval to renew the respendable revenue authority was sought during 2007-08.
2. Respendable revenue is used to cover health care insurance plans costs from revolving funds and from departments and agencies that pay for employee benefit plans from a non-statutory appropriation. The recovery is based on 8 per cent of the total monthly personnel costs. This account is also used to record the pensioner's share of contributions to the Pensioners' Dental Services Plan.
3. As per Receiver General instructions, the Secretariat Financial Statements and Public Accounts treat this item as a recovery of expenditures as opposed to a respendable revenue. This difference in accounting treatment has no impact on the net expenditures of the Secretariat.
| 2007-08 | ||||||
|---|---|---|---|---|---|---|
| Program Activity | Actual 2005-06 |
Actual 2006-07 |
Main Estimates |
Planned Revenue |
Total Authorities |
Actual |
|
Recovery of health benefits costs in excess of respendable amount |
― |
14,229 |
― |
― |
― |
― |
|
Revenue from parking fees4 |
11,168 |
11,325 |
― |
10,000 |
11,466 |
11,466 |
|
External revenue from Access to Information requests |
1 |
3 |
― |
― |
1 |
1 |
|
Revenue related to the administration of the Public Service Superannuation Act (PSSA) |
549 |
576 |
― |
― |
596 |
596 |
|
Refunds of previous years' expenditures |
157 |
772 |
― |
― |
706 |
706 |
|
Disciplinary penalties |
33 |
18 |
― |
― |
24 |
24 |
|
Proceeds from the disposal of surplus Crown assets |
― |
10 |
― |
― |
9 |
9 |
|
Other |
― |
3 |
― |
― |
229 |
229 |
|
Total Non-Respendable Revenue |
11,909 |
26,935 |
― |
10,000 |
13,031 |
13,031 |
4. This represents the parking fees collected from public service employees in government-owned or -leased facilities. This revenue is deposited directly to the Consolidated Revenue Fund and cannot be used to offset operating expenditures.
Veterans Affairs Canada
Table 4: Sources of Non-Respendable Revenue
| ($ millions) | Actual 2005-2006 | Actual 2006-2007 | 2007-2008 | |||
| Main Estimates | Planned Revenue | Total Authorities | Actual | |||
| Veterans Affairs Program | ||||||
| Health Care and Re-establishment Benefits and Services | ||||||
| Ste. Anne's Hospital: In-patient Charges to the Quebec Provincial Plan (Other Goods and Services) | 15.0 | 14.2 | 14.2 | 14.2 | 14.2 | 13.2 |
| Ste. Anne's Hospital: Dietary Meals (Other Goods and Services) | 0.4 | 0.4 | 0.4 | 0.4 | 0.4 | 0.4 |
| Ste. Anne's Hospital: Domiciliary Care (Regulatory Care) | 3.9 | 3.6 | 3.7 | 3.7 | 3.7 | 3.5 |
| Pensions, Awards, Allowances for Disability and Death; and Financial Support | ||||||
| Recovery of pensions from foreign governments | 3.2 | 2.7 | 3.2 | 3.2 | 3.2 | 2.2 |
| Refund of previous years' expenditures | 9.5 | 7.7 | 9.5 | 9.5 | 9.5 | 9.3 |
| Other | 0.6 | 1.2 | 0.5 | 0.5 | 0.5 | 1.4 |
| Total Non-Respendable Revenue | 32.6 | 29.8 | 31.5 | 31.5 | 31.5 | 30.0 |
Western Economic Diversification Canada
Table 3: Sources of Respendable and Non-respendable Revenue
Respendable Revenue
($ thousands ) |
Actual |
Actual |
2007–2008 |
|||
|
Main |
Planned |
Total |
Actual |
|||
| Total Respendable Revenue | - | - | - | - | - | - |
Non-Respendable Revenue
($ thousands ) |
Actual |
Actual |
2007–2008 |
|||
|
Main |
Planned |
Total |
Actual |
|||
| Repayments of Contributions | 6,513 | 4,885 | - | 1,500 | - | 3,192 |
| Adjustment to previous years payables at year-end | 1,953 | 2,119 | - | 500 | - | 3,816 |
| Other Revenue | 175 | 139 | - | 200 | - | 1,803 |
| Fees paid with Access to Information Program (ATIP) requests* | - | - | - | - | - | - |
| Total Non-Respendable Revenue | 8,641 | 7,143 | - | 2,200 | - | 8,811 |
*Note: Western Economic Diversification Canada collected $446 in fees associated with the Access to Information Program during the fiscal year 2007-2008.