ARCHIVED - Canadian Space Agency
 This page has been archived.
Archived Content
Information identified as archived on the Web is for reference, research or recordkeeping purposes. It has not been altered or updated after the date of archiving. Web pages that are archived on the Web are not subject to the Government of Canada Web Standards. As per the Communications Policy of the Government of Canada, you can request alternate formats on the "Contact Us" page.
2006-2007
Departmental Performance Report
Canadian Space Agency
The Honourable Jim Prentice
Minister of Industry
Table of Contents
SECTION 1: Overview- 1.1 Minister's Message
- 1.2 Management Representation Statement
- 1.3 CSA Program Activity Architecture (PAA) Crosswalk
- 1.4 Summary Information
- 1.5 Department Performance - Summary
- 1.6 Spending by Program Activity
- 2.1 Results-Based Measurement Methodology
- 2.2 Space Based Earth Observation
- 2.3 Space Science and Exploration
- 2.4 Satellite Communications
- 2.5 Generic Space Activities in support of EO, SE and SC
- 2.6 Space Awareness and Learning
- 2.7 Corporate Services and Infrastructure
- 3.1 Organizational Information
-
3.2 Financial Tables
- 3.2.1 Comparison of Planned to Actual Spending (including Full-time Equivalents)
- 3.2.2 Resources by Program Activity
- 3.2.3 Voted and Statutory Items
- 3.2.4 Services Received Without Charge
- 3.2.5 Sources of Respendable and Non-Respendable Revenue
- 3.2.6 Resource Requirements by Branch or Sector
- 3.2.7 User Fee Reporting - User Fees Act
- 3.2.8 Financial Statements of Departmental Corporations and Agents of Parliament
- 3.2.9 Response to Parliamentary Committees, Audits and Evaluations for Fiscal-Year 2006-2007
Annexes: - 3.2.10 Policy on Service Standards for External Fees
- 3.2.11 Details on Project Spending
- 3.2.12 Status Report on Major Crown Projects
- 3.2.13 Details on Transfer Payments Programs (TPPs)
- 3.2.14 Procurement and Contracting
- 3.2.15 Travel Policies
- 3.2.16 Fuel Storage Tanks
SECTION 1: Overview
1.1 Minister's Message
 |
I am pleased to present the Canadian Space Agency's Departmental Performance Report for 2006-2007. My goal as Minister of Industry, and one of the top priorities of Canada's New Government, is to ensure we maintain a strong economic environment - one that allows Canadians to prosper in the global economy. We are seeing great changes in the international marketplace. New trade agreements, rapidly advancing technologies and the emergence of developing countries are all contributing to today's business environment. Canada needs to keep pace. |
Part of my mandate is to help make Canadians more productive and competitive. We want our industries to continue to thrive and all Canadians to continue to enjoy one of the highest standards of living in the world.
For this to happen, the government is committed to maintaining a fair, efficient and competitive marketplace - one that encourages investment, sets the stage for greater productivity, and facilitates innovation. We are relying on market forces to a greater extent, regulating only when it is absolutely necessary. Our policies have helped turn research into new products and business processes. In addition, we are making efforts to increase awareness of sustainability practices among Canadian industry, emphasizing the social, environmental and economic benefits they bring.
The Department and the Industry Portfolio have made progress on a wide range of issues this past year, most notably in the areas of telecommunications, science and practical research, manufacturing, small business, consumer protection, patents and copyrights, tourism and economic development.
The Industry Portfolio is composed of Industry Canada and 10 other agencies, Crown corporations and quasi-judicial bodies. These organizations collectively advance Canada's industrial, scientific and economic development, and help ensure that we remain competitive in the global marketplace.
We have accomplished much this year. Using Advantage Canada - the government's long-term economic plan - as our roadmap, we have made great strides toward many of our most important goals. We will continue to focus on these goals to support the conditions for a strong economy - an environment that Canadians expect and deserve.
Jim Prentice
Minister of Industry
1.2 Management Representation Statement
|
I submit for tabling in Parliament, the 2006-2007 Departmental Performance Report (DPR) for the Canadian Space Agency. This document has been prepared based on the reporting principles contained in the Guide for the Preparation of Part III of the 2006-2007 Estimates - Reports on Plans and Priorities and Departmental Performance Reports:
Departmental Performance Report prepared by:
|
1.3 CSA Program Activity Architecture (PAA) Crosswalk
| PROGRAM ACTIVITY ARCHITECTURE (PAA)CROSSWALK | |||
| 2005-2006 | 2006-2007 | ||
| Program Activities | Resources ($ in millions) |
Program Activities | Resources ($ in millions) |
| Space Based Earth Observation (EO) | 131.1 | Space Based Earth Observation (EO) | 124.0 |
| Space Science and Exploration (SE) | 145.0 | Space Science and Exploration (SE) | 133.2 |
| Satellite Communications (SC) | 30.5 | Satellite Communications (SC) | 32.3 |
| Space Awareness and Learning (AL) | 5.3 | Space Awareness and Learning (AL) | 5.9 |
| N/A | Generic Space Activities in support of EO, SE, and SC (GSA) | 44.3 | |
| Corporate Services, Strategic Development and Infrastructure | 29.8 | Corporate Services and Infrastructure | 34.5 |
| TOTAL | 341.6 | TOTAL | 374.1 |
In 2006-2007 a Program Activity called Generic Space Activities in support of Earth Observation, Space Science and Exploration, and Satellite Communications was added in order to better reflect the generic technology research and space qualification operations that support scientific and engineering programs. The budget allocated to this Program Activity in the 2006-2007 Main Estimates amounted to $44.3 million, which was drawn from the Earth Observation, Space Science and Exploration, and Satellite Communications Program Activities.
The Main Estimates for the Canadian Space Agency totalled $374.1 million, a net increase of $32.5 million over 2005-2006. The major changes were due to an increase of $21.0 million to meet the cash flow requirements for the new RADARSAT-Constellation project; a net reprofiling of $13.4 million affecting the budgets and expenditure profiles of major projects such as RADARSAT-2, Chinook and CASSIOPE because of the progress made on the development work; and, an additional decrease of $2.0 million to allow for a contribution to the government-wide reallocation exercise.
1.4 Summary Information
|
Raison d'�tre The mandate of the Agency is to promote the peaceful use and development of space, to advance the knowledge of space through science and to ensure that space science and technology provide social and economic benefits for Canadians. The Canadian Space Agency (CSA) is achieving this mandate by implementing the Canadian Space Strategy (CSS) in cooperation with other government departments/agencies, industries, and universities, as well as international partners. In addition to delivering its own programs, the CSA is responsible for coordinating all federal civil space-related policies and programs pertaining to science and technology research, industrial development, and international cooperation. To learn more about the mandate of the CSA, go to: http://www.space.gc.ca/asc/eng/about/mission.asp. |
| 2006-2007 - Financial Resources ($ in millions) | ||
|
Planned |
Total Authorities |
Actual Spending |
|
374.1 |
384.7 |
314.4 |
| 2006-2007 - Human Resources (FTEs) | ||
|
Planned |
Actual |
Difference |
|
690 |
609 |
81 |
|
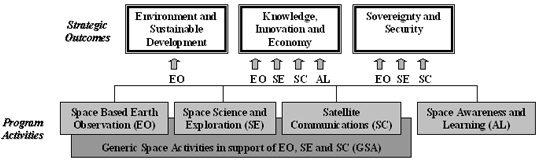
CSA Strategic Outcomes For a second consecutive year, the CSA is contributing under its Program Activity Architecture to the three following Strategic Outcomes, in line with the Government of Canada Outcomes and focusing more specifically on scientific and technological priorities. Environment and Sustainable Development: A Space Program that helps Canada understand and protect the environment, and develop its resources in a sustainable manner. Knowledge, Innovation and Economy: A Space Program that generates knowledge and pushes innovation, while leading (where appropriate) to increased productivity and economic growth through commercialization. Sovereignty and Security: A Space Program that supports recognition of Canada's sovereignty and the security of its communities. |
CSA Contributions to Gobernment of Canada Outcomes
|
Government of Canada Outcomes |
||
|
Economy |
Social |
International |
|
|
|
CSA Contributions to Government of Canada Economic Outcomes
The CSA's three Strategic Outcomes contribute to the development of Canada's economy as measured against the following outcomes outlined in Canada's Performance Report:
- An innovative and knowledge-based economy; and,
- A clean and healthy environment.
The space industry contributes to Canada's economic well-being and helps achieve a higher standard of living and quality of life for all Canadians.
Through its Research and Development (R&D) investments and the resulting transfers of applications to the private and public sectors, the CSA's programs and activities attract highly skilled labour that contributes to Canada's knowledge-based economy; help enhance the Canadian space industry's competitiveness by encouraging dynamic trade relationships with other nations; and increase Canada's ability to compete in the global marketplace.
Earth observation missions drive some of the changes that are improving our quality of life by helping our government deliver on priorities such as protection of the environment, sustainable development, management of natural resources, understanding climate change and providing support for disaster management.
Satellite communications missions are a key element in linking all Canadians, including remote and northern communities, in a communication network.
CSA Contributions to Government of Canada Social Outcomes
The CSA's three Strategic Outcomes contribute to Canada's social foundations as measured against the following outcomes outlined in Canada's Performance Report:
- Safe and secure communities; and,
- A vibrant Canadian culture and heritage.
Space infrastructure offers privileged access and facilitates the dissemination of timely health, cultural, security and safety related information to all Canadians, no matter where they live in Canada.
Earth observation, communication and navigation satellites drive some of the changes that are improving our quality of life by helping our government deliver on environment, safety and security priorities, allowing timely monitoring and maintenance of a healthy physical environment over Canada, and providing support for disaster management in such situations as floods, forest fires and earthquakes. They also provide essential communication tool to support law and order enforcement activities and enhance search and rescue capabilities.
Fundamental research in physical and life sciences, space exploration, science and technology encourages a nation's best minds to participate in visionary endeavours. It encourages science and technology literacy, particularly among our youth, who are inspired by role models such as Canadian astronauts, scientists and researchers, who encourage them to strive high. Satellite communication is a powerful channel that plays a significant role in sharing Canadian culture and heritage. It is also the engine that drives the knowledge economy, contributing to the development of the new technologies that will maintain Canada's leadership in fields ranging from nanotechnology and robotics to healthcare.
Satellite communication is essential to provide all Canadians, no matter where they live in Canada, with timely access to knowledge and expertise related to health and education through a range of non-commercial services, including e-government, e-learning, tele-justice, tele-education, as well as tele-medicine disciplines such as tele-psychiatry, tele-radiology, tele-surgery, and tele-consultations.
CSA Contributions to Government of Canada International Outcomes
The CSA's three Strategic Outcomes contribute to establishing Canada's international presence as measured against the following outcome outlined in Canada's Performance Report:
- A strong and mutually beneficial North American partnership.
Space is now recognized by industrialized nations as an essential strategic tool to meet social and economic objectives. Canada must therefore possess a space infrastructure, not only to meet its specific national needs, but also to play a tangible and visible role in responding to the issues that interest the international community.
With its space exploration, science and technology endeavours, the majority of which involve international partners, the CSA plays an influential role in building bridges between an increasing number of space-faring countries. In striving to become one of the most advanced, connected, and innovative nations in the world, Canada offers and shares tremendous opportunities for the development and safety of the global community through the peaceful use of space.
Canada is an official member of the International Charter on Space and Major Disasters, through which all members agree to use their Earth observation satellites when required to respond to disasters.
Canada's participation in the International Space Station (ISS) provides access to the unique space laboratory for Canadian researchers and ensures that Canada remains a partner of choice for future international partnerships that will explore the solar system and other planets.
Canada's participation, as a cooperating state, in European Space Agency (ESA) programs allows our industry and our scientific community to participate in forward-looking studies in Earth observation, space science and exploration as well as new telecommunications applications.
Strategic Context of the Canadian Space Agency
International Environment
In the global context, space is recognized by industrialized nations as an essential and strategic tool to meet their social, economic, and foreign policy objectives. Accordingly, many governments around the world, both traditional and newly emerging space-faring nations, are increasing their investments in space activities, seeking increased consolidation and advancement of their space capabilities.
International cooperation is critical to the implementation of the Canadian Space Strategy. Canada must therefore possess a space infrastructure not only to meet its specific national needs, but also to play a tangible and visible role in responding to the issues that interest the international community. Canada can leverage its resources and maximize its return on investment by working in partnership with other space-faring nations. Such partnerships allow for sharing of technical expertise, knowledge and infrastructure, and provide access to areas in which Canada has chosen not to invest its limited resources. In addition, increasing concerns over issues such as space debris, climate change and security, which transcend national borders, encourage nations with common goals to increase cooperation. Canada cooperates with a number of international partners and has ties to various space agencies. Although the United States National Aeronautics and Space Administration (NASA) and the European Space Agency (ESA) remain Canada's longstanding international partners, we are developing relationships with national space organizations in India, Sweden, Norway, Germany, Russia, Argentina, Italy, Japan and China.
To learn more about Canada's international partners, go to: http://www.space.gc.ca/asc/eng/resources/links_agencies.asp
Canada is regarded as a reliable partner possessing unique technical and scientific capabilities and as a nation that can meaningfully contribute to the initiatives of foreign space agencies. In particular, emerging space-faring countries in Asia and South America may offer great potential for future cooperation. Consequently, Canada maintains its efforts to establish a foothold in these emerging markets. It is of paramount importance that the CSA continue to work with its stakeholders to ensure that our research community and industry remain active and competitive vis-�-vis world standards and markets.
The perception of Canada's space industry as being internationally competitive is confirmed by the results of the 2005 Annual Survey of the Canadian Space Sector. With total annual industry revenues of $2.5 billion, of which exports represent 50% ($1.245 billion), Canada has a higher percentage of exports than any other major space-faring nation. The destination of Canada space exports is mainly distributed as follows: 47% generally destined for the U.S., 32% for Europe and 8% for Asia1.
National Environment
The Canadian Space Agency recognizes that the best means of turning scientific and technological advancements into innovative products and services is through partnerships with Canadian universities and industry. The CSA firmly believes that industry is the best vehicle for providing a broad range of services for diverse groups of users - from individuals to public and private organizations. With its highly skilled workforce, the space industry in Canada not only generates wealth in our economy, but also provides Canadians with competitive products and services that would otherwise have to be obtained from foreign sources.
In 2005, Canada's space industry generated $2.5 billion in revenues.2 Satellite Communications continued to generate the lion's share of the Canadian space sector's revenues with a total of $1.83 billion. A breakdown of the revenues by sectors of activity is as follows: Satellite Communications: 77.6% ($1.83 billion); Earth Observation: 8% ($192 million); Navigation: 4.8% ($120 million); Robotics: 6.1% ($153 million); Space Science: 3.4% ($84 million); and all space-related activities in areas other than those mentioned above: $11 million.3 While small in number of firms, the Canadian space sector is knowledge-intensive and at the forefront of research and innovation. Building on the strengths of 6,710 highly skilled workers,4 Canadian firms have acquired world-leading capabilities in niche areas such as Earth observation, space robotics, satellite communications and navigation.
Given that the national market is relatively small, it is critical that the Canadian industry be able to leverage foreign investments and generate export sales. Capitalizing on export revenue depends on the industry's ability to commercialize highly competitive products and services and establish local partnerships. The Government of Canada plays a key role in helping to establish such partnerships, facilitating trade relations and export opportunities and securing a strategic role for Canadian industry and academia in important international space initiatives. The CSA works very closely with the Canadian space industry and scientists in 25 Canadian universities and 12 research centres.
1 State of the Canadian Space Sector 2005; Export Revenues
2 State of the Canadian Space Sector 2005; Overall Revenues
3 State of the Canadian Space Sector 2005; Revenues by Sector of Activity
4 State of the Canadian Space Sector 2005; Space Sector Workforce, Workforce Groups
http://www.space.gc.ca/asc/eng/industry/state.asp.
Regional distribution of CSA R&D contracts from 1988-1989 to 2006-2007 (in %):
Source: CSA Organized Research Information System (ORIS)
Regional distribution of CSA contracts, March 31, 2007.
To learn more about Canadian space-related organizations, go to: http://www3.space.gc.ca/asc/eng/industry/csd.asp.
Government Environment
In keeping with its objective to be an open and transparent organization, the CSA's strategic planning is done in consultation with other Government of Canada organizations and various Canadian stakeholders.
The CSA hold ongoing consultations with Government of Canada organizations to identify where and how space science and technologies could be used to enhance the delivery of their mandates and provide new or more efficient services for Canadians. More specifically, the CSA is constantly seeking ways to contribute significantly to the effective and efficient delivery of government programs and services in the fields of communications, environment and sustainable development, security, intelligence, emergency preparedness, industry development and space sciences.
The wide range of space applications and technologies used by the Government is reflected in the CSA's three Strategic Outcomes, as well as in the number of partnerships between the CSA and other federal organizations. Sorted by Strategic Outcome, the list of partner organizations includes:
- Environment and Sustainable Development: Natural Resources Canada including the Canada Centre for Remote Sensing, Environment Canada, Parks Canada, Fisheries and Oceans Canada, Indian and Northern Affairs Canada, Agriculture and Agri-Food Canada.
- Knowledge, Innovation and Economy: The Communications Research Centre of Industry Canada, which manages satellite communications programs on behalf of the CSA, National Research Council Canada, Industry Canada, National Sciences and Engineering Research Council of Canada, Canadian Institutes for Health Research, and Foreign Affairs and International Trade Canada.
- Sovereignty and Security: Department of National Defence, the Canadian Coast Guard, and Public Safety and Emergency Preparedness Canada.
CSA Program Activity Architecture
Program Activities
The CSA has been managing its programs according to the Canadian Space Strategy (CSS) for the past two years. The CSS greatly influenced decision-making at the CSA as it streamlined its Strategic Outcomes and set the long-term priorities for all activities under the Program Activity Architecture (PAA).
In 2006-2007 the PAA was amended and as a result, one additional Program Activity was created: Generic Space Activities. This new Program Activity supports the three CSS scientific and technology Program Activities: Space Based Earth Observation, Space Science and Exploration, and Satellite Communications. The Space Awareness and Learning Program Activity remained the same. All five Program Activities are supported by the services provided by the Corporate Services and Infrastructure Program Activity.
Program Sub-Activities
Scientific and engineering program activities are broken down into three large clusters called sub-activities: Enabling Research, Space Mission Development, and Space Mission Operations. Each sub-activity carries out a specific objective, taking part in a project management continuum from initial research phases to the final operational phases:
- Through Enabling Research, the CSA provides leadership, coordination and support for basic and applied research and experimental development in order to increase the knowledge base, devise new applications through space missions, and allow the transfer of intellectual property and proven technologies to Canadian industry, academia, and government organizations.
- Through Space Mission Development, the CSA provides coordination and support for the development of space missions through the definition, critical design, manufacturing, integration, testing and delivery phases leading to launch and early operations of space systems.
- Through Space Mission Operations, the CSA operates manned and unmanned space missions through crew and ground support personnel training, mission analysis and planning, on-orbit ground control operations, system monitoring, maintenance and logistic support, as well as data handling and delivery.
The coordination of sub-activities throughout a project life cycle is meant to optimize the effectiveness and expertise of employees coming from different core functions and to promote an integrated team and a multi-functional approach to projects and services.
The Space Awareness and Learning Program Activity is broken down into two sub-activities, each with a specific objective:
- Awareness activities, intended to increase public awareness and understanding of how space affects and improves the quality of life.
- Learning activities, intended to build knowledge and enhance interest in space science and technology.
Together, these activities are part of a proactive strategy of communication, learning, and support for the development of professional expertise.
1.5 Department Performance - Summary
| Program Activity - Space Based Earth Observation (EO) | |||
Government of Canada Outcomes
|
CSA Strategic Outcomes
|
||
|
Priority
Develop and operationalize the use of Space Based EO for the benefit of Canadians. |
2006-2007 Planned Spending ($ in millions) |
2006-2007 Actual Spending ($ in millions) |
| 124.0 | 66.4 | |
|
Expected result
Delivery, directly or in partnership, of Space Based EO data, products and services in response to operational and scientific user requirements in the field of Environment, Resource and Land Use Management, and Security and Foreign Policy, supported by access capacity development. |
||
|
Performance History
In 2005-2006: 82% (18/22) of the sub-sub Program Activity targets were exceeded or successfully met. In 2006-2007: 83% (15/18) of the sub-sub Program Activity targets were exceeded or successfully met. |
||
| Sub-Activities | Achieved vs Planned Targets | |||
| 2005-2006 | 2006-2007 | |||
| Enabling Research | 8/11 | 73% | 11/12 | 92% |
| Space Mission Development | 7/8 | 87% | 2/4 | 50% |
| Space Mission Operations | 3/3 | 100% | 2/2 | 100% |
| TOTAL | 18/22 | 82% | 15/18 | 83% |
|
Examples of 2006-2007 Main Accomplishments
Ongoing operation of RADARSAT-1 provides useful information for both commercial and scientific users. A contingency plan was put in place to prescribe the use of foreign sensors as backup to RADARSAT-1 in order to continue to meet the needs of operational users until RADARSAT-2 data become available. The assembly, integration and test of the RADARSAT-2 spacecraft were completed on time at the David Florida Laboratory, along with the operation preparation activities at CSA. However, the launch on a Soyuz rocket was rescheduled to November 2007. In the meantime, the Preparatory Program for the use of RADARSAT-2 data, value at $445 million, continued. Conceptual design and technology development work on the RADARSAT-Constellation program, the follow-on program to RADARSAT-2, continued through 2006-2007. The NASA's Cloudsat mission, launched in April 2006, leads to a very successful validation campaign in the Great Lakes region during the winter season. Analysis results are expected to have significant impact on numerical weather prediction models. Three major Canadian science instruments continued orbiting Earth and collecting environmental data: MOPITT, aboard the NASA Terra satellite, OSIRIS, aboard the Swedish Odin satellite and SCISAT, operated by the CSA. To learn more, go to: Section 2.2 - Space Based Earth Observation Program Activity Performance Measurement. |
Any significant variance reported against Planned Spending set out in the 2006-2007 Report on Plans and Priorities is explained in Section 1.6 - Spending by Program Activity.
| Program Activity - Space Science and Exploration (SE) | |||
Government of Canada Outcomes
|
CSA Strategic Outcomes
|
||
|
Priority
Understand the solar system and the Universe, expand our knowledge of the constituent elements and origins of life, and strengthen a human presence in space. |
2006-2007 Planned Spending ($ in millions) |
2006-2007 Actual Spending ($ in millions) |
| 133.2 | 130.0 | |
|
Expected Result
Increased participation in Canadian and international opportunities in order to expand the scientific knowledge base made available to Canadian academia and R&D communities in astronomy, space exploration and solar-terrestrial relation as well as physical and life sciences. |
||
|
Performance History
In 2005-2006: 83% (19/23) of the sub-sub Program Activity targets were exceeded or successfully met. In 2006-2007: 86% (24/28) of the sub-sub Program Activity targets were exceeded or successfully met. |
||
| Sub-Activities | Achieved vs Planned Targets | |||
| 2005-2006 | 2006-2007 | |||
| Enabling Research | 6/9 | 67% | 12/15 | 80% |
| Space Mission Development | 6/7 | 86% | 3/4 | 75% |
| Space Mission Operations | 7/7 | 100% | 9/9 | 100% |
| TOTAL | 19/23 | 83% | 24/28 | 86% |
|
Examples of 2006-2007 Main Accomplisments
As part of the Shuttle-based ISS Assembly and Maintenance mission STS-115/12A, Canadian Astronaut, Steve MacLean, successfully performed one space walk (extra-vehicular activities) to install solar panels to increase the capability of the ISS to generate power to support science and operational activities. As part of the Canadian Space Station Program (CSSP), a ground control capability was implemented for Canadarm2, which will allow for movement of the robotic arm by personnel on the ground without involvement of the on-orbit crew. Canada's contribution to NASA's Phoenix mission, an on-board meteorological station (MET), underwent final testing at the CSA's David Florida Laboratory in Ottawa and was delivered on time to NASA for the successful launch in August 2007. The CSA completed the detail design of the Alpha Particle X-ray Spectrometer (APXS) for NASA's Mars Science Laboratory, scheduled for launch in 2009. The Canadian contribution will help scientists to determine the chemical composition of various soil, dust and rock samples. Canada continued the design and construction of the Fine Guidance Sensor (FGS), a critical element of the James Webb Space Telescope (JWST), a major facility-class space observatory to be launched in 2013. Through the CSA's contribution, Canadian astronomers will have guaranteed access to 5% of the observing. To learn more, go to: Section 2.3 - Space Science and Exploration Program Activity Performance Measurement. |
Any significant variance reported against Planned Spending set out in the 2006-2007 Report on Plans and Priorities is explained in Section 1.6 - Spending by Program Activity.
| Program Activity - Satellite Communications (SC) | |||
Government of Canada Outcomes
|
CSA Strategic Outcomes
|
||
|
Priority
Provide all Canadians with the means to participate in and fully benefit from the global information age. |
2006-2007 Planned Spending ($ in millions) |
2006-2007 Actual Spending ($ in millions) |
| 32.3 | 29.3 | |
|
Expected Results
1) Increased access for Canadians to state-of-the-art communications systems and services to meet their social and economic needs. 2) Better use of space communications, search and rescue, and global navigation satellite systems and applications to improve the efficiency and effectiveness of other government departments and organizations in delivering services to Canadians. |
||
|
Performance History
In 2005-2006: 69% (9/13) of the sub-sub Program Activity targets were exceeded or In 2006-2007: 78% (7/9) of the sub-sub Program Activity targets were exceeded or |
||
| Sub-Activities | Achieved vs Planned Targets | |||
| 2005-2006 | 2006-2007 | |||
| Enabling Research | 3/6 | 50% | 5/5 | 100% |
| Space Mission Development | 6/7 | 86% | 2/4 | 50% |
| Space Mission Operations | NA | NA | NA | NA |
| TOTAL (NA = Not Applicable) |
9/13 | 69% | 7/9 | 78% |
|
Example of 2006-2007 Main Accomplishments
Canadian companies continued to manufacture the Cascade payload and prepared for assembly, integration and test on the spacecraft. The project completion was delayed due to problems with the development of critical components and the launch date had to be moved from December 2007 to November 2008. Canada's participation in European Space Agency (ESA) programs allowed our industry to access forward-looking studies on new telecommunications services; to develop new technologies, equipment and applications in multi-media, optical inter-satellite and mobile communications; and to demonstrate satellite-based communications services such as interactive communications services for remote communities and disaster management. To learn more, go to: Section 2.4 - Satellite Communications Program Activity Performance Measurement. |
Any significant variance reported against Planned Spending set out in the 2006-2007 Report on Plans and Priorities is explained in Section 1.6 - Spending by Program Activity.
| Program Activity - Generic Space Activities in support of EO, SE and SC (GSA) | |||
Government of Canada Outcomes
|
CSA Strategic Outcomes
|
||
|
Priority
Provide leadership, coordination or support to Earth Observation (EO), Space Science and Exploration (SE), and Satellite Communications (SC) Program Activities through generic technology research and space-qualification activities. |
2006-2007 Planned Spending ($ in millions) |
2006-2007 Actual Spending ($ in millions) |
| 44.3 | 47.2 | |
|
Expected Result
Innovative space technologies, techniques, and design and test methodologies in response to advanced developments required for future space missions and activities. |
||
|
Performance History
In 2005-2006: Not Applicable (NA) - This Program Activity did not exist in 2005-2006. In 2006-2007: 86% (6/7) of the sub-sub Program Activity targets were exceeded or successfully met. |
||
| Sub-Activities | Achieved vs Planned Targets | |||
| 2005-2006 | 2006-2007 | |||
| Enabling Research | NA | NA | 5/6 | 83% |
| Space Mission Development | NA | NA | 1/1 | 100% |
| Space Mission Operations | NA | NA | NA | NA |
| TOTAL | NA | NA | 6/7 | 86% |
|
Examples of 2006-2007 Main Accomplisments
The CSA continued to enhance Canada's space capabilities by awarding technology R&D projects to industry and research organizations on a competitive basis through its Space Technology Development Program (STDP). This year, 19 technologies were brought to higher readiness levels out of 20 completed projects. The CSA developed high-risk space technologies and maintained in-house technical capabilities through its Space Technology Research Program (STRP). This year, 8 new patents applications were filed out of 11 projects and 2 patents, filed last year, were granted. The David Florida Laboratory provided world-class, cost-effective environmental space qualification services for the assembly, integration and testing of spacecraft systems and sub-systems to all of the CSA's programs. In 2006-2007, more than 150 tests were performed in support of CSA programs and projects and Canada's tele-communications industry. To learn more, go to: Section 2.5 - Generic Space Activities in support of EO, SE and SC Program Activity Performance Measurement. |
Any significant variance reported against Planned Spending set out in the 2006-2007 Report on Plans and Priorities is explained in Section 1.6 - Spending by Program Activity.
| Program Activity - Space Awareness and Learning (AL) | |||
Government of Canada Outcomes
|
CSA Strategic Outcomes
|
||
|
Priority
Further public understanding and engagement with regards to space-related issues, ultimately leading to improvement in the scientific literacy of Canadians. |
2006-2007 Planned Spending ($ in millions) |
2006-2007 Actual Spending ($ in millions) |
| 5.9 | 4.1 | |
|
Expected Result
Increase public awareness of Canada's activities in space and the space benefits that positively affect the quality of life of Canadians. |
||
|
Performance History
In 2005-2006: 94% (14/15) of the sub-sub Program Activity targets were exceeded or In 2006-2007: 87% (14/16) of the sub-sub Program Activity targets were exceeded or |
||
| Sub-Activities | Achieved vs Planned Targets | |||
| 2005-2006 | 2006-2007 | |||
| Awareness | 5/6 | 83% | 8/9 | 89% |
| Learning | 9/9 | 100% | 6/7 | 86% |
| TOTAL | 14/15 | 94% | 14/16 | 87% |
|
Examples of 2006-2007 Main Accomplishments
Awareness: The promotion of STS-115 mission, with Canadian Astronaut Steve MacLean, generated 367 interviews, produced more than 46 hours of radio coverage and more than 59 hours of TV coverage. Daily print media carried 2,071 articles on the mission. The 20th Anniversary of Human Space Flight exhibit continued its journey across the country, reaching the Maritimes for five months before moving on to Sherbrooke, Quebec, to finish the year. Learning: Space-centred learning initiatives, which encourage youth to pursue studies and careers in the field of science and engineering, reached a significant participation increase of 275% for educators and 13% for students. The STS-115 mission gave the CSA's Space Learning resources an opportunity to access 20,000 Canadian classrooms, reaching 470,000 primary and secondary students in 10 provinces and 2 territories. An increase of 57% was achieved in requests for educational space-based materials by not-for-profit and educational institutions. To learn more, go to: Section 2.6 - Space Awareness and Learning Program Activity Performance Measurement. |
Any significant variance reported against Planned Spending set out in the 2006-2007 Report on Plans and Priorities is explained in Section 1.6 - Spending by Program Activity.
| Program Activity - Corporate Services and Infrastructure | |||
|
Government of Canada Outcomes
Not applicable. |
CSA Strategic Outcome
Not applicable. |
||
|
Priority
To implement the government's commitment to modern public service management in accordance with the Management Accountability Framework's (MAF) expectations. |
2006-2007 Planned Spending ($ in millions) |
2006-2007 Actual Spending ($ in millions) |
| 34.5 | 37.5 | |
|
Expected Results
1) Corporate Services provide added value for CSA managers in the performance of their duties. 2) Key corporate risks are addressed and mitigated. |
||
|
Performance History
In 2005-2006: Not Applicable - This Program Activity was not measured in 2005-2006. In 2006-2007: 67% (8/12) of the sub-sub Program Activity targets were exceeded or successfully met. |
||
| Targets Achieved vs Planned | ||||
| 2005-2006 | 2006-2007 | |||
| Corporate Risks Management | NA | NA | 8/12 | 67% |
| TOTAL | NA | NA | 8/12 | 67% |
|
Examples of 2006-2007 Main Accomplishments
From the 18 indicators outlined in the 2006-Round IV MAF assessment produced by Secretariat Treasury Board (SCT), 39% have improved, 44% have stayed the same and 17% have declined. CSA's three strategic outcomes were merged into a single outcome that will first appear in the 2008-2009 Report on Plans and Priorities. The Staffing Management Accountability Framework (SMAF) was approved by CSA's Executive Committee and circulated among managers. To learn more, go to: Section 2.7 - Corporate Services and Infrastructure Program Activity Performance Measurement. |
Any significant variance reported against Planned Spending set out in the 2006-2007 Report on Plans and Priorities is explained in Section 1.6 - Spending by Program Activity.
1.6 Spending by Program Activity
| Description | Planned Spending ($ in millions) |
Actual ($ in millions) |
Variance ($ in millions) |
| Space Based Earth Observation | 124.0 | 66.4 | 57.6 |
|
Comments:
The variance of $57.6 million was mainly due to the following factors: Under-spending of $25.3 million in the RADARSAT-2 Program caused by problems encountered in testing the spacecraft and by the change of launcher from Boeing to Starsem (Kazakhstan); these difficulties have delayed the launch date to Fall 2007. Reprofiling of $20.4 million to 2007-2008, 2008-2009 and 2009-2010 reference levels for the RADARSAT-Constellation Program. The phase A was prolonged in 2007-2008. Under-spending of $9.8 million in the Chinook Project caused by a series of difficulties; delay for redefining the project originally known as SWIFT as a new Canadian mission, several unusual problems for completing the system requirements, and uncommon impediments for procuring contracts to Canadian industries. Transfer of $1.2 million to other activities following the decision to abandon the Hydros project. |
|||
| Space Science and Exploration | 133.2 | 130.0 | 3.2 |
|
Comments:
The variance of $3.2 million resulted mainly from delays in awarding contract to industry for the NEOSSat project and from postponed announcement of opportunities to award contracts to university researchers. |
|||
| Satellite Communications | 32.3 | 29.3 | 3.0 |
|
Comments:
The variance of $3.0 million was mainly due to an under-spending of $2.3 million in the CASSIOPE Contribution Program caused by delays in the development of the payload for the Cascade satellites (e.g., DSU, C&DH components). This led to move the launch date from December 2007 to November 2008. |
|||
| Generic Space Activities in support of EO, SE and SC | 44.3 | 47.2 | (2.9) |
|
Comments:
The additional spending of $2.9 million was mainly due to the increase of $1.7 million in Canada's contributions to ESA General Budget activities, and $0.5 million for critical technology development to meet new specifications for the RADARSAT-Constellation small satellite bus. |
|||
| Space Awareness and Learning | 5.9 | 4.1 | 1.9 |
|
Comments:
The variance of $1.9 million in Space Awareness and Learning mainly resulted from under-spending in public communications activities caused by delays in the launches of RADARSAT-2 and the STS-118 mission in which Canadian Astronaut Dave Williams is participating. |
|||
| Corporate Services and Infrastructure | 34.5 | 37.5 | (3.0) |
|
Comments:
The variance of $3.0 million was mainly due to increased spending for Information Technologies. |
|||
* The table explains the major variances by Program Activity. Not mentioned are less significant gaps that occurred in ongoing programs, and variances that resulted from the adaptation of management practices in the new environment of the Program Activity Architecture (PAA). For 2006-2007, the PAA was amended in order to better monitor financial information by Program Activity and improve the coding in financial systems in order to fully link financial and performance information, and track every financial transaction by Program Activity expected results, starting April 1, 2006.
SECTION 2: Analyse of Program Activities by Strategic Outcome
2.1 Results-Based Measurement Methodology
The 2006-2007 Report on Plans and Priorities (RPP) and the Departmental Performance Report (DPR) are the second editions to be produced under the Management Resources and Results Structure (MRRS) Policy. The information presented in the following detailed analysis requires an update on the approach taken by the CSA in the implementation of results-based management. Information on the methodology used to measure expected results against performance indicators at each level of the Program Activity Architecture (PAA) is also provided.
Integration of the 3 "Rs" - Results-Responsibilities-Resources
The illustration below shows how each PAA level is managed by traceable results, responsibilities and resources information and according to a planning and performance measurement timetable.
3 Rs Integration Model at CSA
| PAA Levels | Results | Responsibilities | Resources | |
| Strategic Outcomes 10 years |
Strategic Results | President / Executive Committee | 10-year plan | |
| Program Activities >= 5 years |
Final Results | Executive Committee | 10-year plan | |
| Program Sub-Activities >= 3 years |
Intermediate Results | Executive Committee | Annual Reference Level Update (ARLU) | |
| Program Sub-Sub-Activities 3 years |
Immediate Results | Directors General | Annual Reference Level Update (ARLU) | |
| Program Sub-Sub-Activities 1 year |
Inputs-Outputs | Managers | Main Estimates |
Performance Measurement Implementation Status
In 2006-2007, the major milestones in the implementation of the MRRS were:
- A second consecutive year under a PAA management environment;
- The development of a custom-made information management system automatically linking results, responsibilities, and resources, and its utilization, on a voluntary basis, by nine out of the CSA's thirteen sectors; and,
- Upgrading of the indicator-records for all results presented in the 2006-2007 and 2007-2008 RPPs further to a performance measurement capacity assessment conducted after the 2005-2006 DPR.
The implementation of a results-based measurement regime is a work in progress requiring at least five full years for completion. The CSA has now completed its second year of implementation and has reached the following status:
CSA Strategic Outcomes: They remain the same as in 2006-2007. They have been revised and integrated in a single Strategic Outcome to be more in line with the CSA's mission. The revised Strategic Outcome will appear in the 2008-2009 RPP. During the revision process, socio-economic indicators were developed to measure CSA's Strategic Outcomes over a ten-year period, and they will also appear in the 2008-2009 RPP.
Program Activities: After a second year, it is still too early to report adequately against final results and performance indicators at the Program Activity level. The objectives and roadmaps set for each thrust of the Canadian Space Strategy, along with a ten-year financial plan, will require between three and five years to be measured and evaluated comprehensively. This year's DPR will only be able to provide either baseline information or a progress report made during the second year under a PAA management environment.
Program Sub-Activities: The Program Activities are broken down into sub-activities each carrying a specific objective. Intermediate results and performance indicators are still being developed and therefore should first appear in the 2008-2009 RPP.
Program Sub-Sub-Activities: Immediate results and performance indicators at the Sub-Sub Program Activity level were significantly improved over the past year. It is at this corner stone level of the PAA that the CSA can first link results (performance information), responsibilities (management accountability) and resources (financial information) and then proceed
with the higher and lower levels. Since April 1, 2007 this link has been made automatically for nine of the CSA's thirteen sectors, using a custom-made information management system. This year, performance information is starting to provide valuable indications about programs performance over a three-year span. This information will be accessible electronically from now on using the
link
http://www.space.gc.ca/asc/eng/resources/publications/default.asp.
Below Sub-Sub-Activities Level: At this level of the PAA, yearly program inputs and expected outputs are outlined in the CSA Sectors work plans. This level of information is very technical and therefore does not appear in the DPR.
How to Read Performance Information and Detailed Analysis
Program Activity: For this level, the information is reported against final results and performance indicators. The first Program Activity performance evaluation will take place in 2010. The five-year evaluation horizon corresponds with the approval of the Canadian Space Strategy by the Government of Canada in February 2005. This performance report provides either baseline information or a progress report made since the year 2005-2006.
Program Sub-Activity: For this level, intermediate results and performance indicators are still being developed and therefore will first appear in the 2008-2009 RPP.
Program Sub-Sub-Activity: For this level, the information is reported yearly against immediate results and performance indicators. A performance evaluation will take place in 2009. New this year, Program Sub-Sub-Activity level performance information is only accessible electronically at the following address, http://www.space.gc.ca/asc/eng/resources/publications/
default.asp.
Performance Analysis: Every year a performance analysis is completed for each level of the PAA. This analysis provides contextual, complementary or methodological, as well as financial and human resources information.
Highlights of Main Accomplishments: For each Program Sub-Activity, examples of achievements are selected from the array of projects and activities carried out by the CSA and its industry, academic and government partners, as outlined in the corresponding Report on Plans and Priorities.
2.2 Space Based Earth Observation
Program Activity: Space Based Earth Observation (EO)
Priority: Develop and operationalize the use of Space Based Earth Observation for the benefit of Canadians.
Performance Status: 83% (15/18) of the targets were met in 2006-2007.
This performance report provides either baseline information or a progress report made since the year 2005-2006.
The first Program Activity performance evaluation will take place in 2010. The five-year evaluation horizon corresponds with the approval of the Canadian Space Strategy by the Government of Canada in February 2005.
|
Space Based Earth Observation
Program Activity Performance Measurement |
|
|
Expected Result Delivery, directly or in partnership, of Space Based EO data, products and services in response to operational and scientific user requirements in the field of Environment, Resource and Land Use Management, Security and Foreign Policy, supported by access capacity development. |
|
| Indicators | Performance |
| 1. Number of RADARSAT operational users and applications. |
Commercial users have utilized a total of 30,970 frames with 17 different domains of application; 10 Federal Government departments have used a total of 6,755 frames.
Alaska Satellite Facilities (ASF) have processed a total of 55,815 frames. National Oceanic and Atmospheric Administration (NOAA) and National Ice Center (NIC) are the ASF's largest clients. |
| 2. Number of active missions supported directly or indirectly by Canada. | A total of 7 active missions and 12 missions in development were supported directly or indirectly. |
| 3. Growth in federal government departments and agency budgets allocated to the exploitation of Space Based EO data, derived information and services in the fields of the Environment, Resource and Land Use Management, Security and Foreign Policy. | There were 10 federal government departments using RADARSAT EO data in 2006-2007, compared to only 5 the previous year. |
| 4. Number of hits on the Canadian Geospatial Data Infrastructure (CGDI) related to CSA sponsored (directly and/or indirectly) scientific and operational missions. | During fiscal year 2006-2007, the Discovery Portal of GeoConnexion received an average of 3,909 visitors per month requesting an average of 379,530 pages per month for an estimated yearly total of 47, 000 visitors and 4.6 million pages. |
|
Performance Analysis Indicator 1 RADARSAT data can be ordered through 4 different order desks. A total of 6,755 frames were processed at the Canadian government order desk located at CSA and the Canadian Ice Services located at Environment Canada. The number of 10 departments does not take into account branches and divisions that are part of these departments (i.e. Canada Centre for Remote Sensing (CCRS), Canadian Forest Services (CFS), Geological Survey of Canada (GSC) are three branches of Natural Resources Canada). The largest government user of RADARSAT data is still the Canadian Ice Service of Environment Canada for ice monitoring activities. Environment Canada (EC), the Canadian Coast Guard (CCG), Transport Canada (TC), Department of National Defence (DND) and Fisheries and Oceans (DFO) are coordinating their efforts to implement ISTOP (Integrated Satellite Tracking of Polluters). By doing so, they have been more effective and have reduced their cost by sharing RADARSAT data acquired to monitor the targeted area. ISTOP became fully operational in 2006-2007. RADARSAT data are also used successfully for applications related to crop monitoring, ship detection, wetland mapping, ocean windfield mapping, oil spill, soil subsidence and soil movement monitoring, disaster monitoring and, especially, flood monitoring. The Alaska Satellite Facilities (ASF), handling data requests from the U.S. Governments as part of the U.S. allocation of the RADARSAT Mission, processing a total of 55,815 frames during the 2006-2007 period. The main areas of application for the frames processed by ASF are for sea ice monitoring, 40%, wind speed determination, 10%, geological hazards, 25% and scientific research, 25%. MacDonald Dettwiler and Associates (MDA) Geospatial Services Inc. (GSI) is responsible for the commercial sale of RADARSAT data. A total of 30,970 frames were sold by MDA for telemetry and commercial use through 5,283 orders in 2006-2007. Europe is the largest market, accounting for 41%, followed by Canada with 31 % and the U.S. with 12%. The Far East follows closely with 10%. Ship detection is the main application accounting for 32% of the frames, followed closely by applications related to the environment at 29%. Cartography at 10%, ice monitoring 9%, defence applications at 7%, and oil pollution at 5% are second in importance. These numbers do not include the frames ordered by Canadian government departments and agencies or processed at the Alaska Satellite facilities for the U.S. government. |
| Indicator 2 | ||
|
Missions |
Status |
Fields |
| Cloudsat (2006) | In operation | Environment |
| ERS-2 (2005) | In operation | Environment, Resource and Land Management |
| ESA- ENVISAT | In operation | Environment, Resource and Land Management |
| MOPPITT (1999) | In operation | Environment |
| OSIRIS (2001) | In operation | Environment |
| RADARSAT-1 (1995) | In operation | Environment, Resource and Land Management, Security and Foreign Policy |
| SCISAT (2003) | In operation | Environment |
| RADARSAT-2 (2007-2008) | In development | Environment, Resource and Land Management, Security and Foreign Policy |
| RSAT-Constellation (2012) | In development | Environment, Resource and Land Management, Security and Foreign Policy |
| PROBA-2 (2007) | In development | Environment |
| AQUARIUS (2009) | In development | Environment |
| CHINOOK (2010) | In development | Environment |
| SMOS (2008) | In development | Environment |
| SWARM (2010) | In development | Environment |
| ADM/AEOLUS (2009) | In development | Environment |
| EarthCARE (2013) | In development | Environment |
| CRYOSAT (2009) | In development | Environment |
| GOCE (2007) | In development | Environment |
| ESA SENTINEL -1 (2011) | In development | Environment, Resource and Land Management, Security and Foreign Policy |
|
Indicator 3 An increasing number of departments are using RADARSAT data. The largest users are still the Canadian Ice Center of Environment Canada, Natural Resources Canada, Fisheries and Oceans, Agriculture and Agri-Food Canada, National Defence and the Canadian Space Agency. It is worth noting that 4 other departments were repeat users of RADARSAT data during the 2006-2007 period - Parks Canada, the National Research Council, the Canadian Nuclear Safety Commission and Public Safety and Emergency Preparedness Canada. Last year, a total of 5,703 processed image frames were provided to federal departments and agencies. This year, a total of 6,755 processed image frames were provided for them. It has been impossible to establish an operational budget baseline for federal government departments and agencies as a whole. However, discussions are currently taking place among the government departments and agencies under the leadership of PWGSC, to consolidate the purchase of EO data for the government departments as a whole. If negotiations are successful, information on all EO data purchases, not just RADARSAT data, by Canadian government departments will be provided starting in 2008-2009. |
|
Indicator 4 Data on the number of hits on the Canadian Geospatial Data Infrastructure (CGDI) related to CSA sponsored scientific and operational missions were not provided on time because of major changes to the GeoConnections Web last year and informatics' deficiencies. During the coming year, CSA will work with CGDI to review and develop a more reliable, accurate and measurable indicator. In the meantime, GeoConnections has been able to provide us with some monthly statistics from their Discovery Portal, which connects databases with CSA supported missions. |
| 2006-2007 - Financial Resources ($ in millions) | ||
| Planned | Total Authorities | Actual Spending |
| 124.0 | 112.0 | 66.4 |
| 2006-2007 - Human Resources (FTEs) | ||
| Planned | Total Authorities | Actual |
| 76.2 | Not applicable | 70.1 |
Any significant variance reported against Planned Spending set out in the 2006-2007 Report on Plans and Priorities is explained in Section 1.6 - Spending by Program Activity.
For detailed performance information, go to: http://www.space.gc.ca/asc/eng/
resources/publications/default.asp
To learn more about Earth Observation, go to: http://www.space.gc.ca/asc/eng/
satellites/default.asp
2.3 Space Science and Exploration
|
Program Activity: Space Science and Exploration (SE) |
Priority: Understand the solar system and the Universe, expand our knowledge of the constituent elements and origins of life, and strengthen a human presence in space.
Performance Status: 86% (24/28) of the targets were met in 2006-2007.
This performance report provides either baseline information or a progress report made since the year 2005-2006.
The first Program Activity performance evaluation will take place in 2010. The five-year evaluation horizon corresponds with the approval of the Canadian Space Strategy by the Government of Canada in February 2005.
|
Space Science and Exploration
Program Activity Performance Measurement |
|
|
Expected Result Increased participation in Canadian and international opportunities in order to expand the scientific knowledge base available to Canadian academia and R&D communities in:
|
|
| Indicators | Performance |
| 1. Number of participations in Canadian and international space science missions. | A total of 6 new missions in 2006-2007; 1 mission related to Astronomy (17%) and 5 to Physical and Life Sciences (83%). |
| 2. Rate of successful missions (Total or partial successful Canadian missions/total missions with Canadian participation). | This year, 9 of a total of 33 missions reached launched, data production or completed status for an impressive success rate of 27%. |
| 3. Number of peer-reviewed papers over the next three years published in world-class scientific journals as a result of the CSA's participation in Canadian and international missions (papers featuring Canadian academia and/or R&D community). | A total of 711 peer-reviewed papers, featuring Canadian academia and/or R&D community, were published in 2006-2007 in Space Astronomy and Exploration, Solar-Terrestrial Relation, and Physical and Life Sciences. |
|
Performance Analysis
Indicator 1 |
||
|
Missions |
Status |
Fields |
| FUSE (1999) | Objectives met/in operation | Astronomy |
| ICE-First (2004) | Objectives met/completed | Life Science |
| MOST (2003) | Objectives met/in operation | Astronomy |
| WISE (2005) | Objectives met/completed | Life Sciences |
| MATROSHKA-R (2006) | Objectives met/in operation | Operational Space Medicine |
| BLAST (2007) | Objectives met/completed | Astronomy |
| THEMIS (2007) | Launched in 2007. | Solar-Terrestrial Relation |
| MVIS (2006-07) | Ready to launch | Physical Sciences |
| CCISS (2007) | In operation | Life Sciences |
| * ELERAD (2006) | In operation | Life Sciences |
| PMDIS/TRAC (2006) | In operation | Life Sciences |
| APXS (2009) | In development | Planetary Exploration |
| * BISE (2009) | In development | Life Sciences |
| * Cambium (2009) | In development | Life Sciences |
| CASSIOPE-ePOP (2008) | In development | Solar-Terrestrial Relation |
| CIMEX (2009) | In development | Physical Sciences |
| eOSTEO (2007) | In development | Life Sciences |
| EOEP/SWARM (2009) | In development | Solar-Terrestrial Relation |
| Hershel-HIFI/Spire (2008) | In development | Astronomy |
| ICAPS (2010) | In development | Physical Sciences |
| IVIDIL (2008) | In development | Physical Sciences |
| JWST-FGS (2013) | In development | Astronomy |
| PHOENIX (2007) | In development | Planetary Exploration |
| NEOSSAT (2009) | In development | Planetary Exploration |
| * NEQUISOL (2010) | In development | Physical Sciences |
| * Planck (2008) | In development | Astronomy |
| SCCO (2007) | In development | Physical Sciences |
| UVIT-ASTROSAT (2008) | In development | Astronomy |
| * Vascular (2009) | In development | Life Sciences |
| EVARM | Under review | Life Sciences |
| Insect Habitat | Under review | Life Sciences |
| MIMBU/ATEN | Under review | Solar-Terrestrial Relation |
| ORBITALS | Under review | Solar-Terrestrial Relation |
| (Year) = Actual or projected launch * = New missions in 2006-2007 |
||
|
Performance Analysis Indicator 2 For the purpose of this indicator, a mission is considered partly or totally successful when the status reads as: objective met, in operation, completed or launched. Analysis of the last three fiscal year, starting April 1, 2004 and ending on March 31, 2007, shows an overall mission success rate of 27% (9 out of 33) when all initiated missions are taken into account. Last year, this same method of calculation would have shown a mission success rate of 12% (3 out of 24). It is important to note however that all successful missions have met or are in the process of meeting their mission objectives. |
|
Indicator 3 This year, 711 peer-reviewed papers, featuring Canadian academia and/or R&D community, were published in Space Astronomy and Exploration, Solar-Terrestrial Relation, and Physical and Life Sciences. A breakdown of the information by field: Space Astronomy (393), Planetary Exploration (17), Solar-Terrestrial Relation (161), Physical Sciences (57) and Life Sciences (83). The 2005-2006 DPR indicated 83 papers. The actual total should have read 482 papers. The difference is due to improved publication monitoring. |
| 2006-2007 - Financial Resources ($ in millions) | ||
| Planned | Total Authorities | Actual Spending |
| 133.2 | 149.6 | 130.0 |
| 2006-2007 - Human Resources (FTEs) | ||
| Planned | Total Authorities | Actual |
| 191.9 | Not applicable | 175.4 |
Any significant variance reported against Planned Spending set out in the 2006-2007 Report on Plans and Priorities is explained in Section 1.6 - Spending by Program Activity.
For detailed performance information, go to: http://www.space.gc.ca/asc/eng/
resources/publications/default.asp
To learn more about Space Science and Exploration, go to: http://www.space.gc.ca/asc
/eng/sciences/default.asp and, http://www.space.gc.ca/asc/eng/
exploration/default.asp
2.4 Satellite Communications
|
Program Activity: Satellite Communications (SC) |
Priority: Provide all Canadians with the means to participate in and fully benefit from the global information age.
Performance Status: 78% (7/9) of the targets were met in 2006-2007.
This performance report provides either baseline information or a progress report made since the year 2005-2006.
The first Program Activity performance evaluation will take place in 2010. The five-year evaluation horizon corresponds with the approval of the Canadian Space Strategy by the Government of Canada in February 2005.
|
Satellite Communications
Program Activity Performance Measurement |
|
|
Expected Result 1
Increased access for Canadians to state-of-the-art communications systems and services to meet their social and economic needs. |
|
| Indicators | Performance |
| 1. Gap between current capabilities and future needs of Canadians for satellite communications and available or expected system capacity. | Baseline performance information will be available in the 2007-2008 DPR based on needs analysis currently taking place. |
| 2. Percentage of coverage over Canada by satellite and ground systems in place for commercial and governmental usage. |
Near 100% coverage over Canada for commercial usage.
Demonstration and trial campaign for the provision of government service to northern and remote communities is progressing well and is expected to be completed in March 2008. |
| 3. Utilization rate of Anik F2 Ka-band payload and in particular the service delivery utilizing the $50 million Government Ka-band capacity credit. |
Anik F2 now has 52,000 customer subscribers (basic service equivalents) in Canada in addition to the commercial services offered by Telesat to corporations.
The demonstration and trial campaign for the provision of government services to northern and remote communities using Government of Canada Capacity Credit are progressing well and are expected to be completed in March 2008. |
|
Performance Analysis Indicator 1 In 2007-2008, the CSA will undertake studies on communications satellite service needs and opportunities, from which baseline data will be drawn to measure the gap between current capabilities and future needs of Canada. |
|
Indicator 2 The CSA has deployed hubs in Vancouver and Winnipeg to demonstrate Ka-band applications and services using Anik F2's four northern beams. In conjunction with the existing infrastructure, nine Ka-band terminals were obtained to demonstrate institutional services and applications in the Canadian North. This ongoing trial campaign, scheduled to be completed by March 2008, will yield a comprehensive assessment of Ka-band performance in the four northern beams. Initiatives to upgrade the reliability and quality of service of the existing proof-of-concept services are expected to be undertaken in 2007-2008. |
|
Indicator 3 The number of modems installed to date is about 32,000 with a growing rate of 50-70 terminals per day. Based on Telesat's 4 tiers of service, this number translates into about 52,000 customer subscribers (also referred as basis service equivalents). The baseline performance of 52,000 subscribers for Anik F2 represents a commercial take-up rate higher than originally anticipated (the original take-up rate was estimated at 3,000 new basic service equivalents per month, which for the 11-month of service (May 2005 - March 2006) would equate to 33,000 basic service equivalents). Note that the maximum of 150,000 basic service equivalents available for Government use equates to a total of approximately 100 Mbps access for 11 years (ending in April 2015). Additional performance information on Anik F2 commercial take-up, such as number of communities served and type of applications and services used will be available once the operating upgrade by National Satellite Initiative (NSI) is up and running. Through its support of Anik F2, the Government of Canada has secured a Government Capacity Credit access worth $50 million over 11 years starting in May 2005. Industry Canada has transferred this Capacity Credit to the National Satellite Initiative (NSI) to support the Government's connectivity agenda for remote and underserved northern rural communities. So far, the Government of Canada Capacity Credit (GoC CC) access for Anik F2 has only been used for validation testing and concept demonstration purposes, resulting in a low rate of utilization since May 2005. The CSA is investigating implementation solutions to meet these requirements in 2007-2008. |
|
Expected Result 2 Better use of space communications, search and rescue, and global navigation satellite systems and applications to improve the efficiency and effectiveness of other government departments in delivering services to Canadians. |
|
| Indicators | Performance |
| 1. Number of joint studies and projects between the CSA and other government departments in the field of satellite communications, navigation and search and rescue. | A second joint study was conducted in 2006-2007 on Global Navigation Satellite Systems (GNSS) opportunities specific to the transportation sector. |
|
Performance Analysis
A first joint study, undertaken in 2005-2006 in cooperation with the Department of National Defence, Natural Resources Canada and Industry Canada, looked at the importance of GNSS technology to Canada and identified some of the country's strengths and opportunities. The analysis was based on the input of over 100 representatives from government, industry and academia. A second joint study, undertaken in 2006-2007 in cooperation with Transport Canada, has shown that many sectors within the transportation sector can benefit greatly from GNSS services. A review of the federal government GNSS governance model was recommended in both studies. To this end, CSA will consult with the other government departments involved in the two studies to organize a joint workshop to address this issue. |
| 2006-2007 - Financial Resources ($ in millions) | ||
| Planned | Total Authorities | Actual Spending |
| 32.3 | 29.9 | 29.3 |
| 2006-2007 - Human Resources (FTEs) | ||
| Planned | Total Authorities | Actual |
| 11.0 | Not applicable | 10.2 |
Any significant variance reported against Planned Spending set out in the 2006-2007 Report on Plans and Priorities is explained in Section 1.6 - Spending by Program Activity.
For detailed performance information, go to: http://www.space.gc.ca/asc/eng/
resources/publications/default.asp
To learn more about Satellite Communications, go to: http://www.space.gc.ca/asc/eng/
satellites/default.asp
2.5 Generic Space Activities in Support of EO, SE AND SC
|
Program Activity: Generic Space Activities in Support of EO, SE AND SC (GSA) |
Priority: Provide leadership, coordination or support to Earth Observation (EO), Space Science and Exploration (SE), and Satellite Communications (SC) Program Activities through generic technology research and space-qualification activities.
Performance Status: 86% (6/7) of the targets were met in 2006-2007.
This performance report provides either baseline information or a progress report made since the year 2005-2006.
The first Program Activity performance evaluation will take place in 2010. The five-year evaluation horizon corresponds with the approval of the Canadian Space Strategy by the Government of Canada in February 2005.
|
Generic Space Activities in Support of EO, SE AND SC
Program Activity Performance Measurement |
|
|
Expected Result
Innovative space technologies, techniques, and design and test methodologies in response to advanced developments required for future space missions and activities. |
|
| Indicators | Performance |
| 1. Number of technologies supported through one of the generic R&D programs used in a space mission or activity. | From the 31 projects that ended in 2006-2007, a total of 4 technologies were chosen for future space missions and 3 technologies were integrated into commercial products. |
| 2. Number of space missions making use of the David Florida Laboratory (DFL). | Six of the CSA's space missions were supported by DFL in 2006-2007. |
| 3. Number of peer-reviewed papers as a result of CSA generic technology R&D programs. | A total of 67 peer-reviewed papers, written by CSA's scientists and engineers, as a result of 2 CSA generic technology R&D programs. |
|
Performance Analysis Indicator 1 Harmonized performance measurement indicators for 2 Space Technology Programs - the Space Technology Research Program (STRP) and the Space Technology Development Program (STDP) - demonstrated that 1 technology was chosen out of 11 STRP projects for future space missions and that 3 technologies were chosen out of 20 STDP projects completed in 2006-2007 for future space missions; 3 technologies were integrated into commercial products for an impressive total of 23 % of new technology used. |
|
Indicator 2 In addition to the 6 space missions, the David Florida Laboratory also supported 3 technology development projects - the International Space Station (ISS), CANDARM-1 and the Microsat |
|
Indicator 3 Harmonized performance measurement indicators for 2 Space Technology Programs - Space Technology Research Program (STRP) and Space Technology Development Program |
| 2006-2007 - Financial Resources ($ in millions) | ||
| Planned | Total Authorities | Actual Spending |
| 44.3 | 49.2 | 47.2 |
| 2006-2007 - Human Resources (FTEs) | ||
| Planned | Total Authorities | Actual |
| 146.0 | Not applicable | 116.1 |
Any significant variance reported against Planned Spending set out in the 2005-2006 Report on Plans and Priorities is explained in Section 1.6 - Spending by Program Activity.
For detailed performance information, go to: http://www.space.gc.ca/asc/eng/
resources/publications/default.asp
To learn more about Generic Space Technology Supporting Earth Observation, Space Science and Exploration, and Satellite Communications, go to: http://www.space.gc.ca/asc/eng/
industry/technology.asp
To learn more about the David Florida Laboratory, go to: http://www.space.gc.ca/asc/eng/
dfl/default.asp
2.6 Space Awareness and Learning
|
Program Activity: Space Awareness and Learning (AL) |
Priority: Further public understanding and engagement with regards to space-related issues, ultimately leading to improvement in the scientific literacy of Canadians.
Performance Status: 87% (14/16) of the targets were met in 2006-2007.
This performance report provides either baseline information or a progress report made since the year 2005-2006.
The first Program Activity performance evaluation will take place in 2010. The five-year evaluation horizon corresponds with the approval of the Canadian Space Strategy by the Government of Canada in February 2005.
|
Space Awareness and Learning
Program Activity Performance Measurement |
|
|
Expected Result
Increase public awareness of Canada's activities in space and the space benefits that positively affect the quality of life of Canadians. |
|
| Indicators | Performance |
| 1. Awareness of Canadians measured by telephone survey every three years. |
Survey conducted in early 2005.
Results indicate that 46% of respondents are aware of the Canadian Space Agency as champion of space activities and that 19% of respondents have moderate knowledge of Canada's space activities. Next survey to be conducted in 2008-2009. |
|
Performance Analysis The survey was conducted with the general public to assess awareness, knowledge, and attitudes toward Canada's space program and related activities. The survey was administered by phone to 1,628 Canadian adult residents, on February 4 to 11, 2005. Based on a sample of this size, the overall results can be considered to be accurate within +/- 2.5%, 19 times out of 20. Several results contribute to determining levels of awareness. Other then the two results cited above, the following could also be considered:
Some 80% of Canadians surveyed think it is important for Canada to continue to have a space program and be active in the development of advanced technologies and science related to space. Respondents were asked to rate the importance of a number of benefits that result from investment in the Canadian Space Program. A strong majority viewed all potential benefits as important. Some 90% felt that monitoring the Earth for natural disasters is an important benefit, followed closely by monitoring our oceans, forests, wetlands and farmlands (88%), and new medical discoveries (87%). As well, significant numbers attributed importance to better telecommunications (83%) and leadership in robotics (81%). Benefits that also received strong responses included advancing humankind's knowledge (74%), enhancing Canada's international reputation (71%), and exploring the solar system (67%). |
| 2006-2007 - Financial Resources ($ in millions) | ||
| Planned | Total Authorities | Actual Spending |
| 5.9 | 5.2 | 4.1 |
| 2006-2007 - Human Resources (FTEs) | ||
| Planned | Total Authorities | Actual |
| 25.4 | Not applicable | 21.6 |
Any significant variance reported against Planned Spending set out in the 2006-2007 Report on Plans and Priorities is explained in Section 1.6 - Spending by Program Activity.
For detailed performance information, go to: http://www.space.gc.ca/asc/eng/
resources/publications/default.asp
To learn more about Space Awareness and Learning, go to:
http://www.space.gc.ca/asc/eng/media/default.asp; and,
http://www.space.gc.ca/asc/eng/educators/default.asp
2.7 Corporate Services and Infrastructure
|
Program Activity: Corporate Services and Infrastructure |
Priority: To implement the government's commitment to modern public service management in accordance with the Management Accountability Framework's (MAF) expectations.
Performance Status: 67% (8/12) of the targets met in 2006-2007.
This performance report provides either baseline information or a progress report made since the year 2005-2006.
|
Corporate Services and Infrastructure
Program Activity Performance Measurement |
|
|
Expected Result
Corporate Services provide added value for CSA managers in the performance of their duties. |
|
| Indicators | Performance |
| Services provided meet standards set under Government-wide and CSA policies as well as the expectations of the Management Accountability Framework. |
Ratings from the 2006 MAF assessments against the 18 indicators were:
Strong = 1 Compared to 2005, 7 indicator ratings (39%) have improved and 3 (17%) have declined. |
|
Performance Analysis Among the 18 criteria used in the assessment, the CSA showed a strong performance in Project Management and steady progress in Corporate Risk Management, with a rating rising from "opportunity for improvement" last year to "acceptable" in 2006. The CSA had varied results in the 3 areas identified as management priorities in the 2005: Integration of human resources and business planning: A Draft Integrated Corporate HR Plan 2007-2010 was developed and will be approved in June 2007. Development of a long-term investment plan: A Draft Integrated Long-term Investment Plan was developed and will be submitted for approval in 2007-2008. Project management: The CSA demonstrated that it has implemented a sound project management capacity compliant with the Treasury Board project approval policy suite, which includes a project management governance structure and a risk management framework. The Treasury Board has identified 3 management priorities for 2007: Asset Management: The CSA must complete the Long Term Capital Plan. Internal Audit Function: Although some key elements are in place, the CSA must develop and put in place an implementation plan for the new Policy on Internal Audit. The indicator rating is "Attention required". Financial Management and Control: Although the CSA usually exhibits good performance, compliance with government policies should be monitored, specifically in the overall quality and timeliness of its external financial reporting information. The Treasury Board assessment does not indicate management quality beyond MAF indicators. |
|
Expected Result 2 Key corporate risks are addressed and mitigated. |
|
| Indicators | Performance |
| Management and mitigation actions are implemented against the four highest priority risks identified in the CSA corporate risk profile. | Planned management and mitigations actions were completed in response to 3 out of the 4 highest priority corporate risks. |
|
Performance Analysis 1. All actions planned in the RPP 2006-2007 were completed in response to 2 of the 4 highest corporate priority risks, namely: Workforce Competencies: Increase the capacity of CSA to maintain a qualified workforce of public servants to deliver CSA's mandate within the government's legislative frameworks, policies and rules. As a result, 97% of managers had successfully completed the mandatory on-line assessment related to financial and human resources delegated authorities by December 31, 2006. Function/Process Integration: Increase the capacity of CSA to align its strategies, planning priorities, funding levels, operations and capacity to deliver and obtain clear understanding and buy-in from managers and staff at all levels. As a result, the new strategic outcome with a set of performance indicators will first appear in the 2008-2009 Report on Plans and Priorities; the CSA put in place a corporate information management system in response to Management of Resources and Results Structure policy requirements effective since April 1st, 2007; and drafted a Human Resources Strategic Plan to be submitted for approval by June 2007. 2. Some of the actions planned in the RPP 2006-2007 were completed in response to a third one, namely: Values and Ethics: Increase the capacity of the CSA to instil public service values, to develop a working environment free of harassment and promote respect for individuals, integrity and honesty. Since a new President had not been appointed, the CSA was not able to finalise and approve the governance structure and delegation of authority in order to improve its compliance with the Public Service values of respect, integrity, honesty and transparency. The revised governance structure will address the way other government departments and universities are to be approached. In the meantime, the current structure is in force. 3. No action planned in the RPP 2006-2007 was completed in response to the last corporate priority risk, namely: Stakeholder Support: Increase the capacity of CSA to involve other government departments and universities in teaming up and creating a synergy in developing and implementing space activities for the benefit of Canadians. The CSA was not able to put the engagement strategy with stakeholders in place as planned, or increase the frequency of advisory committee meetings. Source: CSA's Corporate Risk Profile (internal document). |
|
2006-2007 - Financial Resources ($ in millions) |
||
| Planned | Total Authorities | Actual Spending |
| 34.5 | 38.9 | 37.5 |
|
2006-2007 - Human Resources (FTEs) |
||
| Planned | Total Authorities | Actual |
| 239.0 | Not applicable | 215.6 |
Any significant variance reported against Planned Spending set out in the 2006-2007 Report on Plans and Priorities is explained in Section 1.6 - Spending by Program Activity.
For detailed performance information, go to: http://www.space.gc.ca/
asc/eng/resources/publications/default.asp
To learn more about Corporate Services and Infrastructure, go to:
http://www.space.gc.ca/asc/doc/maf_f.doc (The document is in French only.)
SECTION 3: Supplementary Information
3.1 Organizational Information
The organizational chart below was effective from April 1, 2005 to March 31, 2007. Reporting to the Minister of Industry, the CSA Chief Executive Officer is the President, assisted by the Senior Vice-President and the Vice-President of Science, Technology and Programs. The Policy, Planning and Relations Branch, the Communications Directorate, the Canadian Astronaut Office, and the Space Operations Branch report directly to the President. Three of the core branches report to the Vice-President of Science, Technology and Programs. The five Corporate Services report directly to the Senior Vice-President. Legal Services are provided by the Department of Justice.
3.2 Financial Tables
3.2.1 Comparison of Planned to Actual Spending (including Full-time Equivalents)
|
($ in millions) |
2004-2005 Actual |
2005-2006 Actual |
2006-2007 |
|||
|
Main Estimates |
Planned Spending |
Total Authorities |
Actual |
|||
| Space Based Earth Observation | 113.3 | 136.8 | 137.9 | 126.5 | 80.4 | |
| Space Science and Exploration | 136.7 | 146.5 | 148.1 | 164.7 | 144.5 | |
| Satellite Communications | 32.0 | 35.5 | 35.5 | 33.5 | 32.8 | |
| Space Awareness and Learning | 6.0 | 6.5 | 6.5 | 5.8 | 4.7 | |
| Generic Space Activities | 48.7 | 48.7 | 54.2 | 52.0 | ||
| Total | 286.0 | 288.0 | 374.1 | 376.7 | 384.7 | 314.4 |
| Less: Non-respendable revenue | (4.2) | (4.9) | N/A | (4.9) | N/A | (8.2) |
| Plus: Cost of services received without charge | 4.3 | 3.8 | N/A | 5.0 | N/A | 4.4 |
| Total Departmental Spending | 286.2 | 286.9 | N/A | 376.8 | N/A | 310.6 |
| Full-time Equivalents | 573 | 596 | N/A | 690 | N/A | 609 |
Notes:
|
3.2.2 Resources by Program Activity
|
2006-2007 |
|||||
|
Program Activity |
Budgetary |
Total |
|||
| Capital | Grants | Contributions | Total | ||
|
Space Based Earth Observation |
|||||
| Main Estimates | 56.6 | 67.6 | 0.2 | 12.4 | 136.8 |
| Planned Spending | 57.7 | 67.6 | 0.2 | 12.4 | 137.9 |
| Total Authorities | 61.3 | 53.5 | 1.4 | 10.3 | 126.5 |
| Actual Spending | 57.5 | 11.5 | 1.4 | 9.9 | 80.4 |
|
Space Science and Exploration |
|||||
| Main Estimates | 94.9 | 43.9 | 0.6 | 7.1 | 146.5 |
| Planned Spending | 94.8 | 45.5 | 0.6 | 7.1 | 148.1 |
| Total Authorities | 97.0 | 58.8 | 0.5 | 8.4 | 164.7 |
| Actual Spending | 94.7 | 41.1 | 0.5 | 8.1 | 144.5 |
|
Satellite Communications |
|||||
| Main Estimates | 9.1 | 0.1 | 0.0 | 26.3 | 35.5 |
| Planned Spending | 9.1 | 0.1 | 0.0 | 26.3 | 35.5 |
| Total Authorities | 5.7 | 0.1 | 0.0 | 27.7 | 33.5 |
| Actual Spending | 5.5 | 0.1 | 0.0 | 27.2 | 32.8 |
|
Space Awareness and Learning |
|||||
| Main Estimates | 5.8 | 0.0 | 0.5 | 0.2 | 6.5 |
| Planned Spending | 5.8 | 0.0 | 0.5 | 0.2 | 6.5 |
| Total Authorities | 4.8 | 0.0 | 0.8 | 0.2 | 5.8 |
| Actual Spending | 3.7 | 0.0 | 0.8 | 0.2 | 4.7 |
|
Generic Space Activities |
|||||
| Main Estimates | 38.6 | 3.1 | 0.1 | 7.0 | 48.7 |
| Planned Spending | 38.6 | 3.1 | 0.1 | 7.0 | 48.7 |
| Total Authorities | 41.2 | 3.9 | 0.0 | 9.1 | 54.2 |
| Actual Spending | 39.4 | 3.9 | 0.0 | 8.7 | 52.0 |
| Total | |||||
| Main Estimates | 205.0 | 114.7 | 1.4 | 52.9 | 374.1 |
| Planned Spending | 206.0 | 116.4 | 1.4 | 52.9 | 376.7 |
| Total Authorities | 210.0 | 116.4 | 2.7 | 55.6 | 384.7 |
| Actual Spending | 200.9 | 56.7 | 2.7 | 54.1 | 314.4 |
Notes:
|
3.2.3 Voted and Statutory Items
|
Voted or Statutory Item |
Truncated Vote or Statutory Wording |
2006-2007 |
|||
|
Main Estimates |
Planned Spending |
Total Authorities |
Actual |
||
| 25 | Operating expenditures | 194.4 | 195.3 | 201.1 | 192.0 |
| 30 | Capital expenditures | 114.7 | 116.4 | 116.4 | 56.7 |
| 35 | Grants and Contributions | 54.3 | 54.3 | 58.3 | 56.8 |
| (S) | Contributions to employee benefit plans | 10.7 | 10.7 | 8.9 | 8.9 |
| Total | 374.1 | 376.7 | 384.7 | 314.4 | |
Notes:
|
3.2.4 Services Received Without Charge
| ($ in millions) | 2006-2007 Actual Spending |
| Accommodation provided by Public Works and Government Services Canada (PWGSC). | 0.2 |
| Contributions covering employers' share of employees' insurance premiums and expenditures paid by TBS (excluding revolving funds). Employer's contribution to employees' insured benefits plans and associated expenditures paid by TBS. | 4.2 |
| Salary and associated expenditures for legal services provided by Department of Justice Canada. | 0.0 |
| Total 2006-2007 Services Received Without Charge | 4.4 |
3.2.5 Sources of Respendable and Non-Respendable Revenue
Non-Respendable Revenue
|
($ in millions) |
Actual Revenue 2004-2005 |
Actual Revenue 2005-2006 |
2006-2007 |
|||
|
Main Estimates |
Planned Revenue |
Total Authorities |
Actual Revenue |
|||
| Space Based Earth Observation | ||||||
| Royalty Revenues | 3.1 | 3.1 | N/A | 4.1 | N/A | 3.3 |
| Miscellaneous revenues | 0.0 | 0.0 | N/A | 0.0 | N/A | 4.0 |
| Generic Space Activities | ||||||
| Testing Facilities and Services of the David Florida Laboratory | 1.1 | 1.7 | N/A | 0.7 | N/A | 0.9 |
| Satellite Communications | ||||||
| Royalties from intellectual property | 0.0 | 0.0 | N/A | 0.1 | N/A | 0.0 |
| Total Non-Respendable Revenue | 4.2 | 4.9 | N/A | 4.9 | N/A | 8.2 |
Notes:
|
3.2.6 Resource Requirements by Branch or Sector
| ($ in millions) | Space Based Earth Observation | Space Science and Exploration | Satellite Communi- cations |
Space Awareness and Learning | Generic Space Activities | Total |
| Space Programs | ||||||
| Planned Spending | 66.0 | 43.2 | 20.3 | - | - | 129.6 |
| Actual Spending | 12.6 | 39.9 | 18.1 | - | - | 70.6 |
| Space Technologies | ||||||
| Planned Spending | 33.3 | 6.3 | 11.9 | 0.3 | 37.6 | 89.2 |
| Actual Spending | 35.5 | 9.0 | 11.2 | 0.1 | 40.4 | 96.3 |
| Space Sciences | ||||||
| Planned Spending | 5.1 | 27.2 | - | 0.1 | - | 32.4 |
| Actual Spending | 5.3 | 20.8 | - | 0.1 | - | 26.2 |
| Canadian Astronauts Office | ||||||
| Planned Spending | - | 5.1 | - | 0.3 | - | 5.3 |
| Actual Spending | - | 4.7 | - | 0.2 | - | 4.9 |
| Space Operations | ||||||
| Planned Spending | 19.4 | 52.4 | 0.3 | 0.1 | 7.1 | 79.3 |
| Actual Spending | 13.4 | 57.0 | 0.4 | 0.1 | 7.3 | 78.1 |
| Corporate Services Sector | ||||||
| Planned Spending | 13.0 | 12.4 | 3.0 | 5.9 | 4.0 | 38.3 |
| Actual Spending | 13.5 | 13.1 | 3.2 | 4.2 | 4.4 | 38.3 |
| Total | ||||||
| Planned Spending | 136.8 | 146.5 | 35.5 | 6.5 | 48.7 | 374.1 |
| Actual Spending | 80.4 | 144.5 | 32.8 | 4.7 | 52.0 | 314.4 |
Note:
|
3.2.7 User Fee Reporting - User Fees Act
| A. User Fee | Fees charged for the processing of access requests filed under the Access to Information Act (ATIA) | ||||||||||||||||||||
| Fee Type | Other products and services(O) | ||||||||||||||||||||
| Fee Setting Authority | Access to Information Act | ||||||||||||||||||||
| Date Last Modified | 1992 | ||||||||||||||||||||
| 2006-2007 | |||||||||||||||||||||
|
|||||||||||||||||||||
| Planning Years | |||||||||||||||||||||
|
|||||||||||||||||||||
|
B. Date Last Modified N/A |
|
C. Other Information The Canadian Space Agency (CSA) collects user fees for information requests in accordance with the Access to Information Act. All user fees collected in 2006-2007 are for application fees. There was no need to charge for preparation and search fees. |
3.2.8 Financial Statements of Departmental Corporations and Agents of Parliament

Click image to enlarge
Canadian Space Agency - Notes to the Financial Statements (unaudited)
1. Authorizations and goals
The Canadian Space Agency was decreed a "Department" on March 1st, 1989 under the Financial Administration Act, Section 2, paragraph b).
For its part, the Canadian Space Agency Act, on legal notice of the Prime Minister, and under Section 29 of the Act to establish the Canadian Space Agency and to provide for other matters in relation to space, was sanctioned on May 10, 1990 under Chapter 13 of the Laws of Canada (L.C. 1990). His excellence, the Governor-in-Council, had fixed the effective date of this Act at December 14, 1990. The objectives of the Canadian Space Program (CSP) are to ensure the development and application of space science and technology to meet Canadian needs and to ensure the development of an international competitive space industry in Canada.
According to the approved Program Activity Architecture (PAA), the Statement of operations was detailed by the following Program Activities (Business Lines):
Space Based Earth Observation (EO)
The program activity objective is to develop and make operational the use of space Earth Observation for the benefits of Canadian, especially in the fields of environment, resource and land use management, as well as security and foreign policy. In doing so, the CSA will maintain and expand Canada's leadership in Earth Observation technologies to obtain the timely, relevant and
essential information we need to make judicious decisions about that share our needs and goals.
Space Science and Exploration (SE)
The program activity objective is to better understand the solar system and the Universe; to expand our knowledge on the constituent elements and origins of life, and strengthen a human presence in space. In doing so, the CSA will sustain and increase Canada's contribution to humankind's scientific knowledge, to the exploration of our solar system and the Universe and to the
development of related technologies. This will advance supporting technologies and our fundamental and applies knowledge of chemistry, physics, life sciences by carrying out leading-edge experiments in the unique environment of space.
Satellite Communications (SC)
The program activity objective is to provide all Canadians with the means to participate and fully benefit from the global information age. In doing so, the CSA will uphold Canada's status as a world leaser in Satellite Communications, and extend the most advances products and services to all Canadians, everywhere.
Space Awareness and Learning (AL)
The program activity objective is to further public understanding and engagement with regards to space related issues, ultimately leading to improving the scientific literacy of Canadians by carrying out a national awareness and learning initiative in support of the Canadian Space Program.
Generic Space Activities in support of EO, SE and SC (GSA) The program activity objective is to provide leadership, co-ordination and support to Earth Observation (EO), Space Science and Exploration (SE), and Satellite Communications (SC) Program Activities through technology research and space-qualification activities that are generic in their nature. CSA commits to provide technologies and innovative space techniques, conceptual methods and testing that will satisfy developmental requirements for future missions and Canadian space activities.
2. Summary of significant accounting policies
The financial statements have been prepared in accordance with Treasury Board accounting policies, which are consistent with Canadian generally accepted accounting principles for the public sector.
Significant accounting policies are as follows:
- Parliamentary appropriations
The Agency is financed by the Government of Canada through Parliamentary appropriations. Appropriations provided to the Agency do not parallel financial reporting according to generally accepted accounting principles since appropriations are primarily based on cash flow requirements. Consequently, items recognized in the statement of operations and the statement of financial position are not necessarily the same as those provided through appropriations from Parliament. Note 3 provides a high-level reconciliation between the two bases of reporting. - Net cash provided by the Government
The Agency operates within the Consolidated Revenue Fund (CRF), which is administered by the Receiver General for Canada. All cash received by the Agency is deposited to the CRF and all cash disbursements made by the Agency are paid from the CRF. The net cash provided by Government is the difference between all cash receipts and all cash disbursements including transactions between departments of the federal government. - Change in net position in the Consolidated Revenue Fund
Change in net position in the Consolidated Revenue Fund is the difference between the net cash provided by Government and appropriations used in a year, excluding the amount of non-respendable revenue recorded by the Agency. It results from timing differences between when a transaction affects appropriations and when it is processed through the CRF. -
Revenues
- Revenues are accounted for in the period in which the underlying transaction or event occurred that gave rise to the revenues.
- Revenues that have been received but not yet earned are recorded as deferred revenues (see note 10).
-
Expenses
Expenses are recorded on the accrual basis:- Grants are recognized in the year in which the conditions for payment are met.
- Contributions are recognized in the year in which the recipient has met the eligibility criteria or fulfilled the terms of a contractual transfer agreement.
- Vacation pay and compensatory leave are expensed as the benefits accrue to employees under their respective terms of employment.
- Services provided without charge by other government departments for accommodation, the employer's contribution to the health and dental insurance plans and legal services are recorded as operating expenses at their estimated cost.
-
Employee future benefits
- Pension benefits: Eligible employees participate in the Public Service Pension Plan, a multi employer plan administered by the Government of Canada. The Agency's contributions to the Plan are charged to expenses in the year incurred and represent the Agency's total obligation to the Plan. Current legislation does not require the Agency to make contributions for any actuarial deficiencies of the Plan.
- Severance benefits: Employees are entitled to severance benefits under labour contracts or conditions of employment. These benefits are accrued as employees render the services necessary to earn them. The obligation relating to the benefits earned by employees is calculated using information derived from the results of the actuarially determined liability for employee severance benefits for the Government as a whole.
- Accounts and loans receivables
These are stated as amounts expected to be ultimately realized. A provision is made for external receivables where recovery is considered uncertain. - Contingent liabilities
Contingent liabilities are potential liabilities, which may become actual liabilities when one or more future events occur or fail to occur. To the extent that the future event is likely to occur or fail to occur, and a reasonable estimate of the loss can be made, an estimated liability is accrued and an expense recorded. If the likelihood is not determinable or an amount cannot be reasonably estimated, the contingency is disclosed in the notes to the financial statements. - Environmental liabilities
Environmental liabilities reflect the estimated costs related to the management and remediation of environmentally contaminated sites. The Agency does not have contaminated sites. In cases when the Agency feels obligated to incur costs related to contaminated sites, and when costs can be reasonably estimated following a detailed environmental analysis, a liability is accrued and an expense recorded when the contamination occurs or when the Agency becomes aware of the contamination and is obligated, or is likely to be obligated to incur such costs. - Inventories
Inventories consist of parts, material and supplies held for future program delivery and not intended for resale. They are valued at cost. If they no longer have service potential, they are valued at the lower of cost or net realizable value. - Foreign exchange
Transactions involving foreign currencies are translated into Canadian dollar equivalents using rates of exchange in effect at the time of those transactions. Monetary assets and liabilities denominated in a foreign currency are translated into Canadian dollars using the rate of exchange in effect on 31 March. -
Tangible Capital assets
All tangible capital assets and leasehold improvements having an initial cost of $10,000 or more are recorded at their acquisition cost. The department does not capitalize intangibles, works of art and historical treasures that have cultural, esthetic or historical value, assets located on Indian Reserves and museum collections.Amortization of tangible capital assets is done on a straight-line basis over the estimated useful life of the asset as follows:
Property category Useful life Buildings 30-40 years Works and infrastructures 30 years Material and equipment 10-20 years Computer material 5-7 years Computer software 3 years Other equipment including furniture 3-15 years Vehicles (non-military) 5 years Other vehicles 10 years Assets under construction Once in service, in accordance with asset type
- Measurement uncertainty
The preparation of these financial statements in accordance with Treasury Board accounting policies, which are consistent with Canadian generally accepted accounting principles for the public sector requires management to make estimates and assumptions that affect the reported amounts of assets, liabilities, revenues and expenses reported in the financial statements. At the time of preparation of these statements, management believes the estimates and assumptions to be reasonable. The most significant items where estimates are used are contingent liabilities, the liability for employee severance benefits and the useful life of tangible capital assets. Actual results could significantly differ from those estimated. Management's estimates are reviewed periodically and, as adjustments become necessary, they are recorded in the financial statements in the year they become known.
3. Parliamentary appropriations
The Canadian Space Agency receives most of its funding through annual Parliamentary appropriations. Items recognized in the statement of operations and the statement of financial position in one year may be funded through Parliamentary appropriations in prior, current or future years. Accordingly, the Agency has different net results of operations for the year on a government-funding basis than on an accrual accounting basis. The differences are reconciled in the following tables:
| (a) - Reconciliation of net cost of operations to current year appropriations used | |||
| 2007 | 2006 | ||
| ($ in thousands) | |||
| Net Cost of Operations | 315,921 | 288,388 | |
| Adjustments for items affecting net results but not affecting appropriations | |||
| Add (less): | |||
| Amortization of tangible capital assets | (90,963) | (92,000) | |
| Revenues not available for spending | 8,240 | 4,900 | |
| Services provided without charge from other government departments | (4,368) | (3,825) | |
| Refunds of previous year's expenses | 742 | 453 | |
| Increase (decrease) vacations pay and compensatory leave | (202) | (75) | |
| Loss on write-offs of capital assets | 85 | - | |
| Gain on disposal of capital assets (Surplus of Crown Assets) | 23 | - | |
| Increase (decrease) employee severance benefits | (35) | (693) | |
| Other | (106) | (2,142) | |
| Adjustments for items not affecting net results but affecting appropriations | |||
| Add (less): | |||
| Increase (decrease) prepaid expenses | 36,837 | 55,842 | |
| Acquisitions of tangible capital assets | 48,350 | 37,176 | |
| Proceeds from disposal of capital assets (Surplus of Crown Asset) | (23) | - | |
| Land transfer between departments (Transport Canada and CSA) | (85) | - | |
| Current year appropriations used | 314,416 | 288,024 | |
| (b) - Appropriations provided and used | |||
| 2007 | 2006 | ||
| ($ in thousands) | |||
| Appropriations provided: | |||
| Vote 30 - Operating expenditures | 201,087 | 177,087 | |
| Vote 35 - Asset acquisitions financed by the capital appropriation | 116,364 | 105,386 | |
| Vote 40 - Grants and contributions | 58,346 | 53,275 | |
| Statutory amounts | 8,901 | 9,296 | |
| Less: | |||
| Appropriations available for future years | (23) | - | |
| Lapsed appropriations: Operating | (9,100) | (2,682) | |
| Lapsed appropriations: Capital | (59,649) | (50,132) | |
| Lapsed appropriations: Grants and contributions | (1,510) | (4,206) | |
| Current year appropriations used | 314,416 | 288,024 | |
| (c) - Reconciliation of net cash provided by Government to current year appropriations used | |||
| 2007 | 2006 | ||
| ($ in thousands) | |||
| Net cash provided by Government | 299,583 | 290,718 | |
| Revenue not available for spending | 8,240 | 4,900 | |
| Refunds of previous years' expenses | 742 | 453 | |
| Change in net position in the Consolidated Revenue Fund | |||
| Increase (decrease) in accounts receivable and advances | (1,090) | 1,943 | |
| Increase (decrease) in accounts payable and accrued liabilities | 8,842 | (11,581) | |
| Decrease (increase) in deferred revenue | (4,031) | 9 | |
| Increase (decrease) in others liabilities | 2,236 | 3,724 | |
| Other | (106) | (2,142) | |
| 5,851 | (8,047) | ||
| Current year appropriations used | 314,416 | 288,024 | |
4. Expenses
The following table presents details of expenses by category:
| 2007 | 2006 | |
| ($ in thousands) | ||
| Operating expenses | ||
| Amortization of tangible capital assets | 90,963 | 92,000 |
| Professional and special services | 73,526 | 56,886 |
| Salaries & employee benefits | 64,789 | 63,307 |
| Acquisition of machinery and material | 18,423 | - |
| Travel & Communications | 8,356 | 6,789 |
| Utilities, materials and supplies | 5,700 | 12,392 |
| Purchased repair and maintenance | 2,688 | - |
| Information | 1,236 | 3,019 |
| Rentals | 462 | 6,406 |
| Loss on write-offs of capital assets | (85) | - |
| Other operating expenses | 3,846 | 1,009 |
| Total operating expenses | 269,904 | 241,808 |
| Transfer payments | ||
| International organizations | 33,127 | 32,479 |
| Industry | 20,806 | 18,649 |
| Individuals | 347 | 352 |
| Total transfer payments | 54,280 | 51,480 |
| Total expenses | 324,184 | 293,288 |
5. Revenues
The following table presents details of expenses by category:
| 2007 | 2006 | |
| ($ in thousands) | ||
| Revenues | ||
| Other fees and charges | 3,972 | - |
| Sale of rights and privileges | 3,307 | 3,144 |
| Sale of goods and services | 946 | 1,742 |
| Gain on disposal of capital assets (Surplus of Crown Assets) | 23 | 7 |
| Other non-tax revenue | 15 | 7 |
| Total Revenues | 8,263 | 4,900 |
6. Accounts receivables and advances
The following table presents details of accounts receivable and advances:
| 2007 | 2006 | |
| ($ in thousands) | ||
| Other federal departments or agencies | 2,976 | 1,270 |
| External entities | 679 | 1,268 |
| Employee advances | 19 | 27 |
| Less: Allowance for doubtful accounts on external receivables | (37) | (18) |
| Total | 3,637 | 2,547 |
7. Prepaid expenses
The following table presents details of prepaid expenses:
| 2007 | 2006 | |
| ($ in thousands) | ||
| RADARSAT-2 - prepaid services | 395,405 | 359,620 |
| Prepaid transfer payments | 6,548 | 4,038 |
| Other prepaid expenses | 210 | 1,668 |
| Total | 402,163 | 365,326 |
8. Tangible Capital Assets
| ($ in thousands) | ||||
| Cost | ||||
| Capital asset class | Opening balance | Acquisitions | Disposals and write-offs |
Closing balance |
| Land | - | 85 | - | 85 |
| Buildings | 110,223 | 622 | - | 110,845 |
| Works and infrastructures | 279 | - | - | 279 |
| Material and equipment | 30,507 | 2,809 | 24 | 33,292 |
| Computer material | 10,381 | 1,039 | 27 | 11,393 |
| Computer software | 2,124 | 2,391 | - | 4,515 |
| Other equipment | 1,561,726 | 240 | - | 1,561,966 |
| Vehicles (non-military) | 42 | - | 18 | 24 |
| Other vehicles | 172 | - | 11 | 161 |
| Assets under construction | 328,178 | 41,164 | - | 369,342 |
| Total | 2,043,632 | 48,350 | 80 | 2,091,902 |
| Accumulated amortization | Net bookvalue | |||||
| Capital asset class | Opening balance | Amorti-zation | Disposals and write-offs |
Closing balance | 2007 | 2006 |
| Land | - | - | - | - | 85 | - |
| Buildings | 48,968 | 3,702 | - | 52,670 | 58,175 | 61,254 |
| Works and infrastructures | 152 | 29 | - | 181 | 98 | 127 |
| Material and Equipment | 20,425 | 1,668 | 24 | 22,069 | 11,223 | 10,082 |
| Computer material | 7,597 | 1,201 | 27 | 8,771 | 2,622 | 2,785 |
| Computer software | 893 | 806 | - | 1,699 | 2,816 | 1,231 |
| Other equipment | 819,053 | 83,547 | - | 902,600 | 659,366 | 742,673 |
| Vehicles (non-military) | 36 | 5 | 18 | 23 | 1 | 6 |
| Other vehicles | 141 | 5 | 11 | 135 | 26 | 31 |
| Assets under construction | - | - | - | - | 369,342 | 328,178 |
| Total | 897,265 | 90,963 | 80 | 988,148 | 1,103,754 | 1,146,367 |
Amortization expense for the year ended March 31, 2007 is $ 90,963 (2006 - $92,000).
The land was transferred from Transport Canada to the Canadian Space Agency at the nominal value of $1. However, for consolidated purposes, the net book value was registered in CSA's books in order to eliminate any gain or loss at the government-wide level.
9. Accounts payable and accrued liabilities
The following table presents details of accounts payable and accrued liabilities:
| 2007 | 2006 | |
| ($ in thousands) | ||
| Accrued liabilities | 45,067 | 54,079 |
| Accounts payable | 37,611 | 19,818 |
| Contractor's holdback | 1,528 | 1,578 |
| Accrued salaries and wages | 1,365 | 1,337 |
| Accounts payable - OGD | 373 | 298 |
| Other accounts payable | 14 | 7 |
| Tax on Goods and Services (GST) | 8 | 7 |
| Total | 85,966 | 77,124 |
10. Deferred revenue
The following table presents details of revenues:
| 2007 | 2006 | |
| ($ in thousands) | ||
| RADARSAT-1: Amounts received from Canadian provinces and from NASA in exchange of scenes to be delivered at a later date. | ||
| Opening balance, April 1 | 3,972 | 3,972 |
| Plus: Receipts | - | - |
| Less: Write-off of deferred revenues for scenes never delivered and following the end of the agreement | 3,972 | - |
| Closing balance, March 31 | - | 3,972 |
| Sodexho: Rent received in advance | ||
| Opening balance, April 1 | 1 | 1 |
| Plus: Receipts | 1 | - |
| Less: Earned rent for march | 1 | - |
| Closing balance, March 31 | 1 | 1 |
| Space Training Project: Special purpose account created to record funds received for the payment of expenses related to the space-training project. | ||
| Opening balance, April 1 | 61 | 61 |
| Plus: Receipts | - | - |
| Less: End of agreement for the Space Training Project | 61 | 61 |
| Closing balance, March 31 | - | 61 |
| RADARSAT-2: Amount received to cover expenses for the accommodation and installation of MDA employees. | ||
| Opening balance, April 1 | 9 | - |
| Plus: Receipts | 2 | 9 |
| Moins: Earned revenues | - | - |
| Closing balance, March 31 | 11 | 9 |
| Closing balance total | 12 | 4,043 |
11. Other liabilities
The following table presents details of revenues:
| 2007 | 2006 | |
| ($ in thousands) | ||
| Non-monetary exchange CSA/NASA | 10,709 | 10,921 |
| Contractor's holdbacks | 7,270 | 4,820 |
| Participation of provinces - RADARSAT-1 | 104 | 106 |
| Total | 18,083 | 15,847 |
a) Non-monetary exchange CSA/NASA
Under the International Space Station Agreement, which was executed in 1998, and ratified by Canada in year 2000, following the passing of the Civil International Space Station Agreement Implementation Act, in 1999 the Agency signed a barter agreement with NASA in August 2001, which the fair value was estimated at $20.8 million U.S. Currently, all the costs are not available and the fair value of the yielded services must be revaluated when the identification of total costs will be possible. This agreement provides that the CSA exchanges a part of its utilization rights on the Space Station, access to the Canadian Microgravity Isolation Mount, and agrees to assume repair costs for its Special Purpose Dexterous Manipulator. In return, NASA will provide to the CSA, astronaut training, satellite and launch services. The transactions under this Barter Agreement may take place over the lifetime of the Space Station. During the fiscal years 2002 to 2007, the CSA received a part of astronaut training valued at $11 million CDN. As NASA did not exercise the option to access its proportion of Canada's utilization rights on the Space Station, a liability of $11 million CDN has been created by CSA. Relative to this barter agreement or other agreements of the same kind that the CSA may enter into with its International Partners under the Agreement on the Space Station, the Treasury Board grants to the Agency an exemption under the Policy on Accounting for Non-Monetary Transactions and does not have to charge the transaction(s) to its appropriation.
b) Participation of provinces - RADARSAT-1
This specified purpose account was established to record moneys received for both cost-sharing and advance payments for RADARSAT scenes. RADARSAT-1 is an Earth Observation satellite to monitor environmental change and planets natural resources. It provides information to both commercial and scientific users in the fields of agriculture, cartography, hydrology, forestry, oceanography, ice studies and coastal monitoring.
12. Employee benefits
a) Pension benefits
The Agency's employees participate in the Public Service Pension Plan, which is sponsored and administered by the Government of Canada. Pension benefits accrue up to a maximum period of 35 years at a rate of 2 percent per year of pensionable service, times the average of the best five consecutive years of earnings. The benefits are integrated with Canada/Qu�bec Pension Plans benefits and they are indexed to inflation.
Both the employees and the Agency contribute to the cost of the Plan. The 2006-2007 expense amounts to $6.54 million ($6.87 million in 2005-2006), which represents approximately 2.2 time (2.6 time in 2005-2006) the contributions by employees.
The Agency's responsibility with regard to the Plan is limited to its contributions. Actuarial surpluses or deficiencies are recognized in the financial statements of the Government of Canada, as the Plan's sponsor.
b) Severance benefits
The Agency provides severance benefits to its employees based on eligibility, years of service and final salary. These severance benefits are not pre-funded. Benefits will be paid from future appropriations. Information about the severance benefits, measured as at March 31, is as follows:
The following table presents details of revenues:
| 2007 | 2006 | |
| ($ in thousands) | ||
| Accrued benefit obligation, beginning of year | 9,929 | 9,236 |
| Plus: | ||
| Expense for the year | 408 | 1,137 |
| Less: | ||
| Benefits paid during the year | (373) | (444) |
| Accrued benefit obligation, end of year | 9,964 | 9,929 |
13. Contractual obligations
The nature of the Agency's activities can result in some large multi-year contracts and obligations whereby the Agency will be obligated to make future payments when the services/goods are received. Significant contractual obligations that can be reasonably estimated are summarized as follows:
| ($ in thousands) | ||||||
| 2008 | 2009 | 2010 | 2011 | 2012 and there after |
Total | |
| Acquisitions | 39 | 17 | 1 | - | - | 57 |
| Transfer payments | 48 | 39 | 27 | 11 | 10 | 135 |
| Capital assets | 28 | 3 | - | - | - | 31 |
| Total | 115 | 59 | 28 | 11 | 10 | 223 |
14. Related party transactions
The Agency is related as a result of common ownership to all Government of Canada departments, agencies, and Crown corporations. The Agency enters into transactions with these entities in the normal course of business and on normal trade terms. Also, during the year, the Agency received services, which were obtained without charge from other Government departments as presented in part (a).
| (a) Services provided without charge | ||
| During the year the Agency received without charge from other departments, accommodation, legal fees and the employer's contribution to the health and dental insurance plans. These services without charge have been recognized in the Agency's Statement of Operations as follows: | ||
| 2007 | 2006 | |
| ($ in thousands) | ||
| Employer's contribution to the health and dental insurance plans | 4,199 | 3,450 |
| Legal services | - | 206 |
| Accommodation | 169 | 169 |
| Total | 4,368 | 3,825 |
The Government has structured some of its administrative activities for efficiency and cost-effectiveness purposes so that one department performs these on behalf of all without charge. The costs of these services, which include payroll and cheque issuance services provided by Public Works and Government Services Canada and audit services provided by the Office of the Auditor General, are not included as an expense in the department's Statement of Operations.
| (b) Payables and receivables outstanding at year-end with related parties: | ||
| 2007 | 2006 | |
| ($ in thousands) | ||
| Accounts receivable with other government departments and agencies | 2,976 | 1,270 |
| Accounts payable to other government departments and agencies | 382 | 306 |
15. Comparative information
For fiscal year 2006-2007, the Canadian Space Agency added a new program activity; consequently comparative information by program activity is not available.
Also, some amounts of the preceding exercise were re-examined and sometimes reclassified in order to reflect accordingly the presentation of the current year.
|
Canadian Space Agency |
||
| 2007 | 2006 | |
| (in thousands of dollars) | ||
| Expenses (note 4) | ||
| Space Science and Exploration (SE) | 192,783 | 118,072 |
| Space Based Earth Observation (EO) | 47,566 | 131,388 |
| Generic Space Activities in support of EO, SE and SC (GSA) | 45,634 | - |
| Satellite Communications (SC) | 33,347 | 34,981 |
| Space Awareness and Learning (AL) | 4,854 | 8,847 |
| Total expenses | 324,184 | 293,288 |
| Revenues (note 5) | ||
| Space Science and Exploration (SE) | 13 | 1,960 |
| Space Based Earth Observation (EO) | 7,428 | 2,205 |
| Generic Space Activities in support of EO, SE and SC (GSA) | 818 | - |
| Satellite Communications (SC) | 3 | 588 |
| Space Awareness and Learning (AL) | 1 | 147 |
| Total revenues | 8,263 | 4,900 |
| Net cost of operations | 315,921 | 288,388 |
| 2007 | 2006 | |
| (in thousands of dollars) | ||
| ASSETS | ||
| Financial assets | ||
| Accounts receivable and advances (note 6) | 3,637 | 2,547 |
| Total financial assets | 3,637 | 2,547 |
| Non-financial assets | ||
| Prepaid expenses (note 7) | 402,163 | 365,326 |
| Tangible capital assets (note 8) | 1,103,754 | 1,146,367 |
| Total non-financial assets | 1,505,917 | 1,511,693 |
| TOTAL | 1,509,554 | 1,514,240 |
| Liabilities | ||
| Accounts payable and accrued liabilities (note 9) | 85,966 | 77,124 |
| Deferred revenues (note 10) | 12 | 4,043 |
| Vacation pay and compensatory leave | 3,407 | 3,205 |
| Employee severance benefits (note 12) | 9,964 | 9,929 |
| Other liabilities (note 11) | 18,083 | 15,847 |
| 117,432 | 110,148 | |
| Equity of Canada | 1,392,122 | 1,404,092 |
| TOTAL | 1,509,554 | 1,514,240 |
| 2007 | 2006 | |
| (in thousands of dollars) | ||
| Equity of Canada, beginning of year | 1,404,092 | 1,397,937 |
| Net cost of operations | (315,921) | (288,388) |
| Current year appropriations used (note 3) | 314,416 | 288,024 |
| Revenue not available for spending | (8,240) | (4,900) |
| Refunds of previous year's expenses | (742) | (453) |
| Change in net position in the Consolidated Revenue Fund (note3) | (5,851) | 8,047 |
| Services received without charge from other government departments (note 14a) | 4,368 | 3,825 |
| Equity of Canada, end of year | 1,392,122 | 1,404,092 |
| 2007 | 2006 | |
| (in thousands of dollars) | ||
| Operating activities | ||
| Net cost of operations | 315,921 | 288,388 |
| Non-cash items: | ||
| Amortization of tangible capital assets | (90,963) | (92,000) |
| Loss on write-offs of capital assets | 85 | - |
| Gain on disposal of tangible capital assets | 23 | - |
| Services provided without charge other government departments | (4,368) | (3,825) |
| Variations in Statement of Financial Position: | ||
| Increase (decrease) in prepaid expenses | 36,837 | 55,842 |
| Increase (decrease) accounts receivable and advances | 1,090 | (1,943) |
| Increase (decrease) accounts payable and accrued liabilities | (8,842) | 11,581 |
| Decrease (increase) deferred revenue | 4,031 | (9) |
| Increase (decrease) vacation pay and compensatory leave | (202) | (75) |
| Increase (decrease) employee severance benefits | (35) | (693) |
| Increase (decrease) other liabilities | (2,236) | (3,724) |
| Cash used by operating activities | 251,341 | 253,542 |
| Capital Investment activities | ||
| Acquisition of tangible capital assets | 48,350 | 37,176 |
| Transfer between departments (Transport Canada) | (85) | - |
| Proceeds from disposal of tangible capital assets | (23) | - |
| Cash used by capital investment activities | 48,242 | 37,146 |
| Financing activities | ||
| Net Cash provided by Government of Canada | (299,583) | (290,718) |
Contractual obligations. (note 13)
The accompanying notes form an integral part of these financial statements.
3.2.9 Response to Parliamentary Committees, Audits and Evaluations for Fiscal-Year 2006-2007
Response to Parliamentary Committees
No recommendation was received during the period covered by this report.
Response to the Auditor General
No recommendation was received during the period covered by this report. However, a Status Update for 2006-2007 on the 2002 recommendations was produced.
To learn more about the Status Update, go to: http://www.space.gc.ca/asc/eng/
resources/publications/pr-2005_response.asp
External Audits
The Public Service Commission tabled an Audit Report in May 2006.
To learn more about the Audit Report, go to: http://www.psc-cfp.gc.ca/audit-verif/reports/2006/csa/index_e.htm
Internal Audits or Evaluations
Several Audits and Evaluations were conducted in 2006-2007. The reports will be tabled in 2007-2008.
To learn more about previous year audits and evaluations, go to: http://www.space.gc.ca/
asc/eng/resources/publications/default.asp
Annexes
The following tables are reported on the CSA Web site at the following address:
http://www.space.gc.ca/asc/eng/resources/publications/default.asp
3.2.10) Policy on Service Standards for External Fees
3.2.11) Details on Project Spending
3.2.12) Status Report on Major Crown Projects
3.2.13) Details on Transfer Payments Programs (TPPs)
3.2.14) Procurement and Contracting
3.2.15) Travel Policies
3.2.16) Fuel Storage Tanks
3.2.10 Policy on Service Standards for External Fees
|
A. External Fee |
Service Standard |
Performance Result |
Stakeholder Consultation |
|
Fees charged for the processing of access requests filed under the Access to Information Act (ATIA). |
Response provided within 30 days following receipt of request; the response time may be extended pursuant to section 9 of the ATIA. Notice of extension to be sent within 30 days after receipt of request. The Access to Information Act provides fuller details. |
The most common performance measurement is the percentage of "on-time" responses as stipulated by the performance standard. For this reporting period the figures were 85% for the Access to Information Act and 100% for the Privacy Act. |
The Access to Information Act and the Access to Information Regulations establish the service standard. Consultations were undertaken by the Department of Justice and the Treasury Board Secretariat for amendments made in 1986 and 1992. |
|
B. Other Information
In November 2004, Treasury Board ministers approved the Policy on Service Standards for External Fees. The Policy requires departments to report on the establishment of service standards for all external fees charged on a non-contractual basis. In CSA's context this policy applies to the ATI Program, for fees charged for the processing of access requests filed under the Access to Information Act (ATIA). |
|||
3.2.11 Details on Project Spending
| ($ in millions) | Current Estimated Total Cost | Actual 2004-2005 | Actual 2005-2006 | 2006-2007 | |||
| Main Estimates | Planned Spending | Total Authorities | Actual | ||||
| Space Based Earth Observation | |||||||
| (Q) RADARSAT-1 (MCP) | 727.2 | 10.4 | 8.1 | 7.3 | 11.4 | 8.2 | 8.2 |
| (BC-Q) RADARSAT-2 (MCP) | 421.6 | 10.9 | 17.0 | 33.0 | 32.3 | 25.8 | 10.6 |
| (O-Q) SWIFT - CHINOOK (PPA) | 105.5 | 2.6 | 1.5 | 10.6 | 11.2 | 6.4 | 0.9 |
| (Q-O) HYDROS (PPA) | 1.3 | 0.3 | 0.3 | 1.2 | 1.5 | 0.0 | 0.0 |
| (BC-M-O-Q) SAR CONSTELLATION (PPA) | 207.2 | - | 4.7 | 26.7 | 27.0 | 28.6 | 8.2 |
| Space Science and Exploration | |||||||
| (BC) APXS (EPA) | 9.5 | - | - | 3.3 | 3.3 | 5.2 | 4.0 |
| (O) Herschel HIFI (EPA) | 11.0 | 3.5 | 3.9 | 0.6 | 0.3 | 0.7 | 0.7 |
| (O) JWST (MCP) | 98.4 | 3.4 | 8.3 | 24.2 | 25.1 | 33.1 | 22.2 |
| (O) MARS PHOENIX (EPA) | 28.8 | 8.4 | 11.9 | 5.1 | 6.2 | 7.9 | 6.7 |
| (O) NEOSSAT (EPA) | 6.1 | - | - | 2.0 | 2.3 | 2.1 | 0.1 |
| (O) UVIT (EPA) | 6.3 | - | 1.3 | 3.3 | 3.5 | 3.1 | 1.5 |
| Total | 1,622.9 | 39.6 | 56.9 | 117.3 | 124.0 | 121.2 | 63.1 |
Note:
|
|
Province where the capital project will be carried out: |
Class of Project: |
3.2.12 Status Report on Major Crown Projects
RADARSAT-1
Description
RADARSAT-1, Canada's first Earth Observation satellite is the only fully operational civilian remote sensing satellite that carries Synthetic Aperture Radar (SAR). This technology, contrary to optical sensor satellites, has the capacity to image day and night, in all weather conditions, regardless of cloud cover, smoke, haze and darkness. Launched in November 1995, RADARSAT-1 was meant to operate for five years with an impressive 96% operational reliability, to consistently supply timely, high-quality data to RADARSAT International (RSI) now a wholly owned subsidiary of MacDonald, Dettwiler and Associates (MDA) and other partners (federal and provincial government departments, NASA and the US National Oceanic and Atmospheric Administration). RADARSAT-1 is now in its 11th year of operation.
RADARSAT-1 operations will continue with the same level of high performance for satellite reliability and image production, ensuring the supply of data until full commissioning of RADARSAT-2 in early 2008. A contingency plan is in place to prescribe the use of foreign sensors as backup to RADARSAT-1 in order to continue to meet the needs of operational users until RADARSAT-2 data becomes available.
RADARSAT-1 acquires high quality images of the Earth, covering most of Canada every 72 hours and the Arctic every 24 hours. It has proven itself in gathering the data needed for more efficient resource management (e.g. support to fishing, shipping, oil and gas exploration, offshore drilling, mapping) as well as ice, ocean and environmental monitoring, disaster management, and Arctic and offshore surveillance.
Leading and Participating Departments and Agencies
| Sponsoring Agency: | Canadian Space Agency |
| Contracting Authority: | Public Works and Government Services Canada |
| Participating Departments: | Environment CanadaNatural Resources Canada (Canada Centre for Remote Sensing) |
Prime and Major Sub-Contractors
|
Prime Contractor:
- EMS Technologies |
- Ste.-Anne-de-Bellevue, Quebec |
|
Major Sub-Contractors:
- MacDonald, Dettwiler & Associates |
- Richmond, British Columbia |
|
Other Contractors:
- Ball Aerospace |
- Boulder, Colorado |
Major Milestones
Major milestones of the RADARSAT-1 Major Crown Project are now complete.
|
Major Milestones
- Preliminary studies |
Date
Complete |
| - Feasibility and concept definition | Complete |
| - Systems requirement and preliminary design | Complete |
| - Development and testing up to qualification test review | Complete |
| - Manufacture of the prototype flight sub-systems up to acceptance testing of the sub-systems |
Complete |
| - Assembly and integration of the sub-systems up to flight readiness review, plus post-launch and commissioning activities up to system acceptance |
Complete |
| - First Antarctica mission - Second Antarctica mission - Original Mission Life of five years |
Complete Complete Complete |
| - Satellite Operations | April 1996 to February 2008 |
Progress Report and Explanation of Variances
Effective Program Approval was obtained for RADARSAT-1 in March 1991, with launch in November 1995 and beginning of operations in April 1996. The initial system included receiving stations for Synthetic Aperture Radar (SAR) data in Prince Albert (Saskatchewan), Gatineau (Quebec), Fairbanks (Alaska) and McMurdo (Antarctica). CSA and RADARSAT International (now MDA) have since signed agreements with another 31 network stations distributed around the world: Argentina, Australia, Brazil, China, Japan, Kasakhstan, South Korea, Malaysia, Norway, Puerto-Rico, Russia, Saudi Arabia, Singapore, Taiwan, Thailand, Turkey, the United Kingdom and the United-States. Presently, a second station in Norway is undergoing the certification process. This list includes the agreements that have been also signed with transportable stations for the direct reception of RADARSAT-1 data: one in Italy, five in the U.S., one in Taiwan and one in France. Even more stations are expected to join the RADARSAT network in 2007.
Following a commissioning period, routine operations of RADARSAT-1 commenced in April 1996. The average system performance is being maintained at 95.8%. The worldwide client base includes more than 600 commercial and government users from over 60 countries.
Several system upgrades were completed over the past few years to enhance performance, reliability, and maintainability of RADARSAT-1. Highlights include: June 2005 - addition of a new Order Desk server for Joint Contingency Operation with ESA; November 2005 – completion of scheduled MMO/DBM database server and controller system upgrades (SunFire V240/Solaris 9 equipment); January 2006 – completion of a scheduled upgrade of all five planning stations in the MMO (SunBlade 100/Solaris 8 equipment); November 2006 – completion of a scheduled Order Desk dual redundant configuration system upgrade (SunFire V210/Solaris 10 equipment) and an improved algorithm and tool for computing shared SAR usage statistics was developed, validated and made operational.
Since October 2000, the CSA is a signatory, along with ESA and the Centre National d'�tudes Spatiales (CNES) in France, to the International Charter on Space and Major Disasters. The emphasis of the Charter is on multi-satellite support for disaster response and mitigation efforts around the world utilising RADARSAT-1 and satellites of other Charter member agencies. Since its official launch, the Indian Space Research Organisation (ISRO), the National Oceanic and Atmospheric Administration (NOAA), Argentina's Comisi�n Nacional de Actividades Espaciales (CONAE), the Japanese Aerospace Exploration Agency (JAXA), the United States Geological Survey (USGS) and the Disaster Monitoring Constellation (DMC) have also joined the Charter and participate fully in its operations. Following the last Charter Board meeting hosted by the USGS at its EROS Centre in Sioux Falls, South Dakota, in October 2006, negotiations are under way to include the U.S. private companies, GeoEye and DigitalGlobe, in the Charter operations to have access to some of the world's highest resolution satellite remote sensing data.
So far, there have been 116 activations of the Charter on events such as: floods in France, Canada, Russia, Austria, Germany, Indonesia, Morocco, Argentina, Nepal, the Dominican Republic, the Philippines, Sudan, Ha�ti, Namibia, the Czech Republic, Sri Lanka, Pakistan, Hungary, Romania and Colombia; landslides in Slovenia, Italy, Nepal, Russia and the Philippines; earthquakes in El Salvador, India, Afghanistan, Turkey, Algeria and Iran; volcanic eruptions in Italy, Congo, Montserrat, Colombia and Spain; oil spills off the coasts of Ecuador, Lebanon, Denmark, Yemen and Spain; forest fires in France, Portugal, Canada and Bolivia; and, wind storms in India and Mexico. The Charter extensively covered three of recent history's most devastating disasters, namely the Asian tsunami, Hurricane Katrina, and the Kashmir earthquake. The coverage of the Asian tsunami was furthermore conducted under CSA's direct lead.
The RADARSAT-1 system has been improved to provide on average a less than 2.5-hour turnaround in the electronic delivery of images to the Canadian Ice Service (CIS) for the production of ice charts and bulletins for the Canadian Coast Guard and other marine clients. The CIS continues to be one of the leading users of RADARSAT-1 data since the first operational data began to flow in February 1996. Recently, the CIS has been collaborating with Noetix Research, CSA, and RSI (now MDA) on an ESA-sponsored Global Monitoring for Environment and Security (GMES) Project - The Northern View - to provide regular RADARSAT-1 images in support of a Floe Edge Service for two communities in the Canadian Arctic.
The RADARSAT-1 Background Mission has archived one of the largest microwave remote sensing data collections in the world. In fact, it is the first multi-mode uniformly collected database of its kind ever created. The data archive is the result of several Background Mission global coverage campaigns undertaken in the past seven years. These include a complete coverage of the world's continents, continental shelves and polar ice caps, as well as complete coverage of nearly the Earth's entire landmass with two RADARSAT-1 imaging beams for the first ever beam-pair stereo data collection. This is the world's largest radargrammetric dataset currently available. Some of the continents, including North America, were covered more than once to generate seasonal snapshots in the form of wide-area SAR mosaics. High-resolution RADARSAT-1 image mosaics of Canada, the U.S., Australia and Africa were produced with the Background Mission data. Several time- and site-specific coverage types have also been done, such as that of the remote oceanic island localities, the world's major cities and capitals. A seasonal coverage of the tropical deltas is also underway, as is also a four-season continuous coverage of the Arctic. The latter coverage, which now has uninterrupted data records over the Arctic since the summer of 2003, supports the growing interest in the Arctic and climate change captured within the International Polar Year (IPY) activities. These baseline coverage campaigns of RADARSAT-1 have established benchmarks for the follow-on Canadian SAR missions to build upon.
MDA/GSI continues to provide Earth-Observation data, derived information products, and leading-edge services to global clients. The broad range of MDA/GSI products includes geo-corrected imagery, digital elevation models, and application-specific products such as flood and ocean oil-seep vectors to meet the demands for new markets. Products are delivered to clients via Internet in near-real time for time-critical operations such as disaster management and ship navigation. Other services include training, monitoring and emergency response services, and custom product generation, as well as Geographic Information Systems (GIS) project implementation.
Industrial Benefits
The Canadian Space Agency undertook a study to determine the achievements of RADARSAT data in support of ice mapping and related activities in Canada. The Canadian Ice Services was the first Canadian Government operational user of RADARSAT-1 data. The departments of Environment Canada (EC) Canadian Coast Guard (CCG) Transport Canada (TC) National Defense (ND) Fisheries and Oceans (DFO) have coordinated their efforts to implement an Integrated Satellite Tracking for Polluters initiative (ISTOP). In coordinating their effort they have been more effective and able to reduce their cost in sharing RADARSAT data acquired to monitor the targeted area. It became fully operational in 2006-2007. RADARSAT-1 provides observations over a wider geographical area, at much lower cost and risk, and in much less time than with an aircraft. As a result, CIS has been able to improve its operational efficiency. Over five years (1995 to 2000), the net average annual savings to CIS operations have been about $7.7 million per year ($38.5 million over 5 years), with the same per year benefits continuing up to and including the eighth year of operations for RADARSAT-1.
The Canadian Coast Guard (CCG), the largest direct customer of CIS products, has felt these benefits most significantly. The CCG Ice Operation Centres can provide improved routing information to commercial shipping, which allows for faster transit times. The shipping industry has benefited from the accuracy of RADARSAT information to produce ice charts. The shipping companies believe that as a result of RADARSAT-based ice charts, there have been savings in transit time through ice-infested waters. These commercial shipping savings are estimated to be $18 million a year. Other benefits included less damage to ships and a reduction in the need for CCG escorts. The CCG has estimated dollar savings in both operating costs and transit time to be between $3.6 million and $7 million a year, depending on the severity of ice conditions.
In the past, the prime contractor SPAR and its Canadian sub-contractors created over 2,000 person-years of high technology employment during the construction phase of RADARSAT-1. Ongoing mission operations employ 75 people at CSA headquarters in Longueuil (Quebec), 7 in Saskatoon (Saskatchewan), 15 at ground stations in Prince Albert (Saskatchewan) and Gatineau (Quebec), as well as more than 80 at RSI (now MDA) in Richmond (British Columbia). In the highly competitive marketplace for space-based information, MDA continues to capture roughly 15% of the world's space borne remote sensing market. MDA has continued to process scenes and integrate RADARSAT data into information products for delivery to nearly 600 clients in 60 countries, and furthermore, MDA has signed up 80 international distributions, 18 RADARSAT-1 Network Stations and 11 Resources Centres. The market development for data archives is likely to be significant and an area in which new benefits may develop.
RADARSAT-2
Description
The next generation of Canadian SAR-based satellite, RADARSAT-2, will be the most advanced satellite of its kind in the world. RADARSAT-2 will continue to provide all-weather, day-and-night coverage of the entire globe to support fishing, shipping, oil and gas exploration, offshore drilling, mapping and ocean research. Equipped with a C-band radar system, it will be the first fully commercial SAR satellite to offer multi-polarization, an important aid in identifying a wide variety of surface features and targets. It will also have the capability to image both the right and left with a resolution down to three metres and to access an area of 800 kilometres on either side. This translates into a new range of products and services, which will contribute valuable new information on natural resources and the global environment.
The RADARSAT-2 Major Crown Project, in partnership with MacDonald, Dettwiler and Associates (MDA), is elaborating the design, development, testing, deployment and operations of a space-borne SAR satellite to provide global coverage of terrestrial phenomena as a follow-up to RADARSAT-1. The current estimated total cost from CSA budget is $421.6 million.
RADARSAT-2 design and construction improves upon RADARSAT-1, with new capabilities to ensure Canada's continued leadership in the satellite remote sensing global marketplace and to create a commercial industrial satellite remote sensing industry in Canada.
Leading and Participating Departments and Agencies
| Sponsoring Agency: | Canadian Space Agency |
| Contracting Authority for the CSA/MDA Master Agreement: | Canadian Space Agency |
| Participating Departments: | Natural Resources Canada (Canada Centre for Remote Sensing) Environment Canada Industry Canada Fisheries and Oceans National Defence Foreign Affairs International Trade Agriculture Canada |
Prime and Major Sub-Contractors
|
Prime Contractor:
- MacDonald Dettwiler, and Associates (MDA) |
- Richmond, British Columbia |
|
Major Sub-Contractors:
- EMS Technologies (now MacDonald Dettwiler, and Associates) |
- Ste.-Anne-de-Bellevue, Quebec |
Major Milestones
The major milestones on Major Crown Projects, by phase, are the following:
| Phase | Major Milestones | Date |
| A and B | Requirement Definition | June 1999 |
| C | System Design | May 2002 |
| D1 | Sub-system Construction | September 2005 |
| D2 | Integration and Testing | January 2007 |
| E1 | Pre-launch Preparations | July 2007 |
| E2 | Launch System Commissioning |
November 2007 February 2008 |
| E3 | Operations | 2008 to 2014 |
Progress Report and Explanation of Variances
In June 1994, the government directed the CSA to develop an arrangement with the private sector for the development and operation of a RADARSAT follow-on program to maintain continuity of data following RADARSAT-1. In February 1998, following a formal Request for Proposal, MDA was selected to construct and operate RADARSAT-2.
The CSA and MDA signed a Master Agreement in December 1998 for the RADARSAT-2 mission, under a firm price agreement in which the government contribution was $225 million, in exchange for data. MDA was to invest $80 million. The Master Agreement between the CSA and MDA was updated in January 2000 to reflect changes in the schedule and the latest cost estimates. The company (MDA) is responsible for spacecraft operations and business development, while the CSA is responsible for arranging the launch and maintaining the long-term national archive of RADARSAT-2 data. The CSA will also provide an additional "in-kind" contribution of certain assets, plus the services of its David Florida Laboratory and the NRC Institute of Aerospace Research Laboratory for spacecraft integration and testing.
In November 1998, Treasury Board approved the RADARSAT-2 Major Crown Project with a funding envelope of $242.2 million. In March 2000, Treasury Board approved an increase of $47.1 million to cover the cost of changing bus suppliers, required by US -government restrictions imposed on the US bus supplier at that time, and an increase of $12.3 million for upgrades to existing satellite ground station infrastructures. In June 2000, Treasury Board approved an increase of $108 million to cover the cost of procuring a commercial launch as a result of NASA withdrawing from the agreement to provide launch for RADARSAT-2 in exchange for data, as it did for RADARSAT-1. In June 2001, Treasury Board approved an increase of $6 million to cover the cost of critical modifications to be made to the RADARSAT-2 spacecraft in order to accommodate a potential future tandem mission with RADARSAT-3.
The development of the RADARSAT-2 satellite has progressed, though at a slower pace than planned. Delays encountered by the main contractor and sub-contractors in the production of some of the satellite components have resulted in a significant delay in the assembly, integration and testing of the spacecraft. The Extendible Support Structure (ESS), one of the primary spacecraft sub-systems, was delivered to the Assembly, Integration and Test (AI&T) site at the David Florida Laboratory (DFL) in October 2003. The Solar Arrays and the Bus were delivered to DFL in April and May 2004, respectively. The SAR antenna was delivered in September 2005. The assembly, integration and test of the RADARSAT-2 spacecraft was completed in time at the David Florida Laboratory, along with the operations-preparations activities at CSA St-Hubert, Quebec, and launch campaign in Baikonur, Kazakhstan. Launch on a Soyuz rocket was rescheduled in November 2007. The initial phase of the commissioning of RADARSAT-2 should be completed by February 2008.
Any additional costs to complete the construction and launch of RADARSAT-2 will be at the main contractor's expense. However, these additional delays will require that the CSA RADARSAT-2 project office remain operational beyond the time for which funding is available. The necessary funding to cover all additional expenditures has been set aside in the CSA Five Year Risk Assessment and Source of Funds Plan.
Industrial Benefits
Significant industrial benefits in the space and earth observation sector are expected from this next-generation satellite system. The RADARSAT-2 program will generate employment growth in the Canadian knowledge-based economy, mostly from export sales, and spur the growth of small- and medium-sized businesses as the Canadian infrastructure and services industry continues to grow.
A major objective of this project is the transition of the Earth Observation industry from the public sector to the private sector. The intention is to build on the SAR data and value-added markets established with RADARSAT-1 to strengthen the Canadian industry's position as a supplier of SAR-related technology, systems and value-added products and services. Specifically, manufacturing potential and competitiveness will be encouraged in Canadian industry in the areas of phased array antenna design/manufacture, high performance receiver/transmitter design and manufacture, and enhanced structure design. Moreover, opportunities will be created for the export of ground station systems. The new capabilities also make new applications possible, creating new and expanded markets for data sales and value-added products.
As of March 31, 2006, the Canadian Space Program has funded $377.8 million worth of work to Canadian industry directly attributable to the RADARSAT-2 Major Crown Project (MCP). Direct industrial benefits from the construction of the RADARSAT-2 system will benefit all regions of Canada. The regional distribution of direct industrial benefits is shown in the following table.
Regional Distribution of RADARSAT-2 Contracts
(as of January 2007)
| Program | British Columbia |
Prairie Provinces |
Ontario | Quebec | Atlantic | Total Canada |
| RADARSAT-2 | 54.4% | 3.7% | 5.4% | 35.9% | 0.7% | 100% |
Note: Due to rounding, decimals may not add up to totals shown.
Summary of Non-Recurring Expenditures ($ in millions)
(as of March 2007)
| RADARSAT-2 | Current Estimated Total Expenditure | Actual Spending March 31, 2007 | Planned Spending 2007-2008 | Future Years |
| 421.6 | 404.1 | 17.5 | 0 |
3.2.13 Details on Transfer Payments Programs (TPPs)
| Contribution to European Space Agency (ESA) | |
| Start date: January 1, 2000 | End Date: December 21, 2009 |
|
Description:
Enhance Canadian industry's technological base and provide access to European markets for value added products and services principally in the field of Earth Observation (EO) and Satellite Communications; allow the participation of Canadian academia; and, make possible the demonstration of Canadian space technologies in European science and exploration missions. |
|
|
Strategic Outcomes:
Environment and Sustainable Development: A Space Program that helps Canada understand and protect the environment, and develop its resources in a sustainable manner. Knowledge, Innovation and Economy: A Space Program that generates knowledge and pushes innovation, while leading (where appropriate) to increased productivity and economic growth through commercialization. Sovereignty and Security: A Space Program that supports recognition of Canada's sovereignty and the security of its communities. Expected Results (Program Activity Level) Space Based Earth Observation: Delivery, directly or in partnership, of Space Based EO data, products and services in response to operational and scientific user requirements in the field of Environment, Resource and Land Use Management, and Security and Foreign Policy, supported by access capacity development. Space Science and Exploration: Increased participation in Canadian and international opportunities in order to expand the scientific knowledge base made available to Canadian academia and R&D communities in astronomy, space exploration and solar-terrestrial relation as well as physical and life sciences. Satellite Communications: 2) Better use of space communications, search and rescue, and global navigation satellite systems and applications to improve the efficiency and effectiveness of other government departments and organizations in delivering services to Canadians. Generic Space Activities in support of EO, SE and SC: Innovative space technologies, techniques, and design and test methodologies in response to advanced developments required for future space missions and activities. |
|
|
Expected Accomplishments:
Successful development and demonstration of advanced technologies, systems, components, and studies provided for in the contracts awarded by ESA to Canadian firms under the following ESA EO programs: ENVISAT, EOEP/ EOPP, Earth Watch GMES, TerraSar, and Aurora. Successful development and demonstration of advanced technologies, systems, components, and studies provided for in the contracts awarded by ESA to Canadian firms under the following ESA Telecommunications programs: ARTES 1,3,5,9, Artemis and GalileoSat. Increased utilization of data obtained from ESA on markets and Earth Observation/Telecommunications technologies as strategic information for government departments, agencies and industries in Canada. Demonstration of space-qualified technologies and products developed by Canadian firms for the space exploration markets. Development of new alliances and/or strengthening of established alliances between Canadian and European companies, to diversify Canada's international space partnerships and complement its long-standing relationship with the U.S. Actual Accomplishments: Several technologies and skills have been developed and improved through the participation of Canadian companies in ESA programs. Some businesses have integrated these technologies into products, allowing them to sell these products in other than European markets. In addition to generating revenues, the development and improvement of space technologies also created or maintained specialized jobs. In addition, specialized skills were created in the areas of space hardware, ground segment, and space technology applications. The program served to boost the visibility of Canada in European markets. Canadian contractors see the ESA Contribution program as a means of cultivating business relationships. The program also fosters regional development and access to other markets by virtue of the successes of companies in Europe. Furthermore, Canada expanded its knowledge and technology in fields such as weather and ice movement forecasting, Earth Observation data, satellite communications technologies, environmental monitoring and security. |
|
| ($ in millions) | Actual Spending 2004-2005 | Actual Spending 2005-2006 | Planned Spending 2006-2007 | Total Authorities 2006-2007 | Actual Spending 2006-2007 | Variance between Planned vs. Actual |
| Space Based Earth Observation | 15.4 | 17.1 | 12.4 | 10.3 | 9.9 | 2.5 |
| Space Science and Exploration | 3.9 | 3.7 | 5.3 | 6.1 | 5.8 | (0.5) |
| Satellite Communications | 10.7 | 9.1 | 8.3 | 11.6 | 11.0 | (2.7) |
| Generic Space Activities in support of EO, SSE & SC | 7.0 | 9.0 | 8.7 | (1.7) | ||
| Total Contributions | 30.0 | 29.9 | 33.0 | 37.0 | 35.5 | (2.5) |
| Total PA | 30.0 | 29.9 | 33.0 | 37.0 | 35.5 | (2.5) |
Notes:
|
||||||
|
Comment on Variances:
The additional contribution to ESA served to increase Canada's participation in the Advanced Research Telecommunication System (ARTES) in the amount of $6.4 million ($2.64 million approved in 2006-2007 Supplementary Estimates and $3.96 million to be paid in 2007-2008). The ARTES is part of an ESA flagship Telecommunications program whose objective is to support the R&D efforts of the European and Canadian industry in the area of Satellite Communications, serving in particular to define, assess and promote the use of satellites for advanced fixed, broadcasting, multimedia and mobile communications, data relay, search and rescue, navigation, and aeronautical services. This increase is made in accordance with the objectives and terms and conditions of the 2000-2009 Canada/ESA Cooperation Agreement. The Canadian industry (like that of other member states) is awarded contracts for the implementation of ESA optional programs in direct proportion to Canada's financial contributions to ESA. |
||||||
|
Significant Audit & Evaluation Findings and URL (s) to the Last Audit and / or Evaluation:
Canada is well thought of by Europeans, as the 28 years of cooperation between ESA and Canada clearly demonstrate. Canadian companies have made a significant contribution to the many technologies developed in the areas of Earth Observation and Satellite Communications. Several businesses have developed business relationships with Europe thanks to the Agreement, and all stakeholders in the program agree that these relationships could continue, provided that Canada maintains its financial contribution to ESA. Canadian businesses have cultivated alliances with each other to benefit from or facilitate access to European markets through ESA programs under the Agreement. The program helps diversify and open markets and aids in the achievement of objectives under the Canadian Space Strategy respecting Earth Observation and Satellite Communications. However, it does not lead to the transfer of technologies as much as to the exchange of information on technologies. Small and medium-sized companies have difficulty taking part in ESA programs and require greater support, not only to access these markets, but also to develop expertise so that they can continue doing business in these markets after their initial participation in ESA programs. Source: Evaluation of the Canada/ESA Cooperation Agreement http://www.espace.gc.ca/asc/eng/resources/publications/ |
||||||
| CASSIOPE Mission | ||||||
| Start date: November 1, 2003 | End Date: October 31, 2008 | |||||
|
Description:
Support the integration of two payloads on a single generic Canadian small satellite bus the CASCADE telecommunications Ka-band component and the enhanced Polar Outflow Probe (e-POP) scientific instrument. |
||||||
|
Strategic Outcomes:
Environment and Sustainable Development: A Space Program that helps Canada understand and protect the environment, and develop its resources in a sustainable manner. Knowledge, Innovation and Economy: A Space Program that generates knowledge and pushes innovation, while leading (where appropriate) to increased productivity and economic growth through commercialization. Sovereignty and Security: A Space Program that supports recognition of Canada's sovereignty and the security of its communities. Expected Results (Program Activity Level) Satellite Communications: 2) Better use of space communications, search and rescue, and global navigation satellite systems and applications to improve the efficiency and effectiveness of other government departments and organizations in delivering services to Canadians. Space Science and Exploration: Increased participation in Canadian and international opportunities in order to expand the scientific knowledge base made available to Canadian academia and R&D communities in astronomy, space exploration and solar-terrestrial relation as well as physical and life sciences. |
||||||
|
Expected Accomplishments:
Development and demonstration of the CASCADE Ka-band telecommunications payload designed and built by Canadian companies. CASCADE is the precursor of communication satellite constellations that will help position the Canadian industry on the international market as a supplier of advanced components and a service provider. Development of a small Canadian scientific satellite, the enhanced Polar Outflow Probe (e-POP), which will probe the upper atmosphere and ionosphere region where solar variability influences global change in various time scales. Development of a generic Canadian small satellite bus that could also be used for future Canadian missions. |
||||||
|
Actual Accomplishments:
Continued manufacture of the Cascade payload and preparation for assembly, integration and test in the spacecraft. Continued manufacture of e-POP instruments, data handling units and booms. Planned payload assembly and test and integration into the spacecraft. Continued manufacture, test and integration of the generic small satellite. |
||||||
| ($ in millions) | Actual Spending 2004-2005 | Actual Spending 2005-2006 | Planned Spending 2006-2007 | Total Authorities 2006-2007 | Actual Spending 2006-2007 | Variance between Planned vs. Actual |
| Space Science and Exploration | 3.2 | 3.2 | 1.8 | 2.3 | 2.3 | (0.5) |
| Satellite Communications | 14.3 | 14.5 | 18.0 | 16.2 | 16.2 | 1.8 |
| Total Contributions | 17.5 | 17.7 | 19.8 | 18.5 | 18.5 | 1.3 |
| Total PA | 17.5 | 17.7 | 19.8 | 18.5 | 18.5 | 1.3 |
Notes:
|
||||||
|
Comment on Variances:
CASSIOPE: Program delays due to problems with the development of critical components (DSU, C&DH) and the move of the launch date from December 2007 to November 2008. After detailed reviews of all the mission components, the schedule and milestones were modified to fit the new program schedule and launch date and the cash flow projections were adjusted accordingly. EPOP: The additional funding for ePOP was necessitated by the extension of the CASSIOPE schedule and slippage of the launch date, which are beyond the control of the University of Calgary. The schedule extension will require the University of Calgary to stretch instrument development, assembly and test to fit the extended CASSIOPE schedule and maintain the project development teams at the universities and in industry for a longer period. The integration of ePOP with the CASSIOPE spacecraft is MDA's responsibility, and will be performed at Bristol in Winnipeg and at the David Florida Lab in Ottawa. Synchronization of all program elements and activities, including the ePOP payload development, integration and test, is critical for success. |
||||||
|
Significant Audit & Evaluation Findings and URL (s) to the Last Audit and / or Evaluation: None |
||||||
3.2.14 Procurement and Contracting
Procurement and contracting are central to CSA program delivery. Most program objectives are achieved through the procurement of space hardware and services from Canadian industry, often implemented under international arrangements. In 2006-2007, the CSA awarded all of its contracts in accordance with Government Contracts Regulations.
3.2.15 Travel Policies
Comparison to the TBS Special Travel Authorities:
| Travel Policy of the Canadian Space Agency: The Canadian Space Agency follows the TBS Special Travel Authorities. |
| Authority: n/a |
| Coverage: n/a |
| Principal difference(s) in policy provisions: n/a |
| Principal financial implications of the difference(s): n/a |
Comparison to the TBS Travel Directive, Rates and Allowances:
| Travel Policy of the Canadian Space Agency: The Canadian Space Agency follows the TBS Travel Directive, Rates and Allowances. |
| Authority: n/a |
| Coverage: n/a |
| Principal difference(s) in policy provisions: n/a |
| Principal financial implications of the difference(s): n/a |
3.2.16 Fuel Storage Tanks
The Canadian Space Agency (CSA) operates from two separate sites: St-Hubert, Quebec and Nepean, Ontario. The Fuel Storage tanks at those locations fall under different management. Therefore two separate tables are presented below.
Status of Fuel Storage Tanks located in St-Hubert, Quebec; CSA is the building custodian.Annual Report for April 30, 2006
As required under the CEPA, Part IV, Registration of Storage Tank Systems for Petroleum Products and Allied Petroleum Products on Federal Lands Regulations, this report provides the information set out in Schedule II of the aforementioned regulation, updated to December 31, 2004.
The following number of above-ground storage tank systems: Zero tank with storage capacity greater than 4000 litres.
Are registered: n/a.
Comply with the Federal Aboveground Storage Tank Technical Guidelines: n/a.
Do not comply with the Federal Aboveground Storage Tank Technical Guidelines: n/a.
The following number of underground storage tank systems: Two tanks: one with a 15,000 litres capacity and the other with a 20,000 litres capacity.
Are registered: Both tanks are currently registered with the Quebec Department of Natural Resources and Public Works and Government Services Canada which managed the St-Hubert facility from 1992 to December 2000.
Comply with the Federal Underground Storage Tank Technical Guidelines: Both tanks are fully compliant with all provincial and federal guidelines.
Status of Fuel Storage Tanks located in Nepean, Ontario at the David Florida Laboratory (DFL); CSA is the building custodian.
Annual Report for April 30, 2006
As required under the CEPA, Part IV, Registration of Storage Tank Systems for Petroleum Products and Allied Petroleum Products on Federal Lands Regulations, this report provides the information set out in Schedule II of the aforementioned regulation, updated to December 31, 2004.
The following number of above-ground storage tank systems: One 9,000 litre diesel fuel tank surrounded by a concrete containment basin.
Are registered: Environment Canada is aware of the tank but does not require a formal registration of it.
Comply with the Federal Aboveground Storage Tank Technical Guidelines: Yes, the tank is fully compliant with all federal technical guidelines.
Do not comply with the Federal Aboveground Storage Tank Technical Guidelines: n/a.
The following number of underground storage tank systems: Zero tank.
Are registered: n/a.
Comply with the Federal Underground Storage Tank Technical Guidelines: n/a.