ARCHIVED - Human Resources and Skills Development Canada - Report
 This page has been archived.
Archived Content
Information identified as archived on the Web is for reference, research or recordkeeping purposes. It has not been altered or updated after the date of archiving. Web pages that are archived on the Web are not subject to the Government of Canada Web Standards. As per the Communications Policy of the Government of Canada, you can request alternate formats on the "Contact Us" page.
2011-12
Report on Plans and Priorities
Human Resources and Skills Development Canada
The original version was signed by
The Honourable Diane Finley, P.C., M.P.
Minister of Human Resources and Skills Development
The Honourable Lisa Raitt, P.C., M.P.
Minister of Labour
Table of Contents
Ministers' Message
Section I Departmental Overview
- 1.1 Raison d'être and Responsibilities
- 1.2 Program Activity Architecture and Contribution to the Federal Sustainable Development Strategy
- 1.3 Planning Summary
- 1.4 Contribution of Priorities to Strategic Outcomes
- 1.5 Risk Analysis
- 1.6 Expenditure Profile
Section II Analysis of Program Activities by Strategic Outcome
- 2.1 A skilled, adaptable and inclusive labour force and an efficient labour market
- 2.2 Safe, fair and productive workplaces and cooperative workplace relations
- 2.3 Income security, access to opportunities and well-being for individuals, families and communities
- 2.4 Service Excellence for Canadians
- 2.5 Internal Services
Section III Supplementary Information
- 3.1 Financial Highlights
- 3.2 Specified Purpose Accounts
- 3.3 Statutory Annual Reports
- 3.4 List of Supplementary Information Tables
Section IV Other items of Interest
Ministers' Messages
Message from the Minister of Human Resources and Skills Development

I am pleased to present to Parliament the 2011-2012 Report on Plans and Priorities, which outlines the major directions of my Department for the next fiscal year.
Human Resources and Skills Development Canada is responsible for many programs and services that Canadians use throughout their lives, from birth into their senior years. The Department’s mission is to build a stronger and more competitive Canada. It also is mandated to assist Canadians in making informed choices that will help them lead productive and satisfying lives.
Over the next year, the Government will be focused on job creation and growth to respond to a highly competitive job market and an economy that requires an increasingly educated, flexible and specialized labour force.
Therefore, we will be focusing our efforts in 2011-12 on the priorities of skills development, training and post-secondary education, elimination of employment barriers, labour mobility and recognition of foreign credentials.
We will also be working to improve access to services, programs and benefits to which Canadians are entitled, such as the Canada Pension Plan and the Guaranteed Income Supplement to assist the most vulnerable seniors.
The economy is—and remains—this government’s top priority. My Department will do its part to facilitate the return to a balanced budget. It will modernize its programs and practices by seeking to increase their efficiency without compromising the quality of programs and services offered to Canadians.
I firmly believe that these priorities will help us ensure that Canada has a bright and prosperous future.
The Honourable Diane Finley, P.C., M.P.
Minister of Human Resources and Skills Development
Message from the Minister of Labour

The 2011-2012 Report on Plans and Priorities is a roadmap that enables us to better target our efforts in pursuit of our mission.
A safe, fair, and productive work environment with healthy labour relations is the key objective of this mission. The Labour Program’s priorities for the 2011-2012 fiscal year are to protect Canadian workers and employers by strengthening labour-management relations, implementing its 2010-2013 action plan, and playing a leadership role in international labour affairs.
On the national stage, it is very important that we continue to provide high-quality mediation and conciliation services to help employers and unions maintain harmonious and constructive relations, especially as we begin to see signs of recovery in our fragile economy. To that end, we will be more proactive in the delivery of our mediation services.
The Labour Program will pursue implementation of its action plan over the course of the 2010-2013 planning period. It will implement the findings of the strategic review it conducted recently, as announced in the 2010 Budget, especially the streamlining of service delivery and focusing program funding on the core mandate and priority sectors.
Lastly, the Labour Program continues to represent Canada in international labour discussions, as well as to negotiate international labour standards that advance the country's interests and values abroad. The federal government also continues with free trade negotiations. For each free trade agreement, the Labour Program starts negotiations to set up a corresponding labour cooperation agreement. Labour cooperation agreements commit parties to enforce national labour laws and provide protection for fundamental labour rights. In this way, the Labour Program contributes to improving working conditions internationally, while at the same time supporting the development of equitable global markets, which protects Canadian companies, employers and employees from unfair competition and promotes their success on the international stage.
Workplaces are constantly changing, and through these programs and activities, the Labour Program helps Canadians adjust, prosper and contribute to a productive economy. I am convinced that by working together, we will attain our objectives and all Canadians will benefit.
The Honourable Lisa Raitt, P.C., M.P.
Minister of Labour
Section I - Departmental Overview
Introduction
The Report on Plans and Priorities is Human Resources and Skills Development Canada’s (HRSDC) key planning and priority document for 2011-2012. It provides an overview of the work of the Department, the challenges it faces, its planned expenditures and its expected results.
1.1 Raison d'être and Responsibilities
The mission of Human Resources and Skills Development Canada (HRSDC) is to build a stronger and more competitive Canada, to support Canadians in making choices that help them live productive and rewarding lives, and to improve Canadians' quality of life. The Department delivers its mandate through three business lines: programs that support human resources and skills development, the Labour Program, and Service Canada. Together, HRSDC's three business lines deliver a range of programs and services that affect Canadians throughout their lives, including:
- Old Age Security;
- Canada Pension Plan;
- Employment Insurance;
- Canada Student Loans and Grants;
- National Child Benefit; and,
- Universal Child Care Benefit.
These direct benefits to Canadians are part of Canada's social safety net and represent almost 95% of the Department's expenditures. They provide seniors in need with basic income security, support unemployed workers in making a transition back to the labour market, help students finance their post-secondary education, and help parents who are raising young children, particularly those in low- and middle-income families.
HRSDC also provides funding to organizations and other levels of government through targeted labour market and social development programs. The focus of these programs is to improve Canada's competitiveness, build a flexible, national labour market, increase opportunities for vulnerable Canadians to participate in the labour market and society, and help Canadians become more resilient, skilled and adaptable by removing barriers to skills development and post-secondary education. Working with communities and community organizations, the Department also maintains a network of social partnerships that help address the social development needs of Canadians across the country who require support.
Through the Labour Program, HRSDC is responsible for labour laws and policies in federally regulated workplaces. Its mandate includes promoting and protecting labour standards and workplace health and safety, facilitating constructive labour relations, developing labour-related policy and program options in response to changes in economic and social conditions, providing customized information about industrial relations and workplace trends, representing Canada in international organizations dealing with labour issues, and negotiating labour cooperation agreements and cooperative frameworks with free trade partners and emerging economic partners.
Service Canada helps citizens access HRSDC's programs, as well as other Government of Canada programs and services, at more than 600 points of service across the country. In addition to in-person services, the organization serves the needs of Canadians online at www.servicecanada.gc.ca and by telephone through 1 800 O-Canada and its network of program-based call centres.
In 2011-2012, HRSDC will continue to play a key role in delivering programs and services for citizens and employers as they adapt to changing economic conditions and prepare for the future.
1.2 Program Activity Architecture and Contribution to the Federal Sustainable Development Strategy
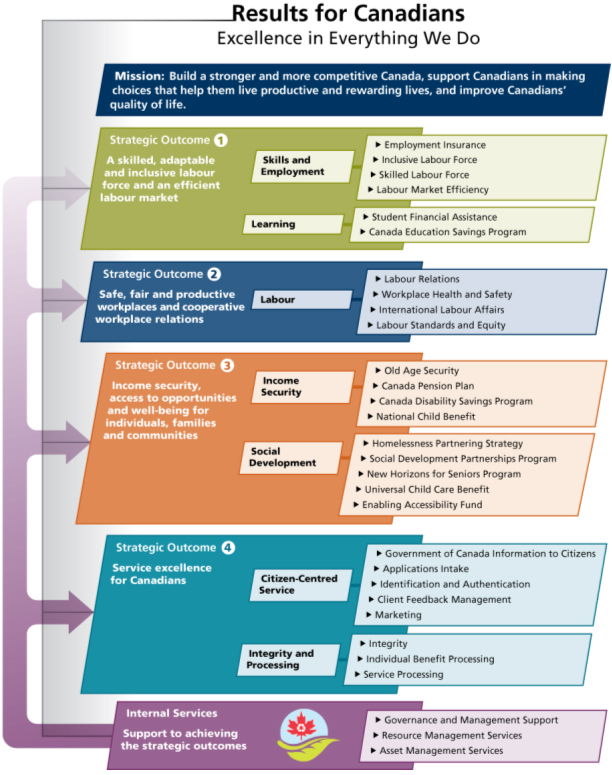
Text description of the Program Activity Architecture image
The HRSDC Program Activity Architecture (PAA) is a representation of the programs offered by HRSDC and the results (strategic outcomes) that the programs are designed to achieve for Canadians. The PAA includes a program activity for services that are internal to the Department and are important in supporting the achievement of HRSDC’s four strategic outcomes, which are further described in Section 1.3.
As denoted by “ “ next to Internal Services in the graphic above, HRSDC participates in the Federal Sustainable Development Strategy (FSDS). The Department's focus, given the nature of its mandate, will be on the fourth theme of the FSDS, “Shrinking the Environmental Footprint – Beginning with Government.” For additional details about HRSDC's activities to support sustainable development, please see http://www.hrsdc.gc.ca/eng/cs/sp/hrsd/publications/reports/sds-2011-2012/page00.shtml, and http://www.rhdcc-hrsdc.gc.ca/eng/publications_resources/dpr/rpp/index.shtml. For complete information about the Federal Sustainable Development Strategy, please see http://www.ec.gc.ca/dd-sd/default.asp?lang=En&n=C2844D2D-1.
1.3 Planning Summary
This subsection provides a concise, high-level summary of the Department's strategic outcomes, including planned spending and performance targets for 2011-2012. More detailed information is provided in Section 2 of this report.
To achieve this Strategic Outcome, HRSDC helps Canadians take advantage of opportunities to develop skills and knowledge, and to participate in and complete post-secondary education, by offering programs that:
HRSDC increases participation in the labour force by:
|
|
| Performance Indicator | Targets |
|---|---|
Employment Ratio: Proportion of the working-age population who are employed. Source: Labour Force Survey, Statistics Canada |
Maintain or increase the employment ratio Historical Results: |
Percentage of the Canadian labour force (aged 25-64) that has attained a post-secondary education credential Source: Labour Force Survey, Statistics Canada |
66.3% Historical Results: |
Canada's ranking for the percentage of its population with post-secondary education credentials among Organization for Economic Cooperation and Development (OECD) member countries. Source: Organization for Economic Co-operation and Development, Education at a Glance, 2011 |
Continue to be ranked 1st Historical Results: Note: There is a two year lag in the availability of data. |
| Program Activity* | Forecast Spending 2010–2011 ($ millions) |
Planned Spending ($ millions) | Alignment to Government of Canada Outcomes | ||
|---|---|---|---|---|---|
| 2011–2012 | 2012–2013 | 2013–2014 | |||
| Skills and Employment | 25,496.3 | 21,293.8 | 20,724.1 | 20,469.2 | Income security and employment for Canadians |
| Learning | 2,995.3 | 2,606.7 | 2,525.2 | 2,490.1 | An innovative and knowledge based economy |
| Total Planned Spending | 28,491.6 | 23,900.5 | 23,249.3 | 22,959.3 | |
| * For program activity descriptions, please access the Main Estimates online at http://www.tbs-sct.gc.ca/est-pre/ | |||||
To achieve this Strategic Outcome, the Department, through the Labour Program:
|
|
| Performance Indicator | Targets |
|---|---|
Percentage of collective bargaining disputes settled under Part I (Industrial Relations) of the Canada Labour Code without a work stoppage Source: Administrative Data |
95% Historical Results: |
| Program Activity* | Forecast Spending 2010–2011 ($ millions) |
Planned Spending ($ millions) | Alignment to Government of Canada Outcomes | ||
|---|---|---|---|---|---|
| 2011–2012 | 2012–2013 | 2013–2014 | |||
| Labour | 298.3 | 307.1 | 312.5 | 312.4 | A fair and secure marketplace |
| Total Planned Spending | 298.3 | 307.1 | 312.5 | 312.4 | |
| * For program activity descriptions, please access the Main Estimates online at http://www.tbs-sct.gc.ca/est-pre/ | |||||
To achieve this Strategic Outcome, HRSDC sets policy for and administers Canada's public pension system, which provides Canadians with retirement pensions, survivor pensions, and disability benefits through the Canada Pension Plan, Old Age Security, and Guaranteed Income Supplement. HRSDC also provides benefits through programs such as the National Child Benefit, the Universal Child Care Benefit, and the Canada Disability Savings Program, which helps Canadians with disabilities and their families save for the future. HRSDC is the lead federal department in Canada responsible for inter-country adoption of children and, through the Office for Disability Issues, co-ordinates the Government of Canada's efforts to promote the full participation of Canadians with disabilities in learning, work, and community life. The Department works with partners to increase access to opportunities and well-being for individuals, families, and communities through policies and programs that support:
|
|
| Performance Indicator | Targets |
|---|---|
Percentage of population able to purchase goods and services, which corresponds to a modest standard of living in Canada according to the Market Basket Measure (MBM)1 Source: Survey of Labour and Income Dynamics, Statistics Canada, 2007 |
90.5% Historical Results: Note: There is a three-year lag in the availability of data. |
| Program Activity* | Forecast Spending 2010–2011 ($ millions) |
Planned Spending ($ millions) | Alignment to Government of Canada Outcomes | ||
|---|---|---|---|---|---|
| 2011–2012 | 2012–2013 | 2013–2014 | |||
| Income Security | 68,043.6 | 71,485.0 | 75,415.9 | 79,726.7 | Income security and employment for Canadians |
| Social Development | 2,914.1 | 2,898.3 | 2,936.3 | 2,950.1 | A diverse society that promotes linguistic duality and social inclusion |
| Total Planned Spending | 70,957.7 | 74,383.3 | 78,352.2 | 82,676.8 | |
1 The MBM is a measure of low income based on the cost of a specified basket of goods and services. The MBM measures the incidence, depth and persistence of low income nationally for all main age groups and genders, as well as for the five groups at high risk of persistent low income (lone parents; unattached individuals aged 45-64; persons with work-limiting disabilities, recent immigrants; and, Aboriginal people in Canada living off reserve). * For program activity descriptions, please access the Main Estimates online at http://www.tbs-sct.gc.ca/est-pre/ |
|||||
To achieve this Strategic Outcome, HRSDC, through Service Canada, connects Canadians with a wide range of programs and services offered by the Government of Canada. Through its service delivery network, it helps Canadians find information about Government of Canada programs and services, apply for benefits to which they are entitled under programs such as Old Age Security, the Canada Pension Plan, or Employment Insurance, and access services delivered on behalf of partners, such as the Passport Receiving Agent service. The Department is committed to continual improvement in achieving excellence in the way it delivers services to Canadians. At the same time, Service Canada's connection to Canadians presents opportunities for engagement, dialogue and feedback on policy directions, program development and service delivery with respect to citizens' changing needs and expectations. |
|
| Performance Indicator | Targets |
|---|---|
Percentage of clients whose service expectations were met Source: Client Satisfaction Survey, 2010 |
Targets will be set based on 2010-2011 results Historical Results: |
Percentage of partner organizations whose service expectations were met Source: Administrative Data |
Targets will be set based on 2010-2011 results Historical Results: |
| Program Activity* | Forecast Spending 2010–2011 ($ millions) |
Planned Spending ($ millions) | Alignment to Government of Canada Outcomes | ||
|---|---|---|---|---|---|
| 2011–2012 | 2012–2013 | 2013–2014 | |||
| Citizen-Centred Service | 529.9 | 431.3 | 430.4 | 422.3 | A transparent, accountable and responsive federal government |
| Integrity and Processing | 720.9 | 638.4 | 636.6 | 637.1 | A transparent, accountable and responsive federal government |
| Total Planned Spending | 1,250.8 | 1,069.7 | 1,067.0 | 1,059.4 | |
| * For program activity descriptions, please access the Main Estimates online at http://www.tbs-sct.gc.ca/est-pre/ | |||||
| Internal Services are activities and resources that support the needs of programs and other corporate obligations of an organization. HRSDC’s internal services include the Chief Financial Officer Branch, Human Resources Services, Legal Services, Strategic Policy and Research, Public Affairs and Stakeholder Relations, Internal Audit Services, Internal Integrity and Security, Innovation and Information Technology, and the Corporate Secretariat. | ||||
| Program Activity* | Forecast Spending 2010–2011 ($ millions) |
Planned Spending ($ millions) | ||
|---|---|---|---|---|
| 2011–2012 | 2012–2013 | 2013–2014 | ||
| Internal Services | 1,016.5 | 859.5 | 860.3 | 834.6 |
| Total | 1,016.5 | 859.5 | 860.3 | 834.6 |
| * For program activity descriptions, please access the Main Estimates online at http://www.tbs-sct.gc.ca/est-pre/ | ||||

1.4 Contribution of Priorities to Strategic Outcomes
This subsection provides a summary of the Department's priorities. These priorities are specific activities that the Department has chosen to focus its attention and resources on in order to ensure ongoing progress across the various strategic outcomes. The priorities are not an exhaustive list of the Department's initiatives but rather, focus on the strategic activities that have been identified as crucial to the Department’s continued success.
As outlined below, the Department’s priorities are aligned with the strategic outcomes and are organized into two categories: operational priorities and management priorities. Operational priorities focus on ways to achieve better results for Canadians consistent with HRSDC’s mandate while ensuring value for money. Management priorities focus on improving the Department’s internal management practices, controls, and infrastructure in areas such as human resources, risk management and corporate services.
There is an important context to these priorities, however. Over the coming years, the Department’s focus will be to continue to deliver results for Canadians through smooth wind-down of our activities in support of Canada’s Economic Action Plan, implementation of Budget 2011 and other decisions of the government, and internal efforts to improve the efficiency of several key internal services, including human resources, finance, and information technology.
| Operational Priorities | Description |
|---|---|
| Ensure the responsiveness of learning and employment related programs to evolving socio-economic conditions. | Why is this a priority? The Canadian economy continues to recover; however, global economic conditions remain uncertain. HRSDC's learning and employment-related programs must remain responsive to the needs of Canadians in providing effective income support, removing barriers to post-secondary education attainment and skills development, increasing the participation of under-represented groups in the labour force, and supporting an efficient and integrated labour market. HRSDC's programs must also address the longer-term challenges in the Canadian labour market, including skills gaps in key sectors, and a shrinking labour force due to an aging Canadian population. |
Link to Strategic Outcomes: Strategic Outcome 1 Strategic Outcome 4 |
|
Plans for meeting the priority
|
|
| Strengthen labour mediation and conciliation services and negotiate international labour standards. | Why is this a priority? Given the increasing complexity of the issues at the bargaining table, such as pensions, it is crucial that the Labour Program be in a position to offer timely and proactive involvement to assist in resolving workplace disputes before parties resort to work stoppages. The Government is committed to pursuing a comprehensive free trade agenda. For every Free Trade Agreement negotiation initiated, the Labour Program is required to initiate a supporting Labour Cooperation Agreement. |
Link to Strategic Outcomes: Strategic Outcome 2 |
|
Plans for meeting the priority
|
|
| Support communities and community organizations in their efforts to address local challenges and meet the social development needs of Canadians. | Why is this a priority? The March 2010 Speech from the Throne highlighted the need for the federal government to support communities in their efforts to address local challenges, such as partnering with innovative charities and forward-thinking private sector companies on new approaches to social challenges. |
Link to Strategic Outcomes: Strategic Outcome 3 |
|
Plans for meeting the priority
|
|
| Modernize the Department's programs and services and the way in which they are delivered to support service excellence for Canadians. | Why is this a priority? As the face of government to millions of Canadians, Service Canada will move forward on its modernization of service delivery to meet the evolving needs of citizens by providing quality services and value for money to Canadians. This includes modernizing some of its largest programs (i.e., Employment Insurance, Canada Pension Plan, and Old Age Security), to ensure continuous improvement in service delivery and respond to changing economic conditions and demographics. Grants and contributions are a key mechanism for supporting citizens through targeted programming. The Department will be developing and implementing a second wave of improvements to strengthen the administration of these programs to deliver results for Canadians. In addition, the Labour Program will modernize its operations to position itself to respond to increased demands with respect to workplace health and safety, unjust dismissals and terminations and unpaid wages to employees. |
Link to Strategic Outcomes: Strategic Outcome 1 Strategic Outcome 2 Strategic Outcome 3 Strategic Outcome 4 |
|
Plans for meeting the priority
|
| Management Priority | Description |
|---|---|
| Continue to modernize and integrate internal service functions and systems in order to improve our ability to deliver results for Canadians. | Why is this a priority? As an essential support to service delivery, key internal services and systems, particularly those related to human resources, financial management, and information technology will be modernized. A multi-year transformation of services and key resource management systems will strengthen decision making and help ensure the Department continues to improve the way in which it delivers results for Canadians. |
Link to Strategic Outcomes: Internal Services |
|
Plans for meeting the priority
|
|
| Strengthen the Department's management practices and infrastructure, and contribute to Public Service Renewal. | Why is this a priority? This priority represents HRSDC's continuing commitments to renewal, building a healthy and enabling workplace and improving internal processes for privacy, security, integrity, and investment planning. These activities are an essential part of the Department's responsibility to ensure the sound stewardship of public funds, the integrity and value for money of its programs, and the excellence of the services it provides to Canadians. |
Link to Strategic Outcomes: Internal Services |
|
Plans for meeting the priority
|
1.5 Corporate Risk Analysis
Following the economic downturn, the Department’s emphasis for 2011-2012 will continue to be on helping Canadians respond to new labour market realities while actively preparing for jobs of tomorrow and an increasingly competitive global market. As a result of changes in the economy, the level of demand for the Department’s programs and services may fluctuate, and changes may need to be made to programs and policies to ensure Canadians’ needs are met.
The Department’s multi-year agenda, including the modernization and transformation of several key internal services over the next five years, will also bring change. The Department will take advantage of these opportunities to promote a healthy and enabled workplace as part of ongoing efforts towards public service renewal.
Considering this broader environmental context, the Department has identified the following corporate level risks and mitigation strategies for 2011-2012:
- Demand for Pensions and Benefits
- Human Resources
- Information Technology Infrastructure
- Information Management
- Financial Management
Demand for Pensions and Benefits
Moving into 2011-2012, the Department expects continued high demand for its core services. Long-term demographic trends project continued growth in the demand for Old Age Security (OAS), Canada Pension Plan Disability (CPPD) and Canada Pension Plan (CPP) services. This demographic shift will result in an increased workload as the number of applications increases, which will be difficult to manage without modernizing the way in which these programs are delivered to Canadians. To mitigate this risk, HRSDC will modernize the administration and delivery of OAS, CPP and CPPD over time. Efforts will concentrate on aligning resources towards improving the client and stakeholder experience as well as simplifying the application process.
In addition to these specific mitigation activities, the Department has already implemented a broad-based strategy to support effective workload management throughout its service delivery network. To maintain service standards, the Department has optimized its processing and service delivery operations across the country and is improving Internet services to enable greater citizen self-service.
Human Resources
As with the rest of the Canadian population, the Department's workforce is aging, and turnover also remains high. Given these trends, there is increasing pressure to manage organizational renewal and change in a more systematic manner in order to have the right people in place, at the right time to deliver on the Department's mandate.
To mitigate this risk, the Department will continue to implement its Renewal and Excellence Action Plan, which focuses on improving the resilience and strength of the Department’s workforce. A greater focus will be placed on integrated business planning to better align human resource requirements to the evolving needs of the organization.
Further, HRSDC will continue to build an enabled workplace and a workforce with strong executive and managerial leadership. Moving forward, this will involve building the skills of employees, creating an environment that facilitates employee empowerment and engagement, and encouraging creativity, innovation and forward-looking policies.
Information Technology (IT) Infrastructure
HRSDC’s IT infrastructure is aging and must be upgraded to meet an increased demand for service and support of new automated business processes. The Department will continue to invest in infrastructure, including planned roll-out of ongoing improvement in Information Technology Assets to replace aging equipment and support the modernization of the Department’s programs, service delivery operations and internal services.
Information Management
HRSDC has a broad mandate and offers a wide array of programs and services to Canadians. These programs are accompanied by a need for detailed and accurate record-keeping practices. At present, the approach to record-keeping varies from one program to another. Greater standardization is required to reduce the amount of time and effort required to provide timely and accurate information in the course of serving Canadians, as well as in managing departmental resources (human, financial and material) and in reporting to Parliament.
To mitigate this risk, the Department will implement an information management strategy, including training and awareness-raising activities that will aim to improve information management and record keeping practices in the Department, while also moving to electronic imaging of paper files. This will improve the integrity, security and automation of record-keeping, which is essential to ensuring compliance with the Treasury Board Secretariat's directive on record-keeping.
In particular, the Department will work to reduce risks related to the management of personal information by increasing awareness through training and ensuring that the appropriate structures are in place to support the proper management of personal information.
Financial Management
Treasury Board has recently implemented new standards for financial management controls across the Government of Canada to support ongoing stewardship, value for money and service excellence. In order to comply with the new standards, HRSDC will develop additional financial management capacity through initiatives such as staff development and a new structural model for its Chief Financial Officer Branch. The Department will also work to strengthen the Financial Management Framework through work on items such as control frameworks, risk registers and audit readiness. Finally, the Department will take steps to replace its existing Corporate Management System to improve the security, effectiveness and utility of its financial administrative system.
1.6 Expenditure Profile
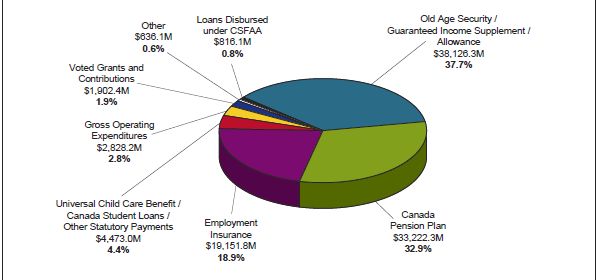
For 2011-2012, the Department has planned expenditures on programs and services of more than $101.1B. Of that amount, $95.8B directly benefit Canadians through statutory transfer payment programs, such as Employment Insurance, Canada Pension Plan, Universal Child Care Benefit, Old Age Security, as well as loans disbursed under the Canada Student Financial Assistance Act.
| 2011–2012 | 2012–2013 | 2013–2014 |
|---|---|---|
| 101,156.2 | 104,460.8 | 108,473.9 |
| 2011–2012 | 2012–2013 | 2013–2014 |
|---|---|---|
| 23,955 | 23,815 | 23,587 |
 |
||
| Human Resources and Skills Development Canada - Gross Expenditures
(in millions of dollars) |
||
|---|---|---|
| Budgetary | ||
| Net Operating Costs | 1,111.1 | |
| Add Recoveries in relation to: | ||
| Canada Pension Plan | 258.0 | |
| Employment Insurance Account | 1,318.3 | |
| Workers' Compensation | 126.4 | |
| Other Government Departments | 14.4 | 1,717.1 |
| Gross Operating Costs | 2,828.2 | |
| Voted Grants and Contributions | 1,902.4 | |
| Total Gross Expenditures | 4,730.6 | |
| Other - Workers' Compensation and EI/CPP Charges and Recoveries | 636.1 | |
| Non-Budgetary | ||
| Loans disbursed under Canada Student Financial Assistance Act (CSFAA) | 816.1 | |
| Statutory Transfer Payments (in millions of dollars) | ||
| Grants and Contributions: | ||
| Old Age Security | 29,162.2 | |
| Guaranteed Income Supplement | 8,429.8 | |
| Allowance | 534.3 | |
| Other Statutory Payments: | ||
| Universal Child Care Benefit | 2,660.0 | |
| Canada Student Loans | 894.1 | |
| Canada Education Savings Grant | 660.0 | |
| Canada Disability Savings Program | 83.0 | |
| Canada Learning Bond | 76.0 | |
| Wage Earner Protection Program | 56.2 | |
| Pathways to Education | 6.0 | 4,435.3 |
| Sub-Total | 42,561.6 | |
| Canada Pension Plan benefits | 33,222.3 | |
| Employment Insurance benefits | ||
| Part I | 17,030.0 | |
| Part II | 2,121.8 | 19,151.8 |
| Other Specified Purpose Accounts | 37.7a | |
| Total Statutory Transfer Payments | 94,973.4 | |
| a This amount includes payments related to Government Annuities Account, the Civil Service Insurance Fund and the Canada Millennium Scholarship Foundation Excellence Awards Funds. | ||
The figure below illustrates the Human Resources and Skills Development Canada spending trend from 2007-2008 to 2013-2014. For the 2011-2012 fiscal year, Human Resources and Skills Development Canada plans to spend $101 billion to meet the expected results of its program activities.
For the 2007-2008 to 2010-2011 periods, the total spending includes all Parliamentary appropriation and revenue sources, Main Estimates and Supplementary Estimates. For the 2011-2012 to 2013-2014 periods, total spending corresponds to the planned spending.
Spending Trend
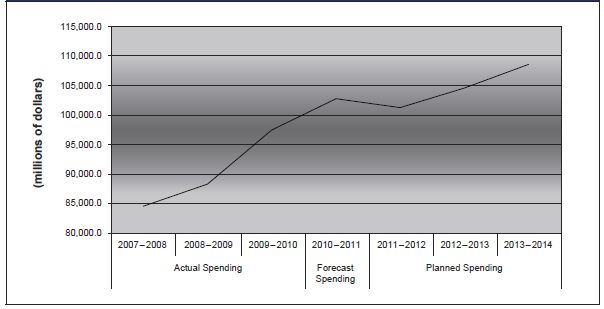
| Actual Spending | Forecast Spending | Planned Spending | ||||
|---|---|---|---|---|---|---|
| 2007-2008 | 2008-2009 | 2009-2010 | 2010-2011 | 2011-2012 | 2012-2013 | 2013-2014 |
| 84,504.4 | 88,264.2 | 97,402.7 | 102,655.7 | 101,156.2 | 104,460.8 | 108,473.9 |
Actual expenditures for 2008-2009 were $3.8 billion higher than actual expenditures for 2007-2008, mainly as a result of a $2.0 billion increase in EI benefits and a $1.5 billion increase in CPP benefits. In addition, Old Age Security payments were $1.4 billion higher over the same time frame due to a change in the number of beneficiaries. These increases were offset by a $1.8 billion decrease in spending from 2007-2008 related to the administration and delivery by Service Canada of Common Experience Payments, one of the five components included in the Indian Residential Schools Settlement Agreement.
In 2009-2010, actual expenditures were $9.1 billion higher than in 2008-2009. This increase can be mainly explained by a $3.6 billion increase in EI benefits and administrative costs due to the economic downturn, a $2.3 billion increase for initiatives announced in Canada’s Economic Action Plan, a $1.4 billion increase in CPP benefits and a $1.3 billion increase in Old Age Security payments due to changes in the number of beneficiaries and the average monthly rate.
From 2009-2010 actual expenditures to 2010-2011, the increase of $5.3 billion in forecasted spending is mainly due to $2.9 billion for the provision of funds for enhanced Employment Insurance benefits in accordance with the Budget Implementation Act (2009), $1.6 billion in Old Age Security benefits payments and $0.3 billion in grants and contributions mainly for measures announced in the Canada’s Economic Action Plan.
Increases in planned spending are explained by changes in Old Age Security average rates of payment and population, and to increases in Canada Pension Plan benefits which reflect forecast of clients’ population and average benefit payments.
Estimates by Vote
For information about the Department’s organizational votes or statutory expenditures, please see the 2011–2012 Main Estimates publication. An electronic version of the Main Estimates is available at http://www.tbs-sct.gc.ca/est-pre/20112012/me-bpd/toc-tdm-eng.asp
Section II Analysis of Program Activities by Strategic Outcome
This section provides more detailed information about the Department's program activities and how they support the achievement of its strategic outcomes. For each program activity, it explains the intended benefit to Canadians, and sets out performance using expected results, performance indicators, and forecasted spending. Finally, the planning highlights describe the key activities associated with each program activity that will be undertaken to support the Department's priorities and strategic outcomes.
2.1 Strategic Outcome 1: A skilled, adaptable and inclusive labour force and an efficient labour market

Click here to enlarge
Text version of the Strategic Outcome 1: A skilled, adaptable and inclusive labour force and an efficient labour market
2.1.1 Program Activity: Skills and Employment
Benefits to Canadians
Through its skills and employment programs, HRSDC helps Canadian workers adapt to a changing labour market and become more self-reliant. The Employment Insurance (EI) program provides temporary income support to eligible unemployed workers, while also helping them prepare for, find and keep jobs. Other programs are designed to support the skills development of Canadians and increase their labour market participation, focusing on those who are under-represented in the labour market, such as youth, persons with disabilities, older workers and Aboriginal people.
HRSDC’s programs also support Canadian employers by helping them meet their labour force needs and remain competitive. These programs make it easier for employers to find qualified workers (domestically or internationally trained) and also provide employers with tools to improve the skills of their workforce.
Finally, HRSDC’s programs improve labour market efficiency by: providing timely, reliable labour market information; improving labour mobility by working to remove barriers in regulated professions and trades; and improving the recognition of qualifications (both domestic and foreign) so that Canadians have opportunities to find jobs commensurate with their skills and training.
| Human Resources (FTEs) and Planned Spending ($ millions) | |||||
|---|---|---|---|---|---|
| 2011–2012 | 2012–2013 | 2013–2014 | |||
| FTEs | Planned Spending | FTEs | Planned Spending | FTEs | Planned Spending |
| 1,947 | 21,293.8 | 1,925 | 20,724.1 | 1,910 | 20,469.2 |
| Program Activity Expected Results | Performance Indicators | Targets |
|---|---|---|
| Workers in an adjustment situation have access to temporary financial assistance. | Percentage of unemployed individuals eligible to receive benefits, among those who had a recent job separation that met EI program eligibility criteria. Source: Administrative Data |
80-85% Historical Results: |
| Canadians, including the under-represented groups and vulnerable workers, have the opportunity to acquire skills to find and maintain productive employment. | The proportion of clients employed and/or returning to school following a completed employment program intervention under the following federally delivered programs: Youth Employment Strategy, Opportunities Fund for Persons with Disabilities, Aboriginal Skills and Employment Partnership, Aboriginal Skills and Employment Training Strategy and Skills and Partnerships Fund. Source: Administrative Data |
55-65% Historical Results: |
| Through increased progression in the first two years of an apprenticeship program, completions are enhanced in the designated Red Seal trades. | Number of apprentices who complete an apprenticeship program and obtain certification in a Red Seal Trade. Source: Registered Apprentice Information System, Statistics Canada |
Baseline Year |
Planning Highlights
Provide effective income support measures
HRSDC will be working to support the needs of Canadians through Employment Insurance programming which responds to evolving economic conditions through effective income support. Policy research and analysis will continue, which includes analyzing the impact of pilot projects introduced to address higher unemployment levels, including the Working While on Claim, and the Best 14 Weeks pilots.
Support Canadians in developing their skills
HRSDC will work to enhance the participation of under-represented groups in the Canadian labour market (e.g., people with disabilities, Aboriginal people, and youth) through renewal and implementation of programs designed to address their needs, as well as through ongoing policy research and development. This work will be undertaken in collaboration with key partners and stakeholders.
At the same time, HRSDC will work with employers, provinces and territories, and other partners to continue to help Canadian workers acquire the skills needed in the Canadian labour market. This will include updating key components of the essential skills methodology, and continuing work with the Canadian Council of Directors of Apprenticeships to explore an occupational performance standards framework for Red Seal trades.
In addition, HRSDC will continue to work with key partners to enhance the recognition of foreign credentials in Canada by establishing and negotiating partnerships for target occupations under Foreign Qualification Recognition agreements.
Improve the quality and dissemination of labour market information
The Department will improve the quality and accuracy of national, regional and local labour market information (LMI) and ensure the efficient dissemination of LMI products to Canadians. This will involve the streamlining of internet-based information such as the Working in Canada tool and other websites, in order to better support Canadians when they are making labour market decisions.
2.1.2 Program Activity: Learning
Benefits to Canadians
Through the Canada Student Loans Program and the Canada Student Grants Program, HRSDC helps Canadians attend college, university and trade schools by lowering financial barriers through the provision of loans and grants to students with financial need. HRSDC also encourages Canadians to save for post-secondary education by contributing to registered education savings plans through the Canada Education Savings Program. Taken together, these programs contribute to building a more skilled, adaptable, and inclusive labour force by helping all Canadians obtain the skills and credentials they need to succeed in the labour market.
For individuals, the benefits of post-secondary education are clear: workers with higher-level skills and credentials tend to be more productive, earn higher wages, remain in the labour force longer, and have greater flexibility and choice in selecting future employment. By helping Canadians finance their post-secondary education, HRSDC makes it easier for them to attend the school and program of their choice, allowing students to devote more time to their studies instead of work.
Employers looking for potential employees value post-secondary education because it increases the knowledge and skill levels of the workforce. The increase in the availability of skilled labour drives innovation and reduces skills shortages that limit economic growth. Having a better educated workforce allows employers to adopt new technologies and techniques more quickly.
| Human Resources (FTEs) and Planned Spending ($ millions) | |||||
|---|---|---|---|---|---|
| 2011–2012 | 2012–2013 | 2013–2014 | |||
| FTEs | Planned Spending | FTEs | Planned Spending | FTEs | Planned Spending |
| 414 | 2,606.7 | 414 | 2,525.2 | 413 | 2,490.1 |
| Program Activity Expected Results | Performance Indicators | Targets |
|---|---|---|
| Canadians have the skills and credentials to succeed in the labour market. | Percentage of the Canadian population (aged 25-64) who have attained a post-secondary certificate, diploma, or degree. Source: Labour Force Survey, Statistics Canada |
62.5% Historical Results: |
| Canadians, including those from under-represented groups, participate equitably in post-secondary education (PSE). | Percentage of Canadians (aged 15-64) who were attending university or college.1 Source: Labour Force Survey, Statistics Canada |
8.5% Historical Results: |
Percentage of persons with a disability who were participating in post-secondary education. Source: Survey of Labour and Income Dynamics, Statistics Canada, 2007 |
7.9% Historical Results: Note: There is a 3-year lag in the availability of data for this indicator. |
|
| Canadians have access to financing for their post-secondary education. | Percentage of full-time post-secondary students (in participating provinces/territories) who used a Canada Student loan or a Canada Student Grant or an in-study interest subsidy to help finance their participation in post-secondary education. Source: Administrative Data and Office of the Chief Actuary |
Baseline Year |
Percentage of full-time and part-time post-secondary students in Canada who used RESP funding to help finance their participation in post-secondary education. Source: Administrative Data and Labour Force Survey, Statistics Canada |
14.6% Historical Results: |
|
Percentage of children under 18 (in 2011) who have ever received a Canada Education Savings Grant. Source: Administrative Data |
43% Historical Results: |
|
Percentage of eligible children (in 2011) who have ever received a Canada Learning Bond. Source: Administrative Data |
23.4% Historical Results: |
|
| Clients are satisfied with the quality of services they receive. | Percentage of in-study and in-repayment borrowers who are satisfied with the overall loan experience provided by the Canada Student Loans Program. Source: Administrative Data |
75% Historical Results: |
% of Canada Education Savings Grant payments made within established service standards. Source: Administrative Data |
90% Historical Results: |
|
| 1 See Supplementary Table for breakdown by gender and by age group (17-21, 22-24, and 25-29), available at: http://www.rhdcc.gc.ca/eng/publications_resources/ dpr/rpp/detailed_information/2011_2012/table_learning_eng.shtml |
||
Planning Highlights
Support Canadians' efforts to acquire post-secondary education
Human Resources and Skills Development Canada will:
- Continue learning-related policy development and research, and maintain positive relationships with stakeholders and partners.
HRSDC will continue its ongoing policy development and research related to post-secondary education, with a particular emphasis on assessing the participation of under-represented groups in PSE, including students with disabilities, from low-income families, from rural/remote communities, or student parents, to improve understanding of how its programs affect Canadians.
- Improve the stewardship and accountability of post-secondary education support programs.
The Canadian public demands and deserves prudent management of public funds. The Department is committed to improving stewardship and accountability of post-secondary education support programs. In addition to ongoing efforts to improve integrity, accountability, planning and reporting, the Department will focus on reviewing the Canada Student Loan Program designation policy framework as it applies to e-learning, implementation of a long-term plan for managing the Canada Student Loan Program portfolio loan limit, completing the privacy impact assessment for the Service Delivery Vision for Student Financial Assistance, and strengthening public reporting of program performance.
2.2 Strategic Outcome 2: Safe, fair and productive workplaces and cooperative workplace relations

Click here to enlarge
Text version of the Strategic Outcome 2: Safe, fair and productive workplaces and cooperative workplace relations
2.2.1 Program Activity: Labour
Benefits to Canadians
This program activity oversees federally regulated workplaces in a number of strategically important sectors of the economy, including: banking; telecommunications; broadcasting; air, interprovincial rail, road and pipeline transportation; shipping; uranium mining; grain handling; and, Crown corporations to ensure safe, fair and productive workplaces, and cooperative workplace relations.
To promote cooperation and fairness in these sectors, the Labour Program provides mediation and conciliation services to assist employers and unions in settling disputes; appoints arbitrators, adjudicators and referees to resolve specific disputes between employers and employees; offers a comprehensive and innovative Preventive Mediation Program to assist employers and unions in building effective labour-management relations; provides grievance mediation to assist labour and management in reaching voluntary settlement of grievances as a low-cost alternative to arbitration; and, fosters cooperation through its Labour-Management Partnerships Program.
Through a coast-to-coast network of regional offices, the Labour Program works with employers and employees to ensure that laws governing occupational health and safety, labour standards and employment equity are respected. The Labour Program oversees the federal workers’ compensation system, administers the Wage Earner Protection Program and provides national fire protection services in all federal government owned and leased buildings and facilities, and in schools and major public Band buildings in First Nations communities.
To enhance working conditions and ensure healthy and fair workplaces for all Canadians, the Labour Program works closely with provincial and territorial governments, First Nations communities, and a range of international partners. The Labour Program conducts research on issues such as work-life balance and tracks a wide range of information about labour relations and workplace trends in Canada, including developments in federal, provincial and territorial labour laws.
Internationally, the Labour Program will continue to lead the negotiation and implementation of labour cooperation agreements (with countries that Canada signs free trade agreements) to protect Canadian companies and workers from foreign competitors who may be tempted to gain unfair advantages by ignoring basic labour standards. The Labour Program will also continue to represent Canada in multilateral fora, negotiate international labour standards, and advance Canadian interests and fundamental values abroad.
| Human Resources (FTEs) and Planned Spending ($ millions) | |||||
|---|---|---|---|---|---|
| 2011–2012 | 2012–2013 | 2013–2014 | |||
| FTEs | Planned Spending | FTEs | Planned Spending | FTEs | Planned Spending |
| 725 | 307.1 | 709 | 312.5 | 709 | 312.4 |
| Program Activity Expected Results | Performance Indicators | Targets |
|---|---|---|
| Workplace parties comply with relevant workplace standards, follow guidelines, and adopt best practices. | Percentage of unjust dismissal complaints settled by inspectors (Part III (Labour Standards) of the Canada Labour Code). Source: Administrative Data |
75% Historical Results: |
Percentage of money collected in relation to the amount found to be owed for complaints under Part III (Labour Standards) of the Canada Labour Code (excluding unjust dismissal complaints). Source: Administrative Data |
75% Historical Results: |
|
| Risks to life, health, and property are eliminated or mitigated. | Percentage change, over 5 year period, in the rate of lost time injuries and fatalities within the targeted higher risk federal jurisdiction industries. Source: Administrative Data |
Decrease of 15% over a five year period (2009-2013) Historical Results: |
Planning Highlights
Use modern approaches and tools to deliver services and achieve compliance in the areas of workplace health and safety, employment standards, and equity
One of the key priorities for the Labour Program is to implement the Strategic Review results announced in Budget 2010. The Labour Program will develop an agenda aimed at modernizing service delivery in all business lines and ensuring efficiency and effectiveness in service delivery and service excellence by fostering a culture of continuous improvement. As part of this Action Plan, an enhanced Quality Assurance Framework will be developed to help improve oversight in Occupational Health and Safety (OHS) investigations. This will be complemented by the implementation of a new Training Strategy framed around training needs identified as part of service modernization, and core mandatory training necessary to perform the functions in OHS, Labour Standards, Fire Protection Services, Employment Equity, the Racism-free Workplace Strategy, and the Government Employees’ Compensation Act.
Provide high quality mediation and conciliation services to assist employers and unions in settling their labour disputes
The Labour Program will be implementing its Succession Plan to replace seasoned Mediation and Conciliation Officers who will be retiring. As well, the Labour Program will be more proactive in the delivery of mediation services.
2.3 Strategic Outcome 3: Income security, access to opportunities and well-being for individuals, families and communities
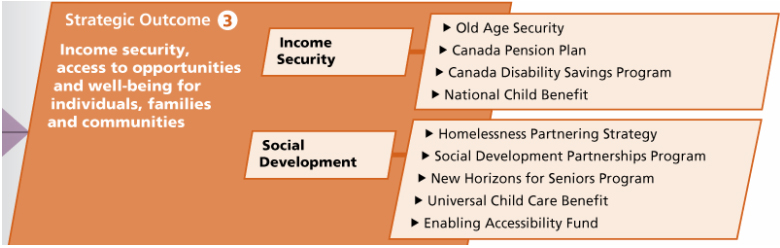
Click here to enlarge
Text version of the Strategic Outcome 3: Income security, access to opportunities and well-being for individuals, families and communities
2.3.1 Program Activity: Income Security
Benefits to Canadians
Income security is essential to the quality of life and well-being of Canadians. The Department provides eligible Canadians with retirement pensions, survivor pensions, disability benefits and benefits for children, through the Old Age Security (OAS) program and the Canada Pension Plan (CPP). A particular focus is vulnerable segments of the population who have difficulty receiving information and assistance through traditional government channels when accessing these benefits.
In addition, this program activity supports low-income families and their children through the National Child Benefit. Through this initiative, the federal government works in partnership with provincial and territorial governments to provide income support, as well as benefits and services, to parents.
Finally, this program activity includes the administration of the Canada Disability Savings Program (CDSP), which helps Canadians with disabilities and their families save for the future.
| Human Resources (FTEs) and Planned Spending ($ millions) | |||||
|---|---|---|---|---|---|
| 2011–2012 | 2012–2013 | 2013–2014 | |||
| FTEs | Planned Spending | FTEs | Planned Spending | FTEs | Planned Spending |
| 361 | 71,485.0 | 356 | 75,415.9 | 356 | 79,726.7 |
| Program Activity Expected Results | Performance Indicators | Targets | ||||||||||||||||||||||||
|---|---|---|---|---|---|---|---|---|---|---|---|---|---|---|---|---|---|---|---|---|---|---|---|---|---|---|
| Canada's seniors have an adequate level of income to maintain a minimum standard of living. | Incidencea and depthb of low income among seniors using the Market Basket Measure (MBM)c. Source: Survey of Labour and Income Dynamics, 2008 |
Historical Results:
Note: There is a 2-year lag in the availability of data for this indicator |
||||||||||||||||||||||||
| Eligible working-aged Canadians with severe and prolonged disabilities have a measure of income security. | Percentage of CPP contributors who have contributory coverage/eligibility for Canada Pension Plan Disability. Source: Administrative Data |
67% Historical Results: Note: There is a 1-year lag in the availability of data for this indicator. |
||||||||||||||||||||||||
| Eligible individuals with severe disabilities (and their families / guardians) open Registered Disability Saving Plans (RDSPs) to save for the future. | Total number of registered accounts opened since the inception of the program. Source: Administrative Data |
48,336 accounts Historical Results: |
||||||||||||||||||||||||
| Canada's families with children have an adequate level of income to maintain their standard of living. | Low-income incidenced, depthe and persistencef for Canadians in families with childreng with income security supporth, using the Market Basket Measure. Source: HRSDC calculations based on the Survey of Labour and Income Dynamics, 2008 |
Historical Results: Note: There is a 2-year lag in the availability of data for this indicator |
||||||||||||||||||||||||
a Low income incidence is the percentage of individuals in any group living in families with a disposable income below their low income threshold. |
||||||||||||||||||||||||||
Planning Highlights
Improve CPP/OAS services and policies for seniors
A number of factors affect the need to ensure the Canada Pension Plan and Old Age Security programs remain responsive to the needs of Canadians now and in the future. These include an aging population, the lingering effects of the recent economic downturn on income security, and the current climate of fiscal restraint. HRSDC will undertake the necessary policy work and program analysis to support the modernization of the Canada Pension Plan and Old Age Security in response to these factors.
2.3.2 Program Activity: Social Development
Benefits to Canadians
The Social Development program activity helps communities and non-profit organizations move forward with their own solutions in support of children, families, seniors, communities and people with disabilities, and prevention and reduction of homelessness.
For children and families, the Department supports Canadians through the Universal Child Care Benefit, which helps Canada's families balance work and family life by financially supporting their child care choices. Additionally, the children and families stream of the Social Development Partnership Program supports not-for-profit organizations in addressing local challenges that individuals and families experience in accessing opportunities to participate in learning, the labour market, and communities.
Through the New Horizons for Seniors Program, the Department helps seniors benefit from and contribute to the quality of life in their communities. Community-based projects address social challenges ‘on the ground’ and recognize communities as the focal point for program and service delivery, while national or regional projects address elder abuse (including financial abuse) through raising awareness, developing and sharing information, and networking.
The Department supports the participation and integration of people with disabilities in all aspects of Canadian society through the Enabling Accessibility Fund and the disability component of the Social Development Partnerships Program (SDPP-D). These programs support a wide range of community-based initiatives that address social issues and barriers faced by people with disabilities.
The Homelessness Partnering Strategy works to prevent and reduce homelessness in Canada by making strategic investments in community priorities. Its planning process promotes cooperation between governments, agencies and community based organizations, and encourages communities to determine the need, develop appropriate strategies and implement projects to find local solutions for homeless people and those at risk of becoming homeless.
In addition, HRSDC will honour the commitment in the 2010 Speech from the Throne to establish a Prime Minister’s Volunteer Award to recognize the enormous contribution that volunteers make to Canada.
| Human Resources (FTEs) and Planned Spending ($ millions) | |||||
|---|---|---|---|---|---|
| 2011–2012 | 2012–2013 | 2013–2014 | |||
| FTEs | Planned Spending | FTEs | Planned Spending | FTEs | Planned Spending |
| 578 | 2,898.3 | 544 | 2,936.3 | 502 | 2,950.1 |
| Program Activity Expected Results | Performance Indicators | Targets |
|---|---|---|
| Homelessness is prevented and reduced. | Number of people placed in longer-term stable housing through Homelessness Partnering Strategy-funded projects. Source: Administrative Data |
Baseline Year |
| Not-for-profit organizations have capacity to respond to existing and emerging social issues for target populations. | Number of partnerships/networks developed by funding recipients as a result of funded projects. (Social Development Partnership Program – Disability component). Source: Administrative Data |
110 Historical Results: |
| Social not-for-profit organizations have capacity to respond to existing and emerging social issues related to people with disabilities. | Number of partnerships/networks developed by funding recipients as a result of funded projects. (Social Development Partnership Program – Disability component). Source: Administrative Data |
138 Historical Results: |
| Seniors are engaged within communities. | Number of seniors participating in or benefiting from New Horizons for Seniors Program-funded projects. Source: Administrative Data |
100,000 Historical results: |
| People with disabilities can access community facilities. | Number of facilities funded through the Enabling Accessibility Fund. Source: Administrative Data |
210 Historical results: |
Ratio of rural funded projects to urban funded projects. Source: Administrative Data |
43.5% Historical results: 2008-2009: |
Planning Highlights
Implement the new approach to the Homelessness Partnering Strategy
The government has renewed the Homelessness Partnering Strategy until 2014 at the current funding level of $134.8 million per year and with a number of key enhancements to be implemented and tracked. The Homelessness Partnering Secretariat, through its strategic partnerships with provinces and territories, communities and other stakeholders, will continue to assist those who are homeless or at risk of homelessness to move towards self-sufficiency, including low-income seniors, people with disabilities, recent immigrants and Aboriginal people in need of support.
Strengthen social partnerships and promote contributions from different sectors of society in the development of new approaches to social challenges
In the 2010 Speech from the Throne, the Government expressed its interest in looking to innovative charities and forward-thinking private-sector companies to partner on new approaches to social challenges. HRSDC will continue to support communities and non-profit organizations in their efforts to tackle local challenges by partnering with innovative charities and forward-thinking private sector companies. HRSDC will also work to implement the Government of Canada's commitment to establish a Prime Minister's Volunteer Award.
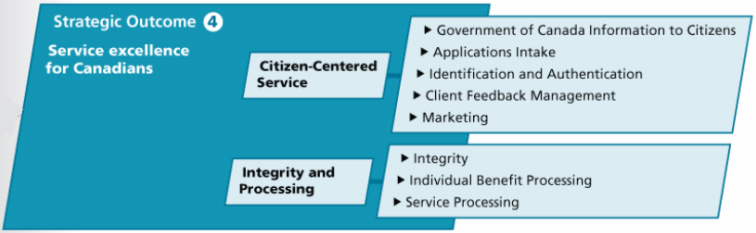
2.4 Strategic Outcome 4: Service Excellence for Canadians
Click here to enlarge
Text version of the Strategic Outcome 4: Service Excellence for Canadians
2.4.1 Program Activity: Citizen-Centred Service
Benefits to Canadians
This program activity aims to improve and integrate government service delivery by providing Canadians one-stop personalized service, and easy access to programs and services across all of its service delivery channels: on the internet, by telephone, in person, and by mail. These service delivery channels provide a platform for dialogue and for building sustained client relationships with Canadians.
Guided by the ongoing feedback of citizens and front-line employees, and in collaboration with partners, the Department continuously refines its service strategies, approaches and offerings so that Canadians can easily and securely access the government information or services they need.
This program activity supports the Government of Canada's efforts to achieve single-window, seamless service delivery to promote timely, positive service experiences and overall client satisfaction.
| Human Resources (FTEs) and Planned Spending ($ millions) | |||||
|---|---|---|---|---|---|
| 2011–2012 | 2012–2013 | 2013–2014 | |||
| FTEs | Planned Spending | FTEs | Planned Spending | FTEs | Planned Spending |
| 5,818 | 431.3 | 5,808 | 430.4 | 5,678 | 422.3 |
| Program Activity Expected Results | Performance Indicators | Targets |
|---|---|---|
| Canadians have one-stop, personalized access to Government of Canada programs and services. | Percentage of in-person clients who were proactively offered targeted information in addition to their original request. Source: Client Satisfaction Survey, 2010 |
Baseline Year |
Percentage of clients satisfied with the quality of service received through each channel. Source: Client Satisfaction Survey, 2010 |
85% Historical Results: 2006: 84% |
|
Number of federal partners under agreement with Service Canada for service delivery. Source: Administrative Data |
11 Historical Results: |
|
| Canadians are able to access information on Government of Canada programs and services online, over the telephone and in-person. | Percentage of availability of Internet (http://servicecanada.gc.ca). Source: Administrative Data |
98% Historical Results: |
Percentage of calls to 1 800 O-Canada answered by an agent within 18 seconds. Source: Administrative Data |
85% Historical Results: |
|
Percentage of Canadians with access to a Service Canada point of service within 50 kilometres of where they live. Source: Administrative Data |
90% Historical Results: |
|
| Canadians receive an accurate review of passport applications by Service Canada agents. | Percentage of passport applications accurately reviewed and authenticated by receiving agents. Source: Administrative Data |
98% Historical Results: |
| Canadians receive a timely response to the feedback they submitted regarding delivery of services by Service Canada. | Percentage of Office for Client Satisfaction feedback replied to within seven working days of receipt. Source: Administrative Data |
100% Historical Results: |
Planning Highlights
The following plans for 2011-2012 support this priority by responding to citizen demands for service delivery that is organized from their perspective and easier to access.
Modernize service delivery and enhance the service delivery channels that Canadians use
Efforts will continue to focus on ensuring that clients are provided with a consistent service experience across all service channels (i.e., internet, telephone, in-person). Clients will be encouraged to take advantage of the electronic services and self-service options when they are seeking information and conducting transactions with the Department. At the same time, a Client Contact Centre approach will be implemented with the aim of resolving enquiries the first time a client contacts the Department. For this year, the work will include enhancing the call centre network for Employment Insurance, Canada Pension Plan and Old Age Security. This will be achieved by improving the Interactive Voice Response System in support of self-service and equipping call-centre staff to perform additional transactions with clients.
Improving the delivery of student financial assistance will be supported through collaborative work with provincial/territorial governments to modernize the delivery of student financial assistance through the use of new technologies, by integrating federal and provincial/territorial student financial assistance programs, and through improvements to the awareness and outreach on incentives for post-secondary education assistance and savings.
Increase the use of client feedback
The Department will strengthen its ability to capture client feedback, such as through the Voice of the Client, to ensure that the needs and experiences of Canadians shape service improvements and inform the modernizing of service delivery.
Increase the scope of services to which Service Canada provides access
In addition to delivering core programs on behalf of HRSDC, work will be undertaken to advance the vision of Service Canada as the service delivery agent for the Government of Canada. This work will include developing a partnership strategy and negotiating and managing service delivery arrangements with other departments.
2.4.2 Program Activity: Integrity and Processing
Benefits to Canadians
In delivering benefits of over $95.8 billion annually, the Department processes applications, establishes the eligibility of Canadians to receive benefits and issues payments. Canadians receive the most value from benefit payments which are timely, secure and accurate. The Integrity and Processing program activity positions the Department to be better able to ensure the timeliness and accuracy of payments, the security and privacy of personal information, and the overall quality of service offerings. The Department continues to modernize the way it handles processing and service delivery functions to help improve the efficiency, accuracy, timeliness and integrity of its operations while lowering the costs to deliver its services. These efforts not only serve to streamline application processes but also increase public confidence and trust in the delivery of government services. These efforts result in savings for the federal government - a total of $701.6 million in savings was realized in 2009–2010. Measured and reported as program savings, these results consist of both direct and indirect savings:
- Direct savings are overpayments and associated penalties that are identified as a result of integrity activities and are subject to recovery.
- Indirect savings are reductions in future program payments (i.e. avoidance of future costs) resulting from the discontinuation of benefits.
The Department maintains management frameworks, processes and risk-based controls to strengthen its processing efficiency and the integrity of its programs by ensuring operational and service compliance. In addition, the Department continues to place significant emphasis on the importance of protecting the information entrusted to it by Canadians.
| Human Resources (FTEs) and Planned Spending ($ millions) | |||||
|---|---|---|---|---|---|
| 2011–2012 | 2012–2013 | 2013–2014 | |||
| FTEs | Planned Spending | FTEs | Planned Spending | FTEs | Planned Spending |
| 8,292 | 638.4 | 8,268 | 636.6 | 8,272 | 637.1 |
| Program Activity Expected Results | Performance Indicators | Targets |
|---|---|---|
| Services and benefits are delivered accurately. | Payment Accuracy of Employment Insurance. Source: Administrative Data |
95% Historical Results: |
Payment Accuracy of Canada Pension Plan. Source: Administrative Data |
95% Historical Results: |
|
Payment Accuracy of Old Age Security/Guaranteed Income Supplement. Source: Administrative Data |
95% Historical Results: |
|
| Services and benefits are delivered securely. | Once identified, percentage of clients notified within 10 business days that their personal information was potentially put at risk. Source: Administrative Data |
100% Historical Results: |
| Services and benefits are delivered in a timely manner. | Percentage of Employment Insurance benefit payments or non-payment notifications issued within 28 days of filing. Source: Administrative Data |
80% Historical Results: |
Percentage of Canada Pension Plan retirement benefits paid within the first month of entitlement. Source: Administrative Data |
90% Historical Results: |
|
Percentage of Old Age Security basic benefits paid within the first month of entitlement. Source: Administrative Data |
90% Historical Results: |
|
Percentage of initial Apprenticeship Incentive Grant payments and non-payment notifications issued within 28 calendar days. Source: Administrative Data |
95% Historical Results: |
|
Percentage of initial Apprenticeship Completion Grant payments and non-payment notifications issued within 28 calendar days. Source: Administrative Data |
95% Historical Results: |
|
Percentage of initial Wage Earner Protection Program payments and non-payment notifications issued within 42 calendar days. Source: Administrative Data |
80% Historical Results: |
|
Percentage of Social Insurance Numbers (SINs) issued in one visit and cards issued within five business days from date of receipt of request (based on complete applications with all supporting documents). Source: Administrative Data |
90% Historical Results: |
|
| Clients are accurately identified for the purpose of receiving the appropriate service or benefit for SIN-based programs. | Amount of program savings estimated from overpayments identified and the avoidance of future costs. Source: Administrative Data |
$730M Historical Results: |
Percentage of clients identified accurately. Source: Administrative Data |
Baseline year |
|
Accuracy rate for legitimate Social Insurance Numbers in the Social Insurance Registry. Source: Administrative Data |
99.9% Historical Results: |
Planning Highlights
The following plans for 2011-2012 will improve the efficiency and integrity of operations and support the Department's priority of modernizing service delivery approaches:
Enhance internal efficiencies through automation of Employment Insurance
By transforming and modernizing its business operations through automation and other process improvements, the Department will ensure there continues to be progress in advancing service excellence. It will work to finalize automation and other re-engineering initiatives to realize the objective of "one client, one workload and one process" for Employment Insurance. There will be further work this year to enhance the electronic services available to individuals and businesses. Increasing the use of automation, including imaging to reduce the reliance on paper handling, will help to reduce the costs of delivering the Employment Insurance program, improve data accuracy and support the integrity of the Department's benefit processing.
Improve Canada Pension Plan and Old Age Security services for seniors
With increases in workload on the horizon as the population ages, the Department will improve Canada Pension Plan and Old Age Security to secure a strong, modernized and sustainable approach to the delivery of benefits for seniors. This work includes a redesign and streamlining of application processes for Canada Pension Plan and Old Age Security and efforts to increase the use of electronic services.
Improve the integrity of operations
The Department will continue to modernize its integrity control framework for the EI, CPP and OAS programs to effectively mitigate program integrity risks. This will be achieved through the further automation of many existing control measures, the continued implementation of risk-based approaches to address program integrity issues, and the enhanced use of information sharing agreements to support these activities. Identity management policies, practices and controls, including initiatives such as information-sharing agreements with provincial vital statistics organizations, will support continued effective administration of the Social Insurance Number and Social Insurance Register.
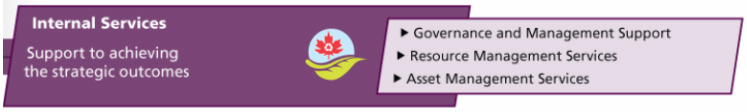
2.5 Internal Services
Click here to enlarge
Text version of the Internal Services
Description
Internal Services support the achievement of the Department's strategic outcomes by providing the resources, guidance, support services, and information necessary to design and deliver its programs and services. The definition of internal services is broad and includes policy development, research, audits, evaluation, planning, risk management, and executive functions, as well as the more traditional corporate services such as information management, information technology, human resources and financial management.
At HRSDC, these services are: Corporate Secretariat, the Chief Financial Officer, Human Resources Services, Strategic Policy and Research, Legal Services, Public Affairs and Stakeholder Relations, Internal Audit Services, Internal Integrity and Security, and Innovation and Information Technology.
The proportion of resources dedicated to internal services across the country reflects the complexity and breadth of the Department’s mandate, as well as the number and diversity of its points of service and service channels. The Department’s decentralized service delivery network is complex and is supported by an equally complex network of internal services, with over 2,000 Internal Services FTEs located outside the National Capital Region.
| Human Resources (FTEs) and Planned Spending (millions of dollars) | |||||
|---|---|---|---|---|---|
| 2011–2012 | 2012–2013 | 2013–2014 | |||
| FTEs | Planned Spending | FTEs | Planned Spending | FTEs | Planned Spending |
| 5,820 | 859.5 | 5,791 | 860.3 | 5,747 | 834.6 |
Planning Highlights
Continue to modernize and integrate internal service functions and systems in order to improve our ability to deliver results for Canadians
In support of ongoing value for money, compliance, and stewardship, HRSDC will transform enabling services by moving to an integrated three-tiered service delivery model for human resources, finance, and information technology services over the next 5 years. This initiative emphasizes self-serve options, and updates the Department's enterprise resource planning system with new tools that provide better support for managing human and financial resources.
Pursuing public service renewal through a healthy and enabled workplace, workforce development and leadership
The Department's approach to people management is built on three core elements: workforce, workplace, and leadership. These principles will help develop the strategies, policies, and guidance HRSDC needs to renew the organization, meet its workforce needs, and implement the government’s agenda. In addition, the Department will improve HR planning and develop standardized tools, training, guides, and awareness sessions to help managers exercise their HR accountabilities.
Strengthen management measures in support of legislative and policy requirements in the areas of privacy, security, and internal integrity
The Department will also work to strengthen its privacy management practices. It will also strengthen its internal integrity and security by updating the departmental Security Plan, implementing the new TBS Policy on Government Security, and developing a new code of conduct for HRSDC through consultations with employees.
Develop a sound multi-year Departmental Investment Plan
Treasury Board requires departments to table an integrated investment plan for their major projects and asset investments over a 5-year time horizon. In times of constrained resources, investment plans allow organizations to focus resources on the areas of greatest importance and risk to promote the timely and cost-effective completion of projects. HRSDC's investment plan will be completed in 2011-2012.
Contribute to the Federal Sustainable Development Strategy
HRSDC is a participant in the Federal Sustainable Development Strategy (FSDS) and contributes to the fourth goal of “Shrinking the Environmental Footprint of Government” and other areas related to Greening Government Operations (GGO) through Internal Services. The Department contributes to the following GGO target areas:
- Green procurement;
- E-waste, printing units, paper consumption and green meetings; and,
- Greenhouse gas emissions (from vehicle fleet only).
For additional details on HRSDC’s GGO activities, please see http://www.rhdcc-hrsdc.gc.ca/eng/publications_resources/dpr/rpp/index.shtml
Section III Supplementary Information
3.1 Financial Highlights
The preparation of the future-oriented financial statements is a new annual Treasury Board Secretariat initiative. For the 2011-2012 Report on Plans and Priorities (RPP), all departments must provide a future-oriented statement of operations (and related notes) prepared in accordance with Treasury Board Accounting Standard (TBAS) 1.2.
The future-oriented financial highlights presented within this section of the RPP are intended to serve as a general overview of HRSDC's financial operations. These future-oriented financial highlights are prepared on an accrual basis to strengthen accountability and improve transparency and financial management.
HRSDC is financed by the Government of Canada through Parliamentary authorities. Financial reporting of authorities provided to HRSDC do not parallel financial reporting according to generally accepted accounting principles since authorities are primarily based on cash flow requirements. Consequently, items forecasted in the consolidated future-oriented statement of operations are not necessarily the same as those forecasted through authorities from Parliament. A reconciliation between forecast authorities available (based on RPP forecast/planned spending amounts) and the forecast net cost of operations is set out in Note 5 of the Department’s consolidated future-oriented statement of operations.
For the consolidated future-oriented statement of operations purposes, the financial activities of the Canada Pension Plan (CPP) are not part of HRSDC’s reporting entity as the CPP is under joint control of the federal and the participating provincial and territorial governments.
A condensed view of the future-oriented statement of operations is presented below. A complete consolidated future-oriented statement of operations is available online at:
http://www.hrsdc.gc.ca/eng/publications_resources/dpr/
rpp/financial_statement/rpp_11-12_financial_e.shtml
| For the year ending March 31, 2012 (millions of dollars) | |
|---|---|
| Forecast 2012 |
|
| Expenses | |
| Benefits and transfer payments | 63,765.7 |
| Operating expenses | 3,467.3 |
| Total expenses | 67,233.0 |
| Revenues | |
| EI revenues | 19,486.9 |
| Other | 796.1 |
| Total revenues | 20,283.0 |
| Net cost of operations | 46,950.0 |
3.2 Specified Purpose Accounts
Specified Purpose Accounts consist of special categories of revenues and expenditures. They report transactions of certain accounts where enabling legislation requires that revenues be earmarked and that related payments and expenditures be charged against such revenues. The transactions of these accounts are to be accounted for separately.
HRSDC is responsible for the stewardship of five such accounts:
- the Employment Insurance Operating Account;
- the Canada Pension Plan;
- the Government Annuities Account;
- the Civil Service Insurance Fund; and,
- the Canadian Millennium Scholarship Foundation Excellence Awards Fund.
The Employment Insurance Operating Account is a consolidated Specified Purpose Account and is included in the financial reporting of the Government of Canada. Consolidated Specified Purpose Accounts are used principally where the activities are similar in nature to departmental activities and the transactions do not represent liabilities to third parties but, in essence, constitute Government revenues and expenditures.
Employment Insurance Operating Account
A new Employment Insurance Operating (EIO) Account was established to record all amounts received or paid out under the Employment Insurance Act since January 1, 2009, onwards. The previous Employment Insurance (EI) Account was closed and removed from the Accounts of Canada as of December 31, 2008. The Employment Insurance Act provides short-term financial relief and other assistance to eligible workers. The EI program is financed entirely by contributions from employees and employers, via premiums paid on insured earnings up to the maximum insurable earnings (MIE).
Employment Insurance benefits are divided into:
- Income Benefits under Part I of the Employment Insurance Act which provide temporary financial assistance to unemployed Canadians who have lost their job through no fault of their own, while they look for work or upgrade their skills. EI Part I also provides assistance to Canadians who are sick, pregnant, caring for a newborn or adopted child, as well as those caring for a family member who is seriously ill with a significant risk of death.
- Employment Benefits under Part II of the Employment Insurance Act which help Canadians to prepare for, find and maintain employment. These activities include Employment Benefits and Support Measures (EBSM) delivered under the Labour Market Development Agreements (LMDA), pan-Canadian programming, and functions of the National Employment Service.
Benefits and administrative costs are paid out of the Consolidated Revenue Fund and charged to the EIO Account.
Financial Summary
In Budget 2008, the Government announced improvements to the management and governance of EI finances through the creation of an independent Crown corporation, the Canada Employment Insurance Financing Board (CEIFB). In 2010, the CEIFB implemented a new premium rate-setting mechanism that will ensure that revenues and expenditures break-even over time. The CEIFB has been mandated not to recover any spending resulting from the enhanced benefits and training announced in Budget 2009.
In 2010, the Government of Canada modified the maximum annual change in the EI premium rate from the original legislative limit of 15 cents for each $100 of insurable earnings to 5 cents for 2011 and 10 cents for subsequent years. On November 12, 2010, the CEIFB set the 2011 premium rate at $1.78, the maximum legislative amount.
Due to the limits on the annual increase in the premium rate, costs are expected to exceed revenues by $1.2 billion in 2011-2012. This includes an expected $0.2 billion in additional funding for the cost of the benefit enhancement measures announced in Budget 2009.
The table below summarizes the EI revenues and expenditures from 2008-2009 financial results to 2011-2012.
| (millions of dollars) | Actual | Forecast | Planned Spending | |
|---|---|---|---|---|
| 2008-2009 | 2009-2010 | 2010-2011 | 2011-2012 | |
| Expenditures
EI Benefits |
||||
| Income Benefits | 14,196 | 18,980 | 17,606 | 17,030 |
| EBSM | 2,112 | 2,606 | 2,624 | 2,122 |
| Total EI Benefits | 16,308 | 21,586 | 20,230 | 19,152 |
| Administrative Costs | 1,801 | 2,031 | 1,942 | 1,724 |
| Doubtful Accounts | 27 | 50 | 50 | 48 |
| Sub-Total | 18,137 | 23,667 | 22,223 | 20,924 |
| Revenues (excluding interest) | ||||
| Premium Revenuea | 17,217 | 17,121 | 18,119 | 19,403 |
| Penalties | 41 | 42 | 45 | 42 |
| Interest | 878b | 13 | 15 | 20 |
| Funding for Budget 2009 measures | 124 | 1,522 | 1,431 | 231 |
| Sub-Total | 18,260 | 18,697 | 19,610 | 19,696 |
| Annual Surplus (Deficit) | 124 | (4,970) | (2,613) | (1,228) |
| Cumulative Surplus (Deficit) | 34c | (4,936) | (7,548) | (8,777) |
| a The EI premiums reported in the summary financial statements of the Government of Canada and the Federal Budget exclude the premium contributions made by the Government of Canada as an employer. b Includes $856 million in interest on the balance of the EI Account from April 1, 2008 to December 31, 2008. EIO Account only includes interest on overdue accounts receivable, which totaled $22 million in 2008-2009. c $34 million corresponds to the amount of EI credits and charges from January 1, 2009 to March 31, 2009 and is included in the cumulative balance of the EIO Account. Note: Totals may not add due to rounding. |
||||
Benefit Payments
Benefits in 2011-2012 are expected to reach $19.2 billion, consisting of $17.0 billion for Income Benefits and $2.1 billion for Employment Benefits and Support Measures. The following provides information on the temporary EI measures introduced under the Economic Action Plan as well as new provisions to the EI program.
Regular Benefits
In Budget 2009, the Government increased regular benefit entitlements by five additional weeks to a maximum of 50 weeks for all individuals with a claim active or starting between March 1, 2009 and September 11, 2010.
Regular benefits were extended in Budget 2009 to individuals participating in longer-term training under the Career Transition Assistance Initiative, providing additional time and financial support to allow long-tenured workers to gain the new skills needed to adapt to the changing economy.
Given that some claimants could potentially qualify under both measures to receive benefits beyond 2010-2011, the estimated cost for these measures in 2011-2012 is $0.2 billion. These measures will be funded through the additional Funding for Budget 2009 Measures.
In the Fall of 2009, the Government passed legislation to provide an additional 5 to 20 weeks of regular benefits for long-tenured workers whose claims started between January 4, 2009 and September 11, 2010 to a maximum of 70 weeks. Given that some claimants could potentially qualify under this measure to receive benefits beyond 2010-2011, the estimated cost for this measure in 2011-2012 is $0.2 billion. Since this measure was not included in Budget 2009, it will be entirely financed through EI premiums credited to the EIO Account.
Special Benefits
As of January 31, 2010, self-employed workers can voluntarily enter into an agreement with the Canada Employment Insurance Commission to contribute EI premiums at the employee rate and be eligible to access special benefits (excluding maternity and parental benefits in Quebec, as they have been covered under the Quebec Parental Insurance Plan as of January 2006).
| (millions of dollars) | Actual | Forecast | Planned Spending | |
|---|---|---|---|---|
| 2008-2009 | 2009-2010 | 2010-2011 | 2011-2012 | |
| Income Benefits | ||||
| Regular | 10,102 | 14,529 | 13,223 | 12,488 |
| Sickness | 1,000 | 1,024 | 1,044 | 1,098 |
| Maternity | 883 | 915 | 921 | 975 |
| Parental | 2,057 | 2,157 | 2,211 | 2,340 |
| Compassionate Care | 10 | 10 | 11 | 11 |
| Fishing | 264 | 258 | 254 | 261 |
| Work-Sharing | 55 | 300 | 115 | 43 |
| Benefit Repayments | (175) | (214) | (173) | (186) |
| Total Income Benefits | 14,196 | 18,980 | 17,606 | 17,030 |
| Note: Totals may not add due to rounding. | ||||
Canada Pension Plan
The Canada Pension Plan is an income security plan which is funded by the contributions of employees, employers, and self-employed persons. It is a joint federal-provincial plan that covers virtually all employed and self-employed persons in Canada, excluding Quebec which operates its own comprehensive pension plan, the Quebec Pension Plan.
The Canada Pension Plan provides for a variety of benefits in the case of the retirement, disability or death of a contributor. In addition to retirement pensions, the Canada Pension Plan also provides for survivors pensions, children’s benefits, disability pensions, disabled child contributors’ benefits, as well as a one-time death benefit that cannot exceed $2,500. Benefits are calculated based on how much and for how long a contributor has paid into the Canada Pension Plan. Benefits are not paid automatically — everyone must apply and provide proof of eligibility.
| (millions of dollars) | Actual | Forecast | Planned Spending | |
|---|---|---|---|---|
| 2008-2009 | 2009-2010 | 2010-2011 | 2011-2012 | |
| Revenue | ||||
| Contributionsa | 36,506 | 36,276 | 36,862 | 38,252 |
| Investment Income | ||||
| Canada Pension Planb | 6 | 1 | 1 | 1 |
| CPP Investment Boardc | (23,576) | 16,218 | - | - |
| Total Investment Income | (23,570) | 16,219 | 1 | 1 |
| Total Revenue | 12,936 | 52,495 | 36,863 | 38,253 |
| Expenditures | ||||
| Benefit Paymentsd | 29,005 | 30,363 | 31,625 | 33,222 |
| Administrative expenses | 694 | 734 | 806 | 747 |
| Total Expenditures | 29,699 | 31,097 | 32,431 | 33,969 |
| Increase | (16,763) | 21,398 | 4,432 | 4,284 |
| Year-end balances | 110,022 | 131,420 | 135,852 | 140,136 |
| a Source of Contributions Forecast 2010 through 2014 is from the 25th Actuarial Report from the Office of the Superintendent of Financial Institutions Canada (Table 4). b The Canada Pension Plan investment income only includes the interest earned on the daily operating balance. c Canada Pension Plan Investment Board actual amounts are based on their audited financial statements. The Canada Pension Plan Investment Board invests mainly in equities. The investment income is made up of the interest from the bonds as well as the change in fair values of other varied equity investments as of that date. It is difficult to forecast a future fair value on this type of income. Therefore, the forecast investment income for the years 2010-2011 and forward are not provided. d Source of Benefit payments Forecast 2010 through 2014 is from the Actuarial Monthly Report (June 2010) from the Office of the Superintendent of Financial Institutions Canada. Note: Totals may not add due to rounding. |
||||
Government Annuities Account
This account was established by the Government Annuities Act, and modified by the Government Annuities Improvement Act, which discontinued sales of annuities in 1975. The account is valued on an actuarial basis each year, with the deficit charged or surplus credited to the Consolidated Revenue Fund.
The purpose of the Government Annuities Act was to assist Canadians in providing for their later years through the purchase of Government annuities. The Government Annuities Improvement Act increased the rate of return and flexibility of Government annuity contracts.
Income consists of premiums received, funds reclaimed from the Consolidated Revenue Fund for previously untraceable annuitants, earned interest and any transfer needed to cover the actuarial deficit. Payments and other charges represent matured annuities, the commuted value of death benefits, premium refunds and withdrawals, and actuarial surpluses and unclaimed items transferred to non-tax revenues. The amounts of unclaimed annuities, related to untraceable annuitants, are transferred to non-tax revenues.
As of March 31, 2010, there were 1,103 outstanding deferred annuities, the last of which will come into payment around 2030.
| (millions of dollars) | Actual | Forecast | Planned Spending | |
|---|---|---|---|---|
| 2008-2009 | 2009-2010 | 2010-2011 | 2011-2012 | |
| Actuarial Liabilities –
Balance at beginning of year |
292.9 | 267.1 | 243.4 | 221.9 |
| Income | 19.4 | 17.5 | 17.0 | 15.5 |
| Payments and other charges | 42.0 | 38.7 | 36.1 | 33.7 |
| Excess of payments and other charges over income for the year | 22.6 | 21.2 | 19.1 | 18.2 |
| Actuarial Surplus | 3.2 | 2.5 | 2.4 | 2.3 |
| Actuarial Liabilities –
Balance at year-end |
267.1 | 243.4 | 221.9 | 201.4 |
Civil Service Insurance Fund
This account was established by the Civil Service Insurance Act, under which the Minister of Finance could contract with permanent employees in the public service for the payment of certain death benefits. No new contracts have been entered into since 1954 when the Supplementary Death Benefit Plan for the Public Service and Canadian Forces was introduced as part of the Public Service Superannuation Act and the Canadian Forces Superannuation Act, respectively. As of April 1997, the Department of Human Resources Development assumed the responsibility for the administration and the actuarial valuation of the Civil Service Insurance Act.
The number of policies in force as of March 31, 2010 was 1,059 and the average age of the policy holders was 89.6 years. Receipts and other credits consist of premiums and an amount (charged to expenditures) which is transferred from the Consolidated Revenue Fund in order to balance the assets and actuarial liabilities of the program. Payments and other charges consist of death benefits, settlement annuities paid to beneficiaries and premium refunds.
Pursuant to subsection 16(3) of the Civil Service Insurance Regulations, any deficit will be credited to the Account from the Consolidated Revenue Fund.
| (millions of dollars) | Actual | Forecast | Planned Spending | |
|---|---|---|---|---|
| 2008-2009 | 2009-2010 | 2010-2011 | 2011-2012 | |
| Opening Balance | 5.9 | 5.6 | 5.5 | 5.3 |
| Income and other credits | - | 0.1 | 0.1 | 0.1 |
| Payments and other charges | 0.3 | 0.2 | 0.3 | 0.3 |
| Excess of payments and other charges over income for the year | 0.3 | 0.1 | 0.2 | 0.2 |
| Closing Balance | 5.6 | 5.5 | 5.3 | 5.1 |
Canadian Millennium Scholarship Foundation Excellence Awards Fund
In accordance with Budget Implementation Act 2008, the Canada Millennium Scholarship Foundation is ending after its ten-year mandate. This Specified Purpose Account was established by way of an agreement between Canada Millennium Scholarship Foundation and Human Resources and Skills Development Canada (HRSDC) in order for HRSDC to administer the remaining Excellence Awards payments to eligible students upon the dissolution of the Canada Millennium Scholarship Foundation. The transfer of funds also includes the costs of administering this program on behalf of the Canada Millennium Scholarship Foundation.
HRSDC will administer the remaining Excellence Awards disbursements from January 1, 2010 until December 31, 2013. After this date, HRSDC will transfer any funds remaining in the account to the Consolidated Revenue Fund.
| (millions of dollars) | Actual | Forecast | Planned Spending | |
|---|---|---|---|---|
| 2008-2009 | 2009-2010 | 2010-2011 | 2011-2012 | |
| Opening Balance | - | - | 14.4 | 7.1 |
| Income and other credits | - | 14.8 | - | - |
| Payments and other charges | - | 0.4 | 7.3 | 4.3 |
| Excess of payments and other charges over receipts for the year | - | (14.4) | 7.3 | 4.3 |
| Closing Balance | - | 14.4 | 7.1 | 2.8 |
3.3 Statutory Annual Reports
Employment Insurance Part II
Part II of the Employment Insurance Act commits the federal government to work in concert with provinces and territories to put in place Employment Benefits and Support Measures or similar programs and services to help unemployed Canadians integrate into the labour market.
Since provinces and territories are best placed to determine the mix of employment programming that is required to meet their local and regional labour market needs, Employment Benefits and Support Measures are delivered through transfer Labour Market Development Agreements between Canada and the provinces and territories.
Employment Benefits and Support Measures comprise five employment benefit programs — Targeted Wage Subsidies, Self-Employment, Job Creation Partnerships, Skills Development and Targeted Earnings Supplements — and three support measures — Employment Services, Labour Market Partnerships and Research and Innovation.
More detailed information on Employment Insurance Part II is available at http://www.servicecanada.gc.ca
Financial Data
For 2011-2012, the Employment Insurance Part II expenditure authority of $2.172 billion represents 0.4% of total estimated insurable earnings of $494.364 billion. This represents a lower level of expenditures than the 0.8% ceiling imposed under the Act, which is estimated at $3.960 billion in 2011-2012.
Some of the savings from Part I income benefits generated by the Employment Insurance reform are included in these funds to provide job opportunities and help Canadians get back to work more quickly. The amount of re investment reached maturity at $800 million in 2000-2001.
| (millions of dollars) | Basea | Re-Investmenta | Total Plana |
|---|---|---|---|
| Newfoundland and Labrador | 58.9 | 73.1 | 132.0 |
| Nova Scotia | 49.9 | 30.3 | 80.2 |
| New Brunswick | 49.0 | 42.1 | 91.1 |
| Prince Edward Island | 17.1 | 10.0 | 27.1 |
| Quebec | 341.1 | 248.1 | 589.2 |
| Ontario | 368.6 | 184.1 | 552.7 |
| Manitoba | 34.6 | 10.2 | 44.8 |
| Saskatchewan | 27.9 | 9.9 | 37.8 |
| Alberta | 71.0 | 35.9 | 106.9 |
| Northwest Territories | 1.6 | 1.6 | 3.2 |
| Nunavut | 1.8 | 1.0 | 2.8 |
| British Columbia | 127.0 | 151.7 | 278.7 |
| Yukon | 1.5 | 2.0 | 3.5 |
| 1,150.0 | 800.0 | 1,950.0 | |
| Pan-Canadian Responsibilities b | 171.8 | 0.0 | 171.8 |
| Funds available for Employment
Benefits and Support Measures |
1,321.8 | 800.0 | 2,121.8 |
|
a Totals may not add due to rounding.
b Funds earmarked for Pan-Canadian priorities, such as Aboriginal programming, sectoral and innovations projects. |
|||
Consolidated Report on Canada Student Loans
The consolidated report on Canada Student Loans only includes expenditures made under Canada Student Loans Act and Canada Student Financial Assistance Act; it does not include the Department’s operating expenses related to the delivery of the Canada Student Loan Program (CSLP).
| (millions of dollars) | Actual | Forecast | Planned Spending | |||
|---|---|---|---|---|---|---|
| 2008-2009 | 2009-2010 | 2010-2011 | 2011-2012 | 2012-2013 | 2013-2014 | |
| Revenue | ||||||
| Interest Revenue on Direct Loans | 472.8 | 369.8 | 380.0 | 473.1 | 547.1 | 596.3 |
| Recoveries On guaranteed Loans | 38.5 | 27.4 | 10.5 | 16.2 | 11.9 | 10.7 |
| Recoveries On Put-Back Loans | 13.1 | 11.0 | 5.0 | 5.0 | 2.8 | 3.4 |
| Total Revenue | 524.4 | 408.2 | 395.5 | 494.3 | 561.8 | 610.4 |
| Expenses | ||||||
| Transfer Payments | ||||||
| Canada Study Grants, Canada Access Grants and Canada Student Grants Program | 143.2 | 533.7 | 578.4 | 554.3 | 539.6 | 534.9 |
| Total Transfer Payments Expenses | 143.2 | 533.7 | 578.4 | 554.3 | 539.6 | 534.9 |
| Loan Administration | ||||||
| Collection Costsa | 10.7 | 5.2 | 1.8 | 1.8 | 1.8 | 1.8 |
| Program Delivery Costs | 76.0 | 61.7 | 67.8 | 71.6 | 67.0 | 63.5 |
| Risk Premium to Financial Institutions | 0.7 | 0.6 | 0.3 | 0.3 | 0.2 | 0.2 |
| Put-Back to Financial Institutions | 3.8 | 3.6 | 3.1 | 2.5 | 2.0 | 1.6 |
| Administrative Fees to Provinces and Territories and SIF | 14.7 | 19.3 | 30.2 | 30.2 | 30.1 | 30.0 |
| Total Loan Administration Expenses | 105.9 | 90.4 | 103.2 | 106.4 | 101.1 | 97.1 |
| Cost of Government Support | ||||||
| Benefits Provided to Students | ||||||
| In-Study Interest Borrowing Expense b | 166.9 | 177.4 | 174.0 | 207.0 | 220.5 | 228.8 |
| In Repayment Interest Borrowing Expense b | 160.7 | 180.0 | 210.0 | 240.6 | 266.2 | 292.7 |
| In-Study Interest Subsidy | 4.0 | 1.4 | 0.9 | 1.2 | 0.9 | 0.7 |
| Repayment Assistance Programs | 93.2 | 74.9 | 79.0 | 88.8 | 85.7 | 86.7 |
| Claims Paid & Loans Forgiven | 23.2 | 22.5 | 11.2 | 17.6 | 18.1 | 19.0 |
| Bad Debt Expense c | ||||||
| Debt Reduction in Repayment Expense | 53.2 | 133.4 | 41.1 | 38.1 | 38.1 | 38.4 |
| Bad Debt Expense | 293.6 | 129.1 | 328.3 | 318.5 | 326.0 | 332.3 |
| Total Cost of Government Support Expenses | 794.8 | 718.7 | 844.5 | 911.8 | 955.5 | 998.6 |
| Total Expenses | 1,043.9 | 1,342.8 | 1,526.1 | 1,572.5 | 1,596.2 | 1,630.6 |
| Net Operating Results | 519.5 | 934.6 | 1,130.6 | 1,078.2 | 1,034.4 | 1,020.2 |
| Alternative Payments to Non-Participating Province and Territories d | 111.0 | 223.1 | 253.9 | 250.7 | 251.6 | 255.2 |
| Final Operating Results | 630.5 | 1,157.7 | 1,384.5 | 1,328.9 | 1,286.0 | 1,275.4 |
| a These costs are related to Canada Student Loans Program but are now reported by Canada Revenue Agency. Figures for 2008-2009 have been adjusted by CRA and the new collection costs have been reflected. b These costs are related to Canada Student Direct Loans but reported by the Department of Finance. c This represents the annual expense against the Provisions for Bad Debt and Debt Reduction in Repayment as required under Accrual Accounting. d The figures represent the annual expense recorded under the Accrual Accounting as opposed to the actual amount disbursed to the Non-Participating Provinces and Territories. For 2009-2010, the total amount disbursed as Alternative Payments is $126.0 M. |
||||||
3.4 Supplementary Information Tables
All electronic supplementary information tables listed in the 2011–12 Report on Plans and Priorities can be found on the Treasury Board of Canada Secretariat’s website at http://www.tbs-sct.gc.ca/rpp/2011-2012/info/info-eng.asp
Supplementary Information Tables:
- Details on Transfer Payment Programs;
- Greening Government Operations;
- Horizontal Initiatives;
- Upcoming Internal Audits and Evaluations over the next three fiscal years; and,
- Sources of Respendable and Non-Respendable Revenue.
Section IV – Other items of Interest
4.1 Sustainable Development
Based on the Federal Sustainable Development Strategy, HRSDC commits to:
- Providing more specific information on departmental sustainable development activities appropriate to the Department’s mandate;
- Strengthening the application of Strategic Environmental Assessments (SEAs) by ensuring that the Government’s environmental goals are taken into account when pursuing social and economic goals; and,
- Pursuing best practices for reporting on summary information on the results of SEAs linked to the FSDS goals and targets, in order to ensure that environmental decision making is more transparent.
For additional details on HRSDC's activities to support sustainable development, please see http://www.hrsdc.gc.ca/eng/cs/sp/hrsd/publications/reports/sds-2011-2012/page00.shtml, and for complete details on the Federal Sustainable Development Strategy, please see http://www.ec.gc.ca/dd-sd/default.asp?lang=En&n=C2844D2D-1.