ARCHIVED - RPP 2006-2007
Human Resources and Social Development Canada
 This page has been archived.
Archived Content
Information identified as archived on the Web is for reference, research or recordkeeping purposes. It has not been altered or updated after the date of archiving. Web pages that are archived on the Web are not subject to the Government of Canada Web Standards. As per the Communications Policy of the Government of Canada, you can request alternate formats on the "Contact Us" page.
The Honourable Diane Finley, P.C., M.P.
Minister of Human Resources and Social Development
The Honourable Jean-Pierre Blackburn, P.C., M.P.
Minister of Labour
Ministers' Message
Human Resources and Social Development Canada Overview
Departmental Priorities and Performance Measurement Framework
Analysis of Plans, Priorities and Program Activities by Strategic Outcome
- Policy, Research and Communications
- Labour Market
- Workplace Skills
- Learning
- Labour
- Social Investment
- Children and Families
- Housing and Homelessness
- Service Canada
Supplementary Information
- Organizational Information
- Financial Tables
- Table 1: Planned Spending and Full Time Equivalents
- Table 2: Resources by Program Activitiy
- Table 3: Voted and Statutory Items Listed in Main Estimates
- Table 4: Services Received Without Charge
- Table 5: Loans (Non-Budgetary)
- Table 6: Sources of Respendable and Non-Respendable Revenue
- Table 7: Major Regulatory Initiatives
- Table 8: Details on Transfer Payments Programs
- Table 9: Foundations (Conditional Grants)
- Table 10: Horizontal Initiatives
- Table 11: Sustainable Development Strategy
- Table 12: Internal Audits and Evaluations
- Specified Purpose Accounts
- Employment Insurance Part II - 2006-2007 Expenditure Plan
- Consolidated Report on Canada Student Loans
Other Items of Interest
Website References
Ministers' Messages

Human Resources and Social Development's portfolio is one of the most dynamic and diverse in the federal government, touching the lives of Canadians in many ways. The Department's programs, policies and partnerships, open up new opportunities, and deliver services that help Canadians across the country reach their full potential. By doing this, the Department contributes to building a more competitive and prosperous Canada.
I believe that supporting the economic and social well-being of children and their families, seniors, people with disabilities, and others facing social challenges; building capacity in our communities, private and voluntary sectors, including support for communities capacity to address issues of housing and homelessness; promoting the Canadian labour force, and nurturing our learning environment are fundamental to the success of our country in the 21st century and beyond.
On January 23, Canadians elected a new Government. Canada's new Government has been clear and focused on its five priorities: accountability, lower taxes, crime, child care, and health care. Budget 2006 set out how this Government and this Department will deliver significant support for children and families, invest in skills and learning, and commit to consult with provinces and territories, citizens and stakeholders. I am very proud to have been mandated with such an integral part of the Government's priority agenda. This report presents our objectives, the initiatives and activities that will enable us to achieve those objectives, and the results that we expect to achieve in 2006-2007.
I will continue to work closely with the Honourable Jean-Pierre Blackburn in his capacity as the Minister of Labour and with Mrs. Lynne Yelich in her capacity as Parliamentary Secretary. I am also eager to work with all of our partners, including provinces, territories and stakeholders to achieve results that help Canadians.
One of our goals is to improve the delivery of programs and services through Service Canada. Canadians have been very clear: they want services that are easy to find, access and use. They also expect prompt, personal and courteous assistance from people who know the answers to their questions. Service Canada is about superior service, simplicity and choice. We are focused on making this a reality for the benefit of all Canadians.
Through our dedicated and principled work, we will ensure that we meet the highest standards of integrity, effectiveness and accountability in serving the public.
Canada is a prosperous nation. Our efforts will be focused on helping to maintain this prosperity now and into the future.
The Honourable Diane Finley, P.C., M.P.
Minister of Human Resources and Social Development

The Labour Program contributes to the social and economic well-being of all Canadians. It plays an important leadership role in the working lives of Canadians by ensuring that Canada's workplaces are healthy, safe, fair, stable and cooperative and productive.
The Labour Program is also playing a leadership role in promoting fundamental labour rights internationally, which supports equitable growth and social stability in developing countries.
A healthy workplace is good for workers, their families, employers and the economy. The Labour Program promotes safe and healthy workplaces through consultation, research, information sharing, and cooperation and collaboration on joint projects among jurisdictions when appropriate.
Our commitments focus on collective bargaining, dispute resolution services, fire protection services, health and safety, labour standards, employment equity, international labour cooperation as well as other workplace concerns such as the formulation of labour policy and the provision of labour-related information.
The Labour Program is responsible for administering two fundamental pieces of legislation that contribute to Canada's development of fair, safe and representative workplaces - the Canada Labour Code and the Employment Equity Act. Important commitments for the coming year are the review of Part III (Labour Standards) of the Canada Labour Code and the introduction of the Wage Earner Protection Program. Our goal is to modernize federal labour legislation to be more in line with the needs of employees and employers in today's economy and help protect workers who are most vulnerable in a bankruptcy.
I will continue to work with the Honourable Diane Finley, the Minister of Human Resources and Social Development, and my colleagues, in order to build a more competitive and prosperous Canada.
Canada is a prosperous nation with unlimited potential. The benefits of the 21st century are enormous - with the best yet to come.
The Honourable Jean-Pierre Blackburn, P.C., M.P.
Minister of Labour
Management Representation Statement
I submit, for tabling in Parliament, the 2006-2007 Report on Plans and Priorities for Human Resources and Social Development.
This document has been prepared based on the reporting principles contained in the Guide to the Preparation of Part III of the Estimates: Reports on Plans and Priorities.
- It accurately portrays the organization's plans and priorities. It is comprehensive and accurate.
- It adheres to the specific reporting requirements outlined in the Treasury Board Secretariat guidelines.
- The Department's plans and priorities are based on the 2007-2008 approved Program Activity Architecture (PAA); however for comparison purposes the Department presents its financial information using the 2006-2007 approved Program Activity Architectures for Human Resources and Skills Development Canada and Social Development Canada.
- It provides a basis of accountability for the results achieved with the resources and authorities entrusted to it.
- It reports finances based on approved planned spending numbers from the Treasury Board Secretariat.
______________________
Janice Charette
Deputy Minister
Human
Resources and Social Development
The plans, priorities, planned spending and performance measures in support of the Labour program are accurately presented in the 2006-2007 Report on Plans and Priorities for Human Resources and Social Development Canada.
______________________
Munir A. Sheikh
Deputy Minister of Labour and Associate Deputy Minister
of Human Resources and Social Development
The plans, priorities, planned spending and performance measures in support of Service Canada are accurately presented in the 2006-2007 Report on Plans and Priorities for Human Resources and Social Development.
______________________
Maryantonett Flumian
Deputy Head of Service Canada and Associate Deputy Minister
of Human Resources and Social Development
Human Resources and Social Development Canada Overview
Introduction
The Department of Human Resources and Social Development Canada (HRSDC) was created on February 6, 2006, through the consolidation of the former Departments of Human Resources and Skills Development and Social Development. HRSDC has a broad social and economic mandate, which affects every Canadian. The Department is responsible for providing Canadians with the tools to thrive and prosper in the workplace through access to learning and training opportunities, safe and productive working conditions and labour-management relations, as well as for policies, programs and services that support the social well-being of individuals, families and communities, and their participation in society and the economy.
HRSDC's vision is a strong and competitive Canada that enables individuals to make choices that help them live productive and rewarding lives.
To this end, the Department develops policies that make Canada a society in which all can participate and that ensures that individuals can use their talents, skills and resources to benefit the entire country. The Department creates programs and supports initiatives that help Canadians invest in themselves and move through life's transitions - from families with children to seniors, from school to work, from one job to another, from unemployment to employment, and from the workforce to retirement - and delivers citizen-centred service with integrity, commitment and excellence.
Human Resources and Social Development
HRSDC has over 24,000 employees in the National Capital Region and in regional offices across the country, including more than 20,000 assigned to Service Canada.
To deliver on its mandate, HRSDC provides programs and services to millions of Canadians both as citizens and workers. HRSDC provides income support to Canadians through program benefits that Parliament has legislated, such as the Old Age Security program and the full range of benefits from the Canada Pension Plan. In addition, Employment Insurance delivers temporary income support to unemployed Canadians as well as employment programs and services that enable Canadians to prepare for, find and keep employment.
HRSDC promotes lifelong learning by encouraging workplace skills development in Canadian workplaces, and by developing and disseminating data, information, and knowledge about the labour market. The Department also invests in learning by facilitating access to financial assistance for post-secondary education and adult learning opportunities, and promotes learning by supporting programs that address reducing non-financial barriers to adult learning and literacy and early childhood development.
HRSDC's social policies, programs and initiatives help to ensure that children and their families, seniors, people with disabilities, and others facing social challenges have the support, knowledge, and information they need to maintain their well-being and facilitate their participation in society and the workplace. For example, the new Universal Child Care Benefit will provide choice and flexibility to individuals and families in a way that reflects their different needs and circumstances. The Canada Child Tax Benefit will help eligible families with the cost of raising children and the Universal Child Care Benefit will assist Canadian families as they seek to balance work and family life by supporting their child care choices through direct financial support.
HRSDC promotes and sustains stable industrial relations and safe and effective workplaces within the federal labour jurisdiction. The Department also fosters constructive labour-management relationships, carries out labour-related research, and negotiates and implements trade-related international labour agreements.
Ensuring Canadians have the tools they need to participate fully in the knowledge-based economy and labour market requires the active participation of a multitude of partners with the Department acting as a catalyst. Cooperation with provinces and territories is required, given the shared responsibility for many of the Department's programs and policies. HRSDC works closely with its provincial and territorial partners, building on established relationships through multilateral and bilateral forums. Employers and unions have an important role in workplace skills investments. Promoting socio-economic well-being also involves working in partnership with the voluntary sector and not-for-profit organizations, learning partners, community groups, including official language minority communities, and the private sector to develop integrated programs and provide information and services to Canadians. HRSDC works with numerous international partners to learn and share best practices and approaches to maximizing participation of Canadians in economic and social development.
Service Canada
Service Canada provides, a single-window point of contact for citizens to obtain services from the federal government. The initiative builds on what Canadians have told government they want and on the experiences of "best practices" in service excellence in Canada and around the world. The experiences in other jurisdictions demonstrate that the Service Canada model has a proven track record. Service Canada also builds on over a decade of work within the Government of Canada to improve the delivery of services to Canadians.
Service Canada has been delivering a growing number of services and benefits on behalf of federal departments and agencies and providing Canadians with increased choice and access. Today, the Service Canada delivery network brings together 433 points of service in communities throughout Canada; a national 1 800 O-Canada telephone service providing Canadians with information about all federal government services and 23 other networked call centres; and, a range of on-line services at http://www.servicecanada.gc.ca/en/home.html.
Service Canada is partnering with a number of federal departments and agencies to deliver service on their behalf and is identifying further opportunities to partner with other departments and agencies, other levels of government and community partners to strengthen the quality of service for Canadians and the cost-effectiveness of programs and services. Significant progress has been made to improve service experience and will continue, through an expanded in-person service network, an integrated call centre network encompassing a broad range of service, as well as use of on-line applications.
Strategic Outcomes
HRSDC's programs and services are designed to achieve results across a broad range of social and labour market outcomes. Five strategic outcomes form the structure for reporting plans, priorities and resources in this report:
- Policies and programs that meet the human capital and social development needs of Canadians
- Enhanced Canadian productivity and participation through efficient and inclusive labour markets, competitive workplaces and access to learning
- Safe, healthy, fair, stable, cooperative, productive workplaces and effective international labour standards
- Enhanced income security, access to opportunities, and well-being for individuals, families and communities
- Achieve better outcomes for Canadians through service excellence
The following Program Activity Architecture (PAA) diagram is a graphic of the new Department. Modifications to the PAA at the strategic outcome and program activity level are described below. Those that occur at the sub and sub-sub activity level are described in Chapter 2, under each program activity. A summary cross-walk can be found under Other Points of Interest.
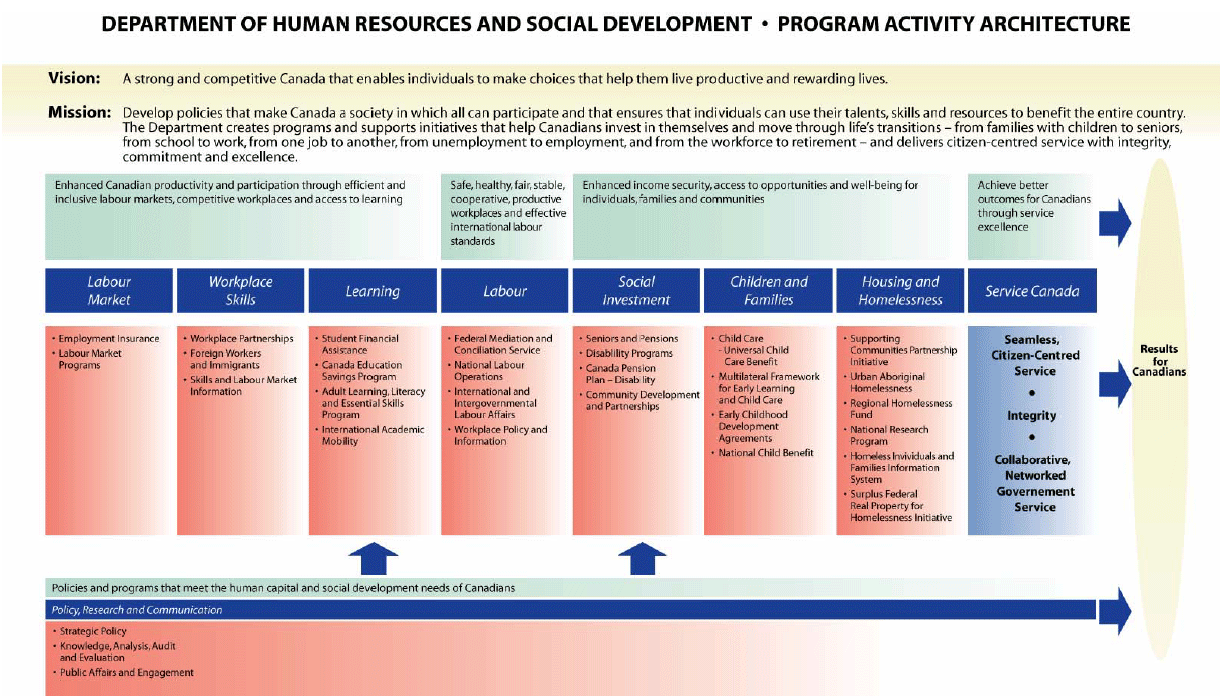
Text version:
| Vision: |
A strong and competitive |
|||||||
| Mission: |
Develop policies that make |
|||||||
|
Enhanced Canadian productivity and participation through efficient and inclusive labour markets, competitive workplaces and access to learning |
Safe, healthy, fair, stable, cooperative, productive workplaces and effective international labour standards |
Enhanced income security, access to opportunities and well-being for individuals, families and communities |
Achieve better outcomes for Canadians through service excellence |
Results for Canadians | ||||
| Labour Market | Workplace Skills | Learning | Labour | Social Investment | Children and Families | Housing and Homelessness | Service Canada | |
|
|
|
|
|
|
|
|
|
|
Policies and programs that meet the human capital and social development needs of Canadians |
||||||||
|
Policy, Research and Communication |
||||||||
|
||||||||
Modifications to the 2005-2006 Program Activity Architecture
Policy and program support functions have been grouped to form the new program activity - Policy, Research and Communication. This program activity supports the achievement of the new strategic outcome: "policies that meet the human capital and social development needs of Canadians".
Three program activities - Labour Market, Workplace Skills and Learning - have been grouped to support achievement of the strategic outcome: "enhanced Canadian productivity and participation through efficient and inclusive labour markets, competitive workplaces and access to learning".
Two former program activities - Employment Insurance Benefits and Employment Programs - have been combined and now form the new program activity - Labour Market.
Three program activities - Social Investment, Children and Families, and Housing and Homelessness - have been grouped and now support achievement of the strategic outcome: "enhanced income security, access to opportunities and well-being for individuals, families and communities".
The former program activity - Social Investments - has been split into two program activities - Social Investment, and Children and Families.
The Service Delivery outcome is now supported by three program activities, reflecting the broader mandate of Service Canada:
- Seamless, Citizen-Centred Service
- Integrity
- Collaborative, Networked Government Service
Mandate
On February 6, 2006, by means of a series of Orders in Council, made pursuant to the Public Service Rearrangement and Transfer of Duties Act, the control and supervision of the federal public administration within Social Development Canada was transferred to the Department of Human Resources and Skills Development. The powers, duties and functions of the Minister of Social Development were transferred to the Minister of Human Resources and Skills Development, and the Minister was styled as Minister of Human Resources and Social Development. This Minister was also made responsible for the Canada Mortgage and Housing Corporation.
Until new departmental legislation comes into force, the Minister will rely on the provisions of the Department of Human Resources and Skills Development Act and the Department of Social Development Act for specific authorities.
The Department of Human Resources and Skills Development Act defines the powers, duties and functions of the Minister of HRSDC, the Minister of Labour, and of the Canada Employment Insurance Commission. The mandate of HRSDC is to improve the standard of living and quality of life of all Canadians by promoting a highly skilled and mobile labour force and an efficient and inclusive labour market. The Minister of HRSDC has overall responsibility for the employment insurance system, while the administration of the Employment Insurance Act is the responsibility of the Canada Employment Insurance Commission.
The Department of Human Resources and Skills Development Act provides for the appointment of a Minister of Labour who is responsible for the Canada Labour Code and the Employment Equity Act, as well as other legislation on wages and working conditions. The departmental statute provides that the Minister of Labour make use of the services and facilities of the Department. The Act also sets out the mandate of the Minister of Labour to promote safe, healthy, fair, stable, cooperative and productive workplaces.
The Department of Social Development Canada Act defines the powers, duties and functions of the Minister of Social Development Canada (SDC). The mandate of SDC is to promote social well-being and security. In exercising the power and performing the duties and functions assigned by this Act, the Minister is responsible for the administration of the Canada Pension Plan, the Old Age Security Act, and the National Council of Welfare, and the Universal Child Care Benefit Act, among other tasks.
Service Canada operates within the legislative mandate and framework of the current departmental legislation (Department of Human Resources and Skills Development Act and the Department of Social Development Act). Its mandate is to work in collaboration with federal departments, other levels of government and community service providers to bring services and benefits together in a single service delivery network. Although Service Canada does not exist as a distinct legal entity, it has delegated authorities to execute its mandate and functions.
Expenditure Profile
Human Resources and Social Development Canada (HRSDC) includes resources of the former Human Resources and Skills Development and the former Social Development departments. This newly created Department has planned expenditures on programs and services of more than $79 billion, of which $75 billion, or almost 95%, directly benefits Canadians through Employment Insurance (EI), the Canada Pension Plan (CPP), Old Age Security (OAS, loans disbursed under the Canada Student Financial Assistance Act and other statutory transfer payments. The Department has planned spending of $1.2 billion in voted grants and contributions; $33.8 billion in statutory grants and contributions; and, $2.1 billion for Employment Insurance Part II.
The financial strategy for Service Canada establishes that statutory funds, including Employment Insurance, CPP, OAS and voted grants and contributions related to the delivery of specified programs will be allocated annually by HRSDC.
2006-2007 Planned Expenditure Profile
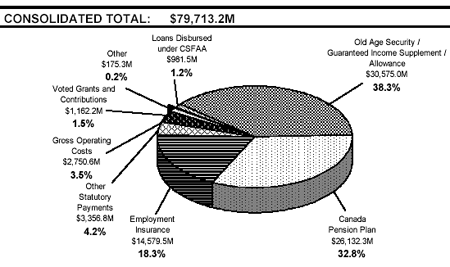
| Budgetary | ||
| Net Operating Costs | 1,014.5 | |
| Add Recoveries in relation to: | ||
| Canada Pension Plan | 246.8 | |
| Employment Insurance Account | 1,411.9 | |
| Workers Compensation | 77.4 | 1,736.1 |
| Gross Operating Costs | 2,750.6 | |
| Voted Grants and Contributions | 1,162.2 | |
| Total Gross Expenditures | 3,912.8 | |
| Other - Workers' Compensation and EI/CPP Charges and Recoveries | 175.3 | |
| Non-Budgetary | ||
| Loans disbursed under Canada Student Financial Assistance Act (CSFAA) | 981.5 | |
| STATUTORY TRANSFER PAYMENTS | ||
| Grants and Contributions: | ||
| Old Age Security programs | 30,575.0 | |
| Other Statutory Payments: | ||
| Canada Student Loans | 399.6 | |
| Canada Education Savings Grant | 575.0 | |
| Canada Learning Bond | 45.0 | |
| Wage Earner Protection Program | 28.7 | |
| Universal Child Care Benefit | 1,610.0 | |
| Child Care - Prov./Terr. Agreements | 650.0 | |
| Others | 0.2 | 3,308.5 |
| Sub-Total | 33,883.5 | |
| Canada Pension Plan benefits | 26,132.3 | |
| Employment Insurance benefits | ||
| Part I | 12,442.0 | |
| Part II | 2,137.5 | 14,579.5 |
| Other Specified Purpose Accounts | 48.3 a | |
| Total Statutory Transfer Payments | 74,643.6 | |
| a. This amount includes payments related to Government Annuities Account and Civil Service Insurance Fund. | ||
The table below reflects the combined planned financial and human resources for the departments of Human Resources and Skills Development and Social Development
| Planned Spending | |||
| 2006-2007 | 2007-2008 | 2008-2009 | |
| Financial Resources (in millions of dollars) | |||
| Operating Expenditures (gross) | 2,750.6 | 2,695.8 | 2,679.8 |
| Non-Statutory Grants and Contributions | 1,162.2 | 1,085.7 | 1,004.6 |
| Statutory Grants and Contributions | 33,883.5 | 35,257.3 | 36,731.0 |
| Total Gross Expenditures | 37,796.3 | 39,038.8 | 40,415.4 |
| Loans disbursed under the Canada Student Financial Assistance Act | 981.5 | 769.1 | 560.8 |
| CPP Benefits | 26,132.3 | 27,496.9 | 28,917.7 |
| EI Part I - Income Benefits | 12,442.0 | 13,058.0 | 13,661.0 |
| EI Part II - Employment Benefits and Support Measures | 2,137.5 | 2,143.1 | 2,143.6 |
| Government Annuities and Civil Service Insurance Payments | 48.3 | 45.4 | 42.7 |
| Total | 79,537.9 | 82,551.3 | 85,741.2 |
| Other Departmental Costs | |||
| EI Doubtful Accounts | 57.0 | 60.0 | 62.0 |
| EI Administration Costs - Other Government Departments | 64.6 | 67.5 | 62.5 |
| CPP Administration Costs - Other Government Departments | 131.1 | 132.8 | 133.9 |
| Workers' Compensation Recoveries | (77.4) | (78.4) | (80.4) |
| Consolidated Total | 79,713.2 | 82,733.2 | 85,919.2 |
| Human Resources | |||
| Full Time Equivalents | 24,274 | 23,661 | 23,513 |
Planning Overview
The Social and Economic Environment
The future of human and social development policies, programs and services in Canada will be influenced by many forces, and there will be many individuals, organizations and governments engaged in helping shape this future. All will need to take stock of at least these factors: globalization, technological change in a knowledge-based society, demographic change, standard of living and quality of life.
Globalization
Today's globalized world influences Canada's economic and social make-up. Growing international trade, emerging economies such as those of China and India, the increasing mobility of goods and individuals, and new communications technology make the world seem smaller than ever, presenting new opportunities and challenges for Canada and its people.
The benefits of globalization include a greater pool of potential customers for Canadian goods and services, as well as more sources for the purchase of goods and services from abroad. On the other hand, globalization also means increased domestic and international competition.
The impact of globalization on the labour market is evident. Although the employment rate has been high in recent years, employment in the manufacturing sector has resumed its long-term downward trend, representing a decreasing share of total employment and shedding nearly 85,000 workers in 2005. In part, this reflects the strong appreciation of the Canadian dollar compared to the American dollar in the past few years, and the influence of developing economies. On the other hand, capital investments in the production and export of energy, mostly in oil sands extraction, as well as investments made in preparation for the 2010 Olympic and Paralympic Winter Games in Vancouver, are contributing to net job growth and strong labour markets in the Western provinces.
Large-scale changes affect communities that strongly depend on traditional employers or industries. Locally-based enterprises are being pressed to respond to globalization pressures by changing the way they operate.
Overall, however, Canada is expected to remain in good socio-economic health in the coming years. A strong labour market, low unemployment rate, good social capital, and sustainable institutions (e.g., families, schools) are all increasingly becoming linked to our relationship with other countries that provide the impetus for the labour market, Canadian families, and sometimes whole communities to adjust.
Technological Change and the Knowledge-Based Society
Technological change continues to transform the way Canadians live and work.The knowledge-based economy has direct consequences on the skills and knowledge required of Canadians, and on their engagement in lifelong learning.
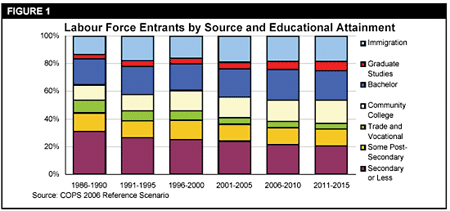
Striking a balance between the skills that youth and immigrants bring to the labour market and the future requirements of employers is essential. About two thirds of new jobs that will become available in Canada over the next ten years will be in management or require some form of post-secondary education. This gradual increase in skills requirements will be generally matched by an increase in the educational attainments of potential workers, since about two thirds of new labour force entrants will have trade certificates, college diplomas or university degrees (Figure 1).
To meet labour market demand for skilled workers and to compensate for the emigration of skilled workers to other countries, improvement in the integration of workers with degrees and diplomas from abroad is required. Recent studies suggest that a 1 percent increase in adult literacy scores would be expected over time to generate a 2.5 percent overall rise in labour productivity and a 1.5 percent rise in per capita GDP. This argues strongly in favour of more substantial efforts to encourage adult learning, including literacy and learning.1
Advancements in information and communication technology have provided industry and government with a medium for innovation in service delivery. Intelligent use of the Internet and information technologies can streamline costs and enhance the way government serves Canadians.
Although technology has the potential to advance social and economic objectives, this can only be achieved through the collaboration of all stakeholders - individuals, governments, community organizations and industry. Access to the internet must also be considered.
Demographic Change
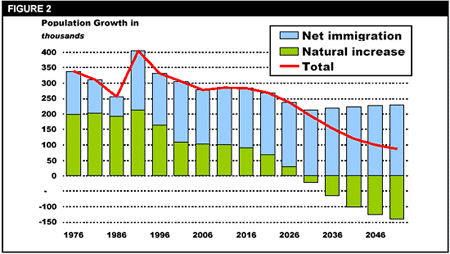
Canada's demographic profile will be heavily influenced by low fertility rates and increasing life expectancy. Population growth in Canada has slowed in recent years and the trend is likely to continue in the foreseeable future (Figure 2).
Canada's population growth is increasingly dependent upon immigration. Between 1991 and 2001, an average of 220,000 persons immigrated to Canada annually. Visible minorities now make up 13.4 percent of the population, and projections are that this will increase to 20 percent by 2017.2 Many immigrants are foreign-trained workers, who are coming from a wider and changing range of countries.
The increase in Canada's natural population (the number of births less deaths) continues to decline, and immigration, which has now become the main source of population growth, will not be sufficient to reverse this trend to meet future labour market needs.
In the past, the economy has benefited greatly from an expanding labour force and continuous increases in the employment rate. In the absence of these factors, Canada will have to rely increasingly on labour productivity growth to raise its standard of living. This trend will be exacerbated by the impending retirement of the baby boom generation. Seniors constitute the fastest-growing age cohort in Canada; the percentage of the population over 65 is projected to rise from 13 percent in 2005 to nearly 24 percent in 2031.3 While there are signs that Canada will adapt to increased pressures on its health system and public pensions, one challenge that may remain is how to foster greater participation and inclusion of seniors in their communities.
Other demographic trends involve the Aboriginal community and the changing nature of Canadian families. In 2001, there were just over one million Aboriginal people in Canada, comprising 3.4 percent of the population. The fertility rate of Aboriginal people is about 1.5 times greater than that of the general population. By 2017, the national proportion of Aboriginal people will increase slightly to 4.1 percent.
Over the past 45 years, family composition has evolved to include new definitions of association, including a greater-than-ever number of non-marital partnerships (Table 1). People are more likely to separate or divorce now than in the past. Fertility rates have dropped, child birth is being delayed until mothers are older, and more children today are born to unmarried parents. More children and adults than ever belong to lone-parent or blended families.
| 1961 | 1981 | 1991 | 2002 | |
| Total fertility rate (average births per woman) | 3.8 | 1.7 | 1.7 | 1.5 |
| Median age at first marriage | ||||
| Brides | 21.1 | 22.5 | 25.1 | 27.0 |
| Grooms | 24.0 | 24.6 | 27.0 | 29.0 |
| Divorces per 100,000 married couples | 180 | 1180 | 1235 | 1050 |
| Common-law couples as percentage of all couples | - | 6.4 | 11.2 | 16.4 |
| Percentage of children born outside of marriage | 4.5 | 16.7 | 28.6 | 36.6 |
| Births to women aged 30+ as percentage of all births | 34.1 | 23.6 | 36.0 | 47.4 |
| Lone-parent families as percentage of all families with children | 11.4 | 16.6 | 20.0 | 25.0 |
| Source: Beaujot, R., and Kerr, D. (2004). Population Change in Canada. Toronto: Oxford University Press. | ||||
Standard of Living
Overall, Canada's economic, labour market and social environments are healthy and prospects for the coming years are positive. Canada ranked fourth out of 177 countries in the 2004 United Nations Human Development Index, a broad measure that includes several social and economic outcomes. Gross Domestic Product (GDP) per capita ranked in the top tier of the Organization for Economic Co-operation and Development (OECD) countries (2004), employment growth since 2000 has outpaced that of Canada's G-7 partners, and Canada has one of the most educated populations in the world. Canada's strong economic and labour market performance has increased the level of income of Canadians and decreased rates of low income.
Since the mid-1990s, Canada has experienced vigorous economic growth and the gains Canadians have made in their standard of living have come in no small part from an increased employment rate. In 2005, Canada saw employment grow by nearly 223,000, keeping the employment rate (the share of the population 15 years of age or over that is working) at 62.7 percent, the highest level on record. As a result, there has been an increase since the mid-1990s in the proportion of total population employed; in 2005, half the population was employed.
In addition, GDP increased by 2.9 percent in 2005 in real terms, at the same rate as in 2004, and a similar increase is expected in 2006 and 2007.4 Canada's labour market is expected to continue to do well in coming years, and the unemployment rate is likely to keep declining. Conversely, labour productivity growth in the Canadian business sector has slowed considerably since 2000, coming to a halt in 2003 - 2004 before rebounding slightly to about one percent in 2005. The Bank of Canada estimates that it will soon return to near its trend growth rate of 1.7 percent annually.5
Recent years have witnessed continued improvements in the income of Canadians. Median after-tax income rose for most Canadian families in 2004, as strong economic growth fostered gains in employment, which in turn boosted labour market income. Canadian families with two or more members had a median income after tax of $54,100, an increase of approximately 2 percent over 2003, after adjusting for inflation. The increase in after-tax income was not shared by all family types. Among "elderly" families, median after-tax income remained virtually unchanged as it also did for "unattached individuals" or single people.
Quality of Life
Quality of life relates to the well-being of individuals, within their families and within their communities. It covers more than material well-being and extends to the social, civic and cultural realms. Overall, Canada has maintained an international reputation for maintaining a high quality of life for its citizens.
Nevertheless, an estimated 684,000 Canadian families were living in low-income households in 2004 - 7.8 percent of total families, down from 8.5 percent in 2003. In spite of the overall improvements in income levels, five groups of Canadians remain at higher risk of experiencing low income, in large part because they often face long and/or frequent spells of unemployment and low-paid work, and tend to have lower education and skill levels. They are:
- lone parents with at least one child under the age of 18
- unattached people aged 45 to 64
- recent immigrants
- Aboriginal people
- people with a physical or mental disability
Among these low-income households, an estimated 865,000 children aged 17 and under, or 12.8 percent of all children, were living in low-income families in 2004. The rate was well below the peak of 18.6 percent in 1996, but up slightly from the low of 12.1 percent in 2001.
Assisting Canadians to find and keep work means providing continued support and skills development. This is key to reducing the risk of low income. Looking ahead, however, Canada's strong economic and labour market performance in 2005 and the positive prospects for the coming years will likely translate into further real income gains for these groups.
Quality of life extends beyond the possession of employment and a liveable income, to include general health, appropriate housing, education a nd learning opportunities, community and social support networks, career development, work-life balance, a sense of belonging and life satisfaction.
For many working families, work-life balance remains a challenge. In 2003, 64.8 percent of families had dual-incomes. By 2005, 67.2 percent of women with children under the age of six were employed. Many lone working mothers find it especially challenging to work and care for their children. The responsibilities surrounding the care of senior family members, which are most often assumed by women, are creating further pressure. These pressures can affect the health and well-being of family members. Along with changes in family structure, they may lead to a greater demand for family-friendly work practices, such as worksite daycare services, and flexible working arrangements.
Quality of life indicators reveal that communities are changing due to increased urbanization and regional migration from east to west. Furthermore, indicators measured across 20 Canadian communities suggest an increased risk of homelessness in Canadian communities, possibly due to decreased vacancy rates in rental housing and record-level housing starts, targeted at the homeownership market. Among those in need of affordable housing, over two thirds are renters.6
Despite these challenges, Canada has a long history of voluntary action within local communities. Canada's thriving civil society is demonstrated by a fairly large and diverse non-profit sector. In 2003, an estimated 161,000 non-profit and voluntary organizations operated in Canada, including daycare centres, sports clubs, arts organizations, private schools, hospitals and food banks. Organizations that are part of the community non-profit and private sectors are key vehicles for well-being and civic participation.
Canada's Socio-Economic Future
Canadians' ability to attain their full potential will continue to be challenged by variables such as education, income level, employability and community capacity. Capitalizing on the opportunities offered by globalization, the knowledge-based economy and changing demographics will require innovative policy-making, collaboration with various partners and a commitment to achieving real results for Canadians.
The following table presents a list of the key contextual indicators that are of interest to HRSDC. These indicators form the basis of the demographic and economic environmental analysis presented above. More details on contextual indicators and the overall indicators framework are shown in the section Performance Measurement Framework.
| INDICATOR | LEVEL | |
| Net population growth, by source | (July 2004 to July 2005) | |
| Total | 0.93% | |
| Natural increase | 0.32% | |
| Net migration | 0.60% | |
| Population dependency rates, by age group | (July 2005) | |
| 19 years or less | 24.3% | |
| 65 years or over | 13.1% | |
| Total | 37.3% | |
| Real GDP per capita (1997 dollars) | $35,900 (annual average 2005) | |
| Participation rate | By age group (2005) | |
| 15 years or over | 67.2% | |
| 15 - 24 years | 65.9% | |
| 25 - 54 years | 86.3% | |
| 55 years or over | 31.5% | |
| Unemployment rate | By age group (2005) | |
| 15 years or over | 6.8% | |
| 15 - 24 years | 12.4% | |
| 25 - 54 years | 5.8% | |
| 55 years or over | 5.1% | |
| Hourly earnings, by education level | Annual average (2005) | |
| Overall | $20.90 | |
| Less than high school diploma | $15.70 | |
| High school diploma or incomplete postsecondary studies | $18.30 | |
| Post-secondary certificate or diploma | $20.50 | |
| University degree | $26.70 | |
| Proportion of the 20-24 year-old and 25-64 year-old population with a high school diploma | (2001) | |
| 20-24 | 75.0% | |
| 25-64 | 65.6% | |
| Proportion of working-age Canadians (16-65) with Level 2 literacy or below | (2003) | 42% |
| The unionization rate defined as the proportion of non-agricultural workers who are covered by a collective agreement (national) | (2005) | 32.2% |
| Incidence of low income - number and percentage of Canadians living with low income (post-tax LICOs) | (2004) | |
| All persons | 11.2% | |
| Under 18 years | 12.8% | |
| 18-64 years | 11.7% | |
| 65 years or over | 5.6% | |
| Proportion of low-income households in census metropolitan areas living in low-income neighbourhoods | (2000) | 11.9% |
| Core housing need | (2001) | 13.7% |
Policy Environment
Introduction
Traditionally, social and economic policies were regarded as pulling in opposing directions. Economic policies were thought to increase prosperity through productivity increases, while social policies focused on redistributing wealth. As such, efficiency and equity were seen to be tradeoffs. This older model of economic growth has been replaced by a newer and more dynamic understanding of how economic and social strategies are mutually reinforcing. Countries where opportunity is more equally distributed tend to grow faster. These countries are also more resilient and adaptable to economic shocks. Societies that sustain their economic growth do so by focusing their policies upon productivity, skills and learning, an efficient labour market and strong social foundations.
Thus, Canada's success at home and internationally is increasingly dependent upon our ability to sustain and improve well-being through economic and social development. If Canada is to reach its potential in the evolving global economy, its policies and programs will need to be guided by recognition that the development of human capital is an important determinant of social and economic opportunity over the life-course of individuals. Canada will also need to rely increasingly on its communities, institutions and networks to identify challenges and opportunities, as well as to develop their own innovative solutions to social and labour market problems.
Investments
Investments in the labour market and in social development can drive long-term economic growth. Such investments expand the capabilities and the range of opportunities for everyone, from early childhood through the entire life-course. They are thus a key to overcoming the entrenchment of disadvantage and exclusion.
Historical concerns about unemployment and inadequate wages and benefits have been the focus of labour market policies. On the learning side, emphasis has been on increasing post-secondary education attainment rates to support economic and social prosperity. However, over the medium term, labour markets will tighten. The challenge will be to find ways to increase the pool of skilled labour and to match it more effectively with unmet demand in key sectors and regions.
Tightening labour markets offer new possibilities for facilitating business and employer interest in tapping into new labour sources such as under-represented groups and investing in the re-skilling of workers. The tight labour market also increases the importance of investing in adult learning and literacy and promoting access to and encouraging saving for post-secondary education. The international experience of economies with advanced aging profiles (e.g. Japan) and that have experienced extreme labour market tightening due to demand growth (e.g., United States) demonstrates that national economic growth connects with individual goals related to employment, inclusion, and financial security.
Social development also provides economic returns. It assists people in acquiring the tools to successfully manage transitions and challenges in their lives. Its focus on prevention and integrated solutions creates efficiencies and reduces costly remedial interventions.
Beyond the rewards of economic prosperity for Canada as a whole, these investments provide a pathway to social development through the increase of individual capital. The Department has the potential to contribute further to this objective in many ways, such as investing in families and children, building on Canada's "knowledge" infrastructure by developing timely and relevant data, information, research, and other evidence to support decision-making over the life-course, working with employers and labour to modernize federal labour standards, investing in communities and working with partners to alleviate homelessness.
Social and Economic Challenges
Enabling Canadians to seize the opportunity of the future will require some dramatic shifts in our policies, programs and partnerships. Moreover, Canada's position in the global market-place and the well-being of Canadians will also depend upon our ability to respond quickly and creatively to the following challenges:
- Participation and inclusion
- Balancing earning and care
- Low income
- Literacy levels
- Supports for adult learners
- Skills gap and skills under-utilization
- Limited community capacity
- Demographic change, including the aging population and declining birth rate
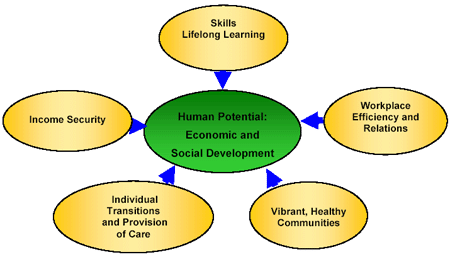
The Department's policy challenge is to play an effective role in enhancing human potential in Canada through economic and social development.
Policies must achieve tangible results for Canadians, including real growth in the standard of living, and improved economic and social outcomes for individuals and families.
Policy Context
HRSDC integrates labour market, learning and social policies to guide departmental approaches that promote sustainable social and economic outcomes for all. Further exploration of regional and sectoral approaches to address challenges will be a key element.
As no one government working alone could achieve goals in all these priority areas, partnerships are essential to success. Today's policy environment demands improved understanding, as well as more effective partnerships, with provinces, territories, international partners, employers, the community nonprofit sector, social partners, labour and other key stakeholders such as educational institutions. Working with other governments is particularly important in areas of shared jurisdiction or mutual interest. HRSDC fosters these relationships through a number of established federal/provincial/territorial forums, working arrangements and bilateral contacts.
As the Department moves forward, it must also respond to Canadians' expectations for the highest level of service, accountability and transparency. Effective accountability and reporting continues to be one of the founding principles for these relationships and for achievement of policy results. Policies and programs must be designed and implemented in ways that achieve tangible results for Canadians. These policies must learn from and adapt international best practices and approaches if Canada's economic and social development is to be sustainable.
Overarching goals:
- Foster participation in the labour market, lifelong learning and society by increasing choice and flexibility, and by supporting decision-making through the development and availability of quality knowledge and information to ensure all Canadians have the opportunity to contribute to, and benefit from, economic and social development.
- Address economic security through measures to: support Canadians in low-income situations in achieving income security; address child poverty and its long-term impacts on social development; address multiple risks and barriers among vulnerable groups at risk of exclusion, including the most marginalized such as disabled and homeless people.
- Balance earning and caring responsibilities of Canadians through policies that support work-life balance, including flexibility of choice in child care, and a comprehensive response to the needs of caregivers.
- Improve skills, including literacy and essential skills, and promote lifelong learning so that Canadians can acquire and continuously develop the skills to meet demand in growing market sectors.
- Support community-based efforts to improve the lives of Canadians by assisting communities, institutions and networks to identify their particular needs and challenges. Develop policy and work in partnership to develop innovative solutions to social problems, such as new tools for achieving self-sufficiency.
- Provide leadership in ensuring worker-management relations are conducive to safe, productive and cooperative workplaces.
The Department participates in a number of international forums and works with international partners on a variety of issues through policy discussions, formal agreements, research and technical cooperation with developing countries. HRSDC ensures that Canada's interests are represented internationally. For example, consistent with its domestic focus to better reflect departmental interest, the Department also participates in international forums such as the Organization for Economic Co-operation and Development (OECD) and the G8 countries on international employment, and learning policy directives, research and knowledge exchange. The outcome of this work feeds into policy development in Canada to ensure that Canada's employment, social and learning policies provide a competitive environment, which makes our labour force attractive to foreign investors.
This year, the OECD launched a new job strategy which will influence labour market and skills development policies for the next ten years in most developed countries. HRSDC hosted the OECD Summit on the New Job Strategy in Toronto in June 2006. HRSDC will continue to work closely with the OECD to ensure that the New Job Strategy becomes a useful tool to assist HRSDC in meeting the human capital challenges of the coming years.
The full and equal participation of women in the labour market and in society remains an important dimension of the renewed focus on human capital. In compliance with Canada's domestic and international commitments, the Department carries out analyses and activities to ensure that policy and program development, implementation and evaluation are designed to support gender equality. Canada must also take into account its domestic and international commitments on broad human rights issues in developing its policies and programs, as well as actively engage other government departments on these issues.
Management Environment
Governmental Context
One of the Government's top priorities is the Federal Accountability Act. On April 11, 2006, the Government introduced Bill C-2 entitled the Federal Accountability Act and published a related Action Plan on measures to strengthen accountability and increase transparency and oversight in government operations. The Act is intended to ensure that the Government of Canada meets, in all of its roles, the highest standards of integrity, effectiveness and accountability. It is currently in Senate review.
Sound management is a cornerstone of effective and accountable government. The Management Accountability Framework establishes the standards for management in the Government of Canada and is the basis for management accountability between departments, the Treasury Board Secretariat and the Public Service Human Resources Management Agency. It is a framework of accountability for deputy heads to ensure that the conditions for good management are put in place to achieve results for Canadians. The Framework consists of 10 essential elements of sound management, accompanied by a series of indicators and associated measures that establish clear expectations and allow departments to monitor performance.
Departmental Context
The Department's financial arrangements include statutory programs, grants and contributions, operating expenditures, program agreements with provinces and territories and statutory transfer payments. The Department has three major sources of funds - the Consolidated Revenue Fund (resources that are annually voted by Parliament and funding for statutory programs), the Employment Insurance Account and the Canada Pension Plan.
Moreover, the Department must manage a wide field of research, policy, program development and service delivery and a broad scope of responsibilities in the areas of social development, labour market development, work relations, learning, income security and other areas.
As well, the Department increasingly must manage in the context of shared outcomes and partnerships with provinces/territories, the private sector, communities, labour, Aboriginal peoples and other partners.
Service Context
Canadians expect timely and convenient service. Around the world, citizen satisfaction and overall confidence in government's ability to deliver improved services is a key pursuit. According to the 2006 Accenture survey "Leadership in Customer Service: Building the Trust", Canada is at the leading edge of the trend to offer citizen-centered services and transform service delivery. The vast majority of Canadians support the idea of accessing a majority of Government of Canada services through a single federal agency and most believe that this approach would improve service.
Parliamentary Context
HRSDC must work effectively with parliamentary oversight bodies such as parliamentary standing committees, the Office of the Auditor General, the Commissioner of the Environment and Sustainable Development, the Privacy Commissioner, the Information Commissioner and the Public Service Commission. In addition, oversight is provided within government by the Treasury Board Secretariat, the Comptroller General and the Public Service Human Resources Management Agency.
Reports that were released by the Auditor General and parliamentary committees and that have recommendations of particular importance to HRSDC management include:
- Report of the Standing Committee on Human Resources, Skills Development, Social Development and the Status of Persons with Disabilities - Study on Employment Insurance Funds, 2005 http://cmte.parl.gc.ca/cmte/CommitteePublication.aspx?COM=8982&Lang=1&SourceId=100965
- Report of the Standing Committee on Human Resources, Skills Development, Social Development and the Status of Persons with Disabilities - Study on the Summer Career Placements Program, 2005 http://cmte.parl.gc.ca/cmte/CommitteePublication.aspx?COM=8982&Lang=1&SourceId=136509
- Report of the Standing Committee on Human Resources, Skills Development, Social Development and the Status of Persons with Disabilities - The Report on Issues Related to Accessibility for Persons with Disabilities within the Parliamentary Precinct and the Federal Public Service, 2005 http://cmte.parl.gc.ca/cmte/CommitteePublication.aspx?COM=8982&Lang=1&SourceId=121676
- Auditor General of Canada Report 2005, Chapter 4, Managing Horizontal Initiatives http://www.oag-bvg.gc.ca/domino/reports.nsf/html/20051104ce.html
- Auditor General of Canada Report 2006, Chapter 6, Management of Voted Grants and Contributions http://www.oag-bvg.gc.ca/domino/reports.nsf/html/20060506ce.html
Corporate Risks
Setting the Context
The analysis of environmental scans and risk information collected at both the corporate and the program activity levels has resulted in the identification of three key risks and related challenges the Department faces in achieving its objectives and commitments for 2006-2007. The key risk areas are:
- building relationships with external partners and stakeholders
- recruiting and retaining competent and skilled people
- exercising appropriate governance and oversight
The risk information below presents a snap-shot of the most significant risks the Department is facing during the 2006-2007 planning exercise. The key risks and the Department's capacity to manage them were assessed to inform the setting of priorities identified in this report.
Building relationships with our external partners and stakeholders
At risk is the ability to engage in and build the right relationships with external partners and stakeholders to ensure timely progress in the social and economic agenda and delivery on commitments.
The Department faces the challenge of developing effective partnerships to achieve goals for enhancing income security, working with communities, and advancing a skills and lifelong learning policy agenda. This involves many areas of shared responsibility, where the Government of Canada, provincial and territorial governments, Aboriginal peoples, other communities and private sectors all play a role. As mentioned in the Policy Environment Section, partnerships are key to our ongoing success in achieving departmental social and economic outcomes. The complexity of multi-level governance relationships and the increased expectations of stakeholders to play a strategic role in decision-making may affect our ability to ensure timely progress in developing effective policies.
To manage this risk, in addition to continuing close ties with traditional, national stakeholder groups and experts, the Department has been developing federal/provincial/territorial and stakeholder engagement strategies to support knowledge exchange, longer-term collaborative agendas and emerging possibilities for multi-level governance and new partnerships. It will also continue to capitalize on links with other federal departments to effectively engage partners. The priorities and program activities described in this report demonstrate actions to support and enhance partnership-based initiatives to achieve our objectives and strategic outcomes.
Recruiting and retaining competent and skilled people
At risk is the capacity to attract competent and skilled people, and retain and develop them, which may hinder the ability to deliver on commitments and to exercise due diligence.
One of the significant challenges for 2006-2007 is building and strengthening the Department's human resources capacity. HRSDC recognizes that good management and strong organizational performance depend on the capacity of its workforce. The Department is committed to being a leader in change and innovation by enhancing the knowledge and skills of its workforce, while ensuring high-quality policies, programs and services.
There are shortages of skilled and experienced people in several specialized professional communities such as human resources, finance and internal audit and in specific program expertise, as in industrial relations and occupational health and safety. These shortages intensify the challenge of recruiting and retaining highly qualified people.
This challenge is made more complex by the February 2006 reunification of the Department. In the early stages of integration, the uncertainty about roles and responsibilities and organizational change are leading to additional stress and change fatigue. This may affect HRSDC's ability to attract and retain competent people.
To mitigate these risks, considerable work is underway to strengthen human resources management. A department-wide learning strategy, currently being developed, will guide the continued implementation of the Public Service Modernization Act. New integrated business and human resources planning, the identification of optimal strategies for human resources management, and integrated learning and training opportunities for employees are key elements of the strategy.
In addition, the development of a clear vision and mission statement for the Department, involving all employees, is underway. This exercise will help HRSDC better define its role and bring clarity to its mandate. The change brought about by the integration of Human Resources and Skills Development Canada, Social Development Canada, and Service Canada will be guided by a transformation plan that will focus on ongoing and effective organizational and cultural change.
Exercising appropriate governance and oversight
At risk is the ability to exercise appropriate governance and oversight on the stewardship of resources and the state of internal controls within an environment of major organizational changes and evolving accountability relationships.
In the context of high expectations for improved accountability for government programs and services, the Department must continue to manage the challenges associated with an appropriate governance and oversight regime. Expectations include providing improved results-based performance information and assurance on risk management, the state of internal controls, and governance processes. As the Department continues to implement a governance framework to structure the relationship with Service Canada, it is also expected to fulfill the requirements of the new Treasury Board Internal Audit Policy and move towards a Chief Financial Officer model that strengthens financial management. These new requirements may affect our ability to meet all expectations and compliance requirements within the Department and at the government level.
Several strategies will help manage this risk. Strengthening the links among policy development and program design, research and knowledge, program evaluation results, and results-based management approaches will ultimately yield improved outcome measures and results for Canadians. The assessment of the Financial Control Framework and Comptroller's Office capacity for financial oversight will guide the development of strategies designed to manage financial risks. A departmental review of grants and contributions will develop recommendations to increase flexibility in program delivery while maintaining the integrity of grants and contributions programs and activities. Program integrity, clear accountability and effective financial management will continue to be areas of increased attention for senior management.
Conclusion
Improving HRSDC's ability to handle risks and uncertainties is important in the development of effective policies and improved service delivery. As well, the Department continues to strengthen the practice of integrated risk management to effectively manage ongoing strategic and operational risks in delivering services within or through partnerships with other public and private-sector organizations. In pursuit of excellence, risk management, including the monitoring of mitigation strategies, remains a priority for the Department.
Departmental Priorities and Performance Measurement Framework
Departmental Priorities
HRSDC has identified priorities for 2006-2007 based on an assessment of its mandate, as part of the broader Government of Canada objectives, and the environment in which the Department is operating.
An Opportunity for HRSDC to Implement Key Governmental Priorities
The Speech from the Throne and Budget 2006 set the Government's agenda and reiterated its five main priorities. Among those priorities, the Government confirmed its commitment to providing choices for child care in Canada.
Budget 2006 included details of the Universal Child Care Benefit, which provides Canadian families with $1,200 per year for each child under six years of age. All families with young children benefit, regardless of income and the type of child care they choose.
In Budget 2006, the Government also committed to creating new child care spaces. HRSDC will be consulting with provinces and territories, employers, community non-profit organizations, parents and Canadians to help inform the design of the Child Care Spaces Initiative.
In addition to Canada's Universal Child Care Plan, Budget 2006 addressed key governmental commitments of importance to HRSDC, such as workplace skills and lifelong learning. The Department was allocated $18 million over two years to create the Canadian Agency for Assessment and Recognition of Foreign Credentials. Regarding apprenticeship, HRSDC will be moving forward with implementing an Apprenticeship Incentive Grant. Budget 2006 also committed to decrease parental contributions to the Canada Student Loans Program, introduce a Textbook Tax Credit, and eliminate taxation of Scholarships and Bursaries. Other Government commitments pertaining to HRSDC announced in Budget 2006 include: programs aimed at youth crime prevention; and a feasibility study exploring options for addressing challenges related to older workers' employment and participation in the labour market.
HRSDC priorities for 2006-2007 are summarized in the following tables.
The achievement of its strategic outcomes does not rest solely with the Department
Without partners, the Department alone cannot reach its goals. Success can happen only with the active participation of many players. Ensuring Canadians have access to tools to participate fully in the labour market and society requires the active participation of a multitude of partners with the Department acting as a catalyst.
HRSDC works closely with provincial and territorial partners, Aboriginal Peoples, not-for-profit and community-based volunteer organizations, and with Canadians, building on established relationships bilaterally and through multilateral forums to achieve its commitments. Employers and unions play an important role in the establishment of workplace-based training and learning and also in the establishment of safe, stable and productive workplaces. Finally, individuals and the choices they make will be critical to the achievement of the Department's goals.
| POLICIES AND PROGRAMS THAT MEET THE HUMAN CAPITAL AND SOCIAL DEVELOPMENT NEEDS OF CANADIANS | |
| POLICY, RESEARCH AND COMMUNICATION |
|
| ENHANCED CANADIAN PRODUCTIVITY AND PARTICIPATION THROUGH EFFICIENT AND INCLUSIVE LABOUR MARKETS, COMPETITIVE WORKPLACES AND ACCESS TO LEARNING | |
| LABOUR MARKET |
|
| WORKPLACE SKILLS |
|
| LEARNING |
|
| SAFE, HEALTHY, FAIR, STABLE, COOPERATIVE, PRODUCTIVE WORKPLACES AND EFFECTIVE INTERNATIONAL LABOUR STANDARDS | |
| LABOUR |
|
| ENHANCED INCOME SECURITY, ACCESS TO OPPORTUNITIES AND WELL-BEING FOR INDIVIDUALS, FAMILIES AND COMMUNITIES | |
| SOCIAL INVESTMENT |
|
| CHILDREN AND FAMILIES |
|
| HOUSING AND HOMELESSNESS |
|
| ACHIEVE BETTER OUTCOMES FOR CANADIANS THROUGH SERVICE EXCELLENCE | |
| SEAMLESS, CITIZEN-CENTERED SERVICE |
|
| INTEGRITY |
|
| COLLABORATIVE, NETWORKED GOVERNMENT SERVICE |
|
With the introduction of the Federal Accountability Act, the Department is committed to strengthening accountability
Being accountable is important to the new government and to the Department. Through the Federal Accountability Act and Action Plan, the Government of Canada is bringing forward specific measures to help strengthen accountability and increase transparency and oversight (http://www.accountability.gc.ca/). HRSDC's commitment to the act will focus specifically on strengthening the auditing and accountability functions, and on the review of grants and contributions.
Other HRSDC internal priorities for the planning period that will strengthen accountability, as well as increase transparency and oversight, focus generally on the improvement of good governance, financial stewardship and human resources management.
| GOVERNANCE AND EFFECTIVE MANAGEMENT |
|
| FINANCIAL STEWARDSHIP |
|
| HUMAN RESOURCES MANAGEMENT |
|
Corporate services play a critical role in the achievement of HRSDC priorities and outcomes
Corporate services play a critical role in the achievement of strategic priorities and outcomes, and ensure that the expectations of Canadians and Parliament are met. HRSDC's corporate services, including human resources, ministerial services, comptroller, legal services, systems and corporate management all have priorities that are integrated into the Department's overall strategic outcomes, and make a critical contribution to the capacity to deliver on HRSDC's mandate.
Key to the Department is the commitment to providing excellence in ministerial correspondence and parliamentary services, and services to the offices of the Ministers, the Parliamentary Secretary and Deputy Ministers. Included here is support for key priorities that were outlined in Budget 2006 such as: the Universal Child Care Plan; the Child Care Spaces Initiatives; Apprenticeship initiatives; the Canadian Agency for Assessment and Recognition of Foreign Credentials; and post-secondary education and learning initiatives.
HRSDC's ongoing commitment is to ensure a fair, enabling, healthy and safe workplace. With the implementation of the Public Service Modernization Act, the Department's objective will be to continue communication, learning and support for managers, staff and employees. HRSDC supports managers at all levels in the Department in meeting their delegated responsibilities under public service modernization, and their responsibilities and accountabilities as described in the Management Accountability Framework.
Corporate services will have a key role in supporting departmental integration through the provision of effective management and strategies in areas such as human resources, information technology and management, and administrative services.
Departmental decision-making processes will continue to be enhanced and improved. Through the effective integration of elements such as strategic planning and performance management, corporate and business planning, resource allocation, human resources planning, financial and systems planning, performance measurement, audit and risk management and evaluation, managers are able to make the best choices in using resources, and in supporting overall efforts to improve the management of spending across the government.
Through excellence in management practices, learning tools and training, HRSDC will develop an organization of leaders and the capacity to ensure a skilled workforce. The Department will continue to promote the use of both official languages in the workplace, and will work to achieve departmental workforce diversity objectives by implementing a diversity strategy.
Through the implementation of the new public service learning policy and targeted development programs for specialized professional communities, HRSDC will continue to ensure a workforce that is productive and principled, and one that supports the policy capacity of the Department.
HRSDC will develop and implement a client-focused business delivery model for human resources. The model will ensure a comprehensive approach to all aspects of human resources management, service delivery and accountability, and will support the achievement of departmental strategic outcomes. In addition, human resources planning will be fully linked with business planning, using integration tools that have been developed to provide support to strategic planners, human resources and managers. These strategies will enable managers and staff to adapt more readily to program and organizational changes, including the integration of HRSDC.
HRSDC's workplace will support employees by developing initiatives designed to foster leadership and learning, and to provide a creative environment. This work will include the development of employee generated proposals under the Creativity Fund, and the completion of a Place Vanier Child Care Centre assessment.
Finally, HRSDC will be working to finalize governance structures with Service Canada for the provision of transactional services in human resources, information technology and administration. A key piece of this work will be the development of schedules for services in each of these areas. These agreements themselves will be governed by tables that will effectively delineate ongoing operations, responsibilities and accountabilities for multiple service areas. The development of strong relationships will help ensure that shared transactional services meet HRSDC's departmental needs, and support the achievement of the Department's strategic outcomes.
Performance Measurement Framework
HRSDC is committed to measuring its performance, managing for results and reporting on its progress. To accomplish this, HRSDC has established a performance measurement framework that allows the Department to understand its operating environment, define clear performance expectations, track progress through measures, and make any required adjustments. The performance measurement framework provides Parliament and Canadians with information to assess the Department's progress in achieving results.
The framework sets out three types of indicators: contextual indicators, strategic outcome indicators and program indicators.
Contextual indicators depict the environment in which the Department operates by describing broad trends in society, the economy and labour markets - such as population growth and gross domestic product per capita. Contextual indicators guide policy development and departmental plans and priorities by allowing the Department to assess the continued relevance of programs and the requirement for new programs.
Strategic outcome indicators reflect the ultimate results that the Department is striving to influence over the medium-to-longer term. It is important to note that while the strategic outcomes are within HRSDC's sphere of influence, the Department is not the sole contributor to their attainment. Other orders of government, other federal departments, key stakeholders and partners, as well as individual Canadians make important contributions. For example, the percentage of the adult workforce that participates in job-related training is not due solely to the influence of the workplace skills programs, but is also affected by the decisions of individual employers and employees, their associations and other orders of government.
Program indicators relate more directly to the programs that the Department delivers. These indicators facilitate the setting of targets or objectives for the Department's programs and the monitoring of results. Most of these indicators are measures over which the Department exercises substantial control. Program indicators can be operational in nature and related to the outputs produced by the Department, and include client satisfaction, and program access and reach, as well as measures of the impacts or results achieved by the program.
Positive change in program indicators should be interpreted as a necessary, but not sufficient, condition to achieve improvement in strategic outcomes. Indeed, the Department recognizes that performance indicators are only part of a comprehensive performance measurement framework. Periodic, in-depth program evaluations also provide an important source of information on the effectiveness of HRSDC programs.
HRSDC will continue to work on strengthening performance indicators, drawing on evaluation and research results. Through its ongoing program evaluation and systematic review, the Department will assess the relevance and validity of the performance indicators as they relate to the achievement of expected results for Canadians.
Service indicators and additional measures relate to the quality, timeliness and volumes associated with the delivery of services to Canadians.
A supplementary document providing a more detailed explanation of HRSDC's performance indicators by strategic outcome with data sources is available on the Department's website at http://www.hrsdc.gc.ca.
Program Performance Indicators
| PROGRAM INDICATORS | |||
| Enhanced Canadian productivity and participation through efficient and inclusive labour markets, competitive workplaces and access to learning | |||
| PROGRAM INDICATORS (LABOUR MARKET) | 2006-2007 TARGET | ||
| Access | |||
| Percentage of unemployed targeted by the Employment Insurance program eligible to collect regular Employment Insurance benefits | 2004 Result: 80.4% | ||
| Rate of participation of designated groups (self-identified) and older workers in Employment Benefits and Support Measures (EBSM) | Rate of Participation in EBSM 2004-2005 | Percentage of the entire unemployed labour force7 | |
| Women | 46.7% | 4.5% | |
| People with disabilities | 4.5% | 9.8% | |
| Aboriginal persons | 6.6% | 6.5% | |
| Visible minorities | 6.2% | 16.2% | |
| Older workers (55 and over) | 6.5% | 17.3% | |
| Adequacy | |||
| Proportion of regular entitlement collected by Employment Insurance claimants (%) | (2003-2004) 60.9% | ||
| Proportion of Employment Insurance maternity/parental entitlement collected by Employment Insurance claimants | (2004-2005) 92% | ||
| Labour market efficiency | |||
| Number of youth clients who return to school or become employed following an employment program intervention under the youth employment strategy and proportion of these clients in the total number of action plans closed | 7,4008 | ||
| Number of Aboriginal clients who return to school or become employed following an employment program intervention under the Aboriginal Human Resources Development Strategy and proportion of these clients in the total number of action plans closed | 20,5009 | ||
| Number of clients employed or self-employed following an employment program intervention, and proportion of these clients in the total number of action plans closed | 220,000 Proportion: Actual results to be reported | ||
| PROGRAM INDICATORS (WORKPLACE SKILLS) | 2006-2007 TARGET | ||
| Number of apprentices that receive the Apprenticeship Incentive Grant | New Measure | ||
| Increase in the number of trades people who are fully mobile in Canada through red seal endorsement | 15,000 | ||
| Number of tools and processes completed to be used in verifying and recognizing foreign credentials and work experience of foreign-trained professionals | 85 | ||
| PROGRAM INDICATORS (LEARNING) | 2006-2007 TARGET | ||
| 3-year loan default rate (direct loans only for 2006-2007) | 26%10 | ||
| Number of Canadians who have ever received a Canada Education Savings Grant and who are attending postsecondary education in the current fiscal year | 192,000 | ||
| Percentage of Canadians under 18 years of age who have ever received a Canada Education Savings Grant | 34% | ||
| Percentage of children eligible for the Canada Learning Bond who have a Registered Education Savings Plan | 22% | ||
| SERVICE INDICATORS | |||
| Client satisfaction with the overall quality of services provided by the Canada Student Loans Program | 76% | ||
| Client (Registered Education Savings Plan providers) satisfaction with the overall quality of services provided by the Canada Education Savings Program | 88% | ||
| Safe, healthy, fair, stable, cooperative, productive workplaces and effective international labour standards | |||
| PROGRAM INDICATORS (LABOUR) | 2006-2007 TARGET | ||
| Percentage of collective bargaining disputes settled under Part I (Industrial Relations) of the Canada Labour Code without work stoppages | 90% | ||
|
Percentage of unjust dismissal complaints settled by inspectors (Part III of the Canada Labour Code) |
75% | ||
| Disabling injury incidence rate (DIIR) measuring the change in the rate of lost time injuries, illnesses and fatalities within federal jurisdiction industries from year to year | Actual results to be reported | ||
| Percentage of money collected in relation to the amount found to be owed for complaints under Part III (Labour Standards) of the Canada Labour Code (excluding unjust dismissal complaints) | 75% | ||
| SERVICE INDICATORS | |||
| Client satisfaction with the quality of Workplace Information Directorate data | 80% | ||
| Enhanced income security , access to opportunities and well-being for individuals, families and communities | |||
| PROGRAM INDICATORS (SOCIAL INVESTMENT) | 2006-2007 TARGET | ||
| Proportion of CPP contributors who have contributory coverage/eligibility for CPP Disability | New measure | ||
| Number of CPP Disability recipients who report a return to work and leave benefits - proportion of this group of clients who have remained off benefits for six months or more | New measure | ||
| Number of partnerships concluded that provide the public with knowledge of the OAS/CPP programs | New measure | ||
| Labour Market Agreements for Persons with Disabilities (LMAPD)11 | |||
| Number of participants in programs/services under the LMAPD | 199,812 | ||
| Number and percentage of participants completing a program or service through LMAPD programming, where there is a specific start and end point to the intervention, by province | 76,311 (38%) | ||
| Number and percentage of participants who obtained or were maintained in employment through LMAPD programming, where the program or service supports the activity | 43,680 (22%) | ||
| Opportunities Fund for Persons with Disabilities12 | |||
| Number of clients served | 5,539 | ||
| Number and percentage of clients who obtained employment | 1,711 (31%) | ||
| Number and percentage of clients with enhanced employability | 2,198 (40%) | ||
| Number and percentage of clients who sought further skills upgrading (returned to school) | 242 (4%) | ||
| Social Development Partnerships Program | |||
| Knowledge is created and disseminated to meet the social development needs of citizens | New measure | ||
| Understanding the Early Years Initiative | |||
| Number of communities that apply through the Call For Proposals process during each year | New measure | ||
| New Horizons for Seniors Program | |||
| Number of seniors leading and or involved in funded project activities within the community | New measure | ||
| Social Development Partnerships Program Office for Disability Issues | |||
| Number of proposals (from contribution agreements) funded | 46 | ||
| PROGRAM INDICATORS (CHILDREN AND FAMILIES) | 2006-2007 TARGET | ||
| Incidence of low income - the change in the number and percentage of families and children that fall below the post-tax LICO, due to the National Child Benefit, in one year | Actual data to be reported | ||
| Depth of low income - the change in the aggregate amount of income that low-income families would need to reach the post-tax LICOs, due to the National Child Benefit, in one year | Actual data to be reported | ||
| Number of children under six years of age for whom their parents are receiving the Universal Child Care Benefit | 95% of all children under six years of age.13 | ||
| PROGRAM INDICATORS (HOUSING AND HOMELESSNESS) | 2006-2007 TARGET | ||
| Percentage of investments directed toward the continuum of supports and services based on priorities established by the community | At least 75% invested in community priorities | ||
| Ratio of total National Homelessness Initiative investments versus funding by type of partners for each province and territory 2003-2007 | 1 to 1.5 | ||
| Increase in accessible sources of information/data on homelessness | Evidence of uptake of data/information | ||
| Achieve better outcomes for Canadians through service excellence | |||
| SERVICE INDICATORS | 2006-2007 TARGET | ||
| Increase in number of Service Canada points of service (from 320 in March 2005) | 533 | ||
| 24/7 availability of Internet - information and transaction 95% (compared to March 2005 where only information was accessible online) | 95% | ||
| Percentage of calls answered by an agent within 180 seconds | 95% | ||
| Extend hours of service in Service Canada Centres (from 0 in March 2005) | 60 | ||
| Percentage of availability of Interactive Voice Response System | 95% | ||
| Maintain or reduce number of official language complaints | Actual results to be reported | ||
| Establish Official Language Minority Community Groups points of service (from 0 in March 2005) | 17 | ||
| Offer service in languages other than English or French (from 0 in March 2005) | 10 | ||
| Provide forms online in formats accessible for people with disabilities | 10 | ||
| Percentage of notifications sent within seven days of receipt of applications | 80% | ||
| Percentage of Employment Insurance payments issued within 28 days of filing | 80% | ||
| Percentage of passports delivered by Passport Canada within 20 working days of receiving the application from Service Canada, excluding mailing time | 90% | ||
| Percentage of Canada Pension Plan retirement first payment within the month of entitlement | 85% | ||
| Percentage of Old Age Security first payments issued within 30 days of entitlement | 90% | ||
| Percentage of pleasure craft licences issued in one visit (service not offered in March 2005) | 90% | ||
| Maintain or increase client satisfaction | Actual results to be reported | ||
| ADDITIONAL MEASURES | |||
| Web Usage | Actual volumes to be reported | ||
| Phone Usage - agent calls | Actual volumes to be reported | ||
| Phone Usage - Interactive Voice Response calls | Actual volumes to be reported | ||
| Service Canada Centre visits | Actual volumes to be reported | ||
| Accuracy rate of EI payments | 95% | ||
| EI Appeals Speed of Service -Board of Referees (30 days) -Umpire (60 days) |
90% 100% | ||
| Number of employment programs clients served | 675,000 | ||
| Annual increase in job seekers in Job Bank | 5% | ||
| Annual increase in vacancies posted in Job Bank | 5% | ||
| Client satisfaction with labour market information products and services - usefulness in conducting a job search | Actual result to be reported | ||
| Passport Applications Handled | Actual volumes to be reported | ||
| Pleasure Craft Applications Handled | Actual volumes to be reported | ||
| SIN Applications Received | Actual volumes to be reported | ||
| CPP Applications | Actual volumes to be reported | ||
| EI Applications | Actual volumes to be reported | ||
| OAS Applications | Actual volumes to be reported | ||
| Number of new Service Offerings | Actual volumes to be reported | ||
| Departmental Corporate Management - Human Resources and Official Languages | 2006-2007 Target | ||
| Employment Equity | |||
| Representation of visible minority persons | 9.4% | ||
| Representation of Aboriginal persons | 3.0% | ||
| Representation of people with disabilities | 3.6% | ||
| Representation of women | 60.1% | ||
| Official language complaints | |||
| Language of work | Actual results to be reported | ||
| Service to the public | Actual results to be reported | ||
Analysis of Plans, Priorities and Program Activities by Strategic Outcome
- Policies and programs that meet the human capital and social development needs of Canadians
- Enhanced Canadian productivity and participation through efficient and inclusive labour markets, competitive workplaces and access to learning
- Safe, healthy, fair, stable, cooperative, productive workplaces and effective international labour standards
- Enhanced income security, access to opportunities and well being for individuals, families and communities
- Achieve better outcomes for Canadians through service excellence
This section describes HRSDC the plans and priorities by each strategic outcome. It also provides a short description of the major sub-activities (initiatives, programs and services) that support those priorities, including financial and human resources information for the next three years.
STRATEGIC OUTCOME
POLICIES AND PROGRAMS THAT MEET THE HUMAN CAPITAL AND SOCIAL DEVELOPMENT NEEDS OF CANADIANS
PROGRAM ACTIVITY: POLICY, RESEARCH AND COMMUNICATIONS
HRSDC is committed to developing a comprehensive and integrated knowledge base to inform government action to respond effectively to the needs of citizens. This knowledge base consists of the development and strategic managment of key national data assets, analysis of important trends and research on emerging issues and best approaches to human resources and social development matters, and evaluation of key departmental programs. Efforts are devoted to exchanging information and building constructive partnerships with groups that either conduct similar activities or develop policies and programs affecting HRSDC's mandate. Opportunities for effective feedback and dialogue with citizens, businesses and families are being developed to supplement these exchanges.
Over the coming year, the Department will strive for organizational excellence in the creation, management, exchange and use of knowledge about human resources and social development matters through a Knowledge Management Initiative. The development of forward-looking knowledge planning and management activities will strategically position HRSDC as a leader in the creation, sharing and use of pan-Canadian knowledge and information at all levels. These strategies support informed decision-making, foster collaboration and partnership, coordinate actions among major players, and strengthen policy and program effectiveness.
HRSDC understands that it is accountable for explaining to citizens how their views have been taken into consideration. The development and implementation of a corporate Public Involvement Framework will contribute to the Department's proactive efforts to promote and facilitate public involvement and awareness of program development and delivery, and maintain a transparent and interactive relationship with the Canadian public.
The Department's work with other federal departments on horizontal policies is key to advancing the social well-being of Canadians. HRSDC will develop a new policy approach for gender and diversity analysis in policy and program development, as well as continuing to work horizontally on the development of a five-year federal Gender Equality Strategy. It will also continue to work with the community non-profit sector and federal government departments to promote dialogue, collaboration and suppport innovation. In addition, HRSDC is one of the federal departments working with the 2010 Olympic and Paralympic Winter Games Federal Secretariat, host partners, other governments and civil society to advance the development of the Games, including enhancing the participation of Aboriginal Peoples in the event and its related activities.
| Priority: Promote key human resources and social development policies of the Government of Canada |
|
Plans
|
| Priority: Develop and implement key departmental frameworks and strategies |
|
Plans
|
| Priority: Advance knowledge development to support informed decision-making |
|
Plans
|
| Priority: Increase engagement and collaboration with our partners and Canadians through public involvement and other activities to ensure better, innovative and complementary policy initiatives |
|
Plans
|
POLICY, RESEARCH AND COMMUNICATIONS: PROGRAMS SUPPORTING PRIORITIES
The policy, research and communication program activity provides strategic policy leadership with a focus on domestic and international partnerships, and supports the development of programs and policies with audit, evaluation and research functions. This activity also supports the achievement of the Department's strategic and operational goals through planning and communications.
Strategic Policy: HRSDC focuses on addressing social and human capital challenges of Canadians through strategic, innovative solutions. To move forward with implementing the Government's commitments in the area of human resources and social development, the Department develops foundational policy frameworks and strategies. These frameworks and strategies also enable the Department to identify emerging policy issues for Canadians.
Knowledge, Analysis, Audit and Evaluation: Knowledge management, audit and evaluation support strong accountability, innovative and responsive policies and programs and evidence-based decision-making by governments, public institutions, businesses, communities, families and citizens.
Public Affairs and Engagement: The Department pursues engagement activities to develop better policies and programs by seeking Canadians' views and broadening knowledge and research.
POLICY, RESEARCH AND COMMUNICATION: FINANCIAL AND HUMAN RESOURCES -PLANNED SPENDING
| Planned Spending | |||
| 2006-2007 | 2007-2008 | 2008-2009 | |
| Financial Resources (in millions of dollars) | |||
| Human Resources and Skills Development Canada - Policy and Program Support | |||
| Gross Operating Expenditures | 120.1 | 107.7 | 106.8 |
| Social Development Canada- Social Development Policy and Innovation | |||
| Gross Operating Expenditures | 67.3 | 70.7 | 70.7 |
| Total | 187.4 | 178.4 | 177.5 |
| Human Resources | |||
| Full Time Equivalents | 936 | 898 | 894 |
| 2006-2007 | 2007-2008 | 2008-2009 | |
| Financial Resources (in millions of dollars) | |||
| Human Resources and Skills Development Canada - Policy and Program Support | |||
| Strategic Policy and Planning | 43.7 | 42.0 | 41.9 |
| Communications and Ministerial Services | 44.5 | 37.1 | 37.1 |
| Allocated Corporate Servicesa | 37.1 | 33.9 | 33.8 |
| Other | (5.2) | (5.3) | (6.0) |
| Sub-Total | 120.1 | 107.7 | 106.8 |
| Social Development Canada - Social Development Policy and Innovation | |||
| Social Development Policy and Innovation | 61.7 | 65.4 | 65.4 |
| Allocated Corporate Servicesa | 5.6 | 5.3 | 5.3 |
| Sub-Total | 67.3 | 70.7 | 70.7 |
| Total | 187.4 | 178.4 | 177.5 |
| Human Resources | |||
| Full Time Equivalents | 936 | 898 | 894 |
| a. Corporate Services resources related to the Minister's Office, the Deputy Minister's Office, the Comptroller's Office and the Shared Services have been prorated to each Strategic Outcome. | |||
STRATEGIC OUTCOME
ENHANCED CANADIAN PRODUCTIVITY AND PARTICIPATION THROUGH EFFICIENT AND INCLUSIVE LABOUR MARKETS, COMPETITIVE WORKPLACES AND ACCESS TO LEARNING
The aging Canadian labour force presents challenges that cannot be avoided. Canada's continued prosperity now and in the future lies in maintaining strong productivity growth and increasing labour force participation. HRSDC has a number of important programs that are vital to improving productivity and participation. These programs are situated in the following areas: Labour Market, Workplace Skills and Learning.
The labour market will increasingly require workers with higher levels of education and skill. A highly skilled workforce is vital to improving productivity and sustaining strong economic growth. Workplace Skills programs bring together a broad range of initiatives that address the urgent need for innovative responses to skills issues. Learning programs provide greater ease of access to post-secondary education and skills training, and promote the awareness and importance of lifelong learning. Together, initiatives in these areas are intended to deliver and boost the national skills pool and the longer-term labour supply. These programs are further complemented by initiatives under the Labour Market Program that facilitate the removal of barriers to employment and ensure that labour market participation rates are at their optimal level now and in the future.
The following outlines priorities and plans related to the program areas of Labour Market, Workplace Skills and Learning.
PROGRAM ACTIVITY: LABOUR MARKET
In support of this strategic outcome, the Department will continue to provide temporary income support to qualified unemployed workers which, in turn will promote economic stability, individual well-being and a flexible labour market capable of adjusting to changes in the economy.
The Department works with provinces, territories and other partners to support the objectives of creating a more integrated labour market system for Canada and ensuring the right tools are in place to address the needs of today's labour markets. Increased efforts in areas such as Aboriginal participation, youth at risk and displaced older workers will support this objective and help to facilitate an efficient labour market where the quantity and quality of labour supply effectively meet the demand, and an inclusive labour force through the removal of barriers and the enhancement of opportunities for the skills development of Canadians.
Through the Labour Market Development Agreements with provinces and territories, employment programs and services enable Canadians to prepare for, find and keep employment. Targeted strategies for Aboriginal Canadians and youth complement the EI program. The Department will adapt programs and strategies to ensure they remain well suited to the needs of Canada's workforce.
HRSDC continues to monitor and evaluate its programs and policies with an emphasis on linking evaluation with improved performance measurement, results-based management and ultimately better outcomes and results for Canadians.
HRSDC manages four horizontal initiatives14 - the Aboriginal Human Resources Development Strategy; the Aboriginal Skills and Employment Partnership Program; the Youth Employment Strategy; and Labour Market Development Agreements. Partnerships with provinces and territories, representative third-party groups, labour market stakeholders, and the private sector are key to achieving successful outcomes.
Priorities for 2006-2007 are to ensure that employment programs are in tune with the current environment and to work closely and more effectively with provinces, territories, Aboriginal groups and other partners.
| INDICATORS | CURRENT LEVEL | |
| Percentage of unemployed looking for work for one year or more (52 weeks and over). | 2005 | 9.2% |
| Percent of youth (15-24 year-olds) not in the labour force or in school.* | 2005 | 8.9% |
| Involuntary part-time employment as a proportion of all part-time employment. | 2005 | 25.6% |
| Employment Insurance regular beneficiaries to unemployed ratio. | 2004 (2003, revised to 43.5%) |
43.6% |
| Unemployment Rates by Designated Group. | Women | 7.2% |
| People with Disabilities | 10.7% | |
| Aboriginal Peoples | 19.1% | |
| Visible Minorities | 9.5% | |
| Older Workers | 6.0% | |
| * Census 2001 data includes Labour Force 15 years or older that are unemployed. | ||
| Priority: Work with provinces, territories and stakeholders to ensure that labour market programming is coherent, comprehensive and flexible |
|
Plans:
|
| Priority: Provide advice on Employment Insurance income support to ensure it remains well suited to the needs of Canada's economy and workforce |
|
Plans:
|
| Priority: Build more effective partnerships to improve Aboriginal labour market outcomes |
|
Plans:
|
| Priority: Develop approaches to reduce barriers and help vulnerable Canadians, such as youth, disabled and older workers participate in the labour market |
|
Plans:
|
| Strategic Outcome | Enhanced Canadian productivity and participation through effective and inclusive labour markets, competitive workplaces and access to learning |
| 2006-2007 Priorities |
|
| Program Activity Expected Results |
|
| Program Indicators |
|
| Programs |
|
| Resources | PLANNED SPENDING: : $16,504.5M FTE: 13,377 |
LABOUR MARKET: PROGRAMS SUPPORTING PRIORITIES
The Labour Market program activity comprises Employment Insurance and Employment Programs and Services.
Employment Insurance: promotes individual well-being and economic stability, and facilitates smooth labour market transition by providing temporary financial assistance to unemployed Canadians while they look for work or upgrade their skills. Canadians who must take time off work for illness, pregnancy or to care for a newborn or adopted child, as well as those who must care for a family member who is seriously ill with a significant risk of death, may also be assisted by Employment Insurance. Temporary income support is provided to unemployed workers under Part I of the Employment Insurance Act.
Employment Programs and Services: enable Canadians, including unemployed adults and individuals facing barriers to employment, such as youth, displaced older workers and Aboriginal Canadians, to develop their skills, maintain or improve their employment and earnings, and become more adaptable to labour market changes. These programs and services strengthen Canadians' participation in a dynamic labour market and are funded through the Consolidated Revenue Fund and Part II of the Employment Insurance Act.
Employment Insurance Income Benefits: This program provides temporary financial assistance to unemployed Canadians (including self-employed fishers) while they look for work, participants in work-sharing agreements, and to Canadians who need to take a temporary absence from work for sickness, pregnancy and childbirth, caring for a newborn or adopted child, or to provide care or support to a gravely ill family member with a significant risk of death. Through an Agreement with the Government of Canada, as of January 2006, the province of Quebec provides its own maternity and parental coverage for its residents, rather than through the Employment Insurance program.
Employment Benefits and Support Measures (EBSMs) and Labour Market Development Agreements (LMDAs): Part II of the Employment Insurance Act authorizes the design and implementation of EBSMs to help unemployed participants prepare for, find and keep employment. http://www.hrsdc.gc.ca/en/gateways/nav/top_nav/program/gc.shtml
Under the authority of the Employment Insurance Act, LMDAs have been signed with all provinces and territories, including a recent agreement with Ontario to be implemented on January 1, 2007. Eight of these agreements are in the form of a transfer agreement under which six provinces and two territories have assumed responsibility for the design and delivery of provincial/territorial programs and services similar to EBSMs. Under co-management LMDAs in four provinces and one territory, the EBSMs are designed and managed jointly among Service Canada, HRSDC and the provinces/territory. Pan-Canadian programs maintained under HRSDC management are available to address labour market issues and priorities that are national or multi-regional in scope. http://www.hrsdc.gc.ca/en/epb/sid/cia/grants/ebsm/section_63.shtml
Aboriginal Human Resources Development Strategy (AHRDS): The AHRDS is designed to assist Aboriginal people to prepare for, find and keep employment and builds Aboriginal capacity for human resources development. The AHRDS is delivered through agreements with 80 Aboriginal Human Resource Development Agreements holders across the country. The AHRDS integrates most of HRSDC's Aboriginal programming. http://www17.hrdc-drhc.gc.ca/AHRDSInternet/general/public/HomePage1-eng.asp
Aboriginal Skills and Employment Partnerships (ASEP): Complementary to the AHRDS, ASEP is a nationally managed program geared toward supporting collaboration among Aboriginal groups, the private sector and provincial/territorial governments. The goal of ASEP is to ensure sustainable employment for Aboriginal people in major economic opportunities, leading to long-term benefits for Aboriginal communities, families and individuals. http://www17.hrdc-drhc.gc.ca/AHRDSInternet/general/public/asep/asep-eng.asp
Youth Employment Strategy (YES): The YES programs ensure that Canada's youth are well prepared to participate and succeed in today's changing labour market. The Strategy is delivered in partnership with the private sector and non-governmental organizations through the collective efforts of thirteen federal departments, agencies and corporations, with HRSDC in the lead role in collaboration with Service Canada. Under the Strategy, youth employment initiatives target youth from 15 to 30 years of age who are unemployed or underemployed. This national strategy offers a broad range of initiatives under three programs: Skills Link, Summer Work Experience and Career Focus. http://www.youth.gc.ca/
Labour Market Adjustment activities are intended to support the objectives of an integrated labour market system and to ensure the right tools are in place to meet the needs of a flexible and expanding labour market.
Official Language Minority Communities: HRSDC helps to sustain the vitality of Official Language Minority Communities through a horizontal departmental initiative that provides policy direction and analysis across programs. The initiative's objective is to enhance human resources development, increase employability and community capacity building for the official language minority communities. The Department has six key priorities to address according to the Government of Canada Action Plan for Official Languages: Literacy, Youth Internships, the Enabling Fund, Integration of French-speaking immigrants into the Canadian Labour Market, Child Care Pilot Projects and Non governmental Organizations. http://www.hrsdc.gc.ca/en/gateways/nav/top_nav/program/solmc.shtml
LABOUR MARKET: FINANCIAL AND HUMAN RESOURCES - PLANNED SPENDING
| Planned Spending | |||
| 2006-2007 | 2007-2008 | 2008-2009 | |
| Financial Resources (in millions of dollars) | |||
| Gross Operating Expenditures | 1,324.2 | 1,322.4 | 1,320.9 |
| Non-Statutory Grants and Contributions | 552.3 | 536.6 | 504.4 |
| Statutory Transfer Payments | 0.2 | 0.2 | 0.2 |
| Total Gross Expenditures | 1,876.7 | 1,859.2 | 1,825.5 |
| EI Part I - Income Benefits | 12,442.0 | 13,058.0 | 13,661.0 |
| EI Part II - Employment Benefits and Support Measures | 2,137.5 | 2,143.1 | 2,143.6 |
| Government Annuities and Civil Service Insurance Payments | 48.3 | 45.4 | 42.7 |
| Total | 16,504.5 | 17,105.7 | 17,672.8 |
| Human Resources | |||
| Full Time Equivalents | 13,377 | 13,310 | 13,289 |
| Planned Spending | |||
| 2006-2007 | 2007-2008 | 2008-2009 | |
| Financial Resources (in millions of dollars) | |||
| Employment Isurance | |||
| Benefits | 12,442.0 | 13,058.0 | 13,661.0 |
| Allocated Corporate Servicesa | 269.4 | 277.5 | 281.6 |
| Otherb | 658.4 | 650.0 | 644.4 |
| Sub-Total | 13,369.8 | 13,985.5 | 14,587.0 |
| Labour Market Programs | |||
| Employment Benefits and Support Measures | 1,353.8 | 1,350.1 | 1,350.6 |
| Labour Market Development Agreements Transfers | 987.0 | 987.0 | 987.0 |
| Aboriginal Human Resources Development Strategy | 271.3 | 264.4 | 263.5 |
| Aboriginal Skills and Employment Partnerships | 30.3 | 21.1 | - |
| Youth Employment Strategy | 321.1 | 321.4 | 321.4 |
| Labour Market Adjustments | 11.2 | 11.2 | 11.2 |
| Official Language Minority Communities | 13.6 | 13.5 | - |
| Allocated Corporate Servicesa | 131.2 | 136.2 | 136.8 |
| Otherc | 15.2 | 15.3 | 15.3 |
| Sub-Total | 3,134.7 | 3,120.2 | 3,085.8 |
| Totald | 16,504.5 | 17,105.7 | 17,672.8 |
| Human Resources | |||
| Full Time Equivalents | 13,377 | 13,310 | 13,289 |
| a. Corporate Services resources related to the Minister's Office, the Deputy Minister's Office, the Comptroller's Office and the Shared Services have been prorated to each Strategic Outcome. b. This category includes resources related to claim processing, Employment Insurance premium collection, appeals, investigation and control, program management and service improvement. c. Other category is for the resources which are not directly related to the sub-activities identified. d. This amount includes $1,259.9 million (13,240 FTEs) in 2006-2007, $1,246.2 million (13,138 FTEs) in 2007-2008 and $1,252.7 million (13,086 FTEs) in 2008-2009, for the delivery of programs and services by Service Canada. For a full accounting of Service Canada's operations please refer to the Strategic Outcome, "Achieve better outcomes for Canadians through service excellence". | |||
Labour Market Program Activity - Modifications from the 2005-2006 Program Activity Architecture:
- The former program activities Employment Insurance and Employment Programs have been moved to the sub-activity level and placed under the new program activity Labour Market.
- The former program name Employment Programs has been changed to Labour Market Programs.
- The former activity Claims Processing has been subsumed under the activity Processing, located under the program activity Integrity - supporting the strategic outcome related to Service Canada.
- The former sub-activities Employment Insurance Premium Collection, Appeals, Investigation and Control and the Program Management part of Program Management and Service Improvement have been subsumed under a residual category called Other - Labour Market.
- The Service Improvement portion of the former sub-activity Program Management and Service Improvement has been subsumed under the program activity Seamless, Citizen-Centered Service - supporting the strategic outcome related to Service Canada.
PROGRAM ACTIVITY: WORKPLACE SKILLS
Enhancing the competitiveness of Canadian workplaces is essential to ensuring Canada's productivity and improving quality of life. Skilled workers can help drive improvements in productivity, as they are better able to process information, perform tasks more efficiently and effectively, and adapt to and use new technology. They are also more skilled at generating innovations in information, products, services, and production and distribution processes.
An integrated workplace skills strategy should be a key component in achieving this strategic outcome. This strategy needs to be business demand-driven and bring together a broad range of programs, services and partners - provinces, employers and labour - to address the need for innovative responses to skills issues.
Focusing on employers, employed workers and immigrants, workplace skills development has several overarching objectives for Canada that are integral to the broader economic agenda and economic union: a flexible, efficient labour market; a skilled, adaptable and resilient workforce; and programs and services that reflect and respond to employers' needs for skilled workers.
| INDICATORS | CURRENT LEVEL | |
| Percentage of adult workforce who participated in job-related formal training | 2002 | 34.7% |
| Percent of adult workforce who participated in employersupported job-related training | 2002 | 25.0% |
| Average earnings of recent immigrant university graduates as a percentage of the earnings of Canadian-born university graduates | 2000 | 65.0% |
A workplace skills strategy needs to promote the achievement of positive workplace skills outcomes through programs and services such as those related to sectoral initiatives, apprenticeship and the skilled trades (for example, an incentive grant for first and second year apprentices in the Red Seal trades), , labour mobility, foreign credential recognition and use, essential skills, and the development, dissemination and coordination of skills and labour market information and related activities.
WORKPLACE SKILLS: PRIORITIES AND PLANS
| Priority: Articulating an integrated workplace skills strategy by working with provinces, territories, key government departments and stakeholders in advancing multiple activities that include trades and apprenticeship, foreign credential recognition, labour market information, as well as sectoral initiatives. |
|
Plans:
|
| Strategic Outcome | Enhanced Canadian productivity and participation through effective and inclusive labour markets, competitive workplaces and access to learning |
| 2006-2007 Priorities |
|
| Program Activity Expected Results |
|
| Program Indicators |
|
| Programs |
|
| Resources | PLANNED SPENDING: $219.3 million FTE: 908 |
WORKPLACE SKILLS: PROGRAMS SUPPORTING PRIORITIES
The Workplace Skills program activity supports the collaboration of industry partners and stakeholders in identifying, addressing and promoting workplace skills development and recognition issues that reflect the realities of Canadian workplaces in our rapidly evolving labour market. It also develops and disseminates knowledge and information, which is vital in supporting and contributing to a well-functioning labour market.
Workplace Partnerships: Workplace Partnershipsadvance partnerships with industry and the learning system to ensure that Canadians have the skills and knowledge required for the workplace. The activities are divided into six main business lines/programs.
Sector Council Program supports knowledge and project-based activities proposed by Sector Councils, as well as national sector-like organizations working on skills and learning issues. http://www.hrsdc.gc.ca/en/gateways/nav/top_nav/program/spi.shtml
Trades and Apprenticeship: the Directorate will continue to implement the Trades and Apprenticeship Strategy and work with Service Canada to implement the Apprenticeship Incentive Grant. The Directorate will also continue to work with the provinces and territories through the Canadian Council of Directors of Apprenticeship (CCDA) to facilitate and increase the labour mobility of skilled trades workers; and to work with public and private sector partners and stakeholders to strengthen apprenticeship systems in Canada enabling them to respond more effectively to the demands of the knowledge-based economy. http://www.hrsdc.gc.ca/en/gateways/nav/top_nav/program/almi.shtml
The Interprovincial Standards "Red Seal" Program is designed to facilitate mobility through interprovincial certification based on national occupational standards and examinations for the 45 "Red Seal" trades. It also encourages standardization of provincial and territorial apprenticeship training and certification programs. Apprentices who have completed their training and certified journeypersons are able to obtain a "Red Seal" endorsement on their Certificates of Qualification and Apprenticeship Completion by successfully completing an Interprovincial Standards "Red Seal" Examination. http://www.red-seal.ca/Site/index-eng.htm
The Training Centre Infrastructure Fund (TCIF) is a three-year pilot project to encourage, through federal funding, increased investment by unions and employers in purchasing up-to-date training equipment for union-employer training centres. http://www.hrsdc.gc.ca/en/hip/hrp/tcif/index.shtml
The Workplace Skills Initiative (WSI) will support partnership-based projects testing and evaluating innovative, outcomes-focused approaches to skills development for employed Canadians. WSI support will be available to proponents from across the spectrum of workplace partners. http://www.hrsdc.gc.ca/en/ws/initiatives/wsi/index.shtml
The Workplace Partners Panel (WPP) will provide Canadian industry and the Government of Canada with a forum to exchange perspectives and intelligence, and a research capacity focused on workplace skills issues. It will be charged with galvanizing Canada's industry, educational partners and governments to integrate the workplace into Canada's learning system.
The Foreign Workers and Immigrants Program helps internationally-trained individuals integrate and participate effectively in the Canadian labour market, as well as enhancing interprovincial mobility of internationally and domestically trained workers. This work is done in conjunction with Provincial and Territorial partners and stakeholders across Canada, including other federal departments, industry, and regulatory bodies. The activities are divided into four main business lines/programs.
Foreign Credential Recognition will support knowledge and project-based activities proposed by Sector Councils, industry groups, regulatory bodies, provinces/territories, and educational bodies, working on foreign credential assessment and recognition issues. http://www.hrsdc.gc.ca/asp/gateway.asp?hr=en/ws/programs/fcr/index.shtml&hs=hzp
Immigration Portal enhances the Going to Canada website by providing prospective immigrants, students, workers and newcomers with information, services and tools to help them make informed decisions about coming to Canada and facilitate their integration into Canada's labour market and society. http://www.directioncanada.gc.ca/
Foreign Worker Program assists Canadian employers in meeting their human resource needs by facilitating the entry of temporary foreign workers into areas of the labour market with demonstrated occupational shortages, while still considering the employers' efforts to hire and recruit Canadians. http://www.hrsdc.gc.ca/en/gateways/nav/top_nav/program/fw.shtml
Interprovincial Labour Mobility co-ordinates federal activity to improve interprovincial labour mobility under the Agreement on Internal Trade, so that workers who qualify in one province/territory can have their qualifications recognized in another.
Skills and Labour Market Information (SLMI): SLMI is available to help employed and unemployed job seekers, people choosing a career, career practitioners, employment service providers, employers, education/learning institutions, and community development organizations in making informed decisions related to skills, human resources and the labour market. LMI and related products and services contribute to a well-functioning labour market. The activities are divided into three main business lines.
National Occupational Classification (NOC) provides a standardized language for describing the work performed by Canadians in the labour market and continues to be the authoritative resource on occupational information in Canada. The NOC contains the classification structure and descriptions of 520 occupational unit groups and includes over 30,000 occupational titles. http://www.sdc.gc.ca/en/hip/hrp/noc/noc_index.shtml
Essential Skills required for work, home and community, provide the foundation for learning all other skills, such as job-related technical skills, thus enabling people to evolve with their jobs and adapt to workplace and workforce changes. The Essential Skills Initiativeaims to improve the essential skills levels of Canadians who are entering - or already in - the labour market. The starting point is the development of profiles that show how Essential Skills are used in various occupations and their level of complexity, and provide samples of authentic workplace materials used on the job. Partnerships with provinces/territories and other workplace stakeholders help to increase the knowledge base of Essential Skills; promote understanding and their greater utilization in the workplace; and develop tools and other resources to facilitate their integration into the workplace. http://www.hrsdc.gc.ca/en/hip/hrp/essential_skills/essential_skills_index.shtml
Labour Market Information (LMI) develops policies to contribute to the enhancement of skills and labour market information and the pan-Canadian consistency of LMI content, products and services. Through Service Canada, it also provides information on: national and regional employment trends; local employment prospects; wage rates; skills and education required by occupation; employment and training opportunities. Service Canada also offers job posting, job search, job alert and job matching services to job seekers and employers.
http://www.hrsdc.gc.ca/en/gateways/nav/top_nav/program/lmi.shtml
http://www.jobbank.gc.ca/
http://www.labourmarketinformation.ca/
WORKPLACE SKILLS: FINANCIAL AND HUMAN RESOURCES - PLANNED SPENDING
| Planned Spending | |||
| 2006-2007 | 2007-2008 | 2008-2009 | |
| Financial Resources (in millions of dollars) | |||
| Gross Operating Expenditures | 102.9 | 102.5 | 80.1 |
| Non-Statutory Grants and Contributions | 116.4 | 191.3 | 153.9 |
| Total | 219.3 | 293.8 | 234.0 |
| Human Resources | |||
| Full Time Equivalents | 908 | 896 | 784 |
| 2006-2007 | 2007-2008 | 2008-2009 | |
| Financial Resources (in millions of dollars) | |||
| Workplace Partnerships | 127.3 | 192.6 | 146.0 |
| Foreign Workers and Immigrants | 22.6 | 30.5 | 26.9 |
| Skills and Labour Market Information | 33.6 | 33.9 | 34.7 |
| Allocated Corporate Servicesa | 29.6 | 30.5 | 23.6 |
| Other | 6.2 | 6.3 | 2.8 |
| Totalb | 219.3 | 293.8 | 234.0 |
| Human Resources | |||
| Full Time Equivalents | 908 | 896 | 784 |
| a. Corporate Services resources related to the Minister's Office, the Deputy Minister's Office, the Comptroller's Office and the Shared Services have been prorated to each Strategic Outcome. b. This amount includes $53.1 million (695 FTEs) in 2006-2007, $52.6 million (691 FTEs) in 2007-2008 and $50.7 million (694 FTEs) in 2008-2009, for the delivery of programs and services by Service Canada. For a full accounting of Service Canada's operations please refer to the Strategic Outcome, "Achieve better outcomes for Canadians through service excellence". | |||
Workplace Skills Program Activity - Modifications from the 2005-06 Program Activity Architecture:
- The former sub-activity Human Resources Partnerships has been changed to Workplace Partnerships.
- The activity National Occupational Classification has been moved from Human Resources Partnerships (now Workplace Partnerships) to Skills and Labour Market Information.
- The Workplace Skills Initiative and Workplace Partners Panel are new programs, located at the sub-sub activity level, under Workplace Partnerships.
- The Foreign Worker Program has been moved to the new activity, Foreign Workers and Immigrants.
- The Immigration Portal and Interprovincial Labour Mobility are new programs and have been placed under the sub-activity Foreign Workers and Immigrants.
Lifelong learning is vital to the well-being of individual Canadians as well as to the productivity, competitiveness and prosperity of Canada. The knowledge-based economy has increasingly been creating jobs that require a higher level of education and skills. In the future, it is estimated that about two thirds of all new jobs created over the next ten years will be in management or require some form of post-secondary education. This reality requires a concerted focus on supporting a highly skilled and adaptive labour force.
Many Canadians, however, have skill levels below what is needed to function in the knowledge-based economy. According to the 2003 Adult Literacy and Lifeskills Survey (ALLS), 42% of working-age Canadians score below the literacy level which is considered the minimum to cope in today's economy and society.15 This rate has not changed since 1994.16 Increasing the skill levels of all Canadians will be key to Canada's continued prosperity.
HRSDC helps Canadians gain access to the learning opportunities they need to participate more fully in a knowledge-based economy and society. The Department fosters a culture of lifelong learning by: promoting awareness of the importance of lifelong learning and the need to save for post-secondary education; facilitating access for students to post-secondary education and adult learning opportunities; collaborating with provincial and territorial governments and other key stakeholders on the delivery of learning programs and services; and strengthening the capacity of key learner support organizations.
| INDICATORS | CURRENT LEVEL | ||
| Percentage of population with post-secondary diplomas/degrees | 2004 | ||
| 25-64 year-olds = 44.6% | |||
| 25-34 year-olds = 53.3% | |||
| 35-64 year-olds = 41.8% | |||
| Percentage of adult population (aged 25-64) who participated in adult learning opportunities | 2002 36.7% | ||
| Post-secondary participation of 18-21 year-olds by family after-tax income quartile when youth were age 16 | Family After-tax Income Quartile | PSE Participation (2001) | |
| University | College | ||
| Lowest | 21% | 30% | |
| Lower-middle | 25% | 32% | |
| Upper-middle | 30% | 37% | |
| Highest | 38% | 30% | |
| Overall | 29% | 32% | |
| Proportion of adults who were attending university or college, by age group | Age Groups | Percentage (Oct 2005) | |
| 25-34 | 9.5% | ||
| 35-44 | 3.5% | ||
| 45-54 | 1.6% | ||
| 55-64 | 0.6% | ||
| Overall, 25-64 | 3.9% | ||
As part of this mandate, the Department manages a Horizontal Initiative, the Canada Student Loans Program,17 and currently has agreements with four foundations.18 Three of these foundations, including the Canada Millennium Scholarship Foundation, were provided one-time funding in prior years, and one, the Winnipeg Foundation, has received cost-matched funding on an annual basis ending September 30, 2006.
LEARNING: PRIORITIES AND PLANS
| Priority: Continue to assess policy and program options to address financial and non-financial barriers to post-secondary education and to lifelong learning |
|
Plans:
|
| Priority: Implement the Adult Learning, Literacy and Essential Skills Program and finalize the implementation of the Canada Learning Bond |
|
Plans:
|
| Strategic Outcome | Enhanced Canadian productivity and participation through effective and inclusive labour markets, competitive workplaces and access to learning |
| 2006-2007 Priorities |
|
| Program Activity Expected Results |
|
| Program Indicators |
|
| Programs |
|
| Resources | PLANNED SPENDING: $2,208.7 million FTE: 589 |
LEARNING: PROGRAMS SUPPORTING PRIORITIES
The Learning program activity supports the Government of Canada's significant investments in assisting Canadians, throughout their lives, to acquire the education and skills that will enable them to participate more fully in a knowledge-based economy and society. Programs in this area are delivered by HRSDC nationally and include grant and loans programs to promote access to and encourage savings for post-secondary education, and grants and contributions programs related to international student mobility, adult learning, literacy and essential skills.
Student Financial Assistance: Canada Student Loans Program (CSLP), The Canada Access Grants (CAG) and the Canada Study Grants: The CSLP, including CAG and CSG, promotes accessibility to post-secondary education for those with a demonstrated financial need by lowering financial barriers through the provision of loans and grants. The Program also offers to borrowers debt management measures to help with repayment such as Interest Relief, Debt Reduction in Repayment and loan forgiveness in the event of the permanent disability or death of a qualified borrower. http://www.hrsdc.gc.ca/en/gateways/topics/cxp-gxr.shtml and http://www.canlearn.ca/cgi-bin/gateway/canlearn/en/parent.asp
Canada Education Savings Program (CESP): Canada Education Savings Grant and the Canada Learning Bond (CLB): The CESG and the CLB encourage Canadians to save for the post-secondary education of children through Registered Education Savings Plans (RESPs) by providing grants. The CLB is designed specifically to help low-income Canadian families to acquire education savings for their children. http://www.hrsdc.gc.ca/en/gateways/topics/cgs-gxr.shtml
Adult Learning, Literacy and Essential Skills Program (ALLESP): On March 23, 2006, Treasury Board approved the integration of three of its grants and contributions programs into a single coherent program. The Adult Learning, Literacy and Essential Skills Program brings together the National Literacy Program, the Office of Learning Technologies and the Learning Initiatives Program under one set of Terms and Conditions. ALLESP will work to reduce non-financial barriers to adult learning through the following four program streams:
- Support generation, transfer, and application of knowledge in adult learning, literacy and essential skills
- Contribute to the development of innovative approaches in adult learning, literacy and essential skills
- Strengthen capacity of the adult learning, literacy and essential skills sectors
- Promote adult learning, literacy and essential skills
http://www.hrsdc.gc.ca/en/hip/lld/olt/ADULTLLESP.shtml
International Academic Mobility (IAM) initiative: The International Academic Mobility program advances the development of international skills, knowledge and understanding among students and promotes academic cooperation and institutional links among colleges and universities. http://www.hrsdc.gc.ca/en/gateways/nav/top_nav/program/iam.shtml
LEARNING: FINANCIAL AND HUMAN RESOURCES - PLANNED SPENDING
| Planned Spending | |||
| 2006-2007 | 2007-2008 | 2008-2009 | |
| Financial Resources (in millions of dollars) | |||
| Gross Operating Expenditures | 162.5 | 159.0 | 163.4 |
| Non-Statutory Grants and Contributions | 45.1 | 50.6 | 35.9 |
| Statutory Transfer Payments | 1,019.6 | 998.4 | 1,022.1 |
| Total Gross Expenditures | 1,227.2 | 1,208.0 | 1,221.4 |
| Loans disbursed under the Canada Student Financial Assistance Act | 981.5 | 769.1 | 560.8 |
| Total | 2,208.7 | 1,977.1 | 1,782.2 |
| Human Resources | |||
| Full Time Equivalents | 589 | 514 | 496 |
| 2006-2007 | 2007-2008 | 2008-2009 | |
| Financial Resources (in millions of dollars) | |||
| Student Financial Assistance | 1,486.2 | 1,278.2 | 1,076.7 |
| Canada Education Savings Program | 634.2 | 610.3 | 634.4 |
| Adult Learning, Literacy and Essential Skills Program | 51.8 | 57.0 | 41.0 |
| International Academic Mobility | 4.0 | 4.0 | 4.0 |
| Allocated Corporate Servicesa | 25.0 | 22.6 | 21.9 |
| Other | 7.5 | 5.0 | 4.2 |
| Total | 2,208.7 | 1,977.1 | 1,782.2 |
| Human Resources | |||
| Full Time Equivalents | 589 | 514 | 496 |
| a. Corporate Services resources related to the Minister's Office, the Deputy Minister's Office, the Comptroller's Office and the Shared Services have been prorated to each Strategic Outcome. | |||
Learning Program Activity - Modifications from the 2005-2006 Program Activity Architecture:
- Under the sub-activity Student Financial Assistance, the former sub-sub activity Canada Study Grants has been changed to Grants and now includes the Canada Access Grant and the Canada Study Grant.
- The former sub-activity Canada Education Savings Programs now includes the Canada Learning Bond and the Canada Educations Savings Grant.
- The Adult, Learning and Essential Skills Program combines three former programs (the National Literacy Secretariat, the Office of the Learning Technologies and the Learning Initiatives Program) under one set of terms and conditions.
STRATEGIC OUTCOME
SAFE, HEALTHY, FAIR, STABLE, COOPERATIVE, PRODUCTIVE WORKPLACES AND EFFECTIVE INTERNATIONAL LABOUR STANDARDS
PROGRAM ACTIVITY: LABOUR
Canada's ability to compete internationally and to provide secure, rewarding jobs domestically depends on highly productive workplaces. Essential to creating such workplaces is striking the right balance among the interests of employees, organized labour and employers in Canada, combined with effective and modern labour legislation and regulations that establish the basic structure of the employment relationship between employers and employees.
In support of this strategic outcome, the Labour Program acts to ensure that Canadians work in healthy, safe, fair, stable, cooperative and productive work environments that contribute to the social and economic well-being of all Canadians, and that the international economy increasingly respects fundamental labour rights.
During the 2006-2007 fiscal year, the Labour Program will be focusing its energies on a number of activities. The independent and comprehensive review of Part III (Labour Standards) of the Canada Labour Code will generate recommendations so that federal employment standards can respond to the changing world of work. Recommendations for legislative and non-legislative options will be submitted to the Minister of Labour.
| INDICATORS | LEVEL | |
| Percentage of total working days lost due to work stoppages (federal jurisdiction) | (2004) less than 1% | |
| Representation of designated groups in all occupations and workforce availability, employers covered under the Legislated Employment Equity Program | Representation of Designated Groups (2004) | |
| Women | 43.4% | |
| Aboriginal Peoples | 1.7% | |
| Visible Minorities | 13.5% | |
| People with Disabilities | 2.5% | |
| Workforce Availability (2001) | ||
| Women | 47.3% | |
| Aboriginal Peoples | 2.6% | |
| Visible Minorities | 12.6% | |
| People with Disabilities | 5.3% | |
A review of the Federal Workers' Compensation System will provide the framework for effective prevention strategies and claims management to reduce the incidence and impact of workplace injuries.
As a statutory requirement, the Employment Equity Act is reviewed by Parliament every five years, with the next review expected during 2006. The review is conducted by the Standing Committee responsible for the Act. Federal partners, such as the Canadian Human Rights Commission and the Public Service Human Resources Management Agency collaborate in the review. It is expected that the Minister of Labour will present a five-year report, which would include a summary of progress since the last review.
The Wage Earner Protection Act was adopted in November, 2005, to restore wages and vacation pay owed to unpaid workers whose employers are declared bankrupt or are subject to receivership under the Bankruptcy and Insolvency Act. The Act is not yet in force and work remains to be done involving the Labour Program and Service Canada, as well as provincial labour ministries, to design and implement the program.
LABOUR: PRIORITIES AND PLANS
| Priority: Complete a comprehensive review of Part III (Labour Standards) of the Canada Labour Code |
|
Plans:
|
| Priority: Develop policy options for a modernized Federal Workers' Compensation System including a Federal Disability Management Strategy |
|
Plans:
|
| Priority: Complete preparations for the Wage Earner Protection Program |
|
Plans:
|
| Priority: Parliamentary review of the Employment Equity Act |
|
Plans:
|
| Strategic Outcome | Safe, healthy, fair, stable, cooperative, productive workplaces and effective international labour standards |
| 2006-2007 Priorities |
|
| Program Activity Expected Results |
|
| Program Indicators |
|
| Programs |
|
| Resources | PLANNED SPENDING: $249.2 million FTE: 904 |
LABOUR: PROGRAMS SUPPORTING PRIORITIES
The Labour Program activity promotes and sustains stable industrial relations and a safe, fair, healthy, equitable and productive workplace within the federal labour jurisdiction. At the national level, it collects and disseminates labour and workplace information, undertakes policy development and promotes coordination among Canadian labour jurisdictions. Finally, it manages Canada's international labour affairs. http://www.hrsdc.gc.ca/en/gateways/nav/top_nav/program/labour.shtml
Federal Mediation and Conciliation Service: This service is responsible for providing dispute resolution and dispute prevention assistance to trade unions and employers under the jurisdiction of Part I (Industrial Relations) of the Canada Labour Code; and fosters constructive labour-management relationships economy-wide. http://www.hrsdc.gc.ca/asp/gateway.asp?hr=en/lp/fmcs/11Federal_Mediation_and_Conciliation_Service.shtml&hs
National Labour Operations: Through its National Headquarters and five Regions, this directorate is responsible for enforcement of laws and regulations under Part II (Occupational Health and Safety) and Part III (Labour Standards) of the Canada Labour Code, as well as the Employment Equity Act, Federal Contractors Program for Employment Equity, Fair Wages and Hours of Labour Act, and the Non-smokers' Health Act. National Labour Operations is also responsible for administering the Government Employees' Compensation Act and the Merchant Seamen Compensation Act. Additionally, it administers Fire Protection Services on behalf of the Treasury Board. http://hrsdc.gc.ca/en/gateways/nav/top_nav/program/labour.shtml
International and Intergovernmental Labour Affairs: This directorate promotes the development, observance and effective enforcement of internationally recognized labour principles, fosters cooperation and coordination among labour jurisdictions in Canada on national and international labour issues, and facilitates dialogue with program stakeholders. http://hrsdc.gc.ca/en/gateways/nav/top_nav/program/labour.shtml
Workplace Policy and Information: This directorate identifies emerging trends and changes in the workplace and provides policy development and leadership in labour policy, manages a national data base of collective agreements, conducts research on employment relationships, and disseminates key information, research and analysis. This directorate is also responsible for designing and implementing the Wage Earner Protection Program. Once finalized, funds for delivering the program will be transferred to Service Canada. http://hrsdc.gc.ca/en/gateways/nav/top_nav/program/labour.shtml
LABOUR: FINANCIAL AND HUMAN RESOURCES - PLANNED SPENDING
| Planned Spending | |||
| 2006-2007 | 2007-2008 | 2008-2009 | |
| Financial Resources (in millions of dollars) | |||
| Gross Operating Expenditures | 90.6 | 92.9 | 93.2 |
| Non-Statutory Grants and Contributions | 3.9 | 3.9 | 3.9 |
| Statutory Grants and Contributions | 28.7 | 28.7 | 28.7 |
| Workers' Compensation Payments | 126.0 | 129.0 | 131.0 |
| Total | 249.2 | 254.5 | 256.8 |
| Human Resources | |||
| Full Time Equivalents | 904 | 916 | 920 |
| 2006-2007 | 2007-2008 | 2008-2009 | |
| Financial Resources (in millions of dollars) | |||
| Federal Mediation and Conciliation Service | 7.9 | 8.0 | 8.0 |
| National Labour Operations | 171.1 | 174.8 | 176.7 |
| International and Intergovernmental Labour Affairs | 5.9 | 5.9 | 5.9 |
| Workplace Policy and Information | 36.1 | 36.1 | 36.1 |
| Allocated Corporate Servicesa | 26.8 | 28.3 | 28.7 |
| Other | 1.4 | 1.4 | 1.4 |
| Total | 249.2 | 254.5 | 256.8 |
| Human Resources | |||
| Full Time Equivalents | 904 | 916 | 920 |
| a. Corporate Services resources related to the Minister's Office, the Deputy Minister's Office, the Comptroller's Office and the Shared Services have been prorated to each Strategic Outcome. | |||
Labour Program Activity - Modifications from the 2005-2006 Program Activity Architecture
- The former sub-activities Intergovernmental Affairs and International Labour Affairs have been combined under a new program sub-activity called International and Intergovernmental Labour Affairs.
- The former program sub-activity Aboriginal Labour Affairs has been removed.
STRATEGIC OUTCOME
ENHANCED INCOME SECURITY, ACCESS TO OPPORTUNITIES AND WELL-BEING FOR INDIVIDUALS, FAMILIES AND COMMUNITIES
Canada's economic prosperity, its vibrant labour market, and the positive outlook for our country's future are closely linked to the security and well-being of Canadians, their families and communities. The means by which individuals attain income security, care for and support a family and participate in their community contributes to the extent of their well-being and inclusion in Canadian society.
HRSDC continues to build and enhance social investments for Canadians. Core social programs that focus on children, seniors, people with disabilities and the homeless population are continuously being reassessed to ensure they continue to meet the changing needs of Canadians. Where gaps are identified, new programs are being developed to address the needs of Canadians - for example, Canada's Universal Child Care Plan, which is designed to provide families with choice in child care to help meet the needs of families with children under six years old.
Despite current economic successes, Canada still faces many social challenges that require our full attention and support. Individuals, families and communities are experiencing diverse impacts from a variety of different sources, such as changing family structures and dynamics, an aging population, the challenge of securing adequate income, and safe and affordable housing. HRSDC is working with stakeholders, provinces and territories to address and develop collaborative solutions to these challenges.
In support of this strategic outcome, HRSDC will focus its efforts on providing support to Canadians so they can enhance their income security, access to opportunities and well-being. HRSDC's priorities and plans are reflected in three key program activities: Social Investment, Children and Families, and Housing and Homelessness.
PROGRAM ACTIVITY: SOCIAL INVESTMENT
HRSDC has a number of important programs that are vital to enhance social investments for Canadians. These programs are situated in the following areas: Seniors and Pensions; Disability Programs; Canada Pension Plan Disability; and Community Development and Partnerships.
Seniors and Pensions
HRSDC provides income support to seniors through the Canada Pension Plan (CPP) and the Old Age Security (OAS) benefit programs. The Department's stewardship of CPP and OAS ensures that 4.6 million seniors have a stable source of retirement income.
As the federal government focal point for seniors issues, HRSDC has established the Seniors and Pensions Policy Secretariat to coordinate efforts to define and address the issues and opportunities created by the growing seniors population. Actions to date include the work of the Federal/Provincial/Territorial Forum of Ministers Responsible for Seniors, the Interdepartmental Committee of federal government departments and agencies with responsibilities for seniors, and continuing efforts to engage seniors and stakeholder organizations on relevant matters to seniors.
In 2006-2007, HRSDC will continue to develop an action plan for seniors that considers the needs and opportunities presented by the current and future generations of seniors. In addition to this action plan, HRSDC will develop a Seniors Council to advise the Minister on issues of national importance.
Ongoing consideration of potential adjustments to Canada's public pensions will continue, to ensure that they meet the current and future social and economic needs of beneficiaries. These efforts will take place as part of the regular triennial review of the CPP, as well as activities that may culminate in legislation to amend the Old Age Security Act.
Efforts will also be directed to ensure that Canadians are well informed through awareness activities undertaken by Service Canada of Canada's retirement income system and their entitlements to benefits. Particular emphasis will be placed on reaching out to vulnerable communities (including homeless people, Aboriginal people living on-reserve, persons with incapacities, and immigrants), as well as younger Canadians, to ensure that they understand their role in saving for retirement.
With fifty international social security agreements now signed, efforts will be made to ensure that those existing agreements continue to serve the needs of seniors both in Canada and abroad. Canada's agreements with Estonia, Latvia and Lithuania were signed in 2005 and will enter into force on November 1, 2006. An agreement with Japan was signed early in 2006 and is expected to enter into force in late 2007. The Department is currently revising an existing agreement with Norway. In addition, HRSDC will continue to identify countries that have commensurate pension systems with which the Department can coordinate its benefits. In 2006-2007, these include Poland, Serbia, Macedonia and Israel.
| INDICATORS | CURRENT LEVEL |
| Number and proportion of individuals aged 65 years+, who had low family income | 258,400 6.8% (2003) |
| Number and proportion of individuals aged 65 years+ who would have had low income without public support | 1,995,800 52.4% (2003) |
| Average income by which low-income individuals aged 65+ fall short of the relevant LICO threshold if public pension support is removed | 2003 $3,488 |
| Average combined annual CPP/OAS/GIS payments for persons over 65 years of age represented as percentage of annual Average Industrial Earnings | 2005 40.5% |
| Proportion of income provided by the OAS program as a percentage of total post-retirement income for seniors | 2003 23.1% |
| Proportion of income provided by the OAS program as a percentage of total post-retirement income for low-income seniors | 2003 58.0% |
| Proportion of income provided by the CPP program as a percentage of total postretirement income for seniors | 2003 18% |
| Persons living in Canada receiving a benefit from another country as a result of a Social Security Agreement | 2004 170,936 |
| Contribution of the CPP-Disability Program to income support of beneficiaries as measured by total disability payments as a percentage of total net income received from all sources (measure every three years from tax data) | New measure to establish baseline |
Disability Programs
HRSDC is the lead department for the Government of Canada on matters affecting people with disabilities. The Office for Disability Issues (ODI) will provide a national focal point within the Government of Canada for partners working to promote the full participation of people with disabilities in all aspects of society and community life. HRSDC will strive to improve awareness, coherence, and horizontal management of disability issues within the Department, and across the Government of Canada. ODI will also serve as a model of accessibility for the federal government, and provide leadership by example to promote accessible workplaces throughout the government.
Through the development and release of the Federal Disability Report, and in collaboration with Statistics Canada on the Participation and Activity Limitation Survey 2006, HRSDC will support the development and sharing of knowledge on disability matters to inform policy and program development. HRSDC will also continue to build awareness and engage partners, citizens, and provincial and territorial partners in improving disability policy and programming.
CPP - Disability
The enhanced social and economic participation of people with disabilities is also supported through the disability benefits that are payable to eligible individuals under the Canada Pension Plan. The Canada Pension Plan Disability Program is Canada's largest long-term disability insurance plan. In 2005-2006, $3 billion in benefits were paid to 291,000 individuals and 84,000 of their children. With respect to the Minister's responsibility for the CPP/OAS appeals system, ensuring a fair and timely resolution of reviews and appeals, and identifying improvements to the process, in consultation with the two arms-length administrative tribunals, remains a priority. Approximately 62,000 new applications were received in 2005-2006. Policy priorities focus on contributing to the disability component of the CPP Triennial Review regarding adjustments to Canada's public pensions to ensure they meet the current and future needs of beneficiaries. A continuum of supports is being re-designed to better assist beneficiaries who are trying to return to employment. Improving coordination mechanisms with private insurers, provincial social assistance and workers' compensation boards on behalf of mutual clients is an important priority. Building the research and evidence base of the Canada Pension Plan Disability Program will be accomplished through a number of priority activities in 2006-2007.
Community Development and Partnerships
HRSDC is committed to supporting non-profit community sector efforts to innovate, strengthen networks of collaboration, develop capacity and share good practices to contribute to community well-being. During 2006-2007, HRSDC will continue to work on a range of activities that are designed to assist communities through the Department's grants, contributions and various funding vehicles. For instance, the New Horizons for Seniors Program (NHSP) will continue to increase the social participation and contribution of seniors to their communities and reduce the isolation of vulnerable seniors.
The Understanding the Early Years Initiative (UEY) is currently underway in twenty-one countries across Canada. In 2006-2007 a number of new communities will be selected to participate in the UEY initiative.
HRSDC's Social Development Partnerships Program (SDPP) will continue to support non-profit community organizations that are concerned with advancing the social development needs of people with disabilities, children and their families, and other vulnerable or excluded populations in Canada.
The Department will continue to act on its commitment under the Official Languages Action Plan to strengthen the capacity of national non-governmental organizations to promote linguistically and culturally sensitive early learning and child care policies, programs and services for families in official language minority communities.
SOCIAL INVESTMENT: PRIORITIES AND PLANS
| Priority: Enhance income security and active participation in communities |
|
Plans:
|
| Priority: Break down barriers to full participation in the richness of Canadian life and communities |
|
Plans:
|
| Priority: Support non-profit community sector efforts to innovate, strengthen networks of collaboration, develop capacity and share good practices to contribute to community well-being |
|
Plans:
|
| Strategic Outcome | Enhanced income security, access to opportunities and well-being for individuals, families and communities |
| 2006-2007 Priorities |
|
| Program Activity Expected Results |
|
| Program Indicators |
|
| Programs |
|
| Resources | PLANNED SPENDING: $57,141.4 million FTE: 767 |
SOCIAL INVESTMENT: PROGRAMS SUPPORTING PRIORITIES
The Social Investment program activity supports Canadians through pension and disability policies and programs, and contributes to enhancing community development through partnerships and innovation.
Old Age Security Program (OAS): OAS benefits provide basic income to Canadian citizens and residents who meet age, residence and legal status requirements. It is financed from Government of Canada general tax revenues and indexed quarterly to the Consumer Price Index. Recognizing the difficult financial circumstances faced by many seniors, OAS provides additional income-tested benefits for low-income individuals, namely the Guaranteed Income Supplement (GIS), the Allowance and the Allowance for the Survivor.
- The GIS is a monthly benefit available to OAS pensioners with little to no other income. The amount of the benefit is dependent upon marital status, residence and income.
- The Allowance is available to qualified 60 to 64 year-old spouses and common-law partners of OAS/GIS pensioners.
- The Allowance for the Survivor is available to low-income individuals aged 60 to 64 whose spouse or common-law partner is deceased and who have not re-married nor entered into a common-law relationship.
The Canada Pension Plan (CPP) is a joint federal-provincial plan that operates throughout Canada, except in Quebec, which has its own comparable plan. The CPP provides for a variety of benefits based on life changes. Best known for its retirement pensions, the CPP also provides benefits for surviving partners and children of CPP contributors, people with disabilities and their children (a description of CPP - Disability is below), and a one-time maximum benefit of $2,500 in the event of death. It is a contributory plan; contributors are employees or self-employed persons between the ages of 18 and 70 who earn at least a minimum amount during a calendar year. Benefits are calculated based on how much and for how long a contributor has paid into the CPP. Benefits are not paid automatically - everyone must apply and provide proof of eligibility. Approximately 12 million Canadians over the age of 18 currently contribute annually to the Plan and approximately 4 million Canadians will receive benefits during 2005-2006.
The Canada Pension Plan Disability (CPP - D) benefits are payable to contributors who meet the minimum contributory requirements and whose disability is "severe and prolonged," as defined in the legislation; that is, a mental or physical disability that prevents them from working regularly at any job at a substantially gainful level. In determining an individual's medical eligibility, additional consideration is given to personal characteristics such as age, education and work experience. Socio-economic factors such as the availability of work are not. Children of CPP disability beneficiaries are also eligible for a flat rate monthly benefit up to the age of 18, or up to age 25 if attending school full-time.
The Opportunities Fund for Persons with Disabilities (OF) is designed to assist people with disabilities who are otherwise ineligible for employment programs available through the Employment Insurance program to return to work. Funding under OF assists eligible people with disabilities to prepare for and obtain employment or self-employment as well as to develop the skills necessary to maintain that new employment. OF also supports effective and innovative activities such as encouraging employers to provide individuals with work opportunities and experience; assisting individuals to increase their employment skill level and helping individuals to start their own business; and working in partnership with organizations for people with disabilities, including the private sector, to support innovative approaches to integrate individuals with disabilities into employment or self-employment, and address barriers to an individual's labour market participation
Labour Market Agreements for Persons with Disabilities (LMAPD): The goal of the Labour Market Agreements for Persons with Disabilities is to improve the employment situation of Canadians with disabilities, by enhancing their employability, increasing the employment opportunities available to them, and building on their existing knowledge base. LMAPDs facilitate coordination in labour market programming targeted to person with disabilities through agreements with provinces.
The Social Development Partnerships Programs (SDPP) is a national, centrally managed and delivered funding program that provides grants and contributions to non-profit sector organizations that are concerned with advancing the social development and inclusion needs of people with disabilities, children and their families, and other vulnerable or excluded populations. SDPP funding helps to strengthen networks among not-for-profit organizations and enables them to expand their reach nationally, regionally and locally; to increase the availability and dissemination of information and to support knowledge sharing and the identification of best practices.
The New Horizons for Seniors Program (NHSP) supports local projects across Canada that encourage seniors to contribute to their communities through social participation and active living. The program encourages seniors to contribute their skills, experience and wisdom in support of social well-being in their communities, and promotes the ongoing involvement of seniors in their communities to reduce their risk of social isolation. NHSP funding also strengthens networks and associations among community members, community organizations, and governments; and enhance opportunities for building community capacity and partnerships to respond to existing or emerging social challenges.
The Understanding the Early Years (UEY) helps communities across Canada better understand the needs of their young children and families. UEY is a national initiative providing communities with information about the readiness to learn of their children, community factors influencing child development, and local resources available to support young children and their families. Communities can use this information to create and deliver policies, programs, or investments that help their children thrive in the early years.
PROGRAM ACTIVITY: CHILDREN AND FAMILIES
The Government of Canada has introduced a new approach to child care to give parents the flexibility to choose the option that best suits their needs. Canada's Universal Child Care Plan recognizes families as the key building block of society and gives parents the flexibility to balance work and family as they see fit.
Effective July 1, 2006, all families are eligible to receive $1,200 per year for each child under six, to be taxable in the hands of the lower-income spouse. New measures will also be introduced to encourage initiative by employers, non-profit and community organizations to create child care spaces. By allocating up to $250 million per year, these new measures aim to create 25,000 new child care spaces per year and will be designed to ensure access by families in cities and rural communities, and by those parents with non-standard work hours.
HRSDC will continue to support children and families through the National Child Benefit, which helps to ensure children in low-income families are supported in achieving their full potential. Also, as noted earlier, HRSDC will provide policy advice on the development of a complementary Aboriginal strategy on early learning and childcare, in partnership with other departments, including Indian and Northern Affairs and Health Canada.
HRSDC is responsible for policy development with respect to the National Child Benefit, and the Minister of Human Resources and Social Development represents the Government of Canada in this federal/provincial/territorial initiative.
| INDICATORS | CURRENT LEVEL | |
| Percentage of children 4-5 years of age displaying normal to advanced development | 2002-2003 | |
| 86.9% of children 4 to 5 years of age displayed average to advanced levels of verbal development. | ||
| Distribution of children 0-6 by type of primary care arrangement | 2002-2003 | |
| Parental Care | 47% | |
| Non-Parental Care | 53% | |
| Care in someone else's home | 45.9% | |
| Care in child's home | 21.6% | |
| Daycare centre | 27.8% | |
| Other | 4.7% | |
| Percentage of children for whom there is a regulated child care space (broken down by children ages 0-5 and 6-12) | 2004 Approximately: | |
| Children 0-12 | 15.5% | |
| Children under age 6 | 24% | |
| School age children 6-12 | 9.3% | |
| Percentage of children ages 0-5 displaying behaviour problems | 2002-2003 | |
| Emotional problems-anxiety: 16.7% of children 2 to 5 years of age displayed signs associated with emotional problems-anxiety | ||
| Hyperactivity/Inattention: 5.5% of children 2 to 5 years of age displayed behaviour associated with hyperactivity or inattention | ||
| Aggression/Conduct Problems: 14.6% of children 2 to 5 years of age displayed signs of aggression or conduct problems | ||
| Age-appropriate personal and social behaviour: 15.7% of children from birth to 3 years of age did not display age-appropriate personal and social behaviour | ||
| Percentage of children living in families exhibiting positive family functioning | 2002-2003 | |
| 90.2% of children from birth to 5 years of age lived in well-functioning families | ||
CHILDREN AND FAMILIES: PRIORITIES AND PLANS
| Priority: Provide support and choices for families, through Canada's new Universal Child Care Plan and other existing initiatives, to help ensure their children have the best possible start in life |
|
Plans:
|
| Strategic Outcome | Enhanced income security, access to opportunities and well-being for individuals, families and communities |
| 2006-2007 Priorities |
|
| Program Activity Expected Results |
|
| Program Indicators |
|
| Programs |
|
| Resources | PLANNED SPENDING: $2,282.8 million FTE: 105 |
CHILDREN AND FAMILIES: PROGRAMS SUPPORTING PRIORITIES
The Children and Families program activity supports work that ensures all children have the best possible start in life and that enhances the support and choices for families.
Canada's Universal Child Care Plan:
The Government of Canada has introduced Canada's Universal Child Care Plan consisting of two key elements designed to give parents choice in child care so they can balance work and family life.
- Universal Child Care Benefit: Effective July 2006 all families are eligible to receive up to $1,200 per year for each child under six, to be taxable in the hands of the lower-income spouse. Payments are made directly to parents so that they can choose the child care that is best for their children and their family's needs. The Universal Child Care Benefit is provided in addition to existing federal programs such as the Canada Child Tax Benefit, the National Child Benefit Supplement and the Child Care Expense Deduction and will not affect the benefits families receive under these programs. Further information can be found at www.universalchildcare.ca.
- Child Care Spaces Initiative: In the May 2, 2006 Federal Budget, the Government of Canada committed to investing $250 million per year,beginning in 2007 - 08, to support the creation of new child care spaces, in cooperation with provinces and territories, employers and community non-profit organizations. The goal is to create up to 25,000 additional spaces each year for families that are flexible, responding to a variety of needs such as shift work, seasonal labour, and families living in rural communities. Work on the development of this initiative will proceed through 2006, including consultations.
Multilateral Framework on Early Learning and Child Care: Building on the September 2000 Early Childhood Development Agreement, federal/provincial/territorial Ministers Responsible for Social Services19 reached agreement in March 2003, on a framework for improving access to affordable, quality, provincially and territorially regulated early learning and child care programs and services. The specific objectives of the Multilateral Framework on Early Learning and Child Care are to further promote early childhood development and support the participation of parents in employment or training by improving access to affordable, quality early learning and child care programs and services.
In support of these objectives, the Government of Canada is providing $1.05 billion over five years through the CST to support provincial and territorial government investments in early learning and child care. Early learning and child care programs and services funded through this initiative will primarily provide direct care and early learning for children in settings such as child care centres, family child care homes, preschools, and nursery schools. Investments can include capital and operating funding, fee subsidies, wage enhancements, training, professional development and support, quality assurance, and parent information and referral. Governments report annually on their activities and expenditures related to this agreement. Further information can be found at www.ecd-elcc.ca
Early Childhood Development Agreement: In September 2000, the Government of Canada and provincial and territorial governments reached an agreement, the Federal/Provincial/Territorial Early Childhood Development (ECD) Agreement, to improve and expand the services and programs they provide for children under 6 years of age and their families.20 The overall goal of the initiative is to improve and expand early childhood development supports for young children (prenatal to age 6) and their parents. The specific objectives are:
- to promote early childhood development so that, to their fullest potential, children will be physically and emotionally healthy, safe and secure, ready to learn and socially engaged and responsible
- to help children reach their potential and to help families support their children within strong communities
In support of these objectives, the Government of Canada is transferring $500 million per year, via the Canada Social Transfer, to provincial and territorial governments to improve and expand programs and services in four key areas: promoting healthy pregnancy, birth and infancy; improving parenting and family supports; strengthening early childhood development, learning and care; and strengthening community supports. To track progress, governments report annually on their activities and expenditures and biennially on a common set of indicators of young children's well-being. Further information on the initiative can be found at http://www.ecd-elcc.ca/
National Child Benefit - Introduced in 1998 as a supplement to the Canada Child Tax Benefit,21 the National Child Benefit initiative is a key commitment in helping to ensure that children in low-income families are supported in achieving their full potential is the National Child Benefit initiative. The National Child Benefit is a partnership among federal, provincial, and territorial governments22, including a First Nations component, which provides income support, as well as benefits and services, to low-income families with children. The National Child Benefit aims to: help prevent and reduce the depth of child poverty; promote attachment to the labour market by ensuring families are always better off as a result of working; and reduce overlap and duplication by harmonizing program objectives and benefits and simplifying administration. Under this initiative, the Government of Canada provides income support to low-income families with children through the NCB Supplement. Human Resources and Social Development Canada is responsible for policy development with respect to the National Child Benefit, and the Minister of Human Resources and Social Development represents the Government of Canada in this federal/provincial/territorial initiative. The implementation of the National Child Benefit and how effective it has been at meeting its objectives is monitored through annual progress reports and joint federal-provincial-territorial evaluations. These reports are available on the National Child Benefit website: http://www.nationalchildbenefit.ca/
SOCIAL INVESTMENT, AND CHILDREN AND FAMILIES: FINANCIAL AND HUMAN RESOURCES - PLANNED SPENDING23
| Planned Spending | |||
| 2006-2007 | 2007-2008 | 2008-2009 | |
| Financial Resources (in millions of dollars) | |||
| Gross Operating Expenditures | 160.3 | 150.1 | 149.7 |
| Non-Statutory Grants and Contributions | 296.6 | 303.3 | 306.5 |
| Statutory Grants and Contributions: | |||
| Old Age Security | 23,255.0 | 24,139.0 | 25,285.0 |
| Guaranteed Income Supplement | 6,820.0 | 7,219.0 | 7,512.0 |
| Allowances | 500.0 | 537.0 | 568.0 |
| Universal Child Care Benefit | 1,610.0 | 2,085.0 | 2,065.0 |
| Child Care - Prov./Terr. Agreements | 650.0 | - | - |
| New Child Care Spaces | - | 250.0 | 250.0 |
| Total Statutory Grants and Contributions: | 32,835.0 | 34,230.0 | 35,680.0 |
| Sub-Total | 33,291.9 | 34,683.4 | 36,136.2 |
| CPP Benefits | 26,132.3 | 27,496.9 | 28,917.7 |
| Total | 59,424.2 | 62,180.3 | 65,053.9 |
| Human Resources | |||
| Full Time Equivalents | 872 | 884 | 884 |
| 2006-2007 | 2007-2008 | 2008-2009 | |
| Financial Resources (in millions of dollars) | |||
| Social Investment | |||
| Seniors and Pensions | 53,248.3 | 55,779.3 | 58,514.7 |
| Disability Programs | 274.0 | 269.0 | 268.9 |
| Canada Pension Plan - Disability | 3,523.3 | 3,674.0 | 3,829.0 |
| Community Development and Partnerships | 52.6 | 59.5 | 62.4 |
| Allocated Corporate Servicesa | 43.2 | 40.4 | 40.7 |
| Sub-Total | 57,141.4 | 59,822.2 | 62,715.7 |
| Children and Families | |||
| Child Care | 1,610.0 | 2,085.0 | 2,065.0 |
| Multilateral Framework for Early Learning and Child Care | 650.0 | 250.0 | 250.0 |
| Early Childhood Development Agreements | 3.5 | 3.5 | 3.5 |
| National Child Benefit | 2.4 | 2.4 | 2.4 |
| Allocated Corporate Servicesa | 5.4 | 5.7 | 5.8 |
| Other | 11.5 | 11.5 | 11.5 |
| Sub-Total | 2,282.8 | 2,358.1 | 2,338.2 |
| Total | 59,424.2 | 62,180.3 | 65,053.9 |
| Human Resources | |||
| Full Time Equivalents | 872 | 884 | 884 |
| a. Corporate Services resources related to the Minister's Office, the Deputy Minister's Office, the Comptroller's Office and the Shared Services have been prorated to each Strategic Outcome. | |||
Social Investment Program Activity - Modifications from the 2005-2006 Program Activity Architecture:
- The former program activity Social Investment has been split into two program activities: Social Investment, and Children and Families.
- The former sub-activity Seniors has been changed to Seniors and Pensions.
- The former program sub-activity Persons with Disabilities has been changed to Disability Programs.
- CPP - Disability has been moved to a sub-activity and includes Disability Benefits and Appeals.
- The sub-activity Community-based Grants and Contributions has been changed to Community Development and Partnerships.
- The former sub-activity Appeals has been moved under Canada Pension Plan - Disability.
Children and Families Program Activity - Modifications from the 2005-2006 Program Activity Architecture:
- A new sub-activity for Child Care has been added. The sub-activity includes two key governmental priorities: the Universal Child Care Benefit and the Child Care Spaces Initiative.
- The Multilateral Framework for Early Learning and Childcare was moved to a sub-activity.
- The Early Childhood Development Agreement was moved to a sub-activity.
- The National Child Benefit was moved to a sub-activity.
- Former activities CPP Benefits for Children with Disability Beneficiaries, CPP Orphans, and CPP Survivor have been subsumed under the activity Canada Pension Plan - Disability.
PROGRAM ACTIVITY: HOUSING AND HOMELESSNESS
In December 1999, the federal government launched the three-year National Homelessness Initiative (NHI)24 to deal with a growing national crisis of homeless people on the streets of Canada. In 2003, the NHI was renewed for another three years to provide communities with the tools to plan and implement local strategies to help reduce homelessness. In November 2005, the government announced a one-year extension (2006-2007) of the NHI, with funding in the amount of $134.8 million, to sustain vital, healthy communities through investments in successful housing and homelessness initiatives. The NHI extension will ensure that essential shelters and related support services for homeless people are maintained in urban and rural communities across Canada.
The NHI makes strategic investments in 61 designated communities as well as in small, rural and Aboriginal communities across Canada to build a continuum of supports and services that helps homeless and at-risk people in those communities to move towards self-sufficiency. The Housing and Homelessness Branch (formerly the National Secretariat on Homelessness) and the communities collaborate in broadening and increasing partnerships - with a focus on the corporate sector, unions and foundations to ensure the long-term sustainability of community efforts. All of this work has led to increased community capacity in the areas of planning, decision-making, networking and information-sharing to find local solutions to address homelessness.
The NHI continues its work to overcome a national situation in which more than 150,000 Canadians use homeless shelters every year. In addition, countless others are on the streets or are the "hidden homeless" - people living with friends and family, or sleeping in cars, away from the public eye and outside of the shelter system. As well, over half a million Canadians spend more than 50% of their income on housing, putting them at high risk of becoming homeless. The diverse sub-population of homeless Canadians includes those with mental health and/or addiction problems, lone-parent families headed by women, youth, victims of family violence, refugees and recent immigrants, ex-offenders, the working poor, and Aboriginal people. Across Canada, especially in major urban centres, Aboriginal people are significantly over-represented in the homeless population.
| INDICATORS | CURRENT LEVEL |
| Percentage of overall SCPI funding, for projects completed in 2005-2006, between: | |
| (a) emergency shelters | 35% |
| (b) transitional housing and supportive housing | 65% |
| Number of National Homelessness Initiative funding partners in 2005-2006 | 385* |
| Percentage of National Homelessness Initiative funding partners by Sectors for 2005-2006. | Non-profit 34% |
| Sponsor/Organization/Recipient (internal fundraising) 20% | |
| All orders of Government (e.g. federal/agencies, provincial/territorial, regional/municipal) 24% | |
| Private Sector 10% | |
| Others (such as faith-based communities, unions, etc.) 12% | |
| * In previous years, a cumulative total was reported. | |
The NHI is making a concerted effort to improve horizontality by working with other federal departments to achieve shared outcomes, recognizing that the key is finding the appropriate accountability and delivery instruments. In the area of health, the NHI is involved with the Canadian Institute on Health Research (CIHR), through funding of various projects and is extensively involved with the Reducing Disparities Initiative at CIHR. The Department signed a Memorandum of Understanding with the Public Health Agency of Canada's Strategic ProjectsBranch to jointly fund the "train the trainer" program on Fetal Alcohol Spectrum Disorder.
Canada Mortgage and Housing Corporation (CMHC) is now part of the portfolio of the Minister of HRSD. Work has been undertaken to ensure greater complementarity of the NHI's programs, the Affordable Housing Initiative and the Residential Rehabilitation Assistance Program. The Department is renewing its agreement with CMHC on general research issues and data sharing and data integration. Other collaborative initiatives include the HRSDC-led Action for Neighbourhood Change project, where agreements have been signed with other federal departments including Health Canada, Public Safety and Emergency Preparedness Canada.
HOUSING AND HOMELESSNESS: PRIORITIES AND PLANS
| Priority: Contribute to the reduction of homelessness in Canada |
|
Plans:
|
| Priority: Develop homelessness and housing policies for Canadians, including Aboriginal peoples |
|
Plans:
|
| Priority: Strengthen horizontal links between housing and homelessness and other policy areas |
|
Plans:
|
| Strategic Outcome | Enhanced income security, access to opportunities and well-being for individuals, families and communities |
| 2006-2007 Priorities |
|
| Program Activity Expected Results |
|
| Program Indicators |
|
| Programs |
|
| Resources | PLANNED SPENDING: $188.1 million FTE: 383 |
HOUSING AND HOMELESSNESS: PROGRAMS SUPPORTING PRIORITIES
The Housing and Homelessness program activity assists communities, through partnerships, in implementing measures - such as shelters, supportive and transitional housing, and related support services - that help homeless individuals and families as well as those at risk of homelessness move toward self-sufficiency, thereby contributing to society and the economy. http://www.homelessness.gc.ca/home/index-eng.asp
Supporting Communities Partnership Initiative (SCPI) increases the availability of and access to a range of services and facilities (emergency shelters, transitional/supportive housing, and prevention) along the continuum from homelessness to self-sufficiency and an independent lifestyle. Projects funded by the SCPI support the priority areas identified through an inclusive community planning process. Along with providing financial support to communities, the SCPI encourages them to work in partnership with provincial/territorial and municipal governments as well as the private and voluntary sectors to strengthen existing capacity and to develop integrated responses to homelessness. Communities are allocated a maximum funding level that must be matched from other community sources (i.e. fundraising, local sponsors, etc.). Communities must also explain how their activities are sustainable (i.e. how they will continue once SCPI funding ends). http://www.homelessness.gc.ca/initiative/scpi-eng.asp
Urban Aboriginal Homelessness (UAH): Aboriginal homelessness is a serious issue in some communities and is best addressed by developing local responses. The NHI will continue to address the unique needs of the Aboriginal population through its UAH component. This component provides flexibility to meet the needs of off-reserve homeless Aboriginal people, through culturally sensitive services. Enhancing capacity building - both within and outside of Aboriginal communities - through community planning, decision making and the formulation of partnerships is a key UAH focus. Cost matching is not required; however, community contributions will be encouraged where and when possible. The Housing and Homelessness Branch works with the Federal Interlocutor Division of Indian and Northern Affairs Canada to ensure the complementarity of the Urban Aboriginal Strategy pilot projects and the NHI's UAH component. http://www.homelessness.gc.ca/initiative/uah-eng.asp
Homeless Individuals and Families Information System (HIFIS): There is little credible information nor reliable methodology to determine the exact number of homeless people in Canada, the extent of homelessness-related supports and services provided by shelters, and the diversity of these shelters' clientele. To better address these knowledge gaps, HIFIS gives service providers an electronic data management system that enables them to share information and develop partnerships at the local, private, municipal, provincial/territorial and federal levels. It assists communities in longer-term planning efforts and capacity building to address their local homelessness challenges. The benefits resulting from a network of data-sharing communities will contribute to the development of a national database. This database will provide a better understanding of the size and scope of the shelter homeless population, guide policy development, and help in further transforming management practices within the shelter system. http://www.homelessness.gc.ca/initiative/hifis-eng.asp
The National Research Program (NRP) addresses the gaps and priorities in knowledge about homelessness in Canada. The program works to: further increase the base of policy and community-relevant research; encourage and support research partnerships (with research and community organizations, other federal departments, and academic researchers); and facilitate the sharing of best practices and transfer of knowledge. By providing funding to partners to strengthen their capacity to develop a deeper understanding of homelessness, the NRP helps foster the development and assessment of appropriate and effective solutions to homelessness at the local and national levels. This is vital to making efficient use of scarce resources and sustaining community efforts over the long term. http://www.homelessness.gc.ca/initiative/nrp-eng.asp
The Regional Homelessness Fund (RHF) provides support to small and rural communities that are experiencing local homelessness, but often lack capacity to respond. Homeless individuals or those at risk of homelessness must often move to larger urban centres to obtain homelessness-related supports and services. This in turn can place a burden on the service systems of these larger communities. The RHF provides funding to establish support services needed to prevent homelessness and to help stabilize the living conditions of at-risk individuals and families. The fund also encourages a wide range of partnerships and takes the unique needs of youth populations into consideration in the planning and implementation process. http://www.homelessness.gc.ca/initiative/rhf-eng.asp
Surplus Federal Real Property for Homelessness Initiative (SFRPHI) provides surplus federal properties to communities across Canada to address their local homelessness-related needs through Housing and Homelessness Branch (HHB) coordination. The homelessness projects, which must be financially viable and sustainable, help communities overcome the high capital costs of buying land or buildings. Government departments and agencies, which are encouraged to identify such properties, receive compensation at market value and transfer them - to community organizations, the not-for-profit sector and other orders of government - for a nominal cost to help alleviate and prevent homelessness. Additional funding for construction and renovation costs may also be available through related federal programs such as SCPI and Canada Mortgage and Housing Corporation (CHMC) programs. Three Government of Canada organizations - Public Works and Government Services Canada, Human Resources and Social Development and CMHC - act as partners at the national and regional levels in implementing and managing this initiative. http://www.homelessness.gc.ca/initiative/sfrphi-eng.asp
HOUSING AND HOMELESSNESS: FINANCIAL AND HUMAN RESOURCES - PLANNED SPENDING
| Planned Spending | |||
| 2006-2007 | 2007-2008 | 2008-2009 | |
| Financial Resources (in millions of dollars) | |||
| Gross Operating Expenditures | 40.2 | 3.3 | 3.3 |
| Non-Statutory Grants and Contributions | 147.9 | 0.0 | 0.0 |
| Total | 188.1 | 3.3 | 3.3 |
| Human Resources | |||
| Full Time Equivalents | 383 | 12 | 12 |
| 2006-2007 | 2007-2008 | 2008-2009 | |
| Financial Resources (in millions of dollars) | |||
| Supporting Communities Partnership Initiative | 133.0 | 2.2 | 2.2 |
| Urban Aboriginal Homelessness | 18.2 | - | - |
| Regional Homelessness Fund | 5.4 | - | - |
| National Research Program | 2.8 | - | - |
| Homeless Individuals and Families Information System | 2.1 | - | - |
| Surplus Federal Real Property for Homelessness Initiative | 2.5 | - | - |
| Allocated Corporate Servicesa | 13.1 | 1.1 | 1.1 |
| Otherb | 11.0 | - | - |
| Totalc | 188.1 | 3.3 | 3.3 |
| Human Resources | |||
| Full Time Equivalents | 383 | 12 | 12 |
| a. Corporate Services resources related to the Minister's Office, the Deputy Minister's Office, the Comptroller's Office and the Shared Services have been prorated to each Strategic Outcome. In 2006-07, 101 FTEs are included in the 383 FTEs. b. This amount includes $11.0 million for the World Urban Forum - Vancouver 2006. c. This amount includes $22.8 million (291 FTEs) in 2006-2007, $1.5 million (7 FTEs) in 2007-2008 and $1.5 million (7 FTEs) in 2008-2009, for the delivery of programs and services by Service Canada. For a full accounting of Service Canada's operations please refer to the Strategic Outcome, "Achieve better outcomes for Canadians through service excellence". | |||
Housing and Homelessness Activity - Modifications from the 2005-2006 Program Activity Architecture: with the exception of the program activity name change from Homelessness to Housing and Homelessness, there are no changes from 2005-2006 activity structure.
WORLD URBAN FORUM
Canada offered to the United Nations to host the third session of the World Urban Forum in Vancouver from June 19 to 23, 2006. The event is held biannually by UN-Habitat in coordination with a host country. The purpose of the World Urban Forum (WUF) is to discuss issues and find solutions to challenges created by the rapid urbanization occurring in the world today. The event brings together a wide range of participants, including national and local governments, non-governmental organizations, private sector businesses, community-based organizations and experts.
The Department was given the responsibility to organize the event and coordinate Canadian presence at the event, working with other federal departments/agencies, other levels of government and other stakeholders. A key aspect of the Department's responsibilities was to work closely with UN-Habitat to ensure a smooth and well-run event.
Planned Spending - WUF3:
The Government of Canada committed $27.6 million over two years (2005-2006 and 2006-2007) for the organization and management of this conference - $15 million ($11 million in 2006-2007) of which was new funding coming from HRSDC. The remaining funds came from the existing budgets of various federal departments/agencies.
Results and Outcomes:
Over 10,000 people attended the World Urban Forum in Vancouver, while the expectation was for 6,000. Participants came from 160 countries, including 63 delegations led by ministers. More than 400 mayors attended. Prime Minister Harper gave the keynote address at the opening ceremonies. Media coverage was considerable, both domestically and globally. Comments from participants, early evaluation results and UN-Habitat's own analysis all suggest that the event was a huge success, both in terms of logistics/program and in achieving the goals established for the event. In sum, the Forum met the UN's, Canada's and the federal government's objectives. These included the UN's interest in ensuring it was well-attended and productive, building momentum for the WUF process and a focus on actionable ideas; Canada's interest in showcasing its urban practices and ensuring participants felt positively about the Forum; and the federal government's interest in both these objectives plus ensuring an effective, accurate and coordinated communication of the government's contributions to urban (cities, communities) issues.
Key Partners:
There were two key partners: UN-Habitat and the GLOBE foundation. UN-HABITAT is a UN agency based in Nairobi. It is responsible for organizing WUF every two years, working with a host country and raising funds internationally, particularly from the host country, to finance the event. The GLOBE Foundation is a non-profit organization, which signed a contribution agreement with the Government of Canada to manage the logistics of the World Urban Forum. This included logistics for an experimental, on-line preparatory event, HabitatJAM, which engaged close to 35,000 people from across the world over a three day period in December 2005.
STRATEGIC OUTCOME
ACHIEVE BETTER OUTCOMES FOR CANADIANS THROUGH SERVICE EXCELLENCE
SERVICE CANADA
Service matters to Canadians. Citizens expect and deserve timeliness, fairness, knowledge, competence, courteousness and results when dealing with the Government of Canada. Within a complex operating environment, the Government of Canada is committed to providing the highest level of citizen-centred quality services that meet the needs and exceed the expectations of Canadians.
As part of the government's efforts to respond to these requirements, Service Canada was officially launched on September 14, 2005, initiating a new approach to serving Canadians. As a dedicated service delivery organization, Service Canada puts people at the centre of its mandate, making it easier for Canadians to obtain the help they need in one place. A strengthened focus on programs and services will improve policy outcomes by better connecting citizens and communities to the services and benefits they need. Service Canada marks the continuation of a cultural transformation in the public service, where the citizen is at the centre of everything it does and service matters. Service Canada will improve service across delivery channels, increase flexibility and capacity for the introduction of new programs and services, and enhance coordination and rationalization of investments in service delivery infrastructure.
Service Canada, in collaboration with federal departments and other governments, is mandated to deliver a full range of integrated programs and services to Canadians, further streamlining how government services are provided. Service Canada provides a one-stop, easy-to-access, personalized experience of services across multiple channels including phone, Internet, in-person and mail. Service Canada has over 20,000 employees dedicated to serving Canadians, 433 points of service throughout the country, the national 1 800 O-Canada phone service, a range of on-line services offered on the Internet through servicecanada.gc.ca, and outreach services.
Quick Facts - Each year Service Canada:
- Serves over 32 million Canadians
- Pays over $70 billion ($180m a day) in benefits to Canadians
- Conducts 350 million transactions a year with Citizens
- Handles over 55 million calls
- Mails over 20 million letters
- Handles over 4.8 million transactions on-line
- Interacts with over 55,000 community organizations
The federal government has recently experienced a period of profound transition and change and faces an array of challenges and opportunities to enhance performance, ensure accountability and transparency, and position the government for the demands of the future. Accountability and transparency are important factors in securing good governance, as well as in restoring and strengthening citizens' trust and confidence in government's ability to meet their needs. The creation of Service Canada is a major step towards the government's transformation effort and will fundamentally change the service culture to become more results-oriented, citizen-focused, and be collaborative in nature. Service Canada's commitment to service excellence goes beyond a new structure for service delivery; it's about tangible and visible service improvements that demonstrate seamless citizen-centred services and instigate a culture of accountability and transparency. This will result in improved citizen satisfaction with government programs and services.
To demonstrate this commitment to accountable and responsive government, a Service Charter has been published that explains what Canadians can expect and how they can provide feedback. Service Canada will continually monitor and report on progress against it. An independent Office for Client Satisfaction has been established to receive the views of Canadians on the quality of service and recommend improvements. This fall, Service Canada will be publishing service standards, which will clearly set out the level of service that Service Canada is committed to providing, consistent with the objectives laid out in the Service Charter. To demonstrate accountability and transparency, Service Canada will report on its success in meeting the service standards in a Service Canada Performance Scorecard. The Scorecard will appear in the Service Canada Annual Report to Parliament and Canadians. To support this new level of transparency and accountability for service, control systems are in place to reinforce good stewardship practices and management and accountability structures throughout Service Canada.
For 2006-2007, Service Canada will focus on improving service to Canadians, strengthening transparency and accountability and recognising and rewarding service excellence. This focus is reflected directly in our program activities of: Seamless Citizen-Centred Service; Integrity; and Collaborative, Networked Government Service.
PROGRAM ACTIVITY: SEAMLESS, CITIZEN-CENTRED SERVICE
In the past, Canadians have had to determine how to access service across a myriad of unconnected program and departmental service silos. Citizen-centred service is about changing how government serves Canadians, putting the citizen at the centre of how government does business and providing the quality of service that Canadians need and expect. A citizen focus means providing one-stop, integrated, easy-to-access, and personalized service by phone, Internet, in person and by mail. Ultimately, it will enable better policy outcomes for Canadians.
This activity will enable a move from departmental and program silos to a new citizen focus, from reducing our federal presence to expanding our regional community points of service, and from a prior focus on benefits delivery to becoming the Government of Canada face to Canadians.
Over the next three years, Service Canada will be implementing five key plans to transform service to Canadians:
- Implement a client community service strategy, including identifying client segment champions, improving and developing new service offerings and building the capacity to understand, research and analyze client needs. Service Canada will create client community advisory groups to inform, assess and participate in developing more meaningful and responsive services to our client communities. This initiative will result in a better understanding of the needs of client communities and in the development of service strategies for serving client communities effectively.
- Undertake business and product development to transition from a reliance on processes and approaches that are founded in programs and program development to ones founded on service offerings, based upon Canadians' needs.
- Expand the regional and community service network and offer choice and access where Canadians live by doubling the points of service, developing a new in person service experience model, and implementing a consistent brand across the network. This improvement will reaffirm Service Canada as the Government of Canada network of choice.
- Enhance the telephone channel as a key channel of choice for Canadians by implementing a world class Service Canada integrated call centre network that provides telephone based services to Canadians through a single number. This positions Service Canada's telephone service for the future as it moves to provide enhanced citizen-centred services and to offer telephone services for other organizations and partners.
- Renew Internet and Intranet services to enhance citizen access to programs and services. The Internet channel provides the backbone of information on programs and services and electronic services to Canadians. By moving to a world class, fully integrated and service oriented website, Canadians will be able to interact more quickly, easily and efficiently with government.
Service matters to Canadians. Research shows there is a strong link between efficient service and confidence in Government, as this is the primary way that citizens come into contact with their governments, personally and directly. Concurrently, Service Canada will also focus on achieving and rewarding a service excellence culture. Service Canada will be:
- Build service excellence by creating a new government career for service delivery. By creating a career associated with service, Service Canada is allowing its employees to progress through innovation in citizen centred service
- Achieve service excellence by launching the first phase of the Service Canada College, the opening of the Galleria learning centre in Regina. This is the starting point for new investments in enhancing employee skills and capabilities, focused around serving Canadians
- Reward service excellence by establishing a leadership development program, building leadership capacities, and launching the Office of Employee Innovation
Finally, Service Canada has made commitments to Canadians and to Parliamentarians. As part of Service Canada's priority to strengthen accountability and transparency, it will be reporting on progress through the Service Charter, the Service Standards and Performance Scorecard, and through the establishment of the Office for Client Satisfaction.
| Priority: Transforming service to Canadians |
|
Plans:
|
| Priority: Achieving and rewarding a service excellence culture |
|
Plans:
|
| Priority: Strengthening accountability and transparency |
|
Plans:
|
PROGRAM ACTIVITY: INTEGRITY
Service Canada issues $70 billion in benefits to Canadians each year and must ensure that these benefits are going to the right people, in the right amount and for the purpose for which they were intended. Fundamental to Service Canada's accountability is the integrity of the organization and the demonstration of sound stewardship as the Canadian Government's service delivery arm. Service Canada must demonstrate its understanding of the risks to its success and manage those risks effectively. Further, the monitoring and measurements of our achievements will be based on sound methodologies and dependable data. Establishing a robust and rigorous integrity strategy is fundamental to delivering citizen-centered service, improving public trust and confidence in government, and achieving savings for taxpayers.
Over the next three years, Service Canada will focus on various initiatives to strengthen accountability and transparency:
- Establish enterprise-wide integrity by ensuring that the benefits Service Canada delivers each year are going to the right person, in the right amount and for the correct purpose. To accomplish this Service Canada needs to know that its risk management strategies are effective, that the quality of its work is meeting high standards, and that the information used to manage the identity of its clients and report on its achievements is reliable. This will involve strengthening the Social Insurance Number (SIN) processes, the Social Insurance Registry (SIR) and authentication models as the basis to access programs and services. In addition, Service Canada will focus on expanding its risk analysis capacity and implementing an enterprise-wide quality framework to respectively improve and measure its compliance and accuracy in benefit delivery.
- Maximize savings through efficient and cost-effective delivery of service offerings and the control and detection of inaccurate or wrongful payments as per Service Canada's savings commitments, supported by necessary mechanisms to realize, monitor and report on progress. While Service Canada has achieved its year one savings target, it is critical that the organization stays on track and meets its year two and beyond commitments in order to enhance its credibility with Canadians and demonstrate sound stewardship and accountability.
| Priority: Strengthening accountability and transparency |
|
Plans:
|
PROGRAM ACTIVITY: COLLABORATIVE, NETWORKED GOVERNMENT SERVICE
Service Canada is the largest government service delivery organization in Canada. It has the largest presence across the country, runs the 1 800 O-Canada government phone service as well as handles 80% of the Government of Canada non-tax related phone calls and it manage the Canada.gc.ca internet site. Service Canada is ideally positioned to be the Government of Canada network of choice, but recognise that there are other service delivery networks. Service Canada will form the Government of Canada network of choice by creating a collaborative, networked government service to align all these networks, with Service Canada at the core. To do this it has to make access to the network easy, extend the network through new partnerships and invest in service delivery channels to put the citizen at the centre.
In the next year, Service Canada will develop plans to make access to the collaborative network easier for governments. Service Canada's network is a significant asset that can be leveraged to deliver key services to Canadians where they live. Building on its existing service delivery network and its capacity to disseminate information across the country, Service Canada will develop a new emergency preparedness offering to provide assistance and support in response to local or national emergencies and crises. For this service offering Service Canada will partner with other federal departments such as Public Safety and Emergency Preparedness Canada.
Service Canada plans to extend the network through new and expanded partnerships: It will continue to create value for Federal Departments and plans to sign and implement three new agreements. Furthermore, Service Canada is expanding its collaboration in the delivery of services with provinces. Already it has collaboration in New Brunswick and Ontario and expects to extend this with three new agreements to build a network of service delivery collaboration across the country.
Service Canada has three plans to invest in service delivery channels to achieve client information integration and put the citizen at the centre of a world class collaborative network:
- Establish a 'one client view' to support service delivery. Providing service to Canadians requires the ability to view information from a citizen-centred perspective. The one client view will transform the way Service Canada approaches service to remove program silos and to enable Service Canada to become experts in the collection, use and integration of information to meet the needs of Canadians. This will mean that information will only needed to be collected once, privacy will be enhanced, all while giving Canadians the opportunity to easily find programs and services in one place. Service to Canadians will be transformed, while Service Canada significantly reduces the administrative burden, makes government more efficient, consistent with privacy laws and practices.
- Achieve processing automation. Service Canada has already responded to the needs of Canadians for better, faster and more convenient services on the Internet. The use of information gathered electronically will be applied further by automating and enhancing the capabilities of the existing program systems to eliminate unnecessary processes and automate as appropriate.
- Collect information from the source where possible. By transforming vital events management, Service Canada will collect information on birth, deaths and marriages directly from the sources. It will also be extending this to include information from new Canadians as they arrive in Canada.
Service Canada is leveraging the collaborative potential across government to create new value for Canadians. It's about strengthening government and the Canadian federation and allowing governments to work together in the best interests of Canadians - the objective of this collaboration is the shared desire to better serve and improve outcomes for the people of Canada.
| Priority: Transforming service to canadians |
|
Plans:
|
| Priority: Achieving client information integration |
|
Plans:
|
Shared service arrangements
In addition to its external service delivery function, Service Canada is also responsible for the provision of human resources, information technology, administrative and financial services to HRSDC. As a shared service provider, Service Canada's objective is to bring together common support functions and enhance the efficiency and cost-effectiveness of these services.
| Strategic Outcome | Achieve better outcomes for Canadians through service excellence | |||
| Service Indicators |
|
|
||
| Expected Results |
|
|
| |
| Program Activities | Seamless, Citizen-centred Service | Collaborative, Networked Government Service | Integrity | |
| Priorities | Achieving and Rewarding Service Excellence Culture | Transforming Service to Canadians | Achieving Client Information Integration | Strengthening Accountability and Transparency |
| Plans |
|
|
|
|
| Corporate Focus | Strengthening management and financial accountability | |||
SERVICE CANADA: FINANCIAL AND HUMAN RESOURCES - PLANNED SPENDING
The two financial tables below align with HRSDC's 2006-2007 Main Estimates.
| Planned Spending | |||
| 2006-2007 | 2007-2008 | 2008-2009 | |
| Financial Resources (in millions of dollars) | |||
| Human Resources and Skills Development Canada | |||
| Gross Operating Expenditures | 109.4 | 110.4 | 110.8 |
| Social Development Canada | |||
| Gross Operating Expenditures | 447.1 | 447.8 | 449.9 |
| Total | 556.5 | 558.2 | 560.7 |
| Human Resources | |||
| Full Time Equivalents | 6,305 | 6,231 | 6,234 |
| 2006-2007 | 2007-2008 | 2008-2009 | |
| Financial Resources (in millions of dollars) | |||
| Human Resources and Skills Development Canada | |||
| Service Delivery - Human Resources and Skills Development Canada | 75.8 | 75.4 | 75.3 |
| Allocated Corporate Servicesa | 33.6 | 35.0 | 35.5 |
| Sub-Total | 109.4 | 110.4 | 110.8 |
| Service Delivery - Social Development Canada | 447.1 | 447.8 | 449.9 |
| Totalb | 556.5 | 558.2 | 560.7 |
| Human Resources | |||
| Full Time Equivalents | 6,305 | 6,231 | 6,234 |
| a. Corporate Services resources related to the Minister's Office, the Deputy Minister's Office, the Comptroller's Office and the Shared Services have been prorated to each Strategic Outcome. b. This represents Service Canada's resources for the delivery of programs and services. For a full accounting of Service Canada's operations, please refer to the following table. | |||
| Planned Spending | |||
| 2006-2007 | 2007-2008 | 2008-2009 | |
| Budgetary | |||
| Operating Costs (Vote 1&10)a | 563.3 | 532.0 | 540.9 |
| Delivery Cost related to: | |||
| Employment Insurance Account | 1,138.4 | 1,135.6 | 1,133.8 |
| Canada Pension Plan | 190.6 | 190.9 | 190.9 |
| Sub-totala | 1,329.0 | 1,326.5 | 1,324.7 |
| Gross Operating Costsa | 1,892.3b | 1,858.5b | 1,865.6b |
| Delivered on behalf of Human Resources and Social Development Canada c | |||
| Voted Grants and Contributions (Vote 5&15) | 686.1 | 558.4 | 545.5 |
| Statutory Payments: | |||
|
23,255.0 | 24,139.0 | 25,285.0 |
|
6,820.0 | 7,219.0 | 7,512.0 |
|
500.0 | 537.0 | 568.0 |
| Sub-total Other Statutory Payments | 30,575.0 | 31,895.0 | 33,365.0 |
| Canada Pension Plan benefits | 26,132.3 | 27,496.8 | 28,917.7 |
| Employment Insurance benefits | |||
| - Part I | 12,442.0 | 13,058.0 | 13,661.0 |
| - Part II | 2,048.9 | 2,048.8 | 2,048.8 |
| Sub-total Employment Insurance benefits | 14,490.9 | 15,106.8 | 15,709.8 |
| LMDA System Enhancement Costs | 7.6 | 11.1 | 6.3 |
| LMDA - Office Re-fit | 1.0 | - | - |
| Total Statutory Transfer Payments | 71,206.8d | 74,509.7d | 77,998.8d |
| Consolidated Total | 73,785.2 | 76,926.6 | 80,409.9 |
| a. The total Operating Costs and the Delivery Costs related to the 2005-2006 Forecast Spending for Service Canada are respectively $515.6 million and $1,396.0 million. The 2005-2006 Forecast Planned Spending total Gross Operating Costs is $1,911.6 million. b. Includes statutory items for employee benefit plans and payments to private collections agencies $18.5M ($21.0M in 2007-2008 and $23.3M in 2008-2009). c. The financial strategy for Service Canada establishes that statutory funds, including Employment Insurance, CPP, OAS and voted grants and contributions related to the delivery of specified programs will be allocated annually by HRSDC. d. This amount directly benefits Canadians and is delivered on behalf of HRSDC. | |||
| Gross Operating Expenditures Financial Resources (in millions of dollars) | 2006-2007 | 2007-2008 | 2008-2009 |
| From: | |||
| Labour Market | 1,259.9 | 1,246.2 | 1,252.7 |
| Workplace Skills | 53.1 | 52.6 | 50.7 |
| Housing and Homelessness | 22.8 | 1.5 | 1.5 |
| Service Delivery | 556.5 | 558.2 | 560.7 |
| Total Service Canada | 1,892.3 | 1,858.5 | 1,865.6 |
| Seamless, Citizen-Centered Services | 888.5 | 863.1 | 862.8 |
| Integrity | 974.3 | 966.1 | 973.4 |
| Collaborative, Networked Government Services | 29.5 | 29.3 | 29.4 |
| Total Service Canada | 1,892.3 | 1,858.5 | 1,865.6 |
| Full Time Equivalent - Total | 20,531 | 20,067 | 20,021 |
Supplementary Information
Organizational Information

Text version:
Organizational Chart
Human Resources and Social Development Canada
Level 1:
There are two Ministers: the Minister of Labour, and the Minister of Human Resources and Social Development.
Level 2:
There is a Parliamentary Secretary who supports the Minister of Human Resources and Social Development.
The Canada Pension Plan and Old Age Security Review Tribunals report to the Minister of Human Resources and Social Development.
Level 3:
The Deputy Minister reports to the Minister of Human Resources and Social Development.
The Commissioner for Employers and the Commissioner for Workers report to the Deputy Minister.
The Deputy Minister of Labour, who is also the Associate Deputy Minister of Human Resources and Social Development, reports to the Minister of Labour and the Deputy Minister of Human Resources and Social Development.
The Deputy Head of Service Canada, who is also the Associate Deputy Minister of Human Resources and Social Development, reports to the Deputy Minister.
The Comptroller reports to the Deputy Minister.
The Chief Audit Executive reports to the Deputy Minister.
Senior General Counsel reports to the Deputy Minister.
Level 4:
In this level, eleven branches are listed.
The Labour branch reports to the Deputy Minister of Labour (Associate Deputy Minister of Human Resources and Social Development).
The following ten branches report to the Deputy Minister: Employment Programs Policy and Design; Workplace Skills; Learning; Human Resources and Corporate Management; Strategic Policy; Strategic Policy - Children and Families; Housing and Homelessness; Public Affairs and Ministerial Services; Social Development Sectors; and Strategic Analysis, Audit and Evaluation.
The Comptroller also reports to the Deputy Minister.

Text version:
Organizational Chart
Human Resources and Social Development Canada - Service Canada
Level 1:
There is a Deputy Head of Service Canada, who is also the Associate Deputy Minister of Human Resources and Social Development Canada.
Level 2:
The Chief Audit Executive reports to the Deputy Head.
The Director General of Marketing and Communications reports to the Deputy Head.
The Chief Financial Officer reports to the Deputy Head.
The Chief Information Officer reports to the Deputy Head.
At this level six branches are listed: Integrity Services; Citizen and Community Service; Operations; Business Integration; Policy, Partnerships and Corporate Affairs; and People and Culture.
The ten regions also report to the Deputy Head.
Financial Tables
Please note that financial tables provided in this section present Human Resources and Skills Development and Social Development separately in order to align with the 2006-2007 Main Estimates.
| Total Authority | Planned Spending | |||
| Program Activities (millions of dollars) | 2005-2006 | 2006-2007 | 2007-2008 | 2008-2009 |
| Budgetary Main Estimates | ||||
| Employment Insurance | 804.9 | 883.5 | 880.7 | 883.0 |
| Employment Programs | 893.0 | 969.1 | 968.6 | 933.8 |
| Workplace Skills | 168.8 | 184.5 | 181.7 | 120.0 |
| Learning | 929.5 | 1,226.9 | 1,193.0 | 1,201.5 |
| Labour | 205.8 | 217.3 | 222.2 | 224.6 |
| Homelessness | 180.0 | 188.3 | 3.3 | 3.3 |
| Policy and Program Support | 232.7 | 103.2 | 89.6 | 88.7 |
| Service Delivery | 118.8 | 128.1 | 128.7 | 129.0 |
| Gross Budgetary Main Estimates | 3,533.5 | 3,900.9 | 3,667.8 | 3,583.9 |
| Less: Respendable Revenue | (1,347.0) | (1,425.8) | (1,414.9) | (1,414.6) |
| Net Budgetary | 2,186.5 | 2,475.1 | 2,252.9 | 2,169.3 |
| Non-Budgetary | ||||
| Loans disbursed under Canada Student Financial Assistance Act | 1,040.8 | 981.5 | 769.1 | 560.8 |
| Adjustments: | ||||
| Governor General Special Warrants | 53.7 | - | - | - |
| Others: | ||||
| - OBA Transfer - Freeze | (0.7) | - | - | - |
| - Carry - forward CRF | (5.9) | - | - | - |
| - Expenditure Review Committee Departmental Savings | (6.0) | - | - | - |
| - TB Vote 5 | 0.3 | - | - | - |
| - Employee Benefit Plan (EBP) | (2.2) | - | - | - |
| Sub-Total Others: | (14.5) | - | - | - |
| Statutory Adjustment for the Public Accounts - Budgetary | 57.5 | - | - | - |
| Statutory Adjustment for the Public Accounts - Non-Budgetary | 290.5 | - | - | - |
| Procurement Savingsa | ||||
| - Employment Insurance | n/a | (0.4) | - | - |
| - Employment Programs | n/a | (0.4) | - | - |
| - Workplace Skills | n/a | (0.1) | - | - |
| - Learning | n/a | (0.2) | - | - |
| - Labour | n/a | (0.3) | - | - |
| - Homelessness | n/a | (0.1) | - | - |
| - Policy and Program Support | n/a | (0.1) | - | - |
| - Service Delivery | n/a | (0.2) | - | - |
| Sub-Total Procurement Savings | n/a | (1.8) | - | - |
| CSLP - Reduction of Parental Contribution | n/a | - | 15.0 | 20.0 |
| Apprenticeship Incentive Grant | n/a | 25.0 | 100.0 | 105.0 |
| Foreign Credential Recognition Agency | n/a | 2.0 | 10.0 | 6.0 |
| 5 Weeks Pilot Project | n/a | 0.1 | 0.1 | - |
| Government of Canada Advertising Plan | n/a | (0.5) | - | - |
| Cree Regional Authority | n/a | 6.9 | - | - |
| Winter Games Olympics 2010 | n/a | 0.2 | 0.2 | 0.4 |
| Workplace Partners Panel | n/a | 2.0 | 2.0 | - |
| Workplace Skills Strategy | n/a | 0.3 | - | - |
| Wage Earner Protection Program | n/a | 32.2 | 32.2 | 32.2 |
| Workplace Skills - Trades and Apprenticeship Strategy | n/a | - | - | 2.6 |
| EI - Compassionate Care Benefits | ||||
| At Gross | n/a | 0.7 | 0.7 | 0.7 |
| EI recovery credited to the vote | n/a | (0.7) | (0.7) | (0.7) |
| Aboriginal Skills Employment Partnerships | n/a | 5.3 | - | - |
| Reduced Cost of the new Ministry - Smaller Cabinet | n/a | (0.9) | (0.9) | (0.9) |
| Canada Student Loan - Debt write-off | n/a | 0.4 | - | - |
| LMDA with Ontario - Workforce Adjustment Costs | n/a | 8.5 | - | - |
| LMDA with Ontario - EI Admin | ||||
| At Gross | n/a | 8.6 | 8.6 | 8.6 |
| EI recovery credited to the vote | n/a | (8.6) | (8.6) | (8.6) |
| Total Adjustments | 387.2 | 79.7 | 158.6 | 165.3 |
| Total Planned Spending (Net) | 3,614.5 | 3,536.3 | 3,180.6 | 2,895.4 |
| Specified Purpose Accounts | ||||
| Employment Insurance (EI) | 16,111.6 | 16,260.7 | 16,877.4 | 17,473.9 |
| Other Specified Purpose Accounts | 51.4 | 48.3 | 45.4 | 42.7 |
| Departmental Recoveries charged to the Canada Pension Plan | 15.3 | 14.7 | 14.7 | 14.7 |
| Departmental Employee Benefit Plan recoverable from EI Account | (149.7) | (140.7) | (139.1) | (138.6) |
| Total HRSDC Consolidated | 19,643.1 | 19,719.3 | 19,979.0 | 20,288.1 |
| Less: Non-Respendable Revenue | 549.6 | 648.5 | 733.1 | 807.0 |
| Plus: Cost of services received without charge | 17.9 | 17.7 | 16.4 | 16.0 |
| Total HRSDC | 20,210.6 | 20,385.5 | 20,728.5 | 21,111.1 |
| Full Time Equivalents | 17,094 | 18,068 | 17,514 | 17,366 |
| a. 2006-2007 gross procurement savings total $10.1 million. After recoveries to the Employment Insurance Account of $8.2 million, the Consolidated Revenue Fund portion (or net) is $1.8 million. | ||||
Financial Highlights
Consolidated spending under Human Resources and Skills Development authorities is expected to be $19,719.3 million in 2006-2007. This represents an increase of $76.2 million over the 2005-2006 total authorities of $19,643.1 million. The variance is mainly due to:
- an increase of $31.3 million in net operating expenditures mainly due to:
- additional administration resources of $24.8 million for programs such as:
- Trades and Apprenticeship Strategy ($8.8 million) to work with provinces, territories and stakeholders to strengthen apprenticeships in the 45 Red Seal trades;
- Workplace Skills Innovation ($5.7 million) for the implementation of this program including activities such as assessment of projects, managing Calls for Proposals, accountability, compliance and evaluation;
- Wage Earner Protection Program ($3.2 million) which is designed to pay certain employees of bankrupt companies their unpaid wages and vacation pay up to $3,000;
- the new Canada Learning Bond and enhanced Canada Education Savings Grant ($2.8 million),
- National Literacy Secretariat ($2.0 million) to develop a national strategy on literacy and essential skills;
- Immigration Portal ($1.3 million) for the development of information for prospective and new immigrants on credential and skills assessment and employment opportunities;
- Foreign Credential Recognition Agency ($1.0 million) announced in Budget 2006, to facilitate the consultation process and to take the first steps toward the establishment of a Canadian agency for assessment and recognition of foreign-trained immigrant credentials;
- an increase for costs related to the signature of the Labour Market Development Agreement with the Province of Ontario ($8.5 million),
- allocation from the Government Advertising Plan and public notices campaigns ($1.0 million),
- These increase are offset by:
- reduced costs of the new Ministry as a result of a smaller Cabinet($0.8 million); and
- savings to be achieved through reduction of procurement expenditures ($1.4 million);
- additional administration resources of $24.8 million for programs such as:
- an increase of $20.6 million in voted grants and contributions mostly related to:
- increases for new or enhanced programs such as:
- Workplace Skills Initiative ($34.7 million) to support partnership-based projects to test new approaches to encourage employer investment in workplace skills development, with a focus on small and medium-sized enterprises;
- the introduction of the Apprenticeship Incentive grant announced in Budget 2006 ($25.0 million);
- the National Literacy Secretariat to promote literacy in the workplace ($8.6 million);
- Foreign Credential Recognition ($6.9 million) to work with partners and stakeholders to help immigrants maximize their skills potential and contributions to the Canadian labour market;
- the World Urban Forum Vancouver 2006 ($4.7 million), a worldwide event focusing on cities, shelter and urbanization;
- the Sector Council Initiative ($4.0 million) to support activities of new and exemplary sector councils in addressing skills and learning issues in Canada's labour market;
- Training Centre Infrastructure Fund ($ 3.7 million) to support employer-union training centres in the purchase of new machinery and equipment for trades that have undergone significant technological change, broadened scope, or new curricula;
- Canada Learning Bond and Canada Education Savings Grants ($3.0 million);
- Workplace Partners Panel ($2.0 million) to provide a national forum for increased industry engagement, providing prominence and visibility, fostering ownership and engagement, and generating and to disseminating information on workplace skills issues;
- Foreign Credential Recognition Agency ($1.0 million) announced in Budget 2006, to facilitate the consultation process and to take the first steps toward the establishment of a Canadian agency for assessment and recognition of foreign-trained immigrant credentials;
- Kativik Regional Government ($1.0 million) for Inuit employment programming, pursuant to regular employment programs and services, funding for child care services, additional funding for special training programs needed to qualify the Inuit for jobs created by existing or planned developments in the Kativik Regional Government territory;
- Cree Regional Authority ($1.0 million) for the implementation of territorial programs in the James Bay territory in various skills development key areas such as tourism, hydro development, construction and forestry;
- These increases are offset by a decrease of $60.0 million related to the transfer of the Toronto Waterfront Revitalization Initiative and a decrease of $20.1 million related to the National Homelessness Initiative;
- increases for new or enhanced programs such as:
- An increase of $219.7 million in statutory payments mainly related to the introduction of the Canada Learning Bond ($42.8 million), the enhancement and the increasing trend in the demand of the Canada Education Savings Grant ($112.5 million) and the increase of the Canada Student Loans Program ($34.5 million) and the Wage Earner Protection Program ($28.7 million), which is designed to pay certain employees of bankrupt companies their unpaid wages and vacation pay up to $3,000;
- a net decrease of $349.8 million for loans disbursed under the Canada Student Financial Assistance Act which is primarily due to the impact of loan reimbursements from borrowers in the loan portfolio; and
- an increase of $158.1 million for planned Employment Insurance (EI) Account spending.
For 2007-2008, the consolidated planned spending is anticipated to be $19,979.0 million, which represents an increase of $259.7 million from the 2006-2007 planned spending. The major changes are as follows:
- a net decrease of $42.3 million in operating expenditures, mainly due to a decrease of $22.2 million related to the administration of the National Homelessness Initiative, a decrease of $8.5 million for one-time costs related to the signature of the Labour Market Development Agreement with the Province of Ontario, a reduction of $7.5 million related to the allocation from the Government Advertising Plan, a decrease of $6.2 million for the administration of the Canada Learning Bond and the Canada Education Savings Grant, and a decrease of $5.6 million for the Canada Student Loan new recovery initiative. These decreases are offset by an increase of $5.0 million for the Foreign Credential Recognition Agency;
- a decrease of $83.2 million in voted grants and contributions, mainly due to a decrease of $138.3 million for Homelessness Initiative and of $9.6 million for the ending of the World Urban Forum, which is offset by an increase of $75.0 million for the Apprenticeship Incentive grant announced in Budget 2006;
- a decrease of $17.8 million in statutory payments mainly related to the Canada Education Savings Grant ($15.0 million) reflecting the stabilization of the RESP industry following the introduction of the enhanced CESG in 2005;
- a net decrease of $212.4 million for loans disbursed under the Canada Student Financial Assistance Act which is primarily due to the impact of loan reimbursements from borrowers in the loan portfolio; and
- an increase of $618.3 million for the Employment Insurance Account mainly due to an increase in forecasted EI Part I benefits of $616.0 million.
For 2008-2009, the consolidated planned spending is anticipated to be $20,288.1 million, which represents an increase of $309.1 million from the 2007-2008 planned spending. The major changes are as follows:
- an net decrease of $22.1 million in operating expenditures, mainly due to reductions related to the administration of Trades and Apprenticeship Strategy ($7.0 million), Workplace Skills Initiative ($5.6 million), Foreign Credential Recognition Agency ($3.0 million), National Literacy Program ($1.9 million), Aboriginal Skills Employment Partnership ($1.7 million) and Official Language Minority Communities ($1.6 million);
- a decrease of $84.3 million in voted grants and contributions, mainly due to a decrease in funding for Workplace Skills Initiative ($37.7 million), Aboriginal Skills Employment Partnership ($18.2 million), National Literacy Program ($13.8 million), Official Language Minority Communities ($12.0 million) and Training Centre Infrastructure Fund ($4.2 million);
- an increase of $29.5 million in statutory payments mainly related to an increased demand for the Canada Education Savings Grant ($15.0 million) and the Canada Learning Bond ($9.0 million) and the improvements to the Canada Student Loans program announced in Budget 2006 which will reduced the parental contribution ($5.0 million);
- a net decrease of $208.3 million for loans disbursed under the Canada Student Financial Assistance Act which is primarily due to the impact of loan reimbursements from borrowers in the loan portfolio; and
- an increase of $596.0 million for the Employment Insurance (EI) Account mainly due to an increase in forecasted EI Part I benefits of $603.0 million.
| Total Authority 2005-2006 |
Planned Spending 2006-2007 |
Planned Spending 2007-2008 |
Planned Spending 2008-2009 | |
| ($ millions) | ||||
| Social Investment (exclude OAS Benefits) | 398.7 | 434.7 | 437.3 | 440.1 |
| Social Investment - OAS Benefits | 28,893.0 | 30,575.0 | 31,895.0 | 33,365.0 |
| 29,291.7 | 31,009.7 | 32,332.3 | 33,805.1 | |
| Social Development Policy & Innovation | 8.5 | 684.8 | 1,178.9 | 1,178.9 |
| Service Delivery | 476.1 | 508.8 | 507.7 | 509.8 |
| Budgetary Main Estimates (gross) | 29,776.3 | 32,203.3 | 34,018.9 | 35,493.8 |
| Less: Respendable Revenue | (276.6) | (301.2) | (302.7) | (302.5) |
| Total Main Estimates | 29,499.7 | 31,902.1 | 33,716.2 | 35,191.3 |
| Adjustments: | ||||
| Governor General Special Warrants | 31.3 | - | - | - |
| Other: | ||||
| - TB Vote 5 | 9.9 | - | - | - |
| - TB Vote 10 | 0.4 | - | - | - |
| - Employee Benefit Plan (EBP) | 11.1 | - | - | - |
| - Freezes | (24.3) | - | - | - |
| - Statutory Adjustments for the Public Accounts | 304.5 | - | - | - |
| 301.6 | - | - | - | |
| Advertising Initiative Campaign | n/a | (2.0) | - | - |
| Universal Child Care Benefit | n/a | 1,610.0 | 2,085.0 | 2,065.0 |
| Child Care - Prov./Terr. Agreements | n/a | 650.0 | - | - |
| New Child care spaces | n/a | - | 250.0 | 250.0 |
| National Early Learning | n/a | (650.0) | (1,150.0) | (1,150.0) |
| Energy Cost Benefit | n/a | 0.4 | - | - |
| Reduced cost of the new Ministry - Smaller Cabinet | n/a | (2.0) | (2.0) | (2.0) |
| Procurement Savings 1 | ||||
| - Social Investment | n/a | (0.5) | - | - |
| - Social Development Policy & Innovation | n/a | (0.1) | - | - |
| - Service Delivery | n/a | (2.5) | - | - |
| Total Procurement Savings | n/a | (3.1) | - | - |
| Total Adjustments | 332.9 | 1,603.3 | 1,183.0 | 1,163.0 |
| Total Planned Spending (net) | 29,832.6 | 33,505.4 | 34,899.2 | 36,354.3 |
| Specified Purpose Accounts | ||||
| Canada Pension Plan (CPP) | 25,385.0 | 26,530.1 | 27,896.9 | 29,318.8 |
| Departmental Recoveries charged to EI | 71.7 | 68.8 | 70.2 | 70.0 |
| Departmental Employee Benefit Plan recoverable from CPP | (19.3) | (17.8) | (17.9) | (17.9) |
| Total SDC consolidated | 55,270.0 | 60,086.5 | 62,848.4 | 65,725.2 |
| Less: Non-Respendable Revenue | 29.3 | 26.8 | 27.2 | 27.1 |
| Plus: Cost of services received without charge | 19.8 | 16.7 | 16.4 | 16.3 |
| Total SDC | 55,260.5 | 60,076.4 | 62,837.6 | 65,714.4 |
| Full Time Equivalents | 6,655 | 6,206 | 6,147 | 6,147 |
| 1.Total savings of $3.390 million less respendable revenues of $0.339 million. | ||||
Financial Highlights
Consolidated spending under Social Development Canada authorities is expected to be $60,086.5 million in 2006-2007. This represents an increase of $4,816.5 million over the 2005-2006 total authorities of $55,270.0 million. The variance is mainly due to:
- an increase of $39.9 million in net operating expenditures mainly due to:
- additional funds for the Participation and Activity Limitation Survey ($6.6 million);
- implementation of information campaigns directed at persons with disabilities, seniors, families and children ($4.0 million);
- administration of grant and contribution programs ($8.4 million);
- National Seniors Secretariat to provide a focal point for federal seniors-related efforts and support the development of a collaborative approach to seniors' issues with a diverse array of partners ($2.3 million);
- Official Languages Action Plan to support vibrant official language minority communities ($1.1 million);
- an increase to reference levels to reflect the repayment of resources which supported Year 2000 preparation ($10.5 million); and
- transfers from Human Resources and Skills Development ($2.8 million);
- These increases are offset by:
- reduced costs of the new Ministry as a result of a smaller Cabinet($1.8 million); and
- savings to be achieved through reduction of procurement expenditures ($2.4 million);
- an increase of $3,629.2 million in statutory payments mainly related to:
- an increase of $1,582.7 million to the Income Security Programs which reflects forecasts of client population and average benefit payments;
- an increase of $2,260.0 million for the introduction of the new Universal Child Care Benefit ($1,610 million) and payments to provinces and territories ($650.0 million) for the purpose of providing transition funding to phase-out the 2005 Early Learning and Child Care agreements signed by the previous government;
- a decrease of $210.5 million for Energy Cost Benefit payments, which are one-time payments of $125 (or $250 for couples) made in 2005-2006 to seniors entitled to receive the Guaranteed Income Supplement or the Allowance to deal with rising energy costs;
- an increase of $4.9 million for payments to private collection agencies;
- a decrease of $7.3 million to the employee benefit plan contributions; and,
- an increase of $1,145.1 million to the Canada Pension Plan (CPP). The increase in benefits of $1,155.5 million reflects forecasts of client population and average benefit payments. This increase is offset by a decrease of $10.4 million in the CPP administration costs.
For 2007-2008, consolidated planned spending is anticipated to be $62,848.4 million, which represents an increase of $2,761.9 million from the 2006-2007 planned spending. The major changes are as follows:
- an increase of $1,397.2 million in statutory payments mainly related to an increase of $1,320.0 million to the Income Security Programs based on forecasts of client population and average benefit payments, an increase of $475.0 million related to the Universal Child Care Benefit, a reduction of $650.0 million in payments to provinces and territories related to the transition funding to phase-out the 2005 Early Learning and Child Care agreements signed by the previous government and an increase of $250.0 million for the creation of new child care spaces; and
- an increase of $1,366.8 million to the Canada Pension Plan. This increase of $1,364.5 million in benefits reflects forecasts of client population and average benefit payments.
For 2008-2009, consolidated planned spending is anticipated to be $65,725.2 million, which represents an increase of $2,876.8 million from the 2007-2008 planned spending. The major changes are as follows:
- an increase of $1,452.3 million in statutory payments mainly related to an increase of $1,470.0 million to the Income Security Programs and an decrease of $20.0 million related to the Universal Child Care Benefits; and
- an increase of $1,421.9 million to the Canada Pension Plan . This increase of $1,420.9 million in benefits reflects forecasts of client population and average benefit payments.
| HUMAN RESOURCES AND SOCIAL DEVELOPMENT - PROGRAM ACTIVITIES | |||||||||||
| Program Activities 2006-2007 | |||||||||||
| 2006-2007 Planned Spending (millions of dollars) - net | Labour Market | Workplace Skills | Learning | Labour | Social Investment | Children and Families | Housing and Homelessness | Service Delivery | Policy, Research and Communication | Other - Specified Purpose Accounts | Total |
| Human Resources and Skills Development Canada | |||||||||||
| Employment Insurance | 99.4 | - | - | - | - | - | - | - | - | - | 99.4 |
| Employment Progams | 667.2 | - | - | - | - | - | - | - | - | - | 667.2 |
| Workplace Skills | - | 157.3 | - | - | - | - | - | - | - | - | 157.3 |
| Learning | - | - | 2,193.0 | - | - | - | - | - | - | - | 2,193.0 |
| Labour | - | - | - | 171.2 | - | - | - | - | - | - | 171.2 |
| Homelessness | - | - | - | - | - | - | 188.1 | - | - | - | 188.1 |
| Policy & Program Support | - | - | - | - | - | - | - | - | 28.8 | - | 28.8 |
| Service Delivery | - | - | - | - | - | - | - | 31.3 | - | - | 31.3 |
| Sub-Total HRSDC | 766.6 | 157.3 | 2,193.0 | 171.2 | - | - | 188.1 | 31.3 | 28.8 | - | 3,536.3 |
| Social Development Canada | |||||||||||
| Social Investment | - | - | - | - | 30,960.1 | 2,282.8 | - | - | - | - | 33,242.9 |
| Social Development`Policy & Innovation | - | - | - | - | - | - | - | - | 45.8 | - | 45.8 |
| Service Delivery | - | - | - | - | - | - | - | 216.7 | - | - | 216.7 |
| Sub-Total SDC | - | - | - | - | 30,960.1 | 2,282.8 | - | 216.7 | 45.8 | - | 33,505.4 |
| Consolidated Net Planned Spending | 766.6 | 157.3 | 2,193.0 | 171.2 | 30,960.1 | 2,282.8 | 188.1 | 248.0 | 74.6 | - | 37,041.7 |
| Specified Purpose Accounts | |||||||||||
| Employment Insurance (EI) Account | |||||||||||
| EI Part I - Income Benefits | 12,442.0 | - | - | - | - | - | - | - | - | - | 12,442.0 |
| EI Part II - Employment Benefits and Support | 2,137.5 | - | - | - | - | - | - | - | - | - | 2,137.5 |
| EI Doutful Accounts | - | - | - | - | - | - | - | - | - | 57.0 | 57.0 |
| EI Administration Costs | - | - | - | - | - | - | - | - | - | 1,624.2 | 1,624.2 |
| Sub-Total - EI | |||||||||||
| Account | 14,579.5 | - | - | - | - | - | - | - | - | 1,681.2 | 16,260.7 |
| Canada Pension Plan (CPP) | |||||||||||
| CPP Benefits | - | - | - | - | 26,132.3 | - | - | - | - | - | 26,132.3 |
| CPP Administration Costs | - | - | - | - | - | - | - | - | - | 397.7 | 397.7 |
| Sub-Total - CPP | - | - | - | - | 26,132.3 | - | - | - | - | 397.7 | 26,530.0 |
| Other Specified Purpose | |||||||||||
| Accounts | 48.3 | - | - | - | - | - | - | - | - | - | 48.3 |
| Departmental Employee Benefit Plan recoverable | |||||||||||
| from EI Account/CPP | - | - | - | - | - | - | - | - | - | (167.5) | (167.5) |
| Consolidated Total | 15,394.4 | 157.3 | 2,193.0 | 171.2 | 57,092.4 | 2,282.8 | 188.1 | 248.0 | 74.6 | 1,911.4 | 79,713.2 |
| 2006-2007 | |||||||||
| (millions of dollars) | Main Estimates Budgetary | Main Estimates Non- Budgetary | Adjustments (planned spending not in Main Estimates) | Total Planned Spending | |||||
| Program Activity | Operating | Grants and Contributions | Gross | Respendable Revenue | (Net) Total Main Estimates | Loans | Other | Procurement Savings | |
| Employment Insurance | 883.3 | 0.1 | 883.4 | (783.3) | 100.1 | - | (0.3) | (0.4) | 99.4 |
| Employment Programs | 429.0 | 540.2 | 969.2 | (322.2) | 647.0 | - | 20.6 | (0.4) | 667.2 |
| Workplace Skills | 96.1 | 88.4 | 184.5 | (56.4) | 128.1 | - | 29.3 | (0.1) | 157.3 |
| Learning | 162.2 | 1,064.7 | 1,226.9 | (15.6) | 1,211.3 | 981.5 | 0.4 | (0.2) | 2,193.0 |
| Labour | 213.4 | 3.9 | 217.3 | (78.0) | 139.3 | - | 32.2 | (0.3) | 171.2 |
| Homelessness | 40.4 | 147.9 | 188.3 | - | 188.3 | - | (0.1) | (0.1) | 188.1 |
| Policy and Program Support | 103.2 | - | 103.2 | (81.1) | 22.1 | - | 6.8 | (0.1) | 28.8 |
| Service Delivery | 128.1 | - | 128.1 | (89.2) | 38.9 | - | (7.4) | (0.2) | 31.3 |
| Total | 2,055.7 | 1,845.2 | 3,900.9 | (1,425.8) | 2,475.1 | 981.5 | 81.5 | (1.8) | 3,536.3 |
| 2006-2007 | ||||||||
| (millions of dollars) | Main Estimates Budgetary | Adjustments (planned spending not in Main Estimates) | Total Planned Spending | |||||
| Program Activity | Operating | Grants and Contributions | Gross | Respendable Revenue | (Net) Total Main Estimates | Other | Procurement Savings | |
| Social Investment | 138.1 | 30,871.6 | 31,009.7 | (30.4) | 30,979.3 | 2,264.1 | (0.5) | 33,242.9 |
| Social Development Policy and Innovation | 34.8 | 650.0 | 684.8 | (14.9) | 669.9 | (624.0) | (0.1) | 45.8 |
| Service Delivery | 508.8 | 0.0 | 508.8 | (255.9) | 252.9 | (33.7) | (2.5) | 216.7 |
| Total | 681.7 | 31,521.6 | 32,203.3 | (301.2) | 31,902.1 | 1,606.4 | (3.1) | 33,505.4 |
| Program Activities 2006-2007 | HUMAN RESOURCES AND SOCIAL DEVELOPMENT - PROGRAM ACTIVITIES | |||||||||
| 2006-2007 Planned Spending (millions of dollars) - net | Labour Market | Workplace Skills | Learning | Labour | Social Investment | Children and Families | Housing and Homelessness | Service Delivery | Policy, Research and Communication | Total |
| Former HRSDC | ||||||||||
| Employment Insurance | 99.4 | - | - | - | - | - | - | - | - | 99.4 |
| Employment Progams | 667.2 | - | - | - | - | - | - | - | - | 667.2 |
| Workplace Skills | - | 157.3 | - | - | - | - | - | - | - | 157.3 |
| Learning | - | - | 2,193.0 | - | - | - | - | - | - | 2,193.0 |
| Labour | - | - | - | 171.2 | - | - | - | - | - | 171.2 |
| Homelessness | - | - | - | - | - | - | 188.1 | - | - | 188.1 |
| Policy & Program Support | - | - | - | - | - | - | - | - | 28.8 | 28.8 |
| Service Delivery | - | - | - | - | - | - | - | 31.3 | - | 31.3 |
| Sub-Total Former HRSDC | 766.6 | 157.3 | 2,193.0 | 171.2 | - | - | 188.1 | 31.3 | 28.8 | 3,536.3 |
| Former SDC | ||||||||||
| Social Investment | - | - | - | - | 30,960.1 | 2,282.8 | - | - | - | 33,242.9 |
| Social Development Policy & Innovation | - | - | - | - | - | - | - | - | 45.8 | 45.8 |
| Service Delivery | - | - | - | - | - | - | - | 216.7 | - | 216.7 |
| Sub-Total Former SDC | - | - | - | - | 30,960.1 | 2,282.8 | - | 216.7 | 45.8 | 33,505.4 |
| Consolidated Total - Net Planned Spending | 766.6 | 157.3 | 2,193.0 | 171.2 | 30,960.1 | 2,282.8 | 188.1 | 248.0 | 74.6 | 37,041.7 |
| 2006-2007 | ||||
| (in millions of dollars) | ||||
| Voted or Statutory Item | Current Main Estimates | Previous Main Estimates | ||
| 1 | Operating expenditures | 323.2 | 266.0 | |
| 5 | Grants and contributions | 825.4 | 839.7 | |
| (S) | Minister of Human Resources and Skills Development - Salary and motor car allowance | 0.1 | 0.1 | |
| (S) | Minister of Labour - Salary and motor car allowance | 0.1 | 0.1 | |
| (S) | Payments related to the direct financing arrangement under the Canada Student Financial Assistance Act | 304.6 | 263.8 | |
| (S) | The provision of funds for interest payments to lending institutions under the Canada Student Loans Act | 0.1 | 0.1 | |
| (S) | The provision of funds for liabilities including liabilities in the form of guaranteed loans under the Canada Student Loans Act | 9.5 | 11.7 | |
| (S) | The provision of funds for interest and other payments to lending institutions and liabilities under the Canada Student Financial Assistance Act | 46.4 | 70.6 | |
| (S) | Canada Study Grants to qualifying full and part-time students pursuant to the Canada Student Financial Assistance Act | 119.9 | 83.0 | |
| (S) | Grants to the trustees of Registered Education Savings Plans (RESPs) for the benefit of beneficiaries named under those RESPs, pursuant to the Canada Education Savings Grant regulations of the Department of Human Resources Development Act | - | 430.0 | |
| (S) | Canada Education Savings Grant payments to Registered Educations Savings Plans (RESPs) trustees on behalf of RESP beneficiaries to encourage Canadians to save for post-secondary education of children | 575.0 | - | |
| (S) | Canada Learning Bond payments to Registered Education Savings Plans (RESPs) trustees on behalf of RESP beneficiaries to support access to post-secondary education to children from low-income families | 45.0 | - | |
| (S) | Supplementary Retirement Benefits - Annuities agents' pensions | - | - | |
| (S) | Labour adjustment benefits in accordance with the terms and conditions prescribed by the Governor in Council to assist workers who have been laid off as a result of import competition, industrial restructuring, or severe economic disruption | - | - | |
| (S) | Civil Service Insurance actuarial liability adjustments | 0.1 | 0.1 | |
| (S) | Payments of compensation respecting government employees and merchant seamen | 48.0 | 51.0 | |
| (S) | Contributions to employee benefit plans | 177.7 | 170.3 | |
| Total Budgetary | 2,475.1 | 2,186.5 | ||
| Loans disbursed under the Canada Student Financial Assistance Act | 981.5 | 1,040.8 | ||
| Total Department | 3,456.6 | 3,227.3 | ||
Financial Highlights
Human Resources and Skills Development Canada (HRSDC) Main Estimates for 2006-2007 total $3,456.6 million, representing a net increase of $229.3 million over the 2005-2006 Main Estimates amount of $3,227.3 million. The major changes are as follows:
- an increase of $57.2 million in net operating expenditures mainly due to:
- an increase related to the administration of Canada Education Savings Grant and Canada Learning Bond ($18.1 million);
- collective bargaining increases for staff ($12.8 million);
- administration of programs such as:
- Trades and Apprenticeship Strategy ($9.5 million) to work with provinces, territories and stakeholders to strengthen apprenticeships in the 45 Red Seal trades;
- Workplace Skills Innovation ($5.7 million) for the implementation of this program including activities such as assessment of projects, managing Calls for Proposals, accountability, compliance and evaluation;
- Labour Prevention Activities ($4.4 million) to enhance Integrity of Labour Program Delivery;
- Aboriginal Human Resources Development Strategy ($2.5 million) to help Aboriginal people find, prepare for, obtain and maintain employment;
- Canada Action Plan against Racism ($2.4 million) Labour to implement a Racism-Free Workplace Strategy aimed at removing barriers facing the employment and upward mobility of visible minorities and Aboriginal peoples in Canada and facilitate the integration of skilled individuals in Canadian workplaces;
- Immigration Portal ($2.3 million) for the development of information for prospective and new immigrants on credential and skills assessment and employment opportunities;
- National Literacy Secretariat ($2.0 million) to develop a national strategy on literacy and essential skills;
- Official Language Minority Communities ($1.6 million) to promote the vitality of these communities by ensuring they have the tools to enable their contribution;
- World Urban Forum Vancouver ($1.3 million) to organize and host this five-day international event with delegates expected from over 150 countries, which will take place June 19 - 23, 2006. This is a worldwide event focusing on cities, shelter and urbanization;
- Youth Internship Program ($0.9 million) for the transfer of the Federal Public Service Youth Internship Program, which represents the Government of Canada's commitment as a large national employer to supportthe transition of young people, particularly at-risk youth, into the labour market; and
- Training Centre Infrastructure Fund ($0.7 million) for the implementation and administration of this program including activities such as assessment of projects, managing Calls for Proposals,accountability, compliance and evaluation;
- allocation from the Government Advertising Plan for advertising campaigns related to Service Canada ($3.0 million) to promote citizen-centered government services;
- public notice campaigns ($0.7 million) including $0.65 million for Service Canada
- a decrease of $8.4 million related to the administration of grant and contribution programs; and
- various transfers to SDC ($2.8 million);
- a decrease of $14.3 million in voted grants and contributions largely due a decrease of $116.8 million related to the transfer of the Toronto Waterfront Revitalization Initiative. This decrease is reduced by increases of $102.5 million for new or enhanced programs such as:
- Workplace Skills Initiative ($31.7 million) to support partnership-based projects to test new approaches to encourage employer investment in workplace skills development, with a focus on small and medium-sized enterprises;
- Aboriginal Human Resources Development Strategy ($22.5 million) to help Aboriginal people find, prepare for, obtain and maintain employment;
- Official Language Minority Communities which provides for the development of human resources, economic growth and job creation and retention in those communities ($12.0 million);
- Training Centre Infrastructure Fund ($11.0 million) to support employer-union training centres in the purchase of new machinery and equipment for trades that have undergone significant technological change, broadened scope, or new curricula;
- the World Urban Forum Vancouver 2006, a worldwide event focusing on cities, shelter and urbanization, ($9.6 million);
- the National Literacy Secretariat to promote literacy in the workplace ($8.6 million);
- Early Learning and Child Care for First Nations' children living on reserve ($6.8 million) to build new ELCC centres, upgrade existing centres and to increase access to training for ELCC workers.
- an increase of $245.7 million in statutory program payments, mainly due to:
- an increase of $51.3 million in Canada Student Loans Program (CSLP) due to:
- an increase of $40.8 million in Payments related to the Direct Financing Arrangements under the Canada Student Financial Assistance Act due to enhancements to existing debt management measures, increase in administrative fees paid to participating provinces and changes to loans forgiveness;
- a decrease of $2.2 million in Liabilities under the Canada Student Loans Act due to downward estimate adjustments of Claim Payments base on the analysis of historical trend and the revised portfolio projections of the Guaranteed Loans portfolio;
- a decrease of $24.2 million in Interest and other Payments under the Canada Student Financial Assistance Act mainly due to enhancements to the existing debt management measures;
- an increase of $36.9 million for the Canada Study Grant mainly due to the implementation of two new Canada Access Grants for students with permanent disabilities and students from low-income families;
- the introduction of the new Canada Learning Bond ($45.0 million) which provide education savings for children in families entitled to the National Child Benefit;
- increased demand for the Canada Education Savings Grant ($145.0 million) which provide a grant to beneficiaries of a Registered Education Savings Plan. A new wording is being introduced in 2006-2007 Main Estimates due to coming into force of the Canada Education Savings Act and to include the purpose of encouraging Canadians to save for post-secondary education of children. $575.0 million is reflected under the new wording and $430.0 million under the old wording
- a net decrease of $3.0 million for Workers' Compensation related to an anticipated increase in revenues from other government departments and Crown corporations under the cost recovery initiative for Workers' Compensation;
- an increase of $7.4 million to the Employee Benefit Plan costs related to an increase in salary costs;
- an increase of $51.3 million in Canada Student Loans Program (CSLP) due to:
- a decrease of $59.3 million in non-budgetary payments for loans disbursed under the Canada Student Financial Assistance Act. This decrease is primarily due to the impact of increased loan reimbursements of $288.4 million from borrowers on the loan portfolio, offset by an increase of $229.1 million in Canada Student loans due to the increase of the loan limit from $165 to $210 per week of study.
| 2006-2007 | |||
| ($ millions) | |||
| Voted or Statutory Item | Voted or Statutory Wording | Current Main Estimates | Previous Main Estimates |
| 10 | Operating expenditures | 295.6 | 244.0 |
| 15 | Grants and contributions | 946.6 | 280.8 |
| (S) | Minister of Human Resources Development- Salary and motor car allowance | 0.0 | 0.1 |
| (S) | Old Age Security Payments | 23,255.0 | 22,209.0 |
| (S) | Guaranteed Income Supplement payments | 6,820.0 | 6,233.0 |
| (S) | Allowance Payments | 500.0 | 451.0 |
| (S) | Payments to private collection agencies pursuant to Section 17.1 of theFinancial Administration Act | 18.5 | 19.4 |
| (S) | Contribution to employee benefit plans | 66.4 | 62.4 |
| Total Department | 31,902.1 | 29,499.7 | |
Financial Highlights
Social Development Canada Main Estimates for 2006-2007 total $31,902.1 million, representing a net increase of $2,402.4 million over the 2005-2006 Main Estimates amount of $29,499.7 million. The major changes are as follows:
- an increase of $51.5 million in net operating expenditures mainly due to:
- the signing of new collective agreements ($10.7 million);
- additional funds for the Participation and Activity Limitation Survey which is a comprehensive national survey of Canadians with disabilities who live in private households ($6.6 million);
- implementation of information campaigns directed at people with disabilities, seniors, families and children ($6.0 million);
- administration of grant and contribution programs ($8.4 million),
- Understanding Early Years to help give Canadian children the best possible start in life by providing communities with information on the readiness-to-learn of their children ($5.0 million);
- New Horizons supporting local projects across Canada that encourage seniors to contribute to their communities through their social participation and active living ($1.9 million);
- Voluntary Sector Strategy a partnering of the federal government and the voluntary sector to put in place a framework of community-based collaboration and innovation to improve the economic and social well-being of Canadians ($1.5 million);
- National Seniors Secretariat to provide a focal point for federal seniors-related efforts and support the development of a collaborative approach to seniors' issues with a diverse array of partners ($2.3 million);
- Official Languages Action Plan to support vibrant official language minority communities, ($1.1 million);
- an increase to reference levels to reflect the repayment of resources which supported Year 2000 preparation ($10.5 million); and
- various transfers from Human Resources and Skills Development ($2.8 million).
- an increase of $665.9 million in voted grants and contributions largely due to:
- payments to provinces and territories for the purpose of providing transition funding
($650.0 million) to provinces and territories to phase-out the 2005 Early Learning and Child Care agreements signed by the previous government; - expanding Understanding the Early Years, to gather information about their children's readiness to learn, as well as information on influencing factors and local supports ($5.6 million);
- the New Horizon for Seniors program supporting local projects across Canada that encourage seniors to contribute to their communities through their social participation and active living ($7.8 million); and
- Grant to The Canadian Policy Research Networks Inc., which is an independent, non-profit research organization with charitable status. CPRN's mission is to inform the development of social and economic policy in Canada through research and public engagement ($3.0 million).
- payments to provinces and territories for the purpose of providing transition funding
- an increase of $1,685.0 million in statutory program payments, mainly due to:
- an increase of $1,682.0 million to the Income Security Programs comprised of: the Old Age Security payments ($1,046.0 million); the Guaranteed Income Supplement payments offering a supplemental revenue to the Old Age Security beneficiaries with low income ($587.0 million), and the Allowance payments, offering an additional income-tested benefit for low income surviving persons and for couples living on the Old Age Security benefits of only one spouse or common-law partner ($49.0 million). The increase is explained by the increasing overall population in persons 65+ over in receipt of OAS basic (2.31%), GIS (3.90%) and Allowance (4.95%), plus the increasing average annual benefit amount - OAS basic (2.73%), GIS (2.28%) and Allowance (4.57%);
- a decrease of $0.9 million for payments to private collection agencies as the default accounts will be sent more rapidly to the agencies; and
- an increase of $4.0 million to the employee benefit plan contributions related to an increase in salary costs.
| (millions of dollars) | 2006-2007 |
| Contributions covering employers' share of employees' insurance premiums and expenditures paid by Treasury Board Secretariat | 14.0 |
| Salary and associated expenditures of legal services provided by the Department of Justice Canada | 3 .7 |
| Total 2006-2007 Services received without charge | 17.7 |
| ($ millions) | 2006-2007 |
| Contributions covering employers' share of employees' insurance premiums and expenditures paid by TBS | 16.3 |
| Worker's Compensation coverage provided by Human Resources and Skills Development | 0.3 |
| Salary and associated expenditures of legal services provided by Justice Canada | 0.1 |
| Total 2006-2007 Services received without charge | 16.7 |
| Total Authority | Planned Revenue | |||
| (millions of dollars) | 2005-2006 | 2006-2007 | 2007-2008 | 2008-2009 |
| Learning | ||||
| Loans disbursed under the Canada Student Financial Assistance Act | 1,331.3 | 981.5 | 769.1 | 560.8 |
| Total | 1,331.3 | 981.5 | 769.1 | 560.8 |
| RESPENDABLE REVENUE | Total Authority | Planned Revenue | ||
| (millions of dollars) | 2005-2006 | 2006-2007 | 2007-2008 | 2008-2009 |
| Employment Insurance | ||||
| EI Recovery | 754.2 | 780.0 | 778.6 | 781.3 |
| Employment Programs | ||||
| EI Recovery | 328.7 | 330.1 | 330.7 | 325.0 |
| Workplace Skills | ||||
| EI Recovery | 69.1 | 62.0 | 56.7 | 56.7 |
| Learning | ||||
| EI Recovery | 7.4 | 15.8 | 15.6 | 15.6 |
| Labour | ||||
| Worker's Compensation - OGD | 76.6 | 77.4 | 78.4 | 80.4 |
| EI Recovery | 0.6 | 0.6 | 0.6 | 0.6 |
| 77.2 | 78.0 | 79.0 | 81.0 | |
| Homelessness | - | - | - | - |
| Policy and Program Support | ||||
| EI Recovery | 107.9 | 91.3 | 86.9 | 86.6 |
| CPP Recovery | 2.2 | - | - | - |
| 110.1 | 91.3 | 86.9 | 86.6 | |
| Service Delivery | ||||
| EI Recovery | 77.7 | 63.3 | 63.1 | 63.0 |
| CPP Recovery | 13.1 | 14.7 | 14.7 | 14.7 |
| 90.8 | 78.0 | 77.8 | 77.7 | |
| Total Respendable Revenue | 1,437.5 | 1,435.2 | 1,425.3 | 1,423.9 |
| NON-RESPENDABLE REVENUE | ||||
| Employment Insurance | ||||
| EBP Recovery from EI | 94.1 | 91.8 | 90.9 | 91.0 |
| Employment Programs | ||||
| EBP Recovery from EI | 30.2 | 25.8 | 25.8 | 25.3 |
| Workplace Skills | ||||
| EBP Recovery from EI | 8.0 | 6.4 | 6.3 | 6.2 |
| Learning | ||||
| EBP Recovery from EI | 0.7 | 1.3 | 1.3 | 1.3 |
| Canada Student Loans | 395.6 | 503.6 | 589.5 | 663.8 |
| 396.3 | 504.9 | 590.8 | 665.1 | |
| Labour - Service Fees | 2.2 | 2.2 | 2.4 | 2.5 |
| Homelessness - Recovery of EBP | - | - | - | - |
| Policy and Program Support Recovery of EBP | ||||
| EBP Recovery from EI | 4.1 | 6.6 | 6.2 | 6.2 |
| EBP Recovery from CPP | 0.1 | - | - | - |
| 4.2 | 6.6 | 6.2 | 6.2 | |
| Service Delivery Support Recovery of EBP | ||||
| EBP Recovery from EI | 12.5 | 8.7 | 8.6 | 8.6 |
| EBP Recovery from CPP | 2.1 | 2.1 | 2.1 | 2.1 |
| 14.6 | 10.8 | 10.7 | 10.7 | |
| Total Non-Respendable Revenue | 549.6 | 648.5 | 733.1 | 807.0 |
| Total Respendable and Non-Respendable Revenue | 1,987.1 | 2,083.7 | 2,158.4 | 2,230.9 |
| RESPANDABLE REVENUE | ||||
| Total Authority | Planned Revenue | |||
| (millions of dollars) | 2005-2006 | 2006-2007 | 2007-2008 | 2008-2009 |
| Social Investment | ||||
| EI Recovery | - | 5.7 | 5.4 | 5.4 |
| CPP Recovery | 52.7 | 43.3 | 43.6 | 43.5 |
| 52.7 | 49.0 | 49.0 | 48.9 | |
| Social Development Policy and Innovation | ||||
| EI Recovery | 11.5 | 8.6 | 9.2 | 9.2 |
| CPP Recovery | - | 12.9 | 12.7 | 12.7 |
| 11.5 | 21.5 | 21.9 | 21.9 | |
| Service delivery | ||||
| EI Recovery | 60.2 | 54.5 | 55.6 | 55.5 |
| CPP Recovery | 187.8 | 175.9 | 176.2 | 176.2 |
| 248.0 | 230.4 | 231.8 | 231.7 | |
| Total Respendable Revenue | 312.2 | 300.9 | 302.7 | 302.5 |
| NON-RESPENDABLE REVENUE | ||||
| Social Investment | ||||
| EBP Recovery from EI | - | 0.3 | 0.5 | 0.5 |
| EBP Recovery from CPP | 4.2 | 2.5 | 2.5 | 2.5 |
| User fee: Searches of the CPP and OAS data banks to locate individuals |
0.1 | 0.1 | 0.1 | 0.1 |
| 4.3 | 2.9 | 3.1 | 3.1 | |
| Social Development Policy and Innovation | ||||
| EBP Recovery from EI | 1.2 | 0.7 | 0.6 | 0.6 |
| EBP Recovery from CPP | - | 0.9 | 0.9 | 0.9 |
| 1.2 | 1.6 | 1.5 | 1.5 | |
| Service Delivery | ||||
| EBP Recovery from EI | 6.8 | 6.0 | 6.1 | 6.1 |
| EBP Recovery from CPP | 15.1 | 14.4 | 14.6 | 14.5 |
| User fee: Social Insurance Number Replacement | ||||
| Card Fee | 1.9 | 1.9 | 1.9 | 1.9 |
| 23.8 | 22.3 | 22.6 | 22.5 | |
| Total Non-Respendable Revenue | 29.3 | 26.8 | 27.2 | 27.1 |
| Total Respendable and Non-respendable Revenue | 341.5 | 327.7 | 329.9 | 329.6 |
| Program Activities 2006-2007 | HUMAN RESOURCES AND SOCIAL DEVELOPMENT - PROGRAM ACTIVITIES | |||||||||
| 2006-2007 Total Revenue (millions of dollars) | Labour Market | Workplace Skills | Learning | Labour | Social Investment | Children andFamilies | Housing and Homelessness | Service Delivery | Policy, Research and Communication | Total |
| Former HRSDC | ||||||||||
| Employment Insurance | 871.8 | - | - | - | - | - | - | - | - | 871.8 |
| Employment Progams | 355.9 | - | - | - | - | - | - | - | - | 355.9 |
| Workplace Skills | - | 68.4 | - | - | - | - | - | - | - | 68.4 |
| Learning | - | - | 520.7 | - | - | - | - | - | - | 520.7 |
| Labour | - | - | - | 80.2 | - | - | - | - | - | 80.2 |
| Homelessness | - | - | - | - | - | - | - | - | - | |
| Policy & Program Support | - | - | - | - | - | - | - | - | 97.9 | 97.9 |
| Service Delivery | - | - | - | - | - | - | - | 88.8 | - | 88.8 |
| Sub-Total Former HRSDC | 1,227.7 | 68.4 | 520.7 | 80.2 | - | - | - | 88.8 | 97.9 | 2,083.7 |
| Former SDC | ||||||||||
| Social Investment | - | - | - | - | 52.0 | - | - | - | - | 52.0 |
| Social Development Policy | ||||||||||
| & Innovation | - | - | - | - | - | - | - | - | 23.0 | 23.0 |
| Service Delivery | - | - | - | - | - | - | - | 252.7 | - | 252.7 |
| Sub-Total Former SDC | - | - | - | - | 52.0 | - | - | 252.7 | 23.0 | 327.7 |
| Consolidated Total Revenue | 1,227.7 | 68.4 | 520.7 | 80.2 | 52.0 | - | - | 341.5 | 120.9 | 2,411.4 |
| Regulations | Planned Results |
| Strategic Outcome: Enhanced Canadian productivity and participation through efficient and inclusive labour markets, competitive workplaces and access to learning | |
| No major regulatory initiatives have been identified for the Employment Insurance (EI) Program in 2006-2007. Regulatory changes to support EI operations and administration will be undertaken as required. | |
| Employment Insurance (EI) Fishing Regulations - section 77.4 | The change will ensure that entitlement to EI fishing benefits take into account the existence of Quebec's Parental Insurance Plan. |
| Employment Insurance (EI) Regulatory Amendment - Extended EI Benefits Pilot Project | The change will put in place the announced pilot project to test the impacts of increasing entitlement by five (5) additional weeks of regular benefits to EI claimants, up to a maximum of 45 weeks of benefits, in 21 EI regions. |
| Employment Insurance Regulatory Amendment -Compassionate Care Benefit | The change will broaden the definition of family member for determining eligibility for the Compassionate Care Benefit. |
| Strategic Outcome: Enhanced Canadian productivity and participation through efficient and inclusive labour markets, competitive workplaces and access to learning | |
| Housekeeping improvements to the Canada Student Loans Program regulatory framework: | The legislative and regulatory framework of the Canada Student Loans Program has undergone frequent, almost yearly, changes since the inception of the program. Ongoing legislative and regulatory improvements are required in order to keep step with these changes. |
| The Canada Student Loans Program is planning to move ahead with regulatory changes to make the program more effective and efficient as well as to clarify the rules regarding certain benefits. | |
| Amendments to the Canada Student Financial Assistance Regulations and the Canada Student Loans Regulations are required to implement these changes. | |
| Strategic Outcome: Safe, healthy, fair, stable, cooperative and productive workplaces and effective international labour standards | |
| Employment Equity Act - Employment Equity Regulations | Updated Regulations will include these consequential changes:
|
| Workplace Violence Prevention Regulations | These regulations are intended to prevent direct or indirect acts of violence in workplaces subject to federal jurisdiction. |
Over the three fiscal years (2006-2007 to 2008-2009), HRSDC will manage the following transfer payment programs in excess of $5 million:
|
| Further information on these projects can be found at http://www.tbs-sct.gc.ca/est-pre/20062007/p3a-eng.asp |
In 2006-2007, HRSDC will contribute to the Winnipeg Foundation using conditional grants; the remaining foundations received one-time funding in past years:
|
| Further information on these projects can be found at http://www.tbs-sct.gc.ca/est-pre/20062007/p3a-eng.asp |
During fiscal year 2006-2007, HRSDC will be involved in the following
horizontal initiatives. Unless otherwise mentioned in the list, HRSDC acts
as the lead Department for these initiatives.
|
| Supplementary information on Horizontal Initiatives can be found at http://www.tbs-sct.gc.ca/est-pre/20062007/p3a-eng.asp |
| In February 2006 the Departments of Social Development Canada and Human Resources and Skills Development Canada were combined into the new Department of Human Resources and Social Development. The sustainable development efforts of the former departments have been integrated and the priority for the planning period will be to complete the development of a new HRSDC Sustainable Development Strategy for 2007-2009. The Department will also continue to work toward completing the commitments from the final year of the 2004-2006 SDS. |
| The new departmental sustainable development strategy will articulate how environmental economic and social factors are considered in the development of policy and programs as well as in day-today operations. |
Objectives for the Planning Period
|
| Detailed information on the current Sustainable Development Strategy (SDS-III), including specific goals, objectives and targets can be seen at the following departmental website: http://www.hrsdc.gc.ca/en/cs/fas/as/sds/sdd.shtml . |
| As a result of the departmental reorganization, the internal audit and evaluation groups are redefining the audit and evaluation universe as well as updating and realigning risk factors to produce a new risk-based multi-year audit and evaluation plan reflective of the new departmental priorities and accountabilities. The Office of the Comptroller General's plan for horizontal audits and the audit schedule of the Office of the Auditor General will potentially affect the departmental plan. The following internal audit and evaluation projects should be viewed within this context. | |
| Evaluations to be completed in 2006-2007 | Internal Audit Plan 2006-2007 |
|
Employment Insurance Employment Programs Summative Evaluation of Labour Market Development Agreement — Alberta Workplace Formative Evaluation of the Foreign Credential Recognition Program Labour Strategic Evaluation of Workplace Equity Programs Learning Formative Evaluation of National Literacy Secretariat Homelessness and Housing Summative Evaluation of National Homelessness Initiative People with Disabilities Summative Evaluation of the Opportunities Fund for Persons with Disabilities, Phase I Other Evaluation of the World Urban Forum 3 |
Carry-over Projects from 2005-2006 2004-2005 Attest Audit of the Administrative Costs Charged to the Canada Pension Plan Account New Projects for 2006--2007 World Urban Forum — Phase I Labour Occupational Safety and Health Service Canada Grants and Contributions Financial and Activity Financial Audits Payroll Expenditures |
Specified Purpose Accounts
Introduction
Specified Purpose Accounts (SPA) are special categories of revenues and expenditures. They report transactions of certain accounts where enabling legislation requires that revenues be earmarked and that related payments and expenditures be charged against such revenues. The transactions of these accounts are to be accounted for separately.
HRSDC is responsible for the stewardship of four such accounts:
- the Employment Insurance (EI) Account
- the Canada Pension Plan (CPP)
- the Government Annuities Account
- the Civil Service Insurance Fund
The EI Account is a consolidated SPA and is included in the financial reporting of the Government of Canada. Consolidated SPAs are used principally where the activities are similar in nature to departmental activities and the transactions do not represent liabilities to third parties but, in essence, constitute Government revenues and expenditures.
The CPP is a SPA but is not consolidated as part of the Government of Canada financial statements. It is under joint control of the Government and participating provinces. As administrator, the Government's authority to spend is limited to the balance of the Plan.
The Government Annuities Account is a consolidated SPA and is included in the financial reporting of the Government of Canada. It was established by the Government Annuities Act, and modified by the Government Annuities Improvement Act, which discontinued sales of annuities in 1975. The account is valued on an actuarial basis each year, with the deficit or surplus charged or credited to the Consolidated Revenue Fund.
The Civil Service Insurance Fund is a consolidated SPA and is included in the financial reporting of the Government of Canada. It was established by the Civil Service Insurance Act. Pursuant to subsection 16(3) of the Civil Service Insurance Regulations, the amount of actuarial deficits is transferred from the Consolidated Revenue Fund to the Civil Service Insurance Account in order to balance the assets and liabilities of the program.
Employment Insurance Account
Description
The Employment Insurance (EI) Account was established in the Accounts of Canada by the Employment Insurance Act (EI Act) to record all amounts received or paid out under that Act. The EI Act provides short-term financial relief and other assistance to eligible workers. The program covers all workers in an employer-employee relationship. Self-employed fishers are also included under special regulation of the EI Act. In 2005, 15.4 million Canadians contributed to the Program and 2.5 million received benefits.
Employment Insurance provides:
Income Benefits under Part I of the EI Act provide temporary income support to claimants, including self-employed fishers, while they look for work. This includes work-sharing agreements for temporary work shortages to allow employees to receive pro-rated EI benefits while working for part of a week, thus avoiding layoffs. EI also provides four types of special benefits: maternity benefits, payable to biological mothers for work missed as a result of pregnancy and childbirth; parental benefits, payable to both biological and adoptive parents for the purpose of caring for a new born or adopted child; sickness benefits, payable to claimants who are too ill to work; and compassionate care benefits, payable to claimants who provide care to a gravely ill or dying family member.
Employment Benefits under Part II of the EI Act through a set of Employment Benefits and Support Measures that can be tailored to meet the needs of individuals and local circumstances. The Government of Canada has Labour Market Development Agreements with the governments of most provinces and territories. These enable provincial and territorial governments to assume direct responsibility for the design and delivery of these benefits or to take part in co-management arrangements with the federal government.
Employers and workers pay all costs associated with EI through premiums. Benefits and administrative costs are paid out of the Consolidated Revenue Fund and charged to the EI Account. A surplus in the Account generates interest at a rate established by the Minister of Finance, which is currently set at 90% of the monthly average of the three-month Treasury bill rate.
Financial Summary
The premium rate for 2006 was set on a breakeven basis. However, as the economy is expected to be better than that was expected at the time the 2006 premium rate was set, in 2006-2007, premium revenue is now expected to be about $400 million higher than the benefits and administrative costs. Total revenues, including interest earned, are expected to exceed total costs by $2.4 billion, which will increase the cumulative surplus to $53.1 billion as of March 31, 2007. The changes in benefits and premium are explained as follows:
- Benefits are expected to increase by 1.1% to $14.6 billion. This is due to a 3.4% expected increase in the average weekly benefits offset by a 3.0% expected decrease in the number of beneficiaries and the decrease in maternity and parental benefits when the Quebec Parental Insurance Plan (QPIP) is fully implemented.
- Premium revenue is expected to decrease to $16.6 billion, as the reduction in premium rates to 1.87% in 2006 offset the rising employment and earnings. The decrease in premium revenue includes a full year's premium reduction under QPIP.
The following chart summarizes trends in total costs and revenues of the EI Account from 1994-1995 to 2006-2007.
| 1994-1995 | 1995-1996 | 1996-1997 | 1997-1998 | 1998-1999 | 1999-2000 | 2000-2001 | 2001-2002 | 2002-2003 | 2003-2004 | 2004-2005 | 2005-2006 | 2006-2007 | |
| Total Costs | 16.51 | 15.02 | 13.81 | 13.21 | 13.24 | 12.74 | 12.79 | 15.24 | 16.10 | 16.65 | 16.38 | 16.11 | 16.26 |
| Total Revenues | 19.43 | 18.94 | 20.48 | 19.55 | 20.57 | 19.97 | 21.22 | 19.15 | 19.37 | 19.07 | 18.70 | 18.32 | 18.64 |
The table below summarizes the financial results for the EI Account from 2003-2004 to 2006-2007.
| Actual | Forecast | Planned Spending | ||
| (millions of dollars) | 2003-2004 | 2004-2005 | 2005-2006 | 2006-2007 |
| Expenditures | ||||
| Benefits | 15,070 | 14,748 | 14,418 | 14,580 |
| Administrative Costs | 1,521 | 1,542 | 1,638 | 1,624 |
| Doubtful Accounts | 60 | 95 | 56 | 57 |
| Total Costs | 16,651 | 16,385 | 16,112 | 16,261 |
| Revenues | ||||
| Premium Revenue | 17,900 | 17,655 | 16,917 | 16,621 |
| Penalties | 47 | 51 | 50 | 54 |
| Interest | 1,125 | 995 | 1,352 | 1,968 |
| Total Revenues | 19,072 | 18,701 | 18,319 | 18,643 |
| Surplus | ||||
| Current Year | 2,421 | 2,316 | 2,207 | 2,382 |
| Cumulative | 46,233 | 48,549 | 50,756 | 53,139 |
| Notes: The EI premiums reported in the summary financial statements of the Government of Canada exclude the premium contributions made by the Government of Canada as an employer. Totals may not add due to rounding. | ||||
Benefit Payments
Benefits in 2006-2007 are expected to reach $14.6 billion, consisting of 12.4 billion for Income Benefits and $2.1 billion for Employment Benefits and Support Measures.
Income Benefits
EI Income Benefits include regular, special, work-sharing and fishers' benefits.25 Major aspects of these benefits are as follows:
Regular Benefits
Amount of Work Required to Qualify for Benefits
Most claimants require 420 to 700 hours of work during their qualifying period, regardless of whether from full-time or part-time work, or whether the work is with one employer or several. The exact number of hours required is called the "variable entrance requirement". It is determined by the rate of unemployment in a claimant's region at the time he or she applies for benefits. In general, the higher the rate of unemployment, the fewer hours of work required to qualify.
People who have just entered the labour market ("new entrants") and those returning to the labour force after an absence ("re-entrants") require 910 hours of work. However, if they worked at least 490 hours in the preceding 12 months, or received at least one week of maternity or parental benefits in the four years before that, they will be eligible under normal rules the following year.
Determining the Benefit Rate and Entitlement
Claimants for regular benefits may receive benefits for 14 to 45 weeks, depending upon their hours of insurable employment and the regional unemployment rate.
Claimants' weekly benefits are 55% of their average insurable earnings during the last 26 weeks. The average insurable earnings are based on the actual weeks of work, subject to a minimum divisor that is tied to the regional rate of unemployment.
Claimants with a combined family income of less than $25,921 and who qualify for the Canada Child Tax Benefit (CCTB) receive a Family Supplement based upon:
- the net family income
- the number of dependent children
- the ages of those dependent children
The benefit rate for claimants who receive a Family Supplement can be increased to a maximum of 80% of the claimant's average weekly insurable earnings, up to the maximum weekly benefit of $413.
Pilot Projects
The Extended EI Benefits Pilot project increases regular benefit entitlement up to 5 additional weeks in high unemployment regions, to a maximum entitlement of 45 weeks of benefits, for claims established in the period beginning on June 11, 2006 and ending in the week of December 9, 2007. This replaces a previous pilot project in high unemployment regions which also provided five additional weeks of benefits for claims established in the period beginning on June 6, 2004 and ending in the week of June 4, 2006. This is an interim measure and the Government's priority continues to be to help Canadians participate in the labour market.
Three pilot projects have been implemented in regions of high unemployment (10 percent or higher). Effective October 30, 2005, in affected regions, EI benefits will be calculated based on the "best 14 weeks" of earnings over the 52 weeks preceding a claim for benefits. Effective December 11, 2005, individuals new to the labour market or returning after an extended absence can qualify for EI regular benefits with a minimum of 840 hours worked (rather than 910), and the working-while-on-claim threshold for calculating benefits will be increased to $75 or 40% of weekly benefits (up from $50 or 25% of weekly benefits).
Special Benefits
Claims for sickness, maternity, parental, or compassionate care benefits require 600 hours of work, and are not affected by the new entrant/re-entrant rule. All claimants may receive sickness benefits for up to 15 weeks. Parental benefits of 35 weeks are available for biological and adoptive parents in addition to the 15 weeks of maternity benefits available to biological mothers. Compassionate care benefits of 6 weeks are available for those providing care for a gravely ill or dying family member (a sibling, grandparent, grandchild, in-law, aunt, uncle, niece, nephew, foster parent, ward, guardian, or a gravely ill person who considers the claimant to be like a family member).
On March 1, 2005 the Government of Canada and the Government of Quebec signed the final agreement on Quebec Parental Insurance Plan. Effective January 2006, Quebec residents will claim maternity and parental benefits from the Quebec provincial government. All benefits paid by the federal government for maternity and parental benefits in Quebec for claims established before 2006 but paid after January 2006 will be reimbursed by the Quebec government.
Work Sharing
Claimants may receive benefits while on work-sharing agreements. These agreements between HRSDC, employees and employers attempt to avoid temporary layoffs by combining partial EI benefits with reduced workweeks. They normally last from 6 to 26 weeks.
Fishers' Benefits
Fisher claims have duration and benefit rates that depend on the earnings from fishing and the regional rate of unemployment. All fisher claims have a 31-week maximum qualifying period and a maximum entitlement of 26 weeks of benefits. These can be claimed from October 1st to June 15th for summer fishers' benefits and April 1st to December 15th for winter fishers' benefits. Fishers can file claims for both seasons. Benefit rates for fisher claims are determined by a minimum divisor that depends on the regional rate of unemployment.
Benefit Repayments
When the net annual income of EI claimants exceeds 1.25 times the maximum yearly insurable earnings ("the repayment threshold"), they have to repay the lesser of 30% ("the repayment rate") of the net excess income or 30% of the amount of total benefits other than special benefits paid. In addition, first-time claimants of regular or fishing benefits are exempt from benefit repayment.
| Actual | Forecast | Planned Spending | ||
| (millions of dollars) | 2003-2004 | 2004-2005 | 2005-2006 | 2006-2007 |
| Income Benefits | ||||
| Regular | 9,122 | 8,669 | 8,411 | 8,832 |
| Sickness | 754 | 797 | 835 | 870 |
| Maternity | 909 | 925 | 903 | 765 |
| Parental | 2,015 | 2,112 | 2,064 | 1,760 |
| Compassionate Care | 2 | 7 | 8 | 10 |
| Fishing | 337 | 313 | 285 | 310 |
| Work Sharing | 27 | 11 | 13 | 20 |
| Benefit Repayments | (114) | (153) | (117) | (125) |
| Total Income Benefits | 13,052 | 12,681 | 12,402 | 12,442 |
| Note: Totals may not add due to rounding. | ||||
| Actual | Forecast | Planned Spending | % | ||
| 2003-2004 | 2004-2005 | 2005-2006 | 2006-2007 | Change | |
| Income Benefits ($ million) | 13,052 | 12,681 | 12,402 | 12,442 | 0.3% |
| Average Monthly Beneficiaries (000's | 848 | 819 | 788 | 764 | (3.0%) |
| Benefit Rate ($/week) | 295 | 299 | 302 | 312 | 3.4% |
Employment Benefits and Support Measures
The Employment Benefits include Skills Development, Job Creation Partnerships, Self-Employment and Targeted Wage Subsidies.
The Support Measures include Employment Assistance Services, Labour Market Partnerships and Research and Innovation.
Part II of the EI Act also authorizes the federal government to make payments to the governments of the provinces and territories for implementing programs similar to Employment Benefits and Support Measures. The planned federal contribution to provinces and territories (i.e., New Brunswick, Quebec, Ontario, Manitoba, Saskatchewan, Alberta, Northwest Territories and Nunavut) under Labour Market Development Agreements is $889 million for 2006-2007. This $889 million does not reflect the amount to be transferred to Ontario in 2006-2007, as the transfer and its associated administrative costs are being negotiated for implementation on January 1, 2007.
The total planned spending for Employment Benefits and Support Measures in 2006-2007 is set at $2,138 million or 0.5% of the total estimated insurable earnings of $401,239 million. This is below the 0.8% ceiling set under Section 78 of the EI Act.
| Actual | Forecast | Planned Spendinga | ||
| (millions of dollars) | 2003-2004 | 2004-2005 | 2005-2006 | 2006-2007 |
| Job Creation Partnerships | 74 | 71 | 54 | |
| Skills Development | 355 | 429 | 410 | |
| Self-Employment | 96 | 115 | 107 | |
| Targeted Wage Subsidies | 45 | 48 | 42 | |
| Employment Assistance | 334 | 324 | 322 | |
| Labour Market Partnerships | 192 | 173 | 177 | |
| Research & Innovation | 27 | 17 | 15 | |
| Total HRSDC Programs | 1,124 | 1,176 | 1,127 | 1,249 |
| Transfers to Provinces and Territories | 894 | 891 | 889 | 889 |
| Total | 2,018 | 2,067 | 2,016 | 2,138 |
| a. Breakdown by component is not available, as spending will be guided by local labour market needs. Breakdown by provinces/territories is provided in the EI Part II - 2006-2007 Expenditure Plan. Note: Totals may not add due to rounding. | ||||
Premiums
Premiums are collected from insured employees and their employers to cover the program costs over a business cycle, based on a yearly premium rate and employees' insurable earnings. The factors affecting the premiums are further explained below:
Premium Rate: Through Budget 2005, the Government of Canada introduced a new permanent rate-setting mechanism and gave the EI Commission the legislative authority to set the EI premium rate. Under the new rate-setting process, the Chief Actuary is required to annually calculate, on a forward-looking basis, the estimated break-even rate for the coming year based on the most current forecast values of the relevant economic variables provided by the Minister of Finance. The forward-looking basis means that surpluses, deficits, and the notional interest credited to the EI Account do not enter into the calculation of the "break-even" premium rate. For 2006, the Commission set the employee rate at 1.87% of insurable earnings, which is a reduction from 2005 rate of 1.95%. The corresponding employer rate will be 2.62%, a reduction from its current level of 2.73%. The 2006 EI rate represents the twelfth consecutive rate reduction since 1994, when the employee rate was 3.07%
| 1994 | 1995 | 1996 | 1997 | 1998 | 1999 | 2000 | 2001 | 2002 | 2003 | 2004 | 2005 | 2006 | |
| Premium rate | 3.07 | 3.00 | 2.95 | 2.90 | 2.70 | 2.55 | 2.40 | 2.25 | 2.20 | 2.10 | 1.98 | 1.95 | 1.87 |
Maximum Yearly Insurable Earnings (MYIE): Premiums are paid on all employment earnings of insured employees up to the MYIE. Section 4 of the EI Act provides that the MYIE will be $39,000 until the value of the twelve month weekly average earnings ending in June of the first preceding year times the ratio of the same average to the corresponding average for the second preceding year times 52 and rounded down to the nearest $100 exceeds that threshold.26
Premium Reduction: Employers with qualified wage-loss insurance plans are entitled to premium reductions. They are required to share this reduction with their employees.27
Additionally, with the implementation of QPIP, the premium rate for employees in Quebec will be reduced to 1.53% in 2006 and the corresponding rate for employers is 2.14%. It is estimated that in 2006 the amount of premiums collected in Quebec will be $794 million less.
Premium Refund:
- Workers with annual earnings of $2,000 or less can receive a refund of their EI premiums through the income tax system.
EI premiums are refunded to employees when their insurable earnings are in excess of the maximum yearly insurable earnings.
| Actual | Forecast | Planned Spending | % | ||
| (millions of dollars) | 2003-2004 | 2004-2005 | 2005-2006 | 2006-2007 | Change |
| Fiscal Year Factors | |||||
| Premium Revenue ($ million) | 17,900 | 17,655 | 16,917 | 16,621 | (1.7%) |
| Total Insurable Earnings ($ million) | 372,373 | 384,426 | 393,479 | 401,239 | 2.0% |
| 2003 | 2004 | 2005 | 2006 | ||
| Calendar Year Factors | |||||
| Employee Premium Ratea | |||||
| (% of insurable earnings) | 2.10% | 1.98% | 1.95% | 1.87% | (4.1%) |
| Maximum Insurable Earnings ($) | 39,000 | 39,000 | 39,000 | 39,000 | |
| Premium Reduction ($ million) | (522) | (549) | (566) | (586) | |
| Régime québécois d'assurance parentale | (797) | ||||
| Premium Refunds ($ million) | |||||
| Employee | (170) | (178) | (170) | (164) | |
| Employer (New Hires/Youth Hires) | (19) | ||||
| a. The employers' portion is 1.4 times the employee rate. | |||||
Interest Earned
Section 76 of the EI Act stipulates that the Minister of Finance may authorize the payment of interest on the balance in the Employment Insurance Account in accordance with such terms and conditions and at such rates as the Minister of Finance may establish, and the interest, which is currently set at 90% of the three-month Treasury bill rate, shall be credited to the Employment Insurance Account and charged to the Consolidated Revenue Fund. Interest is calculated monthly, based on the 30-day average of the daily balance in the Account.
Interest is charged on overdue accounts receivable, caused through misrepresentation, in accordance with Treasury Board regulations. The interest rate used in this calculation is the average Bank of Canada discount rate for the previous month plus 3.0%.
| Actual | Forecast | Planned Spending | ||
| (millions of dollars) | 2003-2004 | 2004-2005 | 2005-2006 | 2006-2007 |
| Sources | ||||
| Account Balance | 1,096 | 968 | 1,324 | 1,934 |
| Accounts Receivable | 29 | 27 | 28 | 34 |
| Total | 1,125 | 995 | 1,352 | 1,968 |
Interest earned is expected to reach $2.0 billion due to the increase in the interest rates as well as a higher cumulative surplus.
Administrative Costs
Section 77 of the EI Act specifies that the costs of administering the Act are to be charged to the EI Account.
The Minister of Human Resources and Social Development is responsible for reporting on the EI Program to Parliament. However, the Canada Customs and Revenue Agency (CCRA), which collects premiums and benefits repayments and provides decisions on insurability under the Act, shares the administration of the Program. The Treasury Board Secretariat and the Department of Justice all supply services that support management and delivery of programs under the EI Act.
The administrative costs that provincial and territorial governments incur to administer Employment Benefits and Support Measures under the Labour Market Development Agreements are also charged to the EI Account.
| Actual | Forecast | Planned Spending | ||
| (millions of dollars) | 2003-2004 | 2004-2005 | 2005-2006 | 2006-2007 |
| Federal | ||||
| EI Income Benefits | 540 | 573 | ||
| Policy, Program and Service Delivery | 527 | 458 | ||
| Corporate Services | 272 | 295 | ||
| Employment Programs | 36 | 57 | ||
| Workplace Skills | 44 | 59 | ||
| Learning | 17 | 16 | ||
| Subtotal | 1,436 | 1,458 | 1,553 | 1,532 |
| Provincial | 92 | 92 | 92 | 100 |
| Recovery | (6) | (8) | (7) | (8) |
| Total | 1,521 | 1,542 | 1,638 | 1,624 |
| Note: Totals may not add due to rounding. | ||||
The $1,614 million EI administrative costs are the initial approved resources for 2006-2007, which is slightly less than the final spending authority for 2005 - 2006.
Canada Pension Plan
Description
The Canada Pension Plan (CPP) is a contributory, earnings-related social insurance program. It is a joint federal-provincial plan that operates throughout Canada, except in Quebec, which has its own comparable plan. The CPP provides for a variety of benefits based on life changes. Best known for its retirement pensions, the CPP also provides benefits for surviving partners and children of CPP contributors, people with disabilities and their children, and a one-time maximum benefit of up to $2,500 in the event of the death of a contributor.
As a contributory plan, contributors are employees or self-employed persons generally between the ages of 18 and 70, who earn at least a minimum amount ($3,500) during a calendar year. Benefits are calculated based on how much and for how long a contributor has paid into the CPP. Benefits are not paid automatically-everyone must apply and provide proof of eligibility.
Approximately 12 million Canadians over the age of 18 currently contribute annually to the Plan and approximately 4 million Canadians will receive benefits during 2006-2007.
Benefit Payments
Retirement Pensions: Contributors may begin receiving CPP retirement pensions as early as age 60 or delay receipt until age 70. Applicants who are between 60 and 65 must have stopped working or earn below a specified level when they begin to receive the retirement pension. Once that person starts receiving the CPP pension, he/she can earn any amount without affecting the CPP pension. However, contributions are not made to the CPP on any future earnings. Contributors over age 65 need not have stopped working to qualify.
The amount of each contributor's pension depends on how much and for how long he/she has contributed and at what age he/she begins to draw the benefits. Pensions are adjusted by 0.5 percent for each month before or after age 65 from the time a person begins to receive his/her pension. Contributors who begin receiving a retirement pension at age 60 will receive 70% of the amount that would otherwise be payable at age 65, while those who delay receiving a pension until age 70 will receive 130% of the amount payable at age 65.
Spouses and common-law partners who are at least 60 years of age can share their retirement benefits earned during the period of cohabitation as long as they remain together. This may result in tax savings. If only one spouse is a CPP contributor, the pension can be shared between the two spouses. The overall benefits paid do not increase or decrease with pension sharing.
Disability Benefits: Disability benefits are payable to contributors who meet the minimum contributory requirements and whose disability is "severe and prolonged", as defined in the legislation. Such a disability would prevent them from working regularly at any job in a substantially gainful manner for a prolonged period of time. In order to ensure that benefits are only paid to eligible beneficiaries, periodic reassessments are carried out. Support is also provided to clients who try to return to regular gainful employment. Children of CPP disability beneficiaries are also eligible for a flat rate monthly benefit up to the age of 18, or up to age 25 if attending school full-time. As of February 2006, there were just over 299,000 beneficiaries and 88,000 children receiving monthly benefits.
Survivor's Benefits: A contributor's surviving spouse/common-law partner may be eligible for a monthly benefit if the contributor has contributed for a minimum period and, if at the time of the contributor's death, the spouse/common-law partner was at least 35 years old or was under age 35 and either had dependent children or was disabled. Payments continue in the event that the surviving spouse/common-law partner remarries. Monthly benefits are also payable on behalf of the children of CPP contributors who die. The amount is a flat rate and is payable until the child reaches age 18, or up to age 25 if he or she attends school full-time. A lump-sum benefit is also available to the estate of the deceased contributor provided the minimum contributory requirements have been met.
Determining the Benefit Rate
CPP benefits are largely related to earnings. Benefits are adjusted in January of each year to reflect increases in the average cost of living, as measured by the Consumer Price Index. Benefits such as children's benefits are not based on earnings; they are a fixed amount. Disability and survivor benefits contain a fixed-rate or flat rate portion in addition to an earnings-related portion.
| Actual | Forecast | Planned Spending | ||
| (millions of dollars) | 2003-2004 | 2004-2005 | 2005-2006 | 2006-2007 |
| Retirement pensions | 15,852 | 16,795 | 17,664 | 18,601 |
| Disability benefits | ||||
| Disability pensions | 2,844 | 2,921 | 3,105 | 3,203 |
| Benefits to children of disabled contributors | 257 | 257 | 268 | 273 |
| Disability benefits total | 3,101 | 3,178 | 3,373 | 3,476 |
| Survivor benefits | ||||
| Surviving spouse or common law partner's benefits | 3,187 | 3,327 | 3,459 | 3,565 |
| Orphans' benefits | 213 | 215 | 218 | 223 |
| Death benefits | 254 | 248 | 263 | 267 |
| Survivor benefits total | 3,654 | 3,790 | 3,940 | 4,055 |
| TOTAL | 22,607 | 23,763 | 24,977 | 26,132 |
Administrative Costs
Human Resources and Social Development Canada, Finance Canada, the Canada Revenue Agency, Public Works and Government Services Canada, the Royal Canadian Mounted Police and the Office of the Superintendent of Financial Institutions supply services that support the management and delivery of the CPP and its funds.
Costs incurred by these departments and agencies in administering the Plan are recoverable from the Account based on the costing principles approved by Treasury Board. Essentially, those principles are that costs must be incurred because of CPP responsibilities and must be traceable. Administrative expenses for 2006-2007 are estimated at $397.8 million, representing a decrease of 2.5% from the forecast for 2005-2006.
Benefits delivery staff and processes are extremely efficient in getting benefits into the hands of CPP contributors. In 2006-2007, the total cost for administering and delivering CPP benefits is approximately 1.5% of the total forecasted benefit payments.
| Actual | Forecast | Planned Spending | ||
| (millions of dollars) | 2003-2004 | 2004-2005 | 2005-2006 | 2006-2007 |
| Human Resources Development Canada | ||||
| Plan administration, operations, records, and accommodation | 266.4 | - | ||
| Social Development Canada | ||||
| Plan administration, operations, records, and accommodation | 224.0 | 240.5 | 232.0 | |
| Human Resources and Skills Development Canada | ||||
| In-person services for applicants and beneficiaries | 6.6 | 15.3 | 14.7 | |
| EI Account - Refunding of EI Account in relation to assignment of Social Insurance numbers and maintenance of the central index | 1.7 | 2.7 | 3.3 | 3.0 |
| Treasury Board Secretariat | ||||
| Insurance premiums and recoverable contributions to the Employee Benefit Plan | 40.8 | 39.0 | 30.1 | 27.8 |
| Public Works and Government Services | ||||
| Cheque issue, EDP services | 14.7 | 15.8 | 16.1 | 16.2 |
| Royal Canadian Mounted Police | ||||
| Investigation of contraventions | 0.3 | 0.3 | ||
| Canada Revenue Agency | ||||
| Collection of contributions | 85.3 | 96.5 | 100.8 | 101.7 |
| Office of the Superintendent of Financial Institutions | ||||
| Actuarial services | 1.0 | 1.3 | 1.4 | 1.7 |
| Finance | ||||
| Investment services | 0.4 | 0.4 | 0.4 | 0.4 |
| TOTAL | 410.3 | 386.4 | 408.3 | 397.8 |
Revenues
The CPP is financed through mandatory contributions from employees, employers and self-employed persons, as well as from investment income. Contributions are paid on the portion of a person's earnings that falls between a specified minimum (the Year's Basic Exemption) and maximum (the Year's Maximum Pensionable Earnings) amounts. The minimum remains constant at $3,500, while the maximum amount is linked to the average Canadian industrial wage and is adjusted annually. No contributions are made once a contributor begins to receive a CPP retirement pension, while receiving a disability pension or reaches the age of 70. Disbursements include the payment of CPP benefits and administrative expenditures associated with managing the program.
When it was introduced in 1966, the CPP was designed as a pay-as-you-go plan, with a small reserve. This meant that the benefits for one generation would be paid largely from the contributions of later generations. However, demographic and economic developments and changes to benefits in the 30 years that followed resulted in significantly higher costs. It became clear that to continue to finance the program on a pay-as-you-go basis would have meant imposing a high financial burden on Canadians in the work force during those years. Plan administrators chose instead to change the funding approach of the Plan to a hybrid of pay-as-you-go and full-funding.
In 1998, the federal and provincial governments introduced "steady-state" financing. Under steady-state financing, the contribution rate was increased incrementally, from 5.6% in 1996, to 9.9% in 2003, and remains at that rate. The Office of the Superintendent of Financial Institutions' 21st Actuarial Report on the sustainability of the Canada Pension Plan states that the actual steady-state contribution rate is 9.8% of contributory earnings. This rate represents the lowest rate sufficient to sustain the Plan without further increase and is 0.1% lower than the legislated 9.9% contribution rate. With the 9.9% legislated contribution rate, the assets are expected to increase significantly over the next 17 years, with the ratio of assets to the following year's expenditures growing from 3.1 in 2004 to 5.6 by 2021.28
This approach will generate a level of contributions between 2001 and 2020 that exceeds the benefits paid out every year during that period. Funds not immediately required to pay benefits are transferred to the CPP Investment Board for investment in financial markets. Over time, this will create a large enough reserve to help pay the costs that are expected as more and more baby-boomers retire.
Adoption of this diversified funding approach has made the Canadian retirement income system less vulnerable to changes in economic and demographic conditions and a leading edge example of public pension plan management in the world.
Investment Income: Income is earned on the investments in equities, real estate and money market securities as well as interest earned by bonds.
Financial Accountability
The CPP and its resources are divided among three components:
- The CPP Account was established to record the contributions, interest, pensions and benefits and administrative expenditures of the Plan. In September 2004, the Operating Reserve29 in the CPP Account began to be transferred to the CPP Investment Board and was completed in August 2005. As well, the CPP Investment Board receives weekly forecasts generated by the CPP Accounting personnel and any excess funds not needed to pay for CPP benefits and expenses.
- The CPP Investment Fund was established to record investments in the securities of the provinces, territories and Canada. Following the adoption of Bill C-3 in April 2004, the CPP Investment Fund will gradually be transferred to the CPP Investment Board over a period of 3 years. The transfer of the CPP Investment Fund started May 1, 2004.
- The Canada Pension Plan Investment Board is an arm's length Crown Corporation established by an Act of Parliament in December 1997. It began operations in March 1999 to help the CPP achieve steady-state funding by investing funds not required by the CPP to pay current pensions and earning investment returns on funds transferred from the CPP Account.30 The Board is accountable to the public and governments through regular reports. It is subject to broadly the same investment rules as other pension funds in Canada.
Financial Summary
Benefit payments are expected to reach $26.1 billion in 2006-2007, an increase of $1.2 billion or 4.6% over 2005-2006. This increase reflects forecasts of client population and average benefit payments. In 2006-2007, it is expected that there will be a net increase in client population of 3.0% and a net increase in average benefit payments of 1.7%.
The table below summarizes the financial results for the CPP from 2003-2004 to 2006-2007. In 2002-2003, the Government of Canada changed its basis of accounting from the modified accrual accounting to the full accrual basis of accounting. This change in accounting policy has been applied retroactively and the financial statements have been restated accordingly.
As well, the evaluation of the provincial, territorial and federal bonds was changed from cost to fair value during 2003-2004. The change in accounting policy has been applied retroactively and the financial statements have been restated to reflect this.
The CPP is expected to have an increase of almost $18 billion, bringing the cumulative balance to more than $106 billion by March 31, 2007. At present, the CPP has a fund equal to over 3.5 times the benefits and this is expected to grow to about 5.6 times by 2021.
The following figures summarize trends in total revenues and expenditures of the Account and its status from 2003-2004 to 2006-2007.
| 2003-2004 | 2004-2005 | 2005-2006 | 2006-2007 | |
| Total Expenditures | 23.0 | 24.1 | 25.4 | 26.5 |
| Total Revenues | 38.3 | 35.0 | 43.3 | 31.5 |
| Actual | Forecast | Planned Spending | ||
| (millions of dollars) | 2003-2004 | 2004-2005 | 2005-2006 | 2006-2007 |
| Revenue | ||||
| Contributions | 28,029 | 28,941 | 30,305 | 30,972 |
| Investment Income | ||||
| Canada Pension Plan | 2,682 | 2,070 | 1,093 | 514 |
| CPP Investment Board1 | 7,209 | 4,983 | 12,139 | N/A |
| CPP Investment Fund2 | 357 | (945) | (254) | N/A |
| Total Investment Income | 10,248 | 6,108 | 12,978 | 514 |
| Total Revenue | 38,277 | 35,049 | 43,283 | 31,486 |
| Expenditures | ||||
| Benefit payments | 22,607 | 23,763 | 24,977 | 26,132 |
| Administrative expenses | 410 | 386 | 408 | 398 |
| Total Expenditures | 23,017 | 24,149 | 25,385 | 26,530 |
| Increase | 15,260 | 10,900 | 17,898 | 4,955 |
| Year-end balances | 72,511 | 83,411 | 101,309 | 106,264 |
| 1. Canada Pension Plan Investment Board actual amounts are based on their audited financial statements. The CPP Investment Board invests mainly in equities. The investment income is determined mainly by the change in fair values of these investments. It is difficult to forecast a future fair value therefore the investment income for the year 2006-2007 is not yet available. 2. The Canada Pension Plan Investment Fund is made up of provincial, territorial and government bonds. Since March 31, 2004, these are valued at fair value. The revenue of the Fund is made up of the interest from the bonds as well as the change in fair values of these investments. The interest income from the Investment Fund is presented under "Canada Pension Plan" of this section. It is difficult to forecast a future fair value therefore the investment income for the year 2006-2007 is not yet available. | ||||
Long-term Forecast
The CPP legislation requires a schedule of contribution rates with a review every three years by the federal and provincial finance ministers. The review determines whether any adjustments to the schedule are necessary. If so, the adjustments are implemented through legislation or agreement among finance ministers, or automatically under a formula that ensures that the contribution rate will be sufficient to sustain the Plan in the face of an aging population. Amendments to the rate schedule or the automatic regulation require the approval of at least two thirds of the provinces with at least two thirds of the population of all the provinces.
The following table shows the forecast of revenues and expenditures affecting the CPP for the period between December 31, 2005 and December 31, 2030, based on the Office of the Superintendent of Financial Institutions' Actuarial Report (21st) on the Canada Pension Plan as at December 31, 2003. The Assets/Expenditures Ratio reflects the size of the year-end assets relative to the expenditures.
| Year | Contribution Rate | Contributions | Investment Earnings | Expenditures | Assets at Dec. 31 | Assets/ Expenditure ratio |
| % | $ millions | |||||
| 2010 | 9.90 | 36,128 | 8,982 | 31,868 | 146,795 | 4.37 |
| 2015 | 9.90 | 45,579 | 14,635 | 42,022 | 226,815 | 5.09 |
| 2020 | 9.90 | 57,537 | 21,497 | 56,253 | 332,116 | 5.57 |
| 2025 | 9.90 | 71,145 | 29,177 | 74,887 | 454,613 | 5.75 |
| 2030 | 9.90 | 88,011 | 37,958 | 97,015 | 591,404 | 5.81 |
| Source: 21st Actuarial Report from the Office of the Superintendent of Financial Institutions Canada | ||||||
This account was established by the Government Annuities Act, and modified by the Government Annuities Improvement Act, which discontinued sales of annuities in 1975. The account is valued on an actuarial basis each year, with the deficit charged or surplus credited to the Consolidated Revenue Fund.
The purpose of the Government Annuities Act was to assist Canadians to provide for their later years, by the purchase of Government annuities. The Government Annuities Improvement Act increased the rate of return and flexibility of Government annuity contracts.
Income consists of premiums received, funds reclaimed from the Consolidated Revenue Fund for previously untraceable annuitants, earned interest and any transfer needed to cover the actuarial deficit. Payments and other charges represent matured annuities, the commuted value of death benefits, premium refunds and withdrawals, and actuarial surpluses and unclaimed items transferred to non-tax revenues. The amounts of unclaimed annuities, related to untraceable annuitants, are transferred to non-tax revenues.
As of March 31, 2006, there were 2,400 outstanding deferred annuities, the last of which will come into payment around 2030.
| Actual | Planned Spending | |||
| (millions of dollars) | 2003-2004 | 2004-2005 | 2005-2006 | 2006-2007 |
| Expenditures | ||||
| Actuarial Liabilities - Balance at beginning of year | 437.6 | 405.8 | 377.2 | 347.2 |
| Income | 28.5 | 26.3 | 24.5 | 24.3 |
| Payments and other charges | 57.8 | 54.6 | 51.0 | 47.9 |
| Excess of Payments and other charges over income for the year | 29.3 | 28.3 | 26.5 | 23.6 |
| Actuarial Surplus | 2.5 | 0.3 | 3.5 | 1.6 |
| Actuarial Liabilities - Balance at year-end | 405.8 | 377.2 | 347.2 | 321.9 |
This account was established by the Civil Service Insurance Act, under which the Minister of Finance could contract with permanent employees in the public service for the payment of certain death benefits. No new contracts have been entered into since 1954 when the Supplementary Death Benefit Plan for the Public Service and Canadian Forces was introduced as part of the Public Service Superannuation Act and the Canadian Forces Superannuation Act, respectively. As of April 1997, the Department of Human Resources Development assumed the responsibility for the administration and the actuarial valuation of the Civil Service Insurance Act.
The number of policies in force as of March 31, 2006 was 1,424 and the average age of the policy holders was 87.0 years. Receipts and other credits consist of premiums and an amount (charged to expenditures) which is transferred from the Consolidated Revenue Fund in order to balance the assets and actuarial liabilities of the program. Payments and other charges consist of death benefits, settlement annuities paid to beneficiaries and premium refunds.
Pursuant to subsection 16(3) of the Civil Service Insurance Regulations, any deficit will be credited to the Account from the Consolidated Revenue Fund.
| Actual | Planned Spending | |||
| (millions of dollars) | 2003-2004 | 2004-2005 | 2005-2006 | 2006-2007 |
| Revenue | ||||
| Opening Balance | 7.5 | 7.1 | 6.6 | 6.3 |
| Receipts and other credits | 0.2 | 0.0 | 0.1 | 0.1 |
| Payments and other charges | 0.6 | 0.5 | 0.4 | 0.4 |
| Excess of payments and other charges over income for the year | 0.4 | 0.5 | 0.3 | 0.3 |
| Closing Balance | 7.1 | 6.6 | 6.3 | 6.0 |
Employment Insurance Part II - 2006-2007 Expenditure Plan
Background
Part II of the Employment Insurance Act (EI Act) commits the federal government to work in concert with provinces and territories in designing and implementing active employment programs that would be more effective in helping unemployed Canadians integrate into the labour market. These programs are called Employment Benefits and Support Measures (EBSM).
In accordance with the Government of Canada's 1996 offer to provinces and territories to enter into bilateral partnerships on labour market activities, Labour Market Development Agreements (LMDAs) have been concluded with all provinces and territories. Most recently, in November of 2005, the Government of Canada entered into a LMDA with the Government of Ontario; it will come into effect on January 1st, 2007.
The LMDAs involve two types of arrangements:
- Co-management agreements where Human Resources and Skills Development Canada (HRSDC), formerly Human Resources Development Canada, and the province or territory jointly assume responsibility for the planning and design of EBSM, while HRSDC, through Service Canada continues to deliver programs and services through its service delivery network. Such agreements have been concluded with Newfoundland and Labrador, Prince Edward Island, British Columbia and the Yukon. There is also a strategic partnership agreement that is a variation of co-management in Nova Scotia.
- Transfer agreements where the province or territory assumes responsibility for the design and delivery of active employment programs similar to EBSM. Such agreements have been concluded with New Brunswick, Quebec, Manitoba, Saskatchewan, Alberta, the Northwest Territories and Nunavut.
- HRSDC, through Service Canada, delivers EBSM in Ontario until the Canada-Ontario transfer LMDA comes into effect, on January 1st, 2007.
In addition to locally and regionally delivered EBSM and similar programs, pan-Canadian activities that are national or multi-regional in scope or purpose are delivered by HRSDC. Pan-Canadian activities also include programming similar to EBSM delivered by Aboriginal organizations under Aboriginal Human Resources Development Agreements.
Employment Benefits and Support Measures
The five employment benefits are:
- Targeted Wage Subsidies to encourage employers to hire individuals who they would not normally hire in the absence of a subsidy.
- Self-Employment to help individuals to create jobs for themselves by starting a business.
- Job Creation Partnerships to provide individuals with opportunities through which they can gain work experience which leads to on-going employment.
- Skills Development to help individuals to obtain skills for employment, ranging from basic to advanced skills through direct assistance to individuals, and, where applicable, contributions to provinces/territories or provincially/territorially funded training institutions to cover costs not included in tuition fees.
- Targeted Earnings Supplements to encourage individuals to accept employment by offering them financial incentives.
It should be noted that of the employment benefits listed above, Targeted Earnings Supplements has not yet been implemented.
Eligibility to receive assistance under the employment benefits extends to persons who are insured participants as defined in Section 58 of the EI Act i.e., active claimants and former claimants (individuals who have had an EI claim that ended in the past three years or those who received maternity or parental benefits in the past five years, after which they left the labour market to care for their children).
Part II of the legislation also authorizes the establishment of support measures in support of the National Employment Service. The three measures are:
- Employment Assistance Services to assist organizations in the provision of employment services to unemployed persons.
- Labour Market Partnerships to encourage and support employers, employee and/or employer associations and communities to improve their capacity for dealing with human resource requirements and implementing labour force adjustments.
- Research and Innovation to support activities which identify better ways of helping persons prepare for or keep employment and be productive participants in the labour force.
Financial Data
| (millions of dollars) | Base | Re-Investment | Total Plan |
| Newfoundland and Labrador | 58.8 | 73.1 | 131.9 |
| Nova Scotia | 50.7 | 30.3 | 81.0 |
| New Brunswick | 50.2 | 42.1 | 92.3 |
| Prince Edward Island | 16.4 | 10.0 | 26.5 |
| Quebec | 347.7 | 248.1 | 595.8 |
| Ontario | 342.6 | 184.1 | 526.7 |
| Manitoba | 36.8 | 10.2 | 47.0 |
| Saskatchewan | 29.1 | 9.9 | 39.0 |
| Alberta | 72.9 | 35.9 | 108.9 |
| Northwest Territories | 1.9 | 1.6 | 3.4 |
| Nunavut | 1.8 | 1.0 | 2.8 |
| British Columbia | 139.1 | 151.7 | 290.9 |
| Yukon | 1.9 | 2.0 | 3.9 |
| 1,150.0 | 800.0 | 1,950.0 | |
| Pan-Canadian Responsibilitiesa | 187.9 | 0.0 | 187.9 |
| Funds available for Employment Benefits and Support Measures | 1,337.9 | 800.0 | 2,137.9 |
| a. Funds earmarked for Pan-Canadian priorities, such as Aboriginal programming, sectoral and innovations projects.
The amount is net of $12.8 million funds permanently converted to operating costs and of resources identified in the Plan as part of Government Wide Reallocation exercise.
Note: Totals may not add due to rounding. | |||
For 2006-2007, the EI Part II expenditure authority of $2,165.6 million represents 0.54% of total estimated insurable earnings of $401.239 billion. This represents a lower level of expenditures than the 0.8% ceiling imposed under the Act, which is estimated at $3.21 billion in 2006-2007.
Some of the savings from Part I income benefits generated by the EI reform are included in these funds to provide job opportunities and help Canadians get back to work more quickly. The amount of re-investment reached maturity at $800 million in 2000-2001.
Expected Results
An accountability framework has been developed that respects the legal responsibility of the Minister of Human Resources and Skills Development for the EI Account. Key indicators will measure both the short and long term outcomes of EBSM.
It is expected that 425,000 active and former claimants will be assisted in 2006-2007. These estimates may change, depending on labour market conditions and agreements achieved with provinces and territories.
| Clients Employed/Self-Employed | Unpaid Benefits | Active Claimants Served | |
| Targeted Results 2004-20052 | 231,234 | $863.0M | 442 549 |
| Actual Results 2004-05 | 214,220 | $855.2M3 | 425,0334 |
| Targeted Results 2005-065 | 223,831 | $863.6M | 407,472 |
| Expected Results 2006-07 | 217,0006 | $850.0M | 425,0007 |
| 1. Exclusive of Employment Information Services. This table includes Aboriginal pan-Canadian EBSM numbers which were not reported in this annex of the EI Expenditure Plan (Part II) for 2005-2006. 2. The targeted results for Clients Employed and Unpaid Benefits for 2004-2005 and 2005-2006 are the totals as submitted by the regions, provinces and territories. "Clients served" includes Active EI claimants from all regions/provinces/territories, plus Former EI claimants from Quebec. The Quebec agreement requires that the province report on Active and Former EI claimants, as "Clients served." 3. Represents one count of unpaid benefits per client, to avoid the double counting of unpaid benefits of clients who participated in both Regular and Aboriginal pan-Canadian EBSM. 4. The Regular EBSM clients served (409,960) includes Active EI claimants from all regions, plus Former claimants from Quebec. The Quebec agreement requires that the province report on Active and Former EI claimants, as "Clients served." It also includes 15,073 Aboriginal pan-Canadian EBSM clients served. 5. Targeted Results 2005-06 are higher than the Anticipated Results 2005-2006 reported in this annex of the EI Expenditure Plan (Part II) for 2005-2006 because of the robust labour market performance during the reporting period and the use of a conservative approach to target setting by some provinces. 6. Includes Regular EBSM (210,000) and the Aboriginal pan-Canadian EBSM (7,000). 7. Includes Regular EBSM (410,000) and the Aboriginal pan-Canadian EBSM (15,000). | |||
Part II of the EI Act which provides for the delivery of EBSMs stipulates that these programs and services be implemented within a framework for evaluating their success. The LMDAs require that the evaluations be designed to occur in phases: formative to occur in the program implementation phase, while summative evaluations occur some time later, once programs are up and running and post-program periods are long enough to determine impacts and effects.
Thirteen formative evaluations have been completed, and summative evaluations are completed or are in final stages of completion in six jurisdictions: British Columbia, Alberta, Nunavut, Quebec, Ontario and Newfoundland & Labrador. In Saskatchewan and New Brunswick, evaluations are advancing, and results are expected in 2006-2007. For Yukon, PEI and Nova Scotia, the evaluations have started but are in early stages, while for Manitoba and NWT; summative evaluations are at the planning stages.
General findings of these studies have been published in the 2005 Employment Insurance Monitoring and Assessment Report.
Consolidated Report on Canada Student Loans
In August 2000, the Canada Student Loans Program (CSLP) was shifted from the risk-shared financing arrangements that had been in place with financial institutions between 1995 and July 2000 to a direct student loan financing plan.31
This meant that the Program had to redesign the delivery mechanism in order to directly finance student loans. In the new arrangement, the Government of Canada provides the necessary funding to students and two service providers have contracts to administer the loans.
Reporting Entity
The entity detailed in this report is the Canada Student Loans Program only and does not include departmental operations related to the delivery of the CSLP. Expenditures figures are primarily statutory in nature, made under the authority of the Canada Student Loans Act and the Canada Student Financial Assistance Act.
Basis of Accounting
The financial figures are prepared in accordance with generally accepted accounting principles and as reflected in the Public Sector Accounting Handbook of the Canadian Institute of Chartered Accountants.
Specific Accounting Policies
Revenues
Two sources of revenue are reported: interest revenue on Direct Loans and recoveries on Guaranteed and Put Back Loans. Government accounting practices require that recoveries from both sources be credited to the government's Consolidated Revenue Fund. They do not appear along with the expenditures in the CSLP accounts, but are reported separately in the financial statements of Human Resources and Social Development Canada (HRSDC) and the government.
- Interest Revenue on Direct Loans - Borrowers are required to pay simple interest on their student loans once they leave full-time studies. At the time they leave school, students have the option of selecting a variable (prime + 2.5%) or fixed (prime + 5%) interest rate. The figures represent the interest accrued on the outstanding balance of the government-owned Direct Loans. Borrowers continue to pay the interest accruing on the guaranteed and risk-shared loans directly to the private lender holding these loans. Effective August 1, 2005, the weekly loan limit increased from $165 per week to $210 per week of study. As more funds will be available to students, total loan disbursements will likely grow, and as a result the interest revenue generated will likely increase.
- Recoveries on Guaranteed Loans - The government reimburses the private lenders for any loans issued prior to August 1, 1995 that go into default (i.e., lenders claim any amount of principal and interest not repaid in full). The figures represent the recovery of principal and interest on these defaulted loans.
- Recoveries on Put-back Loans - Under the risk-shared agreements, the government will purchase from the participating financial institutions any loans issued between August 1, 1995 to July 31, 2000 that are in default of payments for at least 12 months after the period of study, that in aggregate, do not exceed 3% of the average monthly balance of the lender's outstanding student loans in repayments. The amount paid is set at 5% of the value of the loans in question. The figures represent the recovery of principal and interest on these loans.
Canada Study Grants and Canada Access Grants
Canada Study Grants and Canada Access Grants improve access to post-secondary education by providing non-repayable financial assistance to post-secondary students. Four types of Canada Study Grants are available to assist: (1) students with permanent disabilities in order to meet disability-related educational expenses (up to $8,000 annually); (2) students with dependants (up to $3,120 for full-time students and up to $1,920 for part-time students, annually); (3) high-need part-time students (up to $1,200 annually); and (4) women in certain fields of Ph.D. studies (up to $3,000 annually for up to three years). Two Canada Access Grants are available since August 1, 2005, to assist: (1) students from low-income families entering their first year of post-secondary studies (50% of tuition, up to $3,000); and (2) students with permanent disabilities in order to assist with education and living expenses (up to $2,000 annually)32 .
Collection Costs
These amounts represent the cost of using private collection agencies to collect defaulted Canada Student Loans. The loans being collected include: risk-shared and guaranteed loans that have gone into default and for which the government has bought back from the private lender; and Direct Loans issued after July 31, 2000, that are returned to HRSDC by the third party service provider as having defaulted. As of August 1, 2005 the Canada Revenue Agency (CRA) Non Tax Collections Directorate undertook the responsibility for the administration of the collection activities of the guaranteed, risk-shared and direct student loans.
Service Provider Costs
CSLP uses third party service providers to administer loan origination, in-study loan management, post-studies repayment activities and debt management. This item represents the cost associated with these contracted services.
Risk Premium
Risk premium represents part of the remuneration offered to lending institutions participating in the risk-shared program from August 1, 1995 to July 31, 2000. The risk premium represents 5% of the value of loans being consolidated which is calculated and paid at the time students leave studies and go into repayment. In return, the lenders assume the risk associated with non-repayment of these loans.
Put-Back
Subject to the provisions of the contracts with lending institutions, the government will purchase from a lender the student loans that are in default of payment for at least 12 months and that, in aggregate, do not exceed 3% of the average monthly balance of the lender's outstanding student loans in repayments. The amount paid is set at 5% of the value of the loans in question. The figures also include any refund made to participating financial institutions on the recoveries.
Administrative Fees to Provinces and Territories
Pursuant to the Canada Student Financial Assistance Act (CSFA Act), the government has entered into arrangements with nine provinces and one territory to facilitate the administration of the CSLP. They administer the application and needs assessment activities associated with federal student financial assistance and in return they are paid an administrative fee. As of August 1, 2005 administrative fees paid to provinces were increased to improve the compensation for their part in the administration of the CSLP.
In-Study Interest Borrowing Expense
The capital needed to issue the Direct Loans is raised through the Department of Finance's general financing activities. The cost of borrowing this capital is recorded in the Department of Finance's overall financing operations. The figures represent the cost attributed to CSLP in support of Direct Loans while students are considered in study status. Weekly loan limits increased effective August 1, 2005. As more funds will be available to students, total loan disbursements are likely to grow, and as a result the in-study interest borrowing expense will rise.
In Repayment Interest Borrowing Expense
The capital needed to issue the Direct Loans is raised through the Department of Finance's general financing activities. The cost of borrowing this capital is recorded in the Department of Finance's overall financing operations. The figures represent the cost attributed to CSLP in support of Direct Loans while students are in repayment of their Canada Student Loans.
In-Study Interest Subsidy
A central feature of federal student assistance is that student borrowers are not required to pay the interest on their student loans as long as they are in full-time study and, in the case of loans negotiated prior to August 1, 1993, for six months after the completion of studies. Under the guaranteed and risk-shared programs, the government pays the interest to the lending institutions on behalf of the student.
Interest Relief
Assistance may be provided to cover loan interest and suspend payments on the principal of loans in repayment for up to 54 months for borrowers experiencing temporary difficulties repaying their loans. The shift from Guaranteed and Risk-Shared Loans to Direct Loans did not alter interest relief for loans in distress from the borrower's perspective; however, the method of recording associated costs changed. For loans issued prior to August 1, 2000, CSLP compensates lending institutions for lost interest equal to the accrued interest amount on loans under Interest Relief (IR). For loans issued after August 1, 2000, an interest relief expense is recorded to offset the accrued interest on direct loans. Effective August 1, 2005 income thresholds used to determine IR eligibility increased in order to make IR accessible to a greater number of borrowers.
Debt Reduction in Repayment
Debt Reduction in Repayment (DRR) assists borrowers experiencing long-term difficulties repaying their loans. DRR is a federal repayment assistance program through which the Government of Canada reduces a qualifying borrower's outstanding Canada Student Loans principal to an affordable amount after Interest Relief has been exhausted and only after 5 years have passed since the borrower ceased to be a student. As of August 1, 2005, the maximum amount of DRR assistance is $26,000, which is available to eligible borrowers in an initial deduction of up to $10,000, a second deduction of up to $10,000 and a final deduction of up to $6,000. For loans issued prior to August 1, 2000, CSLP pays the lending institutions the amount of student debt principal reduced by the Government of Canada under DRR. For loans issued after August 1, 2000, the Government of Canada forgives a portion of the loan principal.
Claims Paid and Loans Forgiven
From the beginning of the program in 1964 until July 31, 1995, the government fully guaranteed all loans issued to students by private lenders. The government reimburses private lenders for any of these loans that go into default (i.e., subject to specific criteria, lenders may claim any amount of principal and interest not repaid in full, after which the Canada Revenue Agency's (CRA) Collection Services will attempt to recover these amounts).33 The risk-shared arrangements also permitted loans issued from August 1, 1995 to July 31, 2000 to be guaranteed under specific circumstances. This item represents the costs associated with loan guarantees.
Pursuant to the Canada Student Loans Act and the Canada Student Financial Assistance Act, the government incurs the full amount of the unpaid principal plus accrued interest in the event of the death of the borrower or, if the borrower becomes permanently disabled and cannot repay the loan without undue hardship.
Bad Debt Expense
Under Direct Loans, the government owns the loans issued to students and must record them as assets. As a result, generally accepted accounting principles require a provision be made for potential future losses associated with these loans. The provision must be made in the year the loans are issued even though the losses may occur many years later. The figures represent the annual expense against the provisions for Bad Debt and Debt Reduction in Repayment on Direct Loans.
Alternative Payments to Non-participating Provinces and Territories
Provinces and territories may choose not to participate in the CSLP. These provinces and territories receive an alternative payment to assist in the cost of delivering a similar student financial assistance program
Commitments
For the 2006-2007 fiscal year, the expected cash flow for Service Provider contracts is: $94.8million. The current end date for the Service Provider contracts is July 31, 2007.
Consolidated Canada Student Loans Programs - Financial Tables
| (millions of dollars) | Actual | Actual | Planned Spending e | |||
| 2003-2004 | 2004-2005 | 2005-2006 | 2006-2007 | 2007-2008 | 2008-2009 | |
| Revenue | ||||||
| Interest Revenue on Direct Loans | 174.3 | 226.6 | 315.7 | 419.8 | 507.0 | 584.2 |
| Recoveries On Guaranteed Loans | 91.3 | 76.2 | 66.8 | 66.6 | 61.9 | 55.1 |
| Recoveries On Put-Back Loans | 9.6 | 11.0 | 13.1 | 17.1 | 20.7 | 24.5 |
| Total Revenue | 275.2 | 313.8 | 395.6 | 503.5 | 589.6 | 663.8 |
| Expenses | ||||||
| Transfer Payments | ||||||
| Canada Study Grants and Canada Access Grants | 66.8 | 64.5 | 129.7 | 119.9 | 123.1 | 127.2 |
| Loan Administration | ||||||
| Collection Costs a | 13.4 | 14.8 | 13.6 | 18.5 | 21.0 | 23.3 |
| Service Bureau Costs | 41.0 | 46.0 | 50.2 | 66.3 | 73.2 | 80.4 |
| Risk Premium | 11.7 | 5.5 | 2.7 | 4.8 | 2.6 | 1.3 |
| Put-Back | 4.3 | 4.2 | 4.3 | 4.4 | 4.3 | 4.4 |
| Administrative Fees to Provinces and Territories | 8.8 | 9.4 | 13.9 | 14.6 | 14.5 | 14.6 |
| Total Loan Administration Expenses | 79.2 | 79.9 | 84.7 | 108.6 | 115.6 | 124.0 |
| Cost of Government Support | ||||||
| Benefits Provided to Students | ||||||
| In-Study Interest Borrowing Expense (Class A) b | 148.6 | 163.8 | 159.3 | 166.5 | 172.9 | 181.7 |
| In Repayment Interest Borrowing Expense (Class B) b | 68.1 | 96.6 | 111.4 | 161.4 | 196.8 | 236.5 |
| In-Study Interest Subsidy (Class A) | 27.4 | 16.1 | 12.1 | 6.6 | 3.5 | 1.7 |
| Interest Relief | 73.8 | 63.2 | 67.2 | 70.7 | 72.6 | 74.8 |
| Debt Reduction in Repayment | 10.7 | 27.1 | 31.4 | 15.2 | 9.9 | 5.7 |
| Claims Paid & Loans Forgiven | 34.8 | 27.7 | 24.8 | 16.5 | 13.7 | 12.1 |
| Bad Debt Expense c | ||||||
| Debt Reduction in Repayment Expense | 11.5 | 11.5 | 13.3 | 13.3 | 13.4 | 13.7 |
| Bad Debt Expense | 193.3 | 456.2 | 297.2 | 322.5 | 343.2 | 368.7 |
| Total Cost of Government Support Expenses | 568.2 | 862.2 | 716.7 | 772.7 | 826.0 | 894.9 |
| Total Expenses | 714.2 | 1,006.6 | 931.1 | 1,001.2 | 1,064.7 | 1,146.1 |
| Net Operating Results | 439.0 | 692.8 | 535.5 | 497.7 | 475.1 | 482.3 |
| Alternative Payments to Non-Participating Province and Territorie | 244.8 | 175.8 | 158.2 | 151.0 | 144.7 | 142.8 |
| Final Operating Results | 683.8 | 868.6 | 693.7 | 648.7 | 619.8 | 625.1 |
| a. These costs are related to Canada Student Direct Loans but reported by the Department of Social Development Canada. b. These costs are related to Canada Student Direct Loans but reported by the Department of Finance. c. This represents the annual expense against the Provisions for Bad Debt and Debt Reduction in Repayment as required under Accrual Accounting. The Bad Debt Expense figure for 2004-2005 includes an adjustment of $257.1 million following the revised Bad Debt Provision Rate published by the Office of the Chief Actuary in the Actuarial Report on the Canada Student Loans Program as at July 31, 2004. This adjustment is retroactive to the beginning of the Direct Loans Regime (2000). d. Starting in 2003-2004, the figures represent the annual expense recorded under the Accrual Accounting as opposed to the actual amount disbursed to the Non-Participating Province and Territories. The actual cash expense for Alternative Payments to Non-Participating Provinces and Territories for 2005-2006 was $ 161.3 M. e. 2006-2007 and ongoing planned speding years exclude CSLP related amounts stemming from the Budget 2006 announcement. | ||||||
| (millions of dollars) | Actual | Actual | Planned Spending e | |||
| 2003-2004 | 2004-2005 | 2005-2006 | 2006-2007 | 2007-2008 | 2008-2009 | |
| Revenue | ||||||
| Interest Revenue on Direct Loans | 174.3 | 226.6 | 315.7 | 419.8 | 507.0 | 584.2 |
| Expenses | ||||||
| Transfer Payments | ||||||
| Canada Study Grants and Canada Access Grants | 66.8 | 64.5 | 129.7 | 119.9 | 123.1 | 127.2 |
| Loan Administration | ||||||
| Collection Costs a | 4.1 | 7.0 | 6.9 | 11.3 | 13.7 | 16.2 |
| Service Bureau Costs | 41.0 | 46.0 | 50.2 | 66.3 | 73.2 | 80.4 |
| Administrative Fees to Provinces and Territories | 8.8 | 9.4 | 13.9 | 14.6 | 14.5 | 14.6 |
| Total Loan Administration Expenses | 53.9 | 62.4 | 71.0 | 92.2 | 101.4 | 111.2 |
| Cost of Government Support | ||||||
| Benefits Provided to Students | ||||||
| In-Study Interest Borrowing Expense (Class A) b | 148.6 | 163.8 | 159.3 | 166.5 | 172.9 | 181.7 |
| In Repayment Interest Borrowing Expense (Class B) b | 68.1 | 96.6 | 111.4 | 161.4 | 196.8 | 236.5 |
| Interest Relief | 20.0 | 28.4 | 43.9 | 56.7 | 63.2 | 69.1 |
| Loans Forgiven | 1.5 | 2.0 | 9.1 | 5.5 | 6.3 | 7.1 |
| Bad Debt Expensec | ||||||
| Debt Reduction in Repayment Expense | 11.5 | 11.5 | 13.3 | 13.3 | 13.4 | 13.7 |
| Bad Debt Expense | 193.3 | 456.2 | 297.2 | 322.5 | 343.2 | 368.7 |
| Total Cost of Government Support Expenses | 443.0 | 758.5 | 634.2 | 725.9 | 795.8 | 876.8 |
| Total Expenses | 563.7 | 885.4 | 834.9 | 938.0 | 1,020.3 | 1,115.2 |
| Net Operating Results | 389.4 | 658.8 | 519.2 | 518.2 | 513.3 | 531.0 |
| Alternative Payments to Non-Participating Province and Territorie | 244.8 | 175.8 | 158.2 | 151.0 | 144.7 | 142.8 |
| Final Operating Results | 634.2 | 834.6 | 677.4 | 669.2 | 658.0 | 673.8 |
| a. These costs are related to Canada Student Direct Loans but reported by the Department of Social Development Canada. b. These costs are related to Canada Student Direct Loans but reported by the Department of Finance. c. This represents the annual expense against the Provisions for Bad Debt and Debt Reduction in Repayment as required under Accrual Accounting. The Bad Debt Expense figure for 2004-2005 includes an adjustment of $257.1 million following the revised Bad Debt Provision Rate published by the Office of the Chief Actuary in the Actuarial Report on the Canada Student Loans Program as at July 31, 2004. This adjustment is retroactive to the beginning of the Direct Loans Regime (2000). d. Starting in 2003-2004, the figures represent the annual expense recorded under the Accrual Accounting as opposed to the actual amount disbursed to the Non-Participating Province and Territories. The actual cash expense for Alternative Payments to Non-Participating Provinces and Territories for 2005-2006 was $ 161.3M. e. 2006-2007 and ongoing planned speding years exclude CSLP related amounts stemming from the Budget 2006 announcement. | ||||||
| (millions of dollars) | Actual | Actual | Planned Spending b | |||
| 2003-2004 | 2004-2005 | 2005-2006 | 2006-2007 | 2007-2008 | 2008-2009 | |
| Revenue | ||||||
| Recoveries On Guaranteed Loans | 91.3 | 76.2 | 66.8 | 66.6 | 61.9 | 55.1 |
| Recoveries On Put-Back Loans | 9.6 | 11.0 | 13.1 | 17.1 | 20.7 | 24.5 |
| Total Revenue | 100.9 | 87.2 | 79.9 | 83.7 | 82.6 | 79.6 |
| Expenses | ||||||
| Loan Administration | ||||||
| Collection Costs a | 9.3 | 7.8 | 6.7 | 7.2 | 7.3 | 7.1 |
| Risk Premium | 11.7 | 5.5 | 2.7 | 4.8 | 2.6 | 1.3 |
| Put-Back | 4.3 | 4.2 | 4.3 | 4.4 | 4.3 | 4.4 |
| Total Loan Administration Expenses | 25.3 | 17.5 | 13.7 | 16.4 | 14.2 | 12.8 |
| Cost of Government Support | ||||||
| Benefits Provided to Students | ||||||
| In-Study Interest Subsidy (Class A) | 27.4 | 16.1 | 12.1 | 6.6 | 3.5 | 1.7 |
| Interest Relief | 53.8 | 34.8 | 23.3 | 14.0 | 9.4 | 5.7 |
| Debt Reduction in Repayment | 10.7 | 27.1 | 31.4 | 15.2 | 9.9 | 5.7 |
| Claims Paid & Loans Forgiven | 33.3 | 25.7 | 15.7 | 11.0 | 7.4 | 5.0 |
| Total Cost of Government Support Expenses | 125.2 | 103.7 | 82.5 | 46.8 | 30.2 | 18.1 |
| Total Expenses | 150.5 | 121.2 | 96.2 | 63.2 | 44.4 | 30.9 |
| Net Operating Results | 49.6 | 34.0 | 16.3 | (20.5) | (38.2) | (48.7) |
| a. These costs are related to Canada Student Direct Loans but reported by the Department of Social Development Canada. b. 2006-2007 and ongoing planned speding years exclude CSLP related amounts stemming from the Budget 2006 announcement. | ||||||
Other Items of Interest
| SDC Main Estimates | Social Investment | Service Delivery | Social Development Policy and Innovation | |||||
| HRSDC Main Estimates | Employment Insurance | Workplace Skills | Learning | Labour | Homelessness | Service Delivery | Policy and Program Support | |
| Employment Programs | ||||||||
| Program Activity Presentation for Report on Plans and Priorities | Labour Market: | Workplace Skills | Learning | Labour | Social Investment | Housing and Homelessness | Seamless, Citizen-Centred Service | Policy, Research and Communications |
| Employment Insurance | Children and Families | Integrity | ||||||
| Employment Programs | Collaborative, Networked Government Services |
Website References
HRSDC Website http://www.hrsdc.gc.ca/en/home.shtml
The Honourable Diane Finley P.C., M.P.
Minister of Human Resources and Social Development Canada http://pm.gc.ca/eng/bio.asp?id=64]
The Honourable Jean-Pierre Blackburn Minister of Labour and Housing http://www.pm.gc.ca/eng/bio.asp?id=50
Acts and Regulations Governing HRSDC and SDC http://www.hrsdc.gc.ca/en/cs/fas/as/contact/acts.shtml
HRSDC Overview
- List of HRSDC Programs and Services http://www.hrsdc.gc.ca/en/gateways/nav/top_nav/ps.shtml
- Speech from the Throne, October 5, 2004 http://pm.gc.ca/eng/sft-ddt.asp
Enhanced Canadian productivity and participation through efficient and inclusive labour markets, competitive workplaces and access to learning
Labour Market
- Employment Insurance Benefits http://www.hrsdc.gc.ca/en/gateways/nav/top_nav/program/ei.shtml
- Employment Benefits and Support Measures http://www.hrsdc.gc.ca/en/gateways/nav/top_nav/program/gc.shtml
- Labour Market Development Agreements http://www.tbs-sct.gc.ca/rma/eppi-ibdrp/hrdb-rhbd/lmda-edmt/description-eng.asp
- Aboriginal Human Resources Development Strategy http://www17.hrdc-drhc.gc.ca/AHRDSInternet/general/public/HomePage1-eng.asp http://www17.hrdc-drhc.gc.ca/AHRDSInternet/general/public/HomePage1-fra.asp
- Aboriginal Skills and Employment Partnerships
- http://www17.hrdc-drhc.gc.ca/AHRDSInternet/general/public/asep/asep-eng.asp
- http://www17.hrdc-drhc.gc.ca/AHRDSInternet/general/public/asep/asep-fra.asp
- Youth Employment Strategy http://www.youth.gc.ca/
- Official Language Minority Communities http://www.hrsdc.gc.ca/en/gateways/nav/top_nav/program/solmc.shtml
- Work Sharing http://www.hrsdc.gc.ca/en/epb/sid/cia/grants/ws/desc_ws.shtml
Workplace Skills
- Human Resources Partnerships
- The Sector Council Program http://www.hrsdc.gc.ca/en/gateways/nav/top_nav/program/spi.shtml
- Essential Skills http://www.hrsdc.gc.ca/en/hip/hrp/essential_skills/essential_skills_index.shtml
- National Occupational Classification http://www.hrsdc.gc.ca/en/hip/hrp/noc/noc_index.shtml
- Apprenticeship and Labour Mobility Initiatives http://www.hrsdc.gc.ca/en/gateways/nav/top_nav/program/almi.shtml
- The Foreign Worker Program http://www.hrsdc.gc.ca/en/gateways/nav/top_nav/program/fw.shtml
- Labour Market Information http://www.hrsdc.gc.ca/en/gateways/nav/top_nav/program/lmi.shtml
Learning
- Student Financial Assistance (Canada Student Loans Program) http://www.hrsdc.gc.ca/en/gateways/topics/cxp-gxr.shtml and http://www.canlearn.ca/
- Canada Education Savings Grant http://www.hrsdc.gc.ca/en/gateways/topics/cgs-gxr.shtml
- Adult Learning, Literacy and Essential Skills Program http://www.hrsdc.gc.ca/en/gateways/topics/lxa-gxr.shtml http://www.hrsdc.gc.ca/en/gateways/topics/lxi-gxr.shtml
- International Academic Mobility http://www.hrsdc.gc.ca/en/gateways/nav/top_nav/program/iam.shtml
Safe, healthy, fair, stable, cooperative and productive workplaces and effective international labour standards
- The Federal Mediation and Conciliation Service http://www.hrsdc.gc.ca/asp/gateway.asp?hr=/en/lp/fmcs/02About.shtml&hs=mxm
- National Labour Operations http://www.hrsdc.gc.ca/en/gateways/nav/top_nav/program/labour.shtml
- International Labour Affairs http://www.hrsdc.gc.ca/en/lps/ila/index.shtml
- Work-life Balance and Ageing Workforce http://www.hrsdc.gc.ca/en/gateways/topics/wnc-gxr.shtml
Enhanced income security, access to opportunities and well-being for individuals, families and communities
Social Investment
- Income Security Programs http://www.sdc.gc.ca/en/gateways/nav/top_nav/program/isp.shtml
- Seniors http://www.sdc.gc.ca/en/gateways/individuals/audiences/seniors.shtml
- Office for Disability issues http://www.sdc.gc.ca/en/hip/odi/01_about.shtml
- Persons with Disabilities http://www.sdc.gc.ca/en/gateways/individuals/audiences/pd.shtml
- Social Economy http://www.sdc.gc.ca/en/cs/comm/sd/social_economy.shtml
- Voluntary sector http://www.sdc.gc.ca/en/hip/sd/06_vsi.shtml
- Social development partnerships Program http://www.sdc.gc.ca/en/hip/sd/05_SDPP.shtml
- Community development and partnership directorate http://www.sdc.gc.ca/en/hip/sd/999_CDPD.shtml
- Task force on community investments http://www.sdc.gc.ca/en/hip/sd/TaskForce/overview.shtml
- New horizons for seniors http://www.sdc.gc.ca/en/isp/horizons/toc.shtml
- Understanding the early years http://www.sdc.gc.ca/en/hip/sd/300_UEYInfo.shtml
- Grants and contributions http://www.sdc.gc.ca/en/gateways/sd/nav/top_nav/program/gc.shtml
Children and Families
- Canada's Universal Child Care Planhttp://www.universalchildcare.ca/
- Federal/Provincial/Territorial Early Childhood Development Agreement http://www.ecd-elcc.ca/
- Multilateral Framework on Early Learning and Child Care http://www.ecd-elcc.ca/
- The National Child Benefit http://www.nationalchildbenefit.ca/
Housing and Homelessness
- The National Homelessness Initiative http://www.homelessness.gc.ca/home/index-eng.asp
- The National Homelessness Initiative Programs http://www.homelessness.gc.ca/initiative/nhiprograms-eng.asp
Achieve better outcomes for Canadians through service excellence
- Service Canada http://www.servicecanada.gc.ca/en/home.html
Questions and Public Enquiries
If you have questions about departmental programs and services, you may contact your nearest Service Canada office listed in the Government of Canada pages of the telephone book or through the HRSDC website at http://www.hrsdc.gc.ca/en/gateways/nav/top_nav/our_offices.shtml.
To obtain HRSDC publications, please contact the Public Enquiries Centre athttp://www.hrsdc.gc.ca/en/gateways/nav/left_nav/publications.shtml
- 1 Serge Coulombe, Jean-François Tremblay and Sylvie Marchand, Literacy Scores, Human Capital and Growth Across Fourteen OECD Countries, 2004.
- 2 Statistics Canada Demography Division, Population Projections of Visible Minority Groups, Canada, Provinces and Regions 2001-2017, Cat No. 91-541-XIE, 2005.
- 3 Statistics Canada, Population Projections for Canada, Provinces and Territories (2005 - 2031), Cat No. 91-520-XIE, 2005.
- 4 Finance Canada, The Economic and Fiscal Update, November 2005, p. 38.
- 5 Bank of Canada, Monetary Policy Report, October 2005, pp: 15.
- 6 Canadian Mortgage and Housing Corporation, Canadian Housing Observer, 2005.
- 7 Percentages shown are reflective of the unemployed by designated group as a percentage of the entire unemployed Canadian labour force. For women, Aboriginal persons and visible minorities, unemployment data for labour force 15 years and over; for older workers, unemployment data for labour force 55 years and older (Census 2001). For people with disabilities based on unemployment data for labour force 15 years and over (Statistics Canada Participation and Activity Limitation Survey 2001).
- 8 These targets do not include returns to school following participation in the Summer Career Placements initiative under Summer Work Experience. Proportion: Actual results to be reported. (This is a new indicator, therefore, reliable objectives cannot be established due to the absence of sufficient historical data.)
- 9 These targets do not include returns to school following participation in the Summer Career Placements initiative under Summer Work Experience. Proportion: Actual results to be reported. (This is a new indicator, therefore, reliable objectives cannot be established due to the absence of sufficient historical data.)
- 10 Projection of the 3-year direct loan default rate
- 11 Actual data from 2004-2005: All numbers listed are provided by provinces (except New Brunswick and Quebec). The number of clients served is high because some clients have been double-counted as they received services from more than one program within the year. Provinces cannot isolate the clients double-counted.
The number of clients completing a program or service and the number of clients employed are considered low because of the clients being double-counted and also because not all programs have the explicit outcome of employment. The goals of many programs funded through LMAPD is to enhance the employability of the client through training and work on life-skills issues. - 12 Actual data from 2005-2006: The enhanced employability value is considered an underestimate. This is a generated field based on the completion of certain types of interventions like training. There are reporting issues which are currently being addressed.
- 13 This target is for the first year of the program. For future years of the program the target will be 100% coverage.
- 14 Details on these horizontal initiatives can be found at: http://www.tbs-sct.gc.ca/rma/eppi-ibdrp/hrdb-rhbd/profil-eng.asp
- 15 Adult Literacy and LIfeskills Survey, 2003 http://nces.ed.gov/surveys/all/
- 16 International Adult Literacy Survey, 1994 http://www.statcan.ca:8096/bsolc/english/bsolc?catno=89-588-XIE
- 17 Footnote website for Horizontal Initiatives.
- 18 Footnote website for Foundations.
- 19 While the Government of Quebec supports the general principles of the Early Learning and Child Care initiative, it did not participate in developing these initiatives because it intends to preserve sole responsibility for social matters. However, Quebec receives its share of federal funding and the Government of Quebec is making major investments toward programs and services for families and children.
- 20 While the Government of Quebec supports the general principles of the Early Childhood Development Agreement, it did not participate in developing this initiative because it intends to preserve sole responsibility for social matters. However, Quebec receives its share of federal funding and the Government of Quebec is making major investments in programs and services for families and children.
- 21 The Canada Child Tax Benefit is administered by the Canada Revenue Agency, which reports on its strategic priorities, indicators and outcomes.
- 22 The Government of Quebec has stated that it agrees with the basic principles of the National Child Benefit. Quebec chose not to participate in the initiative because it wanted to assume control over income support for children in Quebec; however, it has adopted a similar approach to the National Child Benefit. Throughout this section, references to joint F/P/T positions do not include Quebec.
- 23 Planned Spending Tables for Social Investment and Children and Families are presented together, in accordance with the 2006-2007 Main Estimates.
- 24 The National Homelessness Initiative is an important horizontal initiative, which is managed by HRSDC, and which involves various partners, including organizations from other orders of government. Details on this horizontal initiative can be found at: http://www.tbs-sct.gc.ca/rma/eppi-ibdrp/hrdb-rhbd/profil-eng.asp
- 25 For more details refer to the EI website at http://www.hrsdc.gc.ca/en/gateways/topics/tyt-gxr.shtml
- 26 For further information, see http://www.hrsdc.gc.ca/en/ei/legislation/ei_act_maxyear.shtml#Maximum%20for
- 27 For further information, see http://www.hrsdc.gc.ca/en/ei/legislation/ei_act_part3.shtml#69
- 28 Office of the Chief Actuary. Actuarial Report (21st) on the Canada Pension Plan as at 31 December 2003. Ottawa: Office of the Superintendent of Financial Institutions Canada. 2004. p. 10.
- 29 The reserve is made up of an amount equivalent to 3 months worth of CPP benefits and expenses.
- 30 Information about the Canada Pension Plan Investment Board can be found at <http://www.cppib.ca>.
- 31 For further information on the Canada Student Loans Program, see http://www.hrsdc.gc.ca/en/gateways/topics/cxp-gxr.shtml
- 32 The new Canada Access Grant for Student with Permanent disabilities has replaced the Canada Study Grant for High-need Students with Permanent Disabilities.
- 33 An announcement was made on August 1, 2005 which transfers collections activities previously carried out by Social Development Canada (SDC) to Canada Revenue Agency.
Supplementary Information
Transfer Payment Programs
|
Name of Transfer Payment Program: |
||||
|
Start Date: |
End Date: |
|||
|
Description: The purpose of the Joint Voisey's Bay Employment and Training Authority (JETA) is to promote maximum employment opportunities for Aboriginal people at the Voisey's Bay mine/concentrator site as well as in related spin-off activities. |
||||
|
Strategic Outcome: Enhanced Canadian productivity and participation through efficient and inclusive labour markets, competitive workplaces and access to learning. |
||||
|
Expected Results: To support the Aboriginal groups of Labrador to provide programs and services to assist Aboriginal individuals to prepare for, obtain and maintain employment associated with major developments in Labrador, building on the development at the Voisey's Bay site. The contribution agreement with JETA ended March 31, 2006, as the Voisey's Bay Nickel/Mine site is now in Operation. The jobs now available at the Voisey's Bay site will be through attrition, and as such longer term planning and more effective programming is required to ensure that Aboriginal people have the appropriate skill sets for areas of demand with VBNC as well as other employers, as appropriate. The extension of the AHRDP – JETA funding into 2007/2008 will provide the necessary timeline to enter into a new agreement(s) with the Aboriginal groups in Labrador for the effective utilization of the remaining funds, leading to lasting benefits for the Aboriginal people of Labrador. Service Canada is currently working with the Aboriginal groups to develop plans for the remaining funds and the associated result targets.
|
||||
| $ Million | ||||
|
Total |
Planned |
Planned |
Planned |
|
|
Program Activity: |
||||
|
Total Grants |
||||
|
Total Contributions1 |
4.5 | 4.7 | 1.2 | 0 |
|
Total Other Transfer Payments |
||||
|
Total - Transfer Payment Programs |
4.5 | 4.7 | 1.2 | 0 |
|
Planned Audit and Evaluation: Evaluation An evaluation of the Voisey's Bay project is planned for completion by December 2006 and results will be available in early 2007. The evaluation activities include formative (program design, delivery, and implementation) and summative (program relevance, success, cost-effectiveness) components, based on multiple lines of inquiry. These consist of key informant interviews, focus group discussions, a survey of participants, and a review of files/documents and administrative data. |
||||
| 1 A request for re-profile of $1.2M from fiscal year 2005-06 to 2007-08 was approved in the ARLU 2006-09. | ||||
|
Name of Transfer Payment Program: |
||||
|
Start Date: |
End Date: |
|||
|
Description: Transfer payments made under the Aboriginal Human Resources Development Strategy (AHRDS) are predominantly in the form of contributions to Aboriginal organizations. The AHRDS provides support to Aboriginal organizations to design and deliver:
|
||||
|
Strategic Outcome: Enhanced Canadian productivity and participation through efficient and inclusive labour markets, competitive workplaces and access to learning. |
||||
|
Expected Results: To support Aboriginal organizations to develop and implement labour market, youth and child care programs that are designed to address the local and regional needs of Aboriginal people. This programming will:
Increase the supply of quality child care services in First Nations and Inuit communities, thereby raising the availability of distinct and diverse services in these communities to a level comparable to that of the general populationAssist 50,000 Aboriginal clients, of whom 20,000 are expected to find and keep work or become self employed, and approximately 2,000 will return to school. Approximately, 7,500 child care spaces will continue to be supported and occupied. |
||||
| $ Million | ||||
|
Total |
Planned |
Planned |
Planned |
|
|
Program Activity: |
||||
|
Total Grants |
||||
|
Total Contributions |
263.6 | 257.0 | 250.1 | 249.3 |
|
Total Other Transfer Payments |
||||
| Total - Transfer Payment Programs1 | 263.6 | 257.0 | 250.1 | 249.3 |
|
Planned Audit and Evaluation: A formative evaluation of the AHRDAs is underway. It will increase our understanding of the issues and factors framing the design, delivery, implementation and effectiveness of the Strategy. Results of the formative evaluation, as well as those of the summative evaluation, planned for 2007-08, will help inform the renewal of the AHRD program. The formative evaluation strategy includes a literature review, a socio-economic profile of AHRDA communities, an assessment of data collection and accountability systems, and an examination of issues relating to the design, delivery and implementation of thirteen case study AHRDAs. The formative evaluation will also examine the design, delivery and implementation of the First Nations and Inuit Child Care Initiative. An internal audit of selected AHRDAs will be conducted in fiscal year 2007-08 to measure the progress made on recommendations provided by previous audits. |
||||
| 1 Expected result(s) and outcomes are based on total program funding through the Consolidated Revenue Fund (CRF) and Employment Insurance Act Part II. The forecast and planned spending figures reflect only CRF program. | ||||
|
Name of Transfer Payment Program: |
||||
|
Start Date: |
End Date: |
|||
|
Description: The Aboriginal Skills and Employment Partnership (ASEP) initiative is a targeted Aboriginal skills development program designed to promote maximum employment for Aboriginal people on major economic developments through a collaborative partnership approach. It is designed to address a broad spectrum of skills and learning needs and provide access to jobs. |
||||
|
Strategic Outcome: Enhanced Canadian productivity and participation through efficient and inclusive labour markets, competitive workplaces and access to learning. |
||||
|
Expected Results: Anticipated targets for 2006/2007 are as follows (targets currently under negotiation):
The overall objectives of the ASEP initiative:
|
||||
| $ Million | ||||
|
Total |
Planned |
Planned |
Planned |
|
|
Program Activity: |
||||
|
Total Grants |
||||
|
Total Contributions1 |
25.2 |
23.5 | 18.2 | 0 |
|
Total Other Transfer Payments |
||||
|
Total - Transfer Payment Programs |
25.2 | 23.5 | 18.2 | 0 |
|
Planned Audit and Evaluation: Evaluation An evaluation of the ASEP program is underway and planned for completion by March 2008. The evaluation includes formative (program design, delivery and implementation) and summative (program relevance, success, and cost-effectiveness) components. The evaluation employs multiple lines of inquiry, including a survey of ASEP participants, key informant interviews, focus groups discussions, socio-economic profiles, a review of baseline data, a document/file review, and a detailed analysis of administrative data from various sources. There is no separate program audit planned for ASEP, however the program is included in the Departments horizontal audit. Currently, the program is included in the review of contribution agreements to determine how the Segregation of Duties directive is being applied. |
||||
| 1 The 2006-07 Planned Spending includes a re-profile of $5,263k from fiscal year 2005-2006. | ||||
|
Name of Transfer Payment Program: |
||||
|
Start Date: |
End Date: |
|||
|
Description: Promote lifelong learning by reducing non-financial barriers to adult learning and facilitate the creation of opportunities for Canadians to acquire and develop learning, literacy, and essential skills, in collaboration with partners. |
||||
|
Strategic outcome: Enhanced Canadian productivity and participation through efficient and inclusive labour markets, competitive workplaces and access to learning. |
||||
|
Expected Results: The program outputs, which will begin to be reported in year two of the Program, will include:
The expected immediate program outcomes will be:
|
||||
| $ Million | ||||
|
Total |
Planned Spending |
Planned Spending |
Planned Spending |
|
|
Program Activity: |
||||
|
Total Grants |
23.8 | 28.4 | 28.4 | 28.4 |
|
Total Contributions |
8.7 | 13.3 | 18.8 | 4.1 |
|
Total Other Types of Transfer Payments |
||||
|
Total Program Activity |
32.5 | 41.7 | 47.2 | 32.5 |
|
Planned Audit and Evaluation: An evaluation framework will be developed in 2006-2007 in preparation for a formative evaluation in 2007-2008. |
||||
| 1 The Adult Learning, Literacy and Essential Skills Program (ALLESP) came into effect April 1, 2006 and integrates three former programs, the National Literacy Program, the Office of Learning Technologies, and the Learning Initiatives Program. | ||||
|
Name of Transfer Payment Program: |
||||
|
Start Date: 1998 |
End Date: Ongoing |
|||
|
Description: The Canada Education Savings Grant encourages Canadians to save for the post-secondary education of children through Registered Education Savings Plans (RESPs). |
||||
|
Strategic outcome: Enhanced Canadian productivity and participation through efficient and inclusive labour markets, competitive workplaces and access to learning. |
||||
|
Expected Results: The expected results of the Canada Education Savings (CES) Program are:
The Canada Education Savings (CES) Program's long-term outcome is to increase the participation rate of Canadians in post-secondary education (PSE) through savings incentives. By increasing financial capacity to attend PSE, the CES Program's ultimate outcome is to contribute to the development of more skilled and knowledgeable Canadians who are able to fully participate in the workplace and society. |
||||
| $ Million | ||||
|
Total |
Planned |
Planned |
Planned |
|
|
Program Activity: |
||||
|
Total Grants (statutory) |
462.5 | 575.0 | 560.0 | 575.0 |
|
Total Contributions |
||||
|
Total Other Types of Transfer Payments |
||||
|
Total Program Activity |
462.5 | 575.0 | 560.0 | 575.0 |
|
Planned Audit and Evaluation: An interim formative evaluation is scheduled for Fall 2006. |
||||
|
Name of Transfer Payment Program: |
||||
|
Start Date: |
End Date: |
|||
|
Description: The Canada Learning Bond (CLB) was introduced to further encourage low-income families to open RESPs to save for their children's post-secondary education. |
||||
|
Strategic outcome: Enhanced Canadian productivity and participation through efficient and inclusive labour markets, competitive workplaces and access to learning. |
||||
|
Expected Results: The immediate outcomes of the Canada Education Savings (CES) Program are:
The Canada Education Savings (CES) Program's long-term outcome is to increase the participation rate of Canadians in post-secondary education (PSE) through savings incentives. By increasing financial capacity to attend PSE, the CES Program contributes to the ultimate outcome of developing more skilled and knowledgeable Canadians who are able to fully participate in the workplace and society. |
||||
| $ Million | ||||
|
Total |
Planned Spending |
Planned Spending |
Planned Spending |
|
|
Program Activity: |
||||
|
Total Grants (statutory) |
2.2 | 45.0 | 40.0 | 49.0 |
|
Total Contributions |
||||
|
Total Other Types of Transfer Payments |
||||
|
Total Program Activity |
2.2 | 45.0 | 40.0 | 49.0 |
|
Planned Audits and Evaluations: An interim formative evaluation is scheduled for Fall 2006. |
||||
|
Name of Transfer Payment Program: |
||||
|
Start Date: |
End Date: |
|||
|
Description: Provide Alternative Payments to non-participating jurisdictions, Interest Relief and Debt Reduction in Repayment benefits to borrowers, and the value of loans forgiven according to prescribed criteria. |
||||
|
Strategic Outcome: Enhanced Canadian productivity and participation through efficient and inclusive labour markets, competitive workplaces and access to learning. |
||||
|
Expected Results: To ensure alternative payments, interest relief, debt reduction in repayment benefits, and the amount of loans forgiven are accurately reflected in financial reports. |
||||
| $ Million | ||||
|
Total |
Planned |
Planned |
Planned |
|
|
Program Activity: |
||||
|
Total Grants |
||||
|
Total Contributions (statutory) |
211.2 | 223.7 | 238.2 | 247.1 |
|
Total Other Types of Transfer Payments |
||||
|
Total Program Activity |
211.2 | 223.7 | 238.2 | 247.1 |
|
Planned Audits and Evaluations: Not Applicable |
||||
|
Name of Transfer Payment Program: |
||||
|
Start Date: |
End Date: |
|||
|
Description: To track the benefits and administrative costs related to the risk-shared loan regime. |
||||
|
Strategic Outcome: Enhanced Canadian productivity and participation through efficient and inclusive labour markets, competitive workplaces and access to learning. |
||||
|
Expected Results: To ensure interest subsidy, Interest Relief benefits, Debt Reduction in Repayment benefits, the amount of loans forgiven, risk premium and put-backs are accurately reflected in financial reports. |
||||
| $ Million | ||||
|
Total |
Planned |
Planned |
Planned |
|
|
Program Activity: |
||||
|
Total Grants |
||||
|
Total Contributions (statutory) |
70.1 | 46.4 | 30.5 | 19.3 |
|
Total Other Types of Transfer Payments |
||||
|
Total Program Activity |
70.1 | 46.4 | 30.5 | 19.3 |
|
Planned Audits and Evaluations: Not Applicable |
||||
| 1 Current Year figures include recoveries and balance to Public Accounts; Planned Spending figures are from ARLU. | ||||
|
Name of Transfer Payment Program: |
||||
|
Start Date: |
End Date: |
|||
|
Description: To track the claims submitted by financial institutions related to the Guaranteed Loan Portfolio. |
||||
|
Strategic Outcome: Enhanced Canadian productivity and participation through efficient and inclusive labour markets, competitive workplaces and access to learning. |
||||
|
Expected Results: To ensure claim payments are accurately reflected in financial reports. |
||||
| $ Million | ||||
|
Total |
Planned |
Planned |
Planned |
|
|
Program Activity: |
||||
|
Total Grants |
||||
|
Total Contributions (statutory) |
(27.7) | 9.5 | 6.5 | 4.5 |
|
Total Other Types of Transfer Payments |
||||
|
Total Program Activity |
(27.7) | 9.5 | 6.5 | 4.5 |
|
Planned Audits and Evaluations: Not Applicable |
||||
| 1 Current year figures include recoveries and balance to Public Accounts; Planned Spending figures are from ARLU. | ||||
|
Name of Transfer Payment Program: |
||||
|
Start Date: |
End Date: |
|||
|
Description: Provide targeted grants for eligible borrowers to increase access to post-secondary education by reducing financial barriers. |
||||
|
Strategic outcome: Enhanced Canadian productivity and participation through efficient and inclusive labour markets, competitive workplaces and access to learning. |
||||
|
Expected Results: Since 1995, the Government of Canada has offered the Canada Study Grant to encourage participation in post-secondary education by providing additional non-repayable assistance or reducing debt. The Canada Study Grants are designed to address the education-related costs of students with dependants, women in certain doctoral programs, and high-need part-time students, and to accommodate students with permanent disabilities by covering the exceptional education-related costs associated with their disability. In August 2005, the Government of Canada introduced two Canada Access Grants, which provides up-front non-repayable assistance intended to improve access to post-secondary education and reduce financial barriers for students from low-income families and students with permanent disabilities. |
||||
| $ Million | ||||
|
Total Authority |
Planned Spending |
Planned Spending |
Planned Spending |
|
|
Program Activity: |
||||
|
Total Grants (statutory) |
129.7 | 119.9 | 123.1 | 127.2 |
|
Total Contributions |
||||
|
Total Other Types of Transfer Payments |
||||
|
Total Program Activity |
129.7 | 119.9 | 123.1 | 127.2 |
|
Planned Audits and Evaluations: None in 2006-2007. |
||||
|
Name of Transfer Payment Program: |
||||
|
Start Date: |
End Date: |
|||
|
Description: CPRN is an independent, non-profit policy research organization whose mission is to create knowledge and lead public debate on social and economic issues of importance to Canadians. A $12 million grant was awarded to CPRN to be disbursed in $3 million annual installments over four years starting in 2006-07 and ending n 2009-2010. |
||||
|
Strategic outcome: N/A |
||||
|
Expected Results: To increase opportunities for social and economic policy development in Canada and to engage Canadians for public debate in a non-partisan forum. The production of quality, non-partisan policy research in order to facilitate wide-scale public dialogue to inform policy issues. |
||||
| $ Million | ||||
|
Total |
Planned |
Planned |
Planned |
|
|
Program Activity: |
||||
|
Total Grants (statutory) |
3.0 | 3.0 | 3.0 | |
|
Total Contributions |
||||
|
Total Other Types of Transfer Payments |
||||
|
Total Program Activity |
3.0 | 3.0 | 3.0 | |
|
Planned Audit and Evaluation: An evaluation of funding to CPRN was completed in 2005. |
||||
|
Name of Transfer Payment Program: |
||||
|
Start Date: |
End Date: |
|||
|
Description: Transfer of funds for one year (2006-07) to all provincial and territorial governments as a transition period to enable them to adjust the new approach of the Government of Canada's to child care. |
||||
|
Strategic outcome: Enhanced income security, access to opportunities and well-being for individuals, families and communities. |
||||
|
Expected Results: The Government of Canada respects the role of provinces and territories in determining their priorities. Provinces and territories have discretion to use this transitional funding as they see fit to improve their child care systems. |
||||
| $ Million | ||||
|
Total |
Planned |
Planned |
Planned |
|
|
Program Activity: |
||||
|
Total Grants (statutory) |
||||
|
Total Contributions |
||||
|
Total Other Types of Transfer Payments |
650.0 | |||
|
Total Program Activity |
650.0 | |||
|
Planned Audit and Evaluation: None have been planned. |
||||
|
Name of Transfer Payment Program: Enabling Fund for Official Language Minority Communities |
||||||||||||||||
|
Start Date: |
End Date: |
|||||||||||||||
|
Description: The Enabling Fund provides funding to Official Language Minority Communities (OLMC) designated organizations, the Regroupements de développement économique et d'employabilité (RDÉE) and Community Economic Development and Employability Committees (CEDEC) through contribution agreements. Contributions can be made under the Enabling Fund for the OLMC to support activities such as:
|
||||||||||||||||
|
Strategic Outcome: Enhanced Canadian productivity and participation through efficient and inclusive labour markets, competitive workplaces and access to learning. |
||||||||||||||||
|
Expected Results:
The Enabling Fund for OLMC is delivered under the authority of Section 6 of the Department of Human Resources Development Act, which provides the Minister with authority relating to the development of Canada's human resources to enhance employment, encourage equality and promote social inclusion. The objective of the Enabling Fund is to ensure continuity of activities and funding for the organizations that foster the development of human resources, economic growth, and job creation and retention in OLMCs. |
||||||||||||||||
| $ Million | ||||||||||||||||
|
Total |
Planned |
Planned |
Planned |
|||||||||||||
|
Program Activity: |
||||||||||||||||
|
Total Grants |
||||||||||||||||
|
Total Contributions |
12.0 | 12.0 | 12.0 | |||||||||||||
|
Total Other Transfer Payments |
||||||||||||||||
|
Total - Transfer Payment Programs |
12.0 | 12.0 | 12.0 | |||||||||||||
|
Planned Audits and Evaluations:
|
||||||||||||||||
|
Name of Transfer Payment Program: |
||||
|
Start Date: |
End Date: |
|||
|
Description of Transfer Payment Program: The Foreign Credential Recognition (FCR) Program provides financial and strategic support to provincial and territorial partners and stakeholders, including Sector Councils, regulatory bodies, immigrant serving organizations and post secondary educational institutions, to develop a pan-Canadian approach to assessing and recognizing foreign credentials within targeted occupations and sectors of the economy to facilitate entry into, and mobility within, the Canadian labour market. The FCR Program supports the research and project-based activities of partners and stakeholders to develop tools and processes to assess and recognize foreign credentials in targeted occupations and sectors. The goal of the Program is to deliver on its mandate of improving the labour market outcomes of internationally trained workers in targeted occupations and sectors. |
||||
|
Strategic Outcome: Enhanced Canadian productivity and participation through efficient and inclusive labour markets, competitive workplaces and access to learning. |
||||
|
Expected Results: In the short-term, the Program will work with in partnership to:
In the medium and long-term, the Program will work in partnership to:
The Program will work with partners and stakeholders to achieve these short, medium and long-term outcomes in order to meet its ultimate objective of improving labour market outcomes in targeted occupations and sectors of internationally trained workers. |
||||
| $ Million | ||||
| Total Authority 2005-2006 |
Planned |
Planned |
Planned |
|
|
Program Activity: |
||||
|
Total Grants |
||||
|
Total Contributions |
$7.8M |
$15.7M |
$19.4M |
$18.9M |
|
Total Other Transfer Payments |
||||
|
Total - Transfer Payment Programs |
$7.8M |
$15.7M |
$19.4M |
$18.9M |
|
Planned Audit and Evaluation: A formative evaluation of the FCR Program will be completed in 2006-07. |
||||
|
Name of Transfer Payment Program: |
||||
|
Start Date: |
End Date: |
|||
|
Description: The Guaranteed Income Supplement is a monthly benefit paid to residents of Canada who receive a basic, full or partial Old Age Security pension and who have little or no other income. |
||||
|
Strategic outcome: Enhanced income security, access to opportunities and well-being for individuals, families and communities. |
||||
|
Expected Results: |
||||
| $ Million | ||||
|
Total |
Planned |
Planned |
Planned |
|
|
Program Activity: Social Investment |
||||
|
Total Grants (statutory) |
6,476.5 | 6,820.0 | 7,219.0 | 7,512.0 |
| Total Contributions | ||||
| Total Other Types of Transfer Payments | ||||
| Total Program Activity | 6,476.5 | 6,820.0 | 7,219.0 | 7,512.0 |
|
Planned Audit and Evaluation: Planned Audits and Evaluations: The Terms of Reference for an Evaluation of Guaranteed Income Supplement Take-up are under development with a planned completion date of 2008-2009. An Evaluation of Guaranteed Income Supplement will also take place in the same time period. |
||||
|
Name of Transfer Payment Program: |
||||
|
Start Date: |
End Date: |
|||
|
Description: The goal of the Labour Market Agreements for Persons with Disabilities is to improve the employment situation of Canadians with disabilities, by enhancing their employability, increasing the employment opportunities available to them, and building on their existing knowledge base. |
||||
|
Strategic outcome: Enhanced income security, access to opportunities and well-being for individuals, families and communities. |
||||
|
Expected Results: Measuring and reporting on program and societal indicators and undertaking evaluation activities will help to assess progress toward enhancing program effectiveness and improving the employment situation of persons with disabilities. |
||||
| $ Million | ||||
|
Total |
Planned |
Planned |
Planned |
|
|
Program Activity: |
||||
|
Total Grants (statutory) |
||||
|
Total Contributions |
||||
|
Total Other Types of Transfer Payments |
219.8 | 222.0 | 222.0 | 222.0 |
|
Total Program Activity |
219.8 | 222.0 | 222.0 | 222.0 |
|
Planned Audit and Evaluation: Reporting under the Agreements will include selected societal indicators (employment income, educational attainment and employment rate of working age persons with disabilities) and the following program indicators:
|
||||
| 1 The total cost for this program is $223 million, comprised of $222 million in other transfer payments and $1 million in operating costs. | ||||
|
Name of Transfer Payment Program: |
||||
|
Start Date: |
End Date: |
Total Funding prior to April 1, 2007: 784 M |
||
|
Description: Grants and contributions to not-for-profit organizations, individuals, municipal governments, Band/tribal councils and other Aboriginal organizations, public health and educational institutions, Régies régionales, for-profit enterprises, research organizations and research institutes to carry out research on homelessness to help communities better understand and more effectively address homelessness issues. |
||||
|
Strategic Outcome: Enhanced income security, access to opportunities and well-being for individuals, families and communities. |
||||
|
Expected Results: Objectives:
Expected Results: By March 31, 2007, the National Homelessness Initiative aims to achieve the following outcomes:
|
||||
| $ Million | ||||
|
Total |
Planned |
Planned |
Planned |
|
|
Program Activity: |
||||
|
Total Grants |
2.0 | 0.9 | ||
|
Total Contributions |
175.4 | 137.4 | ||
|
Total Other Transfer Payments |
||||
|
Total - Transfer Payment Programs |
177.4 | 138.3 | ||
|
Planned Audit and Evaluation: Summative Evaluation |
||||
|
Name of Transfer Payment Program: |
||||
|
Start Date: |
End Date: |
|||
|
Description: This program supports local projects across Canada that help seniors participate in social activities, pursue an active life and contribute to their communities. |
||||
|
Strategic outcome: Enhanced income security, access to opportunities and well-being for individuals, families and communities. |
||||
|
Expected Results: The specific objectives are:
The NHSP targeted outcomes are:
|
||||
| $ Million | ||||
|
Total |
Planned |
Planned |
Planned |
|
|
Program Activity: |
||||
|
Total Grants (statutory) |
10.8 | 15.6 | 19.5 | 19.5 |
|
Total Contributions |
||||
|
Total Other Types of Transfer Payments |
||||
|
Total Program Activity |
10.8 | 15.6 | 19.5 | 19.5 |
|
Planned Audit and Evaluation: An evaluation framework and methodology report for the formative evaluation has been developed, and it is scheduled to be completed in 2007-2008. |
||||
| 1 Note: The total budget for this program was $15 million in 2005-06 comprised of 11.7 million in grants and 3.3 million in operating costs, 20 million in 2006-07 comprised of 15.6 million in grants and 4.4 million in operating costs and 25 million in 2007-08 and on-going comprised of $19.5 million in grants and $5.5 million in operating costs. | ||||
|
Name of Transfer Payment Program: |
||||
|
Start Date: |
End Date: |
|||
|
Description: The Old Age Security pension is a monthly benefit available, if applied for, to most Canadians 65 years of age or over. Old Age Security residence requirements must also be met. An applicant's employment history is not a factor in determining eligibility, nor does the applicant need to be retired. Old Age Security pensioners pay federal and provincial income tax. (Higher income pensioners also repay part or all of their benefit through the tax system). |
||||
|
Strategic outcome: Enhanced income security, access to opportunities and well-being for individuals, families and communities. |
||||
|
Expected Results: |
||||
| $ Million | ||||
|
Total |
Planned |
Planned |
Planned |
|
|
Program Activity: |
||||
|
Total Grants (statutory) |
22,043.7 | 23,255.0 | 24,139.0 | 25,285.0 |
| Total Contributions | ||||
| Total Other Types of Transfer Payments | ||||
| Total Program Activity | 22,043.7 | 23,255.0 | 24,139.0 | 25,285.0 |
|
Planned Audit and Evaluation: A Summative Evaluation of Old Age Security will be initiated in 2006-07 with a completion date planned for 2008-2009. |
||||
| Name of Transfer Payment Program: Opportunities Fund for Persons with Disabilities1 |
||||
| Start Date: April 1, 2004 |
End Date: |
|||
|
Description: The Opportunities Fund Program is designed to assist persons with disabilities to return to work. Persons with disabilities who are unemployed and not normally eligible for Employment Insurance Part II Employment Programs can apply for assistance under the Opportunities Fund. |
||||
|
Strategic outcome: Enhanced income security, access to opportunities and well-being for individuals, families and communities. |
||||
|
Expected Results:
|
||||
| $ Million | ||||
|
Total |
Planned |
Planned |
Planned |
|
|
Program Activity: |
||||
|
Total Grants (statutory) |
||||
|
Total Contributions |
25.3 | 26.7 | 26.7 | 26.7 |
|
Total Other Types of Transfer Payments |
||||
|
Total Program Activity |
25.3 | 26.7 | 26.7 | 26.7 |
|
Planned Audit and Evaluation: A summative evaluation of the Opportunities Fund program is currently underway with a target timeline for completion of late Fall 2007. |
||||
| 1 Note: The total cost for this program is $30 million, comprised of $26.7 million in contributions and $3.3 million in operating costs. | ||||
| Name of Transfer Payment Program: Sector Council Program |
||||
|
Start Date: |
End Date: |
|||
|
Description: The Sector Council Program supports research and project-based activities proposed by Sector Councils, as well as ad-hoc national sector like organizations working on skills and learning issues. SCP supports sector council activities that include:
|
||||
|
Strategic Outcome: Enhanced Canadian productivity and participation through efficient and inclusive labour markets, competitive workplaces and access to learning. |
||||
|
Expected Results: In the short-term, the Program and Sector Councils will continue to work in partnership to:
|
||||
| $ Million | ||||
|
Total |
Planned |
Planned |
Planned |
|
|
Program Activity: |
||||
|
Total Grants |
||||
|
Total Contributions |
$22.5M |
$26.5M |
$26.5M |
$26.5M |
|
Total Other Transfer Payments |
||||
|
Total - Transfer Payment Programs |
$22.5M |
$26.5M |
$26.5M |
$26.5M |
|
Planned Audit and Evaluation: The summative evaluation of the Sector Council Program has commenced and is expected to be completed by 2006-2007. Phase 1 draft interim reports are anticipated by the end of September 2006, and a final report is anticipated by the end of the fiscal year. |
||||
| Name of Transfer Payment Program: Social Development Partnerships Program1 |
||||
|
Start Date: |
End Date: |
|||
|
Description: The Social Development Partnerships Program provides grants and contributions funding to non-profit organizations working to meet the social development needs of persons with disabilities, children and their families, and other vulnerable or excluded populations in Canada. |
||||
|
Strategic outcome: Enhanced income security, access to opportunities and well-being for individuals, families and communities. |
||||
|
Expected Results:
The program's more immediate objectives, against which the program will be evaluated, are to:
|
||||
| $ Million | ||||
|
Total |
Planned |
Planned |
Planned |
|
|
Program Activity: |
||||
|
Total Grants (statutory) |
10.2 | 14.3 | 14.3 | 14.2 |
|
Total Contributions |
20.8 | 15.0 | 17.8 | 21.1 |
|
Total Other Types of Transfer Payments |
||||
|
Total Program Activity |
31.0 | 29.3 | 32.1 | 35.3 |
|
Planned Audit and Evaluation: The summative evaluation of the SDPP is scheduled to begin in Fall 2006 and a draft report is expected in Fall 2007. |
||||
| 1 Note that funds for the Voluntary Sector Strategy, Understanding the Early Years and Early Childhood Development for Official Language Minority Communities are administered through the SDPP Terms and Conditions. Operating costs are not included. | ||||
|
Name of Transfer Payment Program: |
||||
|
Start Date: |
End Date: |
|||
|
Description: The Allowance is designed to recognize the difficult circumstances faced by many surviving persons and by couples living on the pension of only one spouse or common-law partner. |
||||
|
Strategic outcome: Enhanced income security, access to opportunities and well-being for individuals, families and communities. |
||||
|
Expected Results: The Allowance and the Allowance for the Survivor will continue to keep pace with inflation, along with the second installment of the increase to the Allowance announced in Budget 2005. Its implementation in January 2007 will increase benefits for Allowance recipients by $18. |
||||
| $ Million | ||||
|
Total |
Planned |
Planned |
Planned |
|
|
Program Activity: |
||||
|
Total Grants (statutory) |
472.1 | 500.0 | 537.0 | 568.0 |
|
Total Contributions |
||||
|
Total Other Types of Transfer Payments |
||||
|
Total Program Activity |
472.1 | 500.0 | 537.0 | 568.0 |
|
Planned Audit and Evaluation: None Planned |
||||
| Name of Transfer Payment Program: Training Centre Infrastructure Fund |
||||
|
Start Date: |
End Date: |
|||
|
Description: The three-year, Training Centre Infrastructure Funding (TCIF) pilot program will improve workplace skilled trades training and worker productivity by enabling tradespersons to train on equipment they will likely use on the job. |
||||
|
Strategic Outcome: Enhanced Canadian productivity and participation through efficient and inclusive labour markets, competitive workplaces and access to learning. |
||||
|
Expected Results: In pursuing the core objective TCIF will institute a range of core activities in support of its overarching mission to increase the use of up-to-date training equipment at union training centres:
Immediate – medium-term outcomes:
Longer-term outcomes:
|
||||
| $ Million | ||||
|
Total |
Planned |
Planned |
Planned |
|
|
Program Activity: |
||||
|
Total Grants |
||||
|
Total Contributions |
$7.2M | $11.0M | $4.2M | $0 |
|
Total Other Transfer Payments |
||||
|
Total - Transfer Payment Programs |
$7.2M | $11.0M | $4.2M |
$0 |
|
Planned Audits and Evaluations: An evaluation is planned to take place over the course of this 3-year pilot and will include various evaluation methods, including case studies of union training centres, end-user surveys, interviews and focus groups. |
||||
|
Name of Transfer Payment Program: |
||||
|
Start Date: |
End Date: |
|||
|
Description: Effective July 2006 families will receive up to $1,200 per year for each child under six, to be taxable in the hands of the lower-income spouse. Payments are being made directly to families so that they can choose the child care that is best for their children and their family's needs. The Universal Child Care Benefit is provided in addition to existing federal programs such as the Canada Child Tax Benefit, the National Child Benefit Supplement and the Child Care Expense Deduction and will not affect the benefits families receive under these programs. Further information can be found at www.universalchildcare.ca. |
||||
|
Strategic Outcome: Enhanced income security, access to opportunities and well-being for individuals, families and communities. |
||||
|
Expected Results: For 2006-07: 95% of eligible children under six years of age for whom their parents are receiving the Universal Child Care Benefit For 2007 onward: 100% of eligible children under six years of age for whom their parents are receiving the Universal Child Care Benefit |
||||
| $ Million | ||||
|
Total |
Planned |
Planned |
Planned |
|
|
Program Activity: |
||||
|
Total Grants |
||||
|
Total Contributions |
||||
|
Total Other Transfer Payments |
1,610.0 | 2,085.0 | 2,065.0 | |
|
Total - Transfer Payment Programs |
1,610.0 | 2,085.0 | 2,065.0 | |
|
Planned Audit and Evaluation:
Evaluation activities to be undertaken in the first three years of this initiative include the development of an evaluation framework and a formative evaluation. These activities will assess the effectiveness and efficiency of the processes and procedures established for the administration of the UCCB, in order to identify strenghts and areas for improvement, and inform policy and program planning for future years. |
||||
|
Name of Transfer Payment Program: |
||||
|
Start Date: |
End Date: |
|||
|
Description: The Workplace Skills Initiative (WSI) will fund projects that test and evaluate innovative, partnership-based, outcomes-focused approaches to skills development for employers and employed Canadians:
|
||||
|
Strategic Outcome: Enhanced Canadian productivity and participation through efficient and inclusive labour markets, competitive workplaces and access to learning. |
||||
|
Expected Results: The Workplace Skills Initiative is expected to contribute towards:
|
||||
| $ Million | ||||
|
Total |
Planned |
Planned |
Planned |
|
|
Program Activity: |
||||
|
Total Grants |
||||
|
Total Contributions |
$34.7 |
$37.7 |
$0 |
|
|
Total Other Transfer Payments |
||||
|
Total - Transfer Payment Programs |
$34.7 |
$37.7 |
$0 |
|
|
Planned Audits and Evaluations: Audits and evaluations will be conducted as outlined in the WSI Results-Based Management and Accountability Framework and the WSI Risk-Based Audit Framework, and in accordance with the WSI Evaluation Framework in the amended Treasury Board Submission. |
||||
|
Name of Transfer Payment Program: |
||||
| Start Date: 2003 |
End Date: On going |
|||
|
Description: Transfer payments made under the Youth Employment Strategy (YES)1 are predominantly in the form of contributions from participating departments for wage subsidies for participant youth or for the development and delivery of youth support services. Such support services include client assessment and case management services and employability tools so as to help participants acquire needed skills. Transfer payments contribute directly to the program objectives by encouraging organizations to create meaningful skills-enhancement opportunities for youth, providing supporting services or providing all youth with employment and career related tools and information. |
||||
|
Strategic Outcome: Enhanced Canadian productivity and participation through efficient and inclusive labour markets, competitive workplaces and access to learning. |
||||
|
Expected Results:
|
||||
|
$ Million |
||||
|
HRSD with Service Canada |
Total |
Planned Spending |
Planned Spending |
Planned Spending |
|
Program Activity: Employment Programs |
||||
|
Total Contributions 2 |
215.4 | 255.1 | 255.1 | 255.1 |
|
Total Other Transfer Payments |
||||
|
Total - Transfer Payment Programs |
215.4 | 255.1 | 255.1 | 255.1 |
|
Planned Audit and Evaluation: Not Applicable |
||||
| 1 Youth Awareness is not part of the Strategy 2 Includes resources transferred from Public Service Human Resources Agency for the Federal Public Sector Youth Internship Program. |
||||
Foundations (Conditional Grants)
| Name of Foundation: Canadian Council on Learning | ||||||
| Start Date: March 30, 2004 |
End Date: March 31, 2009 |
Total Funding: $85 million1 |
||||
|
Description: To promote and support evidence-based decision making in all areas of lifelong learning by informing Canadians regularly on Canada's progress on learning outcomes, and promoting knowledge and information exchange among learning partners. |
||||||
|
Strategic Outcomes:
|
||||||
|
Summary of Annual Plans of Recipient:
|
||||||
| $ million | ||||||
| Actuals 2005-2006 | Planned Spending 2006-2007 |
Planned Spending 2007-2008 |
Planned Spending 2008-2009 |
|||
| Conditional Grant(s)1 | N/A | N/A | N/A | N/A | ||
|
Planned Audit and Evaluation: Third Party formative evaluation to be completed by September 30, 2006 |
||||||
| URL to Recipient Site: www.ccl-cca.ca | ||||||
| 1A one-time grant was provided to CCL in fiscal year 2004-05. All funds are to be dispersed by March 31, 2009. | ||||||
| Name of Foundation: The Canada Millennium Scholarship Foundation | ||||
| Start Date: 2000 |
End Date: 2010 |
Total Funding: $2.5 billion |
||
|
Description: The Budget Implementation Act, 1998, provides for the creation of the Canada Millennium Scholarship Foundation. The Act establishes that the Minister of Human Resources and Social Development is responsible for tabling the Foundation's annual report before Parliament and provides for the $2.5B endowment made to the Foundation in 1998. The endowment is managed in accordance with the Funding Agreement between the Foundation and the Government of Canada, as represented by the Ministers of Finance and Human Resources and Social Development. The objective of the foundation is to increase access to post-secondary education so that Canadians can acquire the skills needed to participate in a changing economy and society by granting scholarships to students who are in financial need and who demonstrate merit. |
||||
|
Strategic outcome:
|
||||
|
Summary of Annual Plans of Recipient:
|
||||
| $ million | ||||
| Actuals 2005-2006 | Planned Spending 2006-2007 |
Planned Spending 2007-2008 |
Planned Spending 2008-2009 |
|
| Conditional Grant(s) | 307.4 | 348.5 | 349.6 | 350.4 |
| Administration | 22.5 | 27.0 | 28.0 | 30.0 |
|
Planned Audit and Evaluation: The Foundation's annual audit will be conducted in the first quarter, and program reviews and audits of granting processes will be conducted in three provinces. |
||||
| URL to Foundation site: www.millenniumscholarships.ca | ||||
| Name of Foundation: The Peter Gzowski Foundation for Literacy | ||||||
| Start Date: 31/03/03 |
End Date: Ongoing |
Total Funding: $5 million1 |
||||
|
Description: The purpose of this foundation is to provide one time funding and a vehicle for corporations and private citizens, who supported Peter Gzowski's work in literacy, to make donations in his name. The intent is to support increased public awareness of, and support for, literacy issues; leveraged funds; promotion of literacy and its importance; and literacy activities that support the promotion of literacy and leverage funds for literacy throughout Canada. |
||||||
Strategic Outcome:
|
||||||
|
Summary of Annual Plans of Recipient:
|
||||||
| $ million | ||||||
| Actuals 2005-2006 | Planned Spending 2006-2007 |
Planned Spending 2007-2008 |
Planned Spending 2008-2009 |
|||
| Conditional Grant(s) | Nil | Nil | Nil | Nil | ||
|
Planned Audit and Evaluation: Annual audits as required under new Treasury Board guidelines for foundations |
||||||
| URL to Foundation site: www.abc-canada.org/pgi_tournaments | ||||||
| 1The amount of $5 million was paid in 2003-2004. Therefore, no further funding will be provided to the Foundation. With the assistance of HRSD Legal Services, negotiations will proceed to amend reporting obligations in order to meet the Office of the Auditor General and Treasury Board standards. | ||||||
| Name of Foundation: The Winnipeg Foundation | ||||||
| Start Date: February 28, 2003 |
End Date: Ongoing |
Total Funding: $1 million |
||||
|
Description: The purpose of this foundation is to help support existing and innovative family literacy initiatives in Manitoba, more specifically to create and increase the availability of materials and resources to the family literacy field in the province. This includes the Literacy for Life endowment challenge fund which will support existing literacy activities and innovative family literacy initiatives at the grassroots level. |
||||||
|
Strategic outcome:
|
||||||
|
Summary of Annual Plans of Recipient:
|
||||||
| $ million | ||||||
| Actuals 2005-2006 |
Planned Spending 2006-2007 |
Planned Spending 2007-2008 |
Planned Spending 2008-2009 |
|||
| Conditional Grant(s) | $.075M | $.177M 1 | N/A | N/A | ||
|
Planned Audit and Evaluation: Annual audits as required under new Treasury Board guidelines for foundations. |
||||||
| URL to Foundation site: www.wpgfdn.org | ||||||
| 1Federal payments are contingent on matching funds raised by The Winnipeg Foundation. A total of $822,720 out of $1 million has been paid to the Winnipeg Foundation from February 28, 2003 to the end of the 2005-06 fiscal year. The balance of $177,280 remains to be paid out conditional upon The Winnipeg Foundation contributing a matching dollar amount. Matched funding will end September 30, 2006. With the assistance of HRSD Legal Services, negotiations will proceed to amend reporting obligations in order to meet the Office of the Auditor General recommendations and Treasury Board guidelines. | ||||||
| Name of Foundation: Read to Me! Foundation Inc. | ||||||
| Start Date: February 28, 2003 |
End Date: Not Applicable |
Total Funding: $1 million 1 |
||||
|
Description: To implement a province-wide family literacy program whereby each newborn in Nova Scotia receives a tote bag of books and learning supports before leaving the hospital. The intent is:
Ultimately, it is expected that this initiative will contribute to improving literacy levels in Nova Scotia. |
||||||
|
Strategic outcome:
|
||||||
|
Summary of Annual Plans of Recipient:
|
||||||
| $ million | ||||||
| Actuals 2005-2006 | Planned Spending 2006-2007 |
Planned Spending 2007-2008 |
Planned Spending 2008-2009 |
|||
| Conditional Grant(s) | Nil | Nil | Nil | Nil | ||
|
Planned Audit and Evaluation: Annual audits as required under new Treasury Board guidelines for foundations. |
||||||
| URL to Foundation site: Not Applicable | ||||||
| 1 The amount of $1 million was paid in three payments: one payment in 2002-2003 and two payments in 2003-2004. Therefore, no further funding will be provided to the Foundation. With the assistance of HRSD Legal Services, negotiations will proceed to amend reporting obligations in order to meet the Office of the Auditor General and Treasury Board standards. | ||||||
Horizontal Initiatives
|
Name of Horizontal Initiative: |
Name of Lead Department(s): |
||||||
|
Start Date: 1999 |
End Date: 2009 |
||||||
|
Total Federal Funding Allocation: |
|||||||
|
Description of the Horizontal Initiative: The Aboriginal Human Resources Development Strategy (AHRDS) was originally approved in 1999 for a five-year period with $1.6B committed for labour market and skills development. In the Fall of 2003, AHRDS was approved for another five years (2004-09). The AHRDS is a pan-Aboriginal human resources and skills development strategy that provides support to Aboriginal organizations (80 Human Resources Development Agreement holders to date), to design and deliver :
As part of a broader Aboriginal agenda, the AHRDS will assist to improve Aboriginal people's skills, facilitate their participation in the labour market, and, thus, close the gap in employment outcomes between Aboriginal and non-Aboriginal people. |
|||||||
|
Shared Outcome(s):
|
|||||||
|
Governance Structure(s):
|
|||||||
|
$ million |
|||||||
|
Federal Partners Involved in Each Program |
Names of Programs |
Total Allocation |
Planned Spending for 2006-2007 |
Expected Results for 2006-2007 |
|||
|
1. HRSD |
Total : On going |
$361.3M a |
|
||||
|
Total |
Total |
||||||
|
Results to be Achieved by Non-federal Partners (if applicable): There will be 80 Agreements with Aboriginal organizations across Canada. The expected results above are an aggregate total of the results to be achieved by the 80 agreement holders for 2006-2007. |
|||||||
|
Contact Information: Keith Conn |
Approved by: Karen Jackson, |
Date Approved: September 26, 2006 |
|||||
|
a. The planned spending figures reflect Consolidated Revnue Fund (CRF) and Employment-Insurance Act Part II. There is an estimated $14.2M in planned spending for operating resources related to AHRDS. |
|||||||
|
Name of Horizontal Initiative: |
Name of Lead Department(s): |
||||||
|
Start Date: 2003 |
End Date: 2008 |
||||||
|
Total Federal Funding Allocation: |
|||||||
|
Description of the Horizontal Initiative: The Aboriginal Skills and Employment Partnership (ASEP) program is a five year initiative with a total funding allocation of $85 million. It is targeted at developing the skills of Canada's Aboriginal workforce, promoting maximum employment for Aboriginal people on major economic developments across Canada and providing lasting benefits for Aboriginal communities, families and individuals. The entire initiative is geared to providing Aboriginal people with the skills needed to participate in economic opportunities such as northern mining, oil and gas, and hydro development projects across Canada. A key feature of the ASEP program is that a partnership must be established that includes significant funding contribution from the private sector, the provincial or territorial government as well as a commitment from all of the local Aboriginal communities. The partnership must also develop a comprehensive Aboriginal human resources training-to-employment plan for the large scale economic development project that will cover a broad continuum ranging from basic skills, literacy and academic upgrading, through job-specific training and apprenticeships to retention counselling and other on-the-job supports. The plan must have a commitment from the major employer to provide at least 50 long-term, sustainable jobs for Aboriginal people. There will be a number of major projects under development over the next decade as oil and gas, mining, forestry and hydro-electric projects are launched or expanded across Canada. There will be a wide range of employment opportunities, including the skilled trades and opportunities in secondary and service industries which offer good potential for sustainable employment. Training needs will be high, as many jobs now require higher education and computer skills. Within its currently funding capacity, ASEP is supporting nine such projects. |
|||||||
|
Shared Outcome(s): Long term sustainable employment for Aboriginal people on major economic developments, thereby resulting in increased employment and savings to income support programs. |
|||||||
|
Governance Structure(s):
|
|||||||
|
$ million |
|||||||
|
Federal Partners Involved in Each Program |
Names of Programs |
Total Allocation |
Planned Spending for 2006-2007 |
Expected Results for 2006-2007 |
|||
|
1. HRSDC |
a. ASEP |
$85 million |
$25.3 milliona (program and operating) |
|
|||
|
Total |
Total |
||||||
|
a A request for re-profile of $5,263k from fiscal year 2005-2006 to 2006-2007 was approved. |
|||||||
|
Results to be achieved by Non-federal Partners ( if applicable): |
|||||||
|
Contact Information: Keith Conn, DG |
Approved by: Karen Jackson |
Date Approved: September 26, 2006 |
|||||
|
Horizontal Initiative: |
Lead Department(s): |
|
Start Date: 1964 |
End Date: ongoing |
|
Total Federal Funding Allocated: ongoing |
|
|
Description: The February 2004 Speech from the Throne and the 2004 and 2005 Federal Budgets outlined the Government of Canada's commitment to ensuring access to post-secondary education by modernizing the Canada Student Loans Program (CSLP). The Government set out a balanced package of improvements to loans and grants, ensuring that student financial assistance evolves to meet the changing needs of learners and society. The purpose of the CSLP is to promote accessibility to post-secondary education for individuals with demonstrated financial need by lowering financial barriers through the provision of loans and grants and to ensure Canadians have an opportunity to develop the knowledge and skills to participate in the workplace and community. Since 1964, the CSLP has assisted millions of students in their pursuit of post-secondary education. In August of 2000, CSLP shifted from the risk-shared financing arrangements that had been in place with financial institutions between 1995 and 2000 to a direct student loan financing regime. This meant that the Program had to redesign the delivery mechanism in order to directly finance student loans. In the new arrangement, the Government of Canada provides the necessary funding to students and currently two service providers have contracts to administer the loans. For 2006-2007, it is estimated that approximately 455,000 full-time and part-time students will be assisted in accessing learning opportunities through student loans, study and access grants and non-repayable in-study interest subsidies. The amount of total financial support is expected to reach $2.2 billion. Of that amount, more than $1.9 billion will be disbursed as Canada Student Loans to approximately 355,000 students and approximately $120 million will be granted in non-repayable Canada Study Grants (CSG) and Canada Access Grants (CAG) to over 80,000 of those same students. The remaining amount (about $173 million) will be spent on in-study interest subsidies for all of the above plus approximately 100,000 previous additional borrowers remaining in study. Information for the public on saving, planning and paying for post-secondary studies and specific information for CSLP clients (including information on learning opportunity selection, financial planning, and how to apply for, maintain and repay student loans) can be accessed at: www.canlearn.ca. |
|
|
Shared Outcome(s): The shared outcomes for the Canada Student Loans Program are to:
|
|
|
Governance Structure(s): Through the Canada Student Loans Program, the Government of Canada develops policies regarding needs assessment, eligibility criteria, in-study account management, loan repayment and debt management, provides information on post-secondary education, and lends money to post-secondary students to finance their studies. In addition, it coordinates the delivery of the Direct Loan Program while managing both the Risk-Shared and Guaranteed Loan portfolios. The Government of Canada has entered into Integration Agreements with four provinces in order to create a "one-student-one-loan’ service approach. The administration of the current Program is the product of a co-operative effort between Human Resources and Social Development Canada (HRSDC), Service Canada, Canada Revenue Agency (CRA), participating provinces and the Yukon Territory, two Service Providers and Public Works and Government Services Canada (PWGSC). These agents are responsible for conducting one or more activities during the loan lifecycle. Program documents and communications tools are typically prepared with the input and approval of both federal and participating provincial and territorial governments. Quebec, the Northwest Territories and Nunavut do not participate in the CSLP. These jurisdictions receive an alternative payment to assist in the cost of delivering a similar student financial assistance program. Effective management of relations with third-party agents is the primary responsibility of the CSLP. Other Program activities include client relations and comptrollership. The front end of the Program is delivered by provincial student assistance offices, which also administer provincial aid. The participating provinces and the Yukon Territory:
Service Providers assume responsibility for maintaining the loans when the loan agreement is signed. Service Providers' responsibilities include:
PWGSC is responsible for disbursing loans. CRA Non-Tax Collection Services is the agent responsible for debt collection. Delinquent guaranteed and risk-shared loans become debts to the Crown when the Government of Canada buys back the debt from financial institutions. CRA Non-Tax Collection Directorate becomes responsible for directly financed loans after the Service Provider has attempted collection of a set period of time and the borrower has either not been located or is unwilling to repay. These activities may also be conducted by private collection agencies under contract to CRA. These private collection agencies must abide by CRA collection guidelines when carrying out the recovery of Crown debts. |
|
|
Federal Partners Involved in each program |
Names of Programs |
Total Allocation (Actuals for 2005-2006) |
Planned Spending for 2006-2007c |
Expected Results for 2006-2007 |
|
HRSDC |
N/A |
Final Operating Results $693.7 M Loans disbursed under the Canada Student Financial Assistance Act $1.9B |
$648.7 M Loans disbursed under the Canada Student Financial Assistance Act $1.9B |
|
|
Results to be achieved by Non-Federal Partners (if applicable): N/A |
||||
|
Contact: Trudy Albert, |
Approved by: Rosaline Frith |
Date Approved: |
||
| a Please note that the number is estimated as loans are awarded based on client eligibility and demonstrated need. b Please note that the number is estimated as grants are awarded based on client eligibility and demonstrated need. c Please note that planned spending for 2006-2007 does not include items revealed in the 2006 Federal Budget relating to the Canada Student Loans Program. |
||||
|
Name of Horizontal Initiative: |
Name of Lead Department(s): |
||||||
|
Start Date: |
End Date: |
||||||
|
Total Federal Funding Allocation: |
|||||||
|
Description of the Horizontal Initiative: September 2000, Federal/Provincial/Territorial Early Childhood Development (ECD) Agreement. To improve and expand early childhood development supports for young children (prenatal to age 6) and for their parents. The specific objectives are:
The Government of Quebec supports the general principles expressed in the Early Childhood Development Initiative but did not participate in developing the Initiative because it wants to retain sole responsibility for social matters. However, it receives its share of funding granted by the Government of Canada and makes significant investments in programs and services that benefit families and children. Information about the Agreement, including the text of the First Ministers' communiqué on ECD, is available on the federal, provincial and territorial web portal on early childhood development and early learning and child care at www.ecd-elcc.ca. |
|||||||
|
Shared Outcome(s): The objectives of the initiative, as outlined in the ECD Agreement are:
|
|||||||
|
Governance Structure(s): In the ECD Agreement, First Ministers recognized that provinces and territories have the primary responsibility for early childhood development programs and services. |
|||||||
| Federal Partners Involved | Not applicable. The ECD Agreement is a federal-provincial-territorial initiative. | ||||||
|
Results to be Achieved by Non-federal Partners (if applicable): Provincial and territorial governments are investing the funds transferred to them by the Government of Canada in any or all of the following four areas of action outlined in the ECD Agreement:
All participating F/P/T governments have committed to three reporting requirements:
Within the Government of Canada, responsibility for implementation of the commitments outlined in the ECD Agreement is shared jointly between Human Resources and Social Development Canada and the Public Health Agency of Canada. |
|||||||
|
Contact Information: Lorri Biesenthal |
Approved by: Deborah Tunis |
Date Approved: September 26, 2006 |
|||||
|
Horizontal Initiative: |
Lead Department(s): |
|||||
|
Start Date: 2003-2004 |
End Date: 2008-2009 and ongoing |
|||||
|
Total Federal Funding Allocation: |
||||||
|
Description: The Foreign Credential Recognition (FCR) Program provides financial and strategic support to provincial and territorial partners and stakeholders, including Sector Councils, regulatory bodies, immigrant serving organizations and post secondary educational institutions, to develop a pan-Canadian approach to assessing and recognizing foreign credentials within targeted occupations and sectors of the economy to facilitate entry into, and mobility within, the Canadian labour market. The FCR Program supports the research and project-based activities of partners and stakeholders to develop tools and processes to assess and recognize foreign credentials in targeted occupations and sectors. The goal of the Program is to deliver on its mandate of improving the labour market outcomes of internationally trained workers in targeted occupations and sectors. |
||||||
|
Shared Outcome(s): As the actual implementation of FCR rests with partners and stakeholders, the program primarily plays a support role in the development of tools and processes to assess and recognize foreign credentials. Efforts focus on achieving the following short-, medium- and long-term outcomes in support of the program's overarching ultimate objective. In the short term, the program will work in partnership to:
In the medium and long term, the program will work in partnership to:
The program will work with partners and stakeholders to achieve these short-, medium- and long-term outcomes to meet its ultimate objective of improving labour market outcomes in targeted occupations and sectors of internationally trained workers. |
||||||
|
Governance Structure(s): FCR is an area of shared jurisdiction with provinces and territories. In turn, provinces and territories have delegated this responsibility to over 400 regulatory bodies. This means some FCR Program outcomes are linked directly to the operations of its partners and explains why the accountability for achieving these outcomes is a shared responsibility. Federally, a committee of senior officials from 15 departments meet regularly to ensure policy and program coherence to improve the labour market outcomes of internationally trained workers. This committee is co-chaired by Human Resources and Social Development Canada and Citizenship and Immigration Canada. |
||||||
| $ Million | ||||||
|
Federal Partners Involved in Each Program |
Names of Programs |
Total Allocation |
Planned Spending for 2006-2007 |
Expected Results for 2006-2007 |
||
|
1. HRSDC |
a. Foreign Credential Recognition |
$59.8M over six (6) years |
$15.7M |
Further developing and strengthening the Foreign Credential Recognition program |
||
| Total $59.8M |
Total $15.7M |
|||||
|
Results to be Achieved by Non-federal Partners (if applicable): N/A |
||||||
|
Contact Information: Corinne Prince-St. Amand |
Approved by: Karen Jackson |
Date Approved: September 26, 2006 |
||||
|
Horizontal Initiative: |
Lead Department(s): |
|||||||
|
Start Date: |
End Date: |
|||||||
|
Total Federal Funding Allocation: |
||||||||
|
Description: Labour Market Development Agreements (LMDAs) are designed to assist unemployed Canadians prepare for, find and maintain employment. These agreements seek to achieve labour market program objectives such as improving client labour market outcomes, ensuring better coordination of federal/provincial programs to reduce duplication, and to more effectively meet the needs of regional and local labour markets. Pursuant to sections 57 and 63 of the Employment Insurance (EI) Act, LMDAs have been signed with all of the provinces/territories, in the form of either a co-managed or transfer agreement. A transfer agreement was signed with Ontario in November 2005. It will come into effect on January 1st, 2007. LMDAs are indeterminate agreements and are not subject to renewal, however, each agreement contains certain provisions for either party to give notice of termination. Part II of the EI Act requires the federal government to "work in concert" with provinces and territories in designing, implementing and evaluating Employment Benefits and Support Measures (EBSMs). EBSMs reduce dependency on insurance benefits and social assistance by helping individuals obtain and maintain employment. For further information on EBSM spending, please refer to the Monitoring and Assessment Report (MAR) at the following URL: http://www.hrsdc.gc.ca/en/ei/reports/eimar_2005.shtml The Employment Insurance Commission is mandated in section 3(1) of the Employment Insurance Act to provide the Minister responsible for the Employment Insurance (EI) program with an annual report on the usage, impact and effectiveness of the program. The 2005 EI Monitoring and Assessment Report continues an annual examination of EI from the perspective of the economy, communities and individual workers. The report examines the use of the program, the program’s impacts and effectiveness, the use of active re-employment measures, and the interaction between EI and the workplace for the fiscal year April 1, 2004 to March 31, 2005. The Employment Benefits and similar provincial-territorial programs delivered under the LMDAs help unemployed EI insured Canadians gain work experience, improve job skills or start new businesses, as well as encourage employers to provide opportunities for work experience. The first of four employment benefits is the Skills Development (SD) benefit which provides financial assistance to help eligible individuals pay for the cost of skills training and related expenses, while they are enrolled in a training program. The second is the Self-Employment (SE) benefit which provides eligible individuals with financial support and assistance in business planning while they begin to establish and operate their businesses. Thirdly, the Job Creation Partnerships (JCP) benefit provides eligible individuals with opportunities to gain valuable work experience on projects developed in conjunction with industry, other levels of government, and/or community groups. Finally, Targeted Wage Subsidies (TWS) helps eligible individuals who are experiencing difficulty accessing employment due to employment barriers. Employers receive a temporary wage subsidy as an incentive to hire individuals they would not normally hire in the absence of a subsidy. The Support Measures and similar provincial-territorial programs delivered under the LMDAs, provide funding to organizations, businesses and communities for three types of activities: The first measure, Employment Assistance Services (EAS) helps unemployed individuals prepare for, obtain and maintain employment by providing them with services such as counselling, job search techniques, action planning, job placement, and labour market information. The second support measure is Labour Market Partnerships (LMP) which provides funding to assist employers, employee and/or employer associations and communities, to improve their capacity to deal with human resource requirements and to implement labour force adjustments. Finally, Research and Innovation (R&I) helps support experimental activities which identify improved methods of helping Canadians prepare for and maintain employment, as well as be productive participants in the labour force. Summative evaluations of EBSMs, which are aimed at providing information on the impact of active measures in helping participants prepare for, obtain and maintain employment, are currently underway in several jurisdictions. Final results from the British Columbia, Quebec Alberta, Ontario, Nunavut and Newfoundland and Labrador summative evaluations are discussed in the 2005 Monitoring and Assessment Report. This report has been tabled in Parliament and is available from the above link to the MAR website. Other summative evaluations are currently underway and where available, findings will be presented in the 2006 Monitoring and Assessment Report. |
||||||||
|
Shared Outcome(s): The shared outcomes of partners are to help unemployed EI insured Canadians gain work experience, improve job skills or start new businesses, and to provide funding to organizations, businesses and communities that provide employment services to unemployed Canadians. Three measurement indicators will be used to assess the performance of these programs: |
||||||||
|
1. EI Clients Served: |
Represents active claimants and former Quebec claimants. |
|||||||
|
2. Returns to Work: |
Represents those insured participants (active and former Part I claimants) who have been referred to and participated in an EI Act Part II activity and who have subsequently returned to employment. |
|||||||
|
3. Unpaid Benefits: |
Measures the difference between the individual's entitlement to regular EI Act Part I benefits and the actual benefits paid out as the result of EI Active claimants who have been referred and participated in an EI Act Part II activity and who have returned to employment before exhausting their employment insurance entitlement. |
|||||||
|
Governance Structure(s):
|
||||||||
|
Federal Partners Involved in each Program |
Names of Programs |
Total Allocation |
Planned Spending for 2006-2007a |
Expected Results for 2006-2007a |
||||
|
HRSDC Co-Managed LMDAs and Ontario HRSDC and co-managed provinces and territories (NL, PEI, NS, BC, and YK) share responsibility for the design of labour market development programs and services. HRSDC, through Service Canada continues to be responsible for the management and delivery of the EBSMs through its network of local offices. In the case of Ontario where there was until recently no signed agreement, HRSDC is responsible for the design of programs, while HRSDC, through Service Canada is responsible for program management and delivery). Ontario will assume responsibility for design, management and delivery under the terms of the Canada-Ontario LMDA which will come into effect in January 2007. |
EBSMs
|
$1,060.8M (NB: the allocation noted above includes the portion allocated for Ontario - $526.7M - this will be split in the next RPP to reflect the coming into force of the transfer LMDA on January 1st, 2007. The specific quanta remain to be determined) |
$1,060.8M |
EI Clients Served Returns to Work Unpaid EI Act Part I benefits |
||||
|
Total $1,060.8M |
Total $1,060.8 |
|||||||
|
Results to be achieved by Non-Federal Partners (if applicable): Provincial / territorial governments - Transfer LMDA Under transfer agreements, the delivery of similar EBSM programs is the responsibility of the devolved provinces and territories (NB, QC, MB, SK, AL, NWT, and NU). |
||||||||
|
Total Allocation |
Planned Spending |
Expected Results |
||||||
|
Transfer LMDAs |
$889.2 million (see note regarding Ontario allocation, above: the allocation noted in this column does not include Ontario’s allocation) |
$889.2 million |
EI Clients Served Returns to Work Unpaid EI Act Part I benefits |
|||||
|
Contact: John Atherton |
Approved by: Karen Jackson |
Date Approved: |
||||||
|
a Above Planned Spending and Expected Results exclude Pan-Canadian activities as these are not delivered through LMDAs. |
||||||||
|
Name of Horizontal Initiative: |
Name of Lead Department(s): |
||||||
|
Start Date: |
End Date: |
||||||
|
Total Federal Funding Allocation: |
|||||||
|
Description of the Horizontal Initiative: In March 2003, Federal/ Provincial/Territorial Ministers Responsible for Social Services, reached agreement on a framework for improving access to affordable, quality, provincially and territorially regulated early learning and child care programs and services. Under the Multilateral Framework, the Government of Canada is providing $1.05 billion over five years through the CST to support provincial and territorial government investments in early learning and child care. This initiative complements the September 2000 ECD Agreement. The objective of this initiative is to further promote early childhood development and support the participation of parents in employment or training by improving access to affordable, quality early learning and child care programs and services. Early learning and child care programs and services funded through this initiative will primarily provide direct care and early learning for children in settings such as child care centres, family child care homes, preschools, and nursery schools. Types of investments can include capital and operating funding, fee subsidies, wage enhancements, training, professional development and support, quality assurance, and parent information and referral. Programs and services that are part of the formal school system are not included in this initiative. Governments also committed to transparent public reporting that will give Canadians a clear idea of the progress being made in improving access to affordable, quality early learning and child care programs and services, beginning with a baseline report in November 2003. Information about the initiative, including the text of the Multilateral Framework on Early Learning and Child Care, is available on the federal, provincial and territorial Web portal on early childhood development and early learning and child care at www.ecd-elcc.ca. |
|||||||
|
Shared Outcome(s): The objectives of the initiative, as outlined in the Multilateral Framework on Early Learning and Child Care are:
|
|||||||
|
Governance Structure(s): The Multilateral Framework for Early Learning and Child Care recognizes that provinces and territories have the primary responsibility for early learning and child care programs and services. Implementation of the commitments outlined in the Multilateral Framework has been tasked to a Working Group comprised of officials from all jurisdictions (including Québec, which participates as an observer). This Working Group reports to Deputy Ministers Responsible for Social Services, and is jointly chaired by Human Resources and Social Development Canada and Saskatchewan. |
|||||||
|
Results to be Achieved by Non-federal Partners (if applicable): Provincial and territorial governments have agreed to invest the funding provided in regulated early learning and child care programs for children under the age of six. Early learning and child care programs and services funded through this initiative will primarily provide direct care and early learning for children in settings such as child care centres,
family child care homes, preschools, and nursery schools. Investments can include capital and operating funding, fee subsidies, wage enhancements, training, professional development and support, quality assurance, and parent information and referral. Programs and services that are part of the formal school system are not included in this initiative. The Government of Quebec supports the general principles expressed in the Early Learning and Child Care Initiative but did not participate in developing the Initiative because it wants to retain sole responsibility for social matters. However, it receives its share of funding granted by the Government of Canada and makes significant investments in programs and services that benefit families and children |
|||||||
|
Contact Information: Barbara Moran |
Approved by: Deborah Tunis |
Date Approved: September 26, 2006 |
|||||
|
Horizontal Initiative: |
Name of Lead Department(s): |
|||||||
|
Start Date: |
End Date: |
|||||||
|
Total Federal Funding Allocation: |
||||||||
|
Horizontal Initiative: The Government of Canada is committed to helping to ensure that children in low-income families are supported in achieving their full potential. The National Child Benefit contributes to a larger federal/provincial/territorial (F/P/T) strategy, the National Children's Agenda, designed to help Canadian children. Through the National Child Benefit, the Government of Canada is working in partnership with provincial and territorial governments* to provide income support, as well as benefits and services, for low-income families with children. The initiative also includes a First Nations component. * The Government of Quebec has stated that it agrees with the basic principles of the National Child Benefit. Quebec chose not to participate in the initiative because it wanted to assume control over income support for children in Quebec; however, it has adopted a similar approach to the National Child Benefit. Throughout this document, references to joint F/P/T positions do not include Quebec. |
||||||||
|
Shared Outcome(s): The National Child Benefit initiative has three goals:
F/P/T Ministers Responsible for Social Services are committed to focusing on program outcomes as the primary goal of public reporting. Program monitoring, evaluation and reporting are essential to ensuring government accountability for the funds invested in the National Child Benefit and to determining whether the initiative's objectives are being achieved. Annual National Child Benefit Progress Reports include information on the level of spending by all jurisdictions. There is a data collection process to which all participating jurisdictions contribute in order to present comparable information by jurisdiction on National Child Benefit initiatives. The data submitted by each jurisdiction is reviewed jointly to ensure consistency in reporting. To obtain the most recent Progress Report or for further information, please visit the F/P/T National Child Benefit website: www.nationalchildbenefit.ca. Federal Spending: The Government of Canada contributes to the National Child Benefit initiative through a supplement to its Canada Child Tax Benefit. In addition to the base benefit of the Canada Child Tax Benefit, which is targeted to both low- and middle-income families, the NCB Supplement provides extra income support to low-income families with children. Federal spending on the Canada Child Tax Benefit is tracked by the Canada Revenue Agency, which is responsible for the delivery of the NCB Supplement. The federal government provided $2.9 billion through the NCB Supplement in 2004-05. By 2007-2008, total annual federal support delivered through the Canada Child Tax Benefit system, including the NCB Supplement, is projected to reach $9.5 billion, including a projected $3.7 billion through the NCB Supplement. Provincial/Territorial and First Nations Spending: Under the National Child Benefit, provinces, territories and First Nations provide benefits and services that further the goals of the initiative. The National Child Benefit Progress Report: 2004, reports that in 2003-2004, provinces, territories and First Nations reinvested about $697 million in available social assistance savings plus another $183 million in additional funds into benefits and services for low-income families with children. This includes First Nations reinvestments in programs and services which are estimated to be $53.2 million in 2003-2004. Indicators and Impacts: The National Child Benefit Progress Report: 2004 includes an analysis of both societal level indicators, which measure areas such as low income and labour force attachment and do not assume that any changes are necessarily caused by the initiative, and direct outcome indicators, which measure only those changes that are directly attributed to the National Child Benefit. With respect to societal level indicators, the report shows that the proportion of families with children living in low income has declined significantly since the mid-1900s, decreasing from 17.6 percent in 1996 to 11.4 percent in 2002, based on Statistics Canada's post-tax low-income cutoffs (post-tax LICOs). During this period, the number of children living in low income decreased from 1,304,000 in 1996 to 839,500 in 2002, a decrease of approximately 464,500 children. Further, the report estimates that in 2002, as a direct result of the National Child Benefit:
In addition, in June 2005, F/P/T governments released a synthesis report of a comprehensive evaluation of the first three years of the National Child Benefit initiative (1988-99, 1999-00, 2000-01). The evaluation compiled evidence from a number of studies and showed that the National Child Benefit is meeting its objectives of helping to prevent and reduce the depth of child poverty, supporting parents as they move into the labour market by ensuring they are better off working, and reducing overlap and duplication of government programs. For a complete discussion of indicators, please see Chapters 5 and 6 of the NCB Progress Report: 2004. For a discussion of evaluation results, please see the Evaluation of the National Child Benefit Initiative: Synthesis Report. These reports are available free of charge on the National Child Benefit website, at: www.nationalchildbenefit.ca. |
||||||||
|
Governance Structure(s): The National Child Benefit Governance and Accountability Framework outlines the key characteristics of the F/P/T partnership: cooperation, openness, flexibility, evolution and accountability. As a co-operative effort among governments, the NCB combines the strengths of a national program with the flexibility of provincial and territorial initiatives designed to meet the specific needs and conditions within each jurisdiction. With respect to accountability, under the Governance and Accountability Framework, federal, provincial and territorial Ministers Responsible for Social Services have committed to sharing data on reinvestment initiatives and reviewing results and outcomes achieved in order to identify best practices. F/P/T governments have also agreed to report annually to the public with a primary focus on performance of the initiative. To date, six annual progress reports have been published, as well as a synthesis report on a comprehensive evaluation of the first three years of the initiative. The Federal Role: Under the National Child Benefit, the Government of Canada provides additional income support to low-income families with children via the NCB Supplement component of the Canada Child Tax Benefit. Canada Revenue Agency delivers these benefits to families. Human Resources and Social Development Canada is responsible for policy development with respect to the National Child Benefit initiative, and the Minister of Human Resources and Social Development represents the Government of Canada in this F/P/T initiative. The Canada Child Tax Benefit (including the NCB Supplement) is a tax measure, and is administered by Canada Revenue Agency. Indian and Northern Affairs Canada and Citizenship and Immigration Canada have roles in reinvestments and investments. The Provincial and Territorial Role: Under the National Child Benefit, provinces, territories and First Nations provide benefits and services that further the goals of the initiative. The National Child Benefit is designed so that provinces, territories and First Nations have the flexibility to develop and deliver programs and services that best meet the needs and priorities of their communities. As part of this flexibility, provinces and territories may adjust social assistance or child benefit payments by the full or partial amount of the National Child Benefit Supplement. This approach has resulted in families on social assistance being no worse off in terms of their level of benefits, while providing additional funds for new or enhanced provincial and territorial programs benefiting low-income families with children. It is important to note that, as the National Child Benefit initiative has matured, the majority of provinces and territories no longer recover increases to the NCB Supplement. This means that the vast majority of children living in low-income families, including those on social assistance, are currently receiving some or all of the NCB Supplement. Under the National Reinvestment Framework, provincial and territorial governments, along with First Nations, have committed to re-allocating available social assistance funds into benefits and services for children in low-income families that further the goals of the initiative. Jurisdictions have focused reinvestments primarily in five key areas:
First Nations Role: The federal government is responsible for ensuring programs for First Nations children on reserve are comparable to those available to other Canadian children. Under the National Child Benefit, First Nations have the flexibility to reinvest savings from adjustments to social assistance into programs and services tailored to meet the needs and priorities of individual communities. Some 500 First Nations participate in the National Child Benefit and implement their own programs. |
||||||||
|
Federal Partners* Involved in Each Program |
Names of Programs |
Total Allocation |
Planned Spending for 2006-2007 |
Expected Results for 2006-2007 |
||||
|
1. Canada Revenue Agency* |
National Child Benefit Supplement |
Ongoing |
$3.7 billion (projected) |
Continued progress on the goals of the NCB initiative, as described in "Shared Outcomes’, above. |
||||
|
* While Human Resources and Social Development Canada is responsible for policy development with respect to the National Child Benefit initiative, the Canada Child Tax Benefit (including the NCB Supplement) is a tax measure, and is administered by Canada Revenue Agency. In addition, Indian and Northern Affairs Canada and Citizenship and Immigration Canada have roles in reinvestments and investments. |
||||||||
|
17. Results Achieved by Non-federal Partners: N/A |
||||||||
|
18. Contact Information: Lenore Duff, A/Director |
19. Approved by: Virginia Poter, Director General |
20. Date Approved: 25 September 2006 |
||||||
|
Horizontal Initiative: |
Lead Department(s): |
|||||
|
Start Date: 1999 |
End Date: March 31, 2007. |
|||||
|
Total Federal Funding Allocation: $784 million (grants and contribution funds only) |
||||||
|
Description: In December 1999, the Government of Canada launched the National Homelessness Initiative (NHI), a three-year initiative with a budget allocation of $753 million to develop new programs and to enhance existing programs to address the homelessness crisis in Canada. In February 2003, the Government extended the NHI for an additional three years with a budget allocation of $405 million. In November 2005, the Government announced a one-year extension (2006-2007) of the NHI with a budget allocation of $134.8 million to sustain communities through investments in successful homelessness initiatives. In 1999, the Government of Canada launched the NHI to assist communities in responding to the needs of the homeless population and those at risk of homelessness in Canada. The NHI makes strategic investments in community priorities and a planning process that encourages cooperation between governments, agencies and community-based organizations to find local solutions for homeless people and those at-risk. The NHI is designed to provide supports to 61 designated communities and some small, rural and Aboriginal communities to develop community-based measures that assist homeless individuals and families move toward self-sufficiency. Although the responsibility for homelessness programs falls under Human Resources and Social Development, most NHI program components are delivered by regional staff, now part of Service Canada. The NHI will continue to:
For more information, please visit the NHI website: http://www.homelessness.gc.ca |
||||||
|
Shared Outcome: Enhanced community capacity to contribute to the reduction of homelessness in Canada. |
||||||
|
Governance Structure(s): The NHI's community-based program is delivered via two models:
In Quebec, unlike other provinces and territories, two NHI components - the Supporting Communities Partnership Initiative (SCPI) and the Regional Homelessness Fund (RHF) - are delivered under a formal Canada-Quebec agreement, in collaboration with the Province Quebec. The community entity model and the shared delivery model deliver the components of the NHI, specifically the SCPI, Urban Aboriginal Homelessness (UAH) and the RHF. In addition, regions are actively involved in setting the agenda of the National Research Program (NRP) and the delivery of Surplus Federal Real Property for Homelessness Initiative (SFRPHI). Action for Neighbourhood Change (ANC) is a two-year action research initiative led by the Housing and Homelessness Branch (HHB), through its National Research Program (NRP), that examines how to further horizontal collaboration across government departments to increase the capacity and strength of distressed neighbourhoods. SFRPHI is an NHI program co-managed by Public Works and Government Services Canada (PWGSC) and Human Resources and Social Development/Housing and Homelessness Branch (HRSD/HHB), with advice and support from Canada Mortgage and Housing Corporation (CMHC). Together, HHB and PWGSC submitted a Treasury Board submission to transform surplus federal property into facilities that serve homeless people or those at risk of homelessness and contribute to building a coordinated response to homelessness and housing challenges. In coordination with the Department of Indian and Northern Affairs' Urban Aboriginal Strategy (UAS), the HHB will explore new ways for federal departments to work in a complementary fashion to better meet the needs of urban Aboriginal people in the eight communities originally included in the UAS (i.e., Vancouver, Edmonton, Calgary, Saskatoon, Regina, Winnipeg, Thunder Bay and Toronto). In coordinating this program, emphasis is placed on culturally appropriate Aboriginal community-planning and decision-making processes where priorities have been identified in each of the eight pilot cities, to guide investments. UAS expanded its program to include four new communities: Prince George, Prince Albert, Thompson, and Lethbridge; SCPI partners in those communities have been asked to work collaboratively with local UAS partners. |
||||||
|
Federal Partners Involved in each program |
Names of Programs |
Total Allocation (1999-2007) |
Planned Spending for 2006-2007 |
Expected Results for 2006-2007 |
||
| 1. Human Resources and Social Development (HRSD) - Housing and Homelessness Branch (HHB) | Supporting Communities Partnership Initiative (SCPI) | $600 | $113 |
|
||
| Health Canada; Public Safety and Emergency Preparedness Canada; | National Research Program (NRP) | $6 | $1.5 |
|
||
| Solicitor General (National Crime Prevention Centre) | Action for Neighbourhood Change | $0 | $2.1 |
|
||
|
2. Indian and Northern Affairs Canada (INAC) - Federal Interlocutor Division (FID) |
Urban Aboriginal Strategy/urban Aboriginal Homelessness (UAS/UAH) |
$109 |
$15 |
|
||
|
3. Public Works and Government Services Canada (PWGSC) |
Surplus Federal Real Property for Homelessness Initiative (SFRPHI) |
$0 [SFRPHI funding is administered by PWGSC] |
|
|||
|
Total |
Total |
|||||
|
Results to be achieved by Non-Federal Partners (if applicable): N/A |
||||||
|
Contact: Jim Young |
Approved by: Bayla Kolk A/Assistant Deputy Minister of Housing and Homelessness |
Date Approved: July 12, 2006 |
||||
|
Horizontal Initiative: |
Lead Department(s): |
||||
|
Start Date: 2002-2003 |
End Date: ongoing |
||||
|
Total Federal Funding Allocation: |
|||||
|
Description: The Sector Council Program supports research and project-based activities proposed by Sector Councils, as well as ad-hoc national sector like organizations working on skills and learning issues. SCP supports sector council activities that include:
|
|||||
|
Shared Outcome(s): While the specific goals of the industry-sponsored Sector Council may vary, depending on the particular needs of the sector, some interests and objectives are common. In the short-term, the Program and Sector Councils will continue to work in partnership to:
|
|||||
|
Governance Structure(s): As previously mentioned, SCP works in partnership with the aforementioned organizations in order to deliver on its mandate; and as such, the Program is in a "shared accountability regime". Some of the program outcomes that SCP is mandated to achieve are directly linked to the performance of its partners and therefore, the accountability for achieving these outcomes should be shared. SCP contributes to HRSDC's commitment under Chapter 7 of the Agreement on Internal Trade by supporting professional bodies in the development of Mutual Recognition Agreements. Once completed, these Mutual Recognition Agreements provide a plan for recognizing the credentials of professionals who move from one province or territory to another. Note: There are also national organizations with the mandate to address skills issues. While they do not form sector councils, they often work with industrial/occupational sector councils to address issues related to one or more councils. |
|||||
|
Federal Partners Involved in Each Program |
Names of Programs |
Total Allocation |
Planned Spending for 2006-2007 |
Expected Results for 2006-2007 |
|
|
1. HRSDC |
a. Sector Council Program |
$83.9M |
$26.5M |
Refining and broadening the impact of the Sector Council Program, testing new and innovative approaches to sectoral skills development |
|
|
Total |
Total |
||||
|
Results to be Achieved by Non-federal Partners (if applicable): N/A |
|||||
|
Contact Information: Éric Parisien |
Approved by: Karen Jackson |
Date Approved: September 26 2006 |
|||
|
Horizontal Initiative: |
Lead Department(s): |
|
|
Start Date: |
End Date: |
|
|
Total Federal Funding Allocation: |
||
|
Description: Service Canada was publicly launched in September 2005 to provide Canadians with better, more convenient and more responsive service delivery and one-stop access to an extensive range of programs and services from federal government departments and agencies. It builds on over a decade of work within the Government of Canada to improve the delivery of services to Canadians. Service Canada supercedes Modernizing Service for Canadians and the Service Canada Access Centres that were folded into Service Canada following Budget 2005. |
||
|
Shared Outcome(s): As part of its citizen focus, Service Canada has developed a Service Charter that describes its commitment for better service, Service Standards to communicate the level of service Canadians should expect, and a Performance Scorecard which includes service indicators for measuring access and Client Satisfaction results. These results are monitored and discussed by senior executives on a regular basis. An Office for Client Satisfaction was created to monitor and manage suggestions, compliments and complaints and identify where Service Canada can improve its processes to be more responsive and fair. For more details on Service Canada's governance structure, accomplishments, future plans and partners please refer to the Service Canada information in HRSDC's 2005-2006 Departmental Performance Report and the 2006-2007 Report on Plans and Priorities or the Service Canada Annual Report planned for publication in fall/winter 2006. |
||
|
Contact: |
Approved by: |
Date Approved: |
|
Horizontal Initiative: |
Lead Department(s): |
||||
|
Start Date: |
End Date: |
||||
|
Total Federal Funding Allocation: |
|||||
|
Description: The Youth Employment Strategy (YES) supports Canadian youth as they move into the world of work. YES has played an instrumental role in developing Canada's workforce of the future by providing young Canadians with access to programs and services to help them gain the skills, knowledge, career information and work experience they need to find and maintain employment and in making a successful transition into the labour market. YES has been streamlined based on information and knowledge gained through research and program evaluations which indicated the need to keep pace with the changing labour market and needs of youth, especially youth facing barriers to employment. The realigned YES features three key programs for youth aged 15-30 years: Career Focus, Skills Link and Summer Work Experience. For the period 2006-2007, the estimated YES investment is planned to be $400.1 million ($334.1 million CRF program funds and $66M in operating resources). The Government of Canada's support to young Canadians is a shared responsibility and a partnership effort among many departments and organizations. Through YES, HRSD with Service Canada and 12 other federal government departments work cooperatively with other levels of government, Aboriginal organizations, educational institutions, and private sector, not-for-profit and voluntary sectors to deliver YES initiatives. |
|||||
|
Shared Outcome(s): 1. The shared outcomes of partners are:
|
|||||
|
Governance Structure(s): YES has in place an umbrella Results-based Management and Accountability Framework (RMAF) that represents a commitment amongst the thirteen participating federal departments and agencies to undertake ongoing collection of common performance management data to ensure effective overall performance management of the program. As lead department, HRSD with Service Canada chairs and is responsible for the coordination and management of an Interdepartmental Operations Committee that is responsible for reporting on the implementation of YES. The Evaluation Steering Committee is another YES interdepartmental committee. There is also a Communications Sub-Committee reporting to the Operations Committee. YES initiatives are delivered nationally/regionally and locally using a variety of funding instruments such as contribution agreements and some direct delivery methods. Transfer payments are primarily provided by participating departments through contribution agreements and service delivery agreements in support of participant's remuneration and, overhead costs. Youth Protocols for joint planning mechanisms have been signed with Newfoundland and Labrador, Nova Scotia, Prince Edward Island, New Brunswick and Manitoba. |
|||||
|
$ million |
|||||
|
Federal Partners Involved in each Program |
Names of Programs |
Total Allocation |
Planned Spending for 2006-2007: |
Expected Results for 2006-2007: |
|
|
1. Career Focus |
1. Human Resources and Social Development Canada with Service Canadaa |
On-going |
$10.4 M SC - $6.2M HRSD-HRP - $4.2 M |
Service Canada
HRSD - HRP
Over the full course of the agreements, the total sector contribution is predicted to be $19,968,130 (agreements run from mid 05-06 to March 2008) This would equate to approximately $8M sector (recipient) contribution for 2006-07 Targets are not set by HRSD for OGD's, but results are reported in the DPR |
|
|
2. Agriculture and Agri-Food Canada |
$1.1 M |
||||
|
3. Canadian Food Inspection Agency |
$0.1 M |
||||
|
4. Canadian International Development Agency |
$6.4 M |
||||
|
5. Canadian Heritage |
$0.9 M |
||||
|
6. Department of Foreign Affairs/ Department of International Trade |
$6.4 M |
||||
|
7. Environment Canada |
$3.3 M |
||||
|
8. Industry Canada |
$9.8 M |
||||
|
9. National Research Council |
$5.4 M |
||||
|
10. Natural Resources Canada |
$0.6 M |
||||
|
2. Skills Link |
1. Human Resources and Social Development Canada with Service Canadaa |
On-going |
$146.6 M |
HRSD with Service Canada
Targets revised August 06 Targets are not set by HRSD for OGD's, but results are reported in the DPR |
|
|
2. Canada Mortgage and Housing Corporation |
$1.0 M |
||||
|
3. Indian and Northern Affairs Canada |
$14.0 M |
||||
|
3. Summer Work Experience |
1. Human Resources and Social Development Canada with Service Canadaa |
On-going |
$ 98.1 M |
HRSD with Service Canada
Targets revised August 06 Funds Leveraged $65M. Targets are not set by HRSD for OGD's, but results are reported in the DPR. |
|
|
2. Canadian Heritage |
$8.0 M |
||||
|
3. Industry Canada |
$10.0 M |
||||
|
4. Indian and Northern Affairs Canada |
$10.0 M |
||||
|
5. Parks Canada |
$2.0 M |
||||
|
Total: |
Total: |
||||
|
Results to be achieved by Non-Federal Partners (if applicable): N/A |
|||||
|
Contact: |
Approved by: |
Date Approved: |
|||
|
a HRSD planned spending reflects Consolidated Revenue Fund. There is an estimated $66M in planned spending for operating resources related to YES. |
|||||