
Treasury Board of Canada Secretariat
www.tbs-sct.gc.ca
Common menu bar links
Breadcrumb Trail
ARCHIVED - RPP 2006-2007
Public Works and Government Services Canada
 This page has been archived.
Archived Content
Information identified as archived on the Web is for reference, research or recordkeeping purposes. It has not been altered or updated after the date of archiving. Web pages that are archived on the Web are not subject to the Government of Canada Web Standards. As per the Communications Policy of the Government of Canada, you can request alternate formats on the "Contact Us" page.
Section III - SUPPLEMENTARY INFORMATION
Introduction
This section of the Report on Plans and Priorities provides, in greater detail, information concerning PWGSC's financial spending estimates over the reporting period 2006/07 to 2008/09. These estimates are intended to present consistent, balanced and accurate information to Parliament in accordance with the requirements contained in the TBS Guide to the Preparation of the 2006-2007 Report on Plans and Priorities. In some cases, such as for Major Crown Projects and Horizontal Initiatives of the department, the reader may be directed to further information, which can be found on PWGSC's Internet Site.
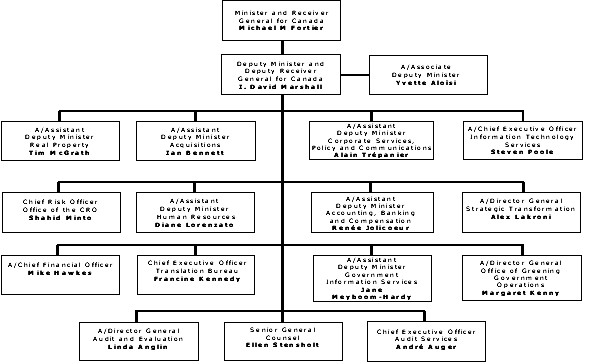
The tables in this section reflect the Program Activity Architecture of PWGSC's Government Services Program, which includes its two strategic outcomes: Quality Services and Sound Stewardship. The Organization Chart for PWGSC is provided below.
Table 1, Departmental Planned Spending by Strategic Outcome, outlines the program activity information reported in the Main Estimates and highlights the total budget spending for the Quality Services and Sound Stewardship strategic outcomes. The costs associated with Corporate Management have been reallocated to other program activities under Quality Services and Sound Stewardship. The subsequent adjustments, including Supplementary Estimates, Earmarked Items and ERC (Expenditure Review Committee) adjustments are also identified in Table 1.
Organization Chart
Public Works and Government Services Canada
Our Spending
|
Table 1: Departmental Planned Spending by Strategic Outcome |
| (in millions of dollars) |
| Forecast Spending 2005-2006 |
Planned Spending 2006-2007 |
Planned Spending 2007-2008 |
Planned Spending 2008-2009 |
|||||
| GOVERNMENT SERVICES PROGRAM (NOTE 1) | ||||||||
| Operating (including Special Purpose Allotments), Capital, Grants and Contributions and Statutory Votes by Strategic Outcomes | ||||||||
| Main Estimates (net) | ||||||||
| Quality Services | ||||||||
| Federal Accommodation and Holdings | 1,843.2 | 1,890.4 | 1,707.1 | 1,592.4 | ||||
| Real Property Services Revolving Fund | - | - | - | - | ||||
| Real Property Disposition Revolving Fund | (9.0) | (8.0) | (8.0) | (8.0) | ||||
| Acquisition Services | 127.1 | 152.2 | 147.5 | 148.7 | ||||
| Optional Services Revolving Fund | - | - | - | - | ||||
| Defence Production Revolving Fund | - | - | - | - | ||||
| IM/IT Services | 133.9 | 143.5 | 130.2 | 129.9 | ||||
| Telecommunications Services Revolving Fund | - | - | - | - | ||||
| Receiver General Services | 9.0 | 9.0 | 9.0 | 9.0 | ||||
| Public Service Compensation Services | 1.3 | 1.8 | 1.7 | 1.7 | ||||
| Government Information Services | 31.4 | 32.8 | 27.9 | 27.9 | ||||
| Business Integration Services | 28.8 | 10.2 | 11.4 | 11.4 | ||||
| Consulting and Audit Canada Revolving Fund | (0.4) | (0.5) | (0.5) | (0.5) | ||||
| Translation and Interpretation to Parliament, Conference Interpretation, Terminology | 51.4 | 52.3 | 55.1 | 55.1 | ||||
| Translation Bureau Revolving Fund | - | - | - | - | ||||
| Office of Green Government Operations Services | - | - | - | - | ||||
| Total Quality Services | 2,216.7 | 2,283.7 | 2,081.4 | 1,967.6 | ||||
| Sound Stewardship | ||||||||
| Real Property Stewardship | 31.7 | 34.1 | 34.2 | 34.2 | ||||
| Supply Operations Stewardship | 27.7 | 39.7 | 29.0 | 30.2 | ||||
| IM/IT Stewardship | 23.4 | 12.9 | 12.8 | 12.8 | ||||
| Receiver General Stewardship | 113.8 | 127.3 | 126.2 | 130.2 | ||||
| Public Service Pay Stewardship | 25.3 | 27.9 | 27.5 | 27.5 | ||||
| Public Service Pension Stewardship | 19.3 | 20.0 | 17.5 | 14.6 | ||||
| Government Information Stewardship | 17.6 | 18.5 | 18.6 | 18.6 | ||||
| Business Integration - Performance Management (Note 2) | 5.7 | 5.4 | 5.4 | 5.4 | ||||
| Translation Stewardship | 2.5 | 2.5 | 2.4 | 2.4 | ||||
| Office of Green Government Operations Stewardship | - | 1.3 | 1.3 | 1.2 | ||||
| Total Sound Stewardship | 267.0 | 289.6 | 275.0 | 277.2 | ||||
| Main Estimates total (net) | 2,483.7 | 2,573.3 | 3,356.4 | 2,244.8 | ||||
| Main Estimates (gross) | 4,454.0 | 4,579.2 | 4,425.3 | 4,313.0 | ||||
| Less: Respendable Revenue (Note 3) | 1,970.3 | 2,005.9 | 2,068.9 | 2,068.2 | ||||
| TOTAL MAIN ESTIMATES (net) | 2,483.7 | 2,573.3 | 2,356.4 | 2,244.8 | ||||
| Adjustments (net) | ||||||||
| Governor General Special Warrants | ||||||||
| Explanation of Requirements | ||||||||
| Initiatives to support the implementation of a common electronic infrastructure and multi-channel service delivery strategy (Government On-Line) |
130.9 | - | - | - | ||||
| Funding to continue the implementation of the approved projects included in the long term vision and plan for the parliamentary precinct buildings |
43.9 | |||||||
| Operating budget carry forward |
38.0 | - | - | - | ||||
| Collective bargaining agreements | 33.1 | |||||||
| Capital budget carry forward for the construction of the Bel-Air Building (Montreal) and the Government of Canada Building (Charlottetown) | 15.2 | |||||||
| Funding in support of the reform initiative to transform the government procurement process | 12.1 | - | - | - | ||||
| Funding to support the department’s capacity to deliver common services to the general public and the Government of Canada as a whole | 11.9 | - | - | - | ||||
| Paylist Shortfalls | 6.9 | |||||||
| Funding to establish a new model for core services related to the Government Electronic Tendering Service | 6.8 | - | - | - | ||||
| Funding for the renovation, expansion and refitting of 100 Wellington Street, Ottawa, Ontario to accommodate the Portrait Gallery of Canada | 6.0 | |||||||
| Funding in support of activities associated with the Commission of Inquiry into the Sponsorship Program and Advertising Activities (Gomery Commission) | 5.7 | - | - | - | ||||
| Divestiture of the Harbourfront Park in Trois-Rivières | 5.1 | |||||||
| Funding for the proof of concept phase to provide an online marketplace service to authorized government users to electronically select and purchase goods and services, make the necessary payments and carry the associated settlements (Government of Canada Marketplace Project) | 5.0 | - | - | - | ||||
| Funding for the preparation and fit-up of Library and Archives Canada headquarters | 5.0 | |||||||
| Funding to inform Canadians about Government of Canada's priorities, programs and services through participation in the Government of Canada Exhibition Program and the Rural Exhibits Program | 4.6 | - | - | - | ||||
| Effective Project Approval for the reconstruction of the Laniel Dam | 3.3 | |||||||
| Funding for the establishment of a disaster recovery back-up site for government-wide mission-critical banking, payment, accounting and compensation systems | 2.0 | - | - | - | ||||
| Funding to modernize human resources management in the Federal Public Service (Public Service Modernization Act) | 2.0 | - | - | - | ||||
| Funding to support administration of one-time energy cost payments to low-income families with children and seniors announced by the Government of Canada in October 2005 | 1.6 | |||||||
| Funding to retrieve the proceeds of crime from targeted organized crime entities (Integrated Proceeds of Crime Initiative) | 1.4 | - | - | - | ||||
| Funding for projects to reform the classification of jobs within the Federal Public Service | 1.0 | - | - | - | ||||
| Reinvestment of revenues from the sale or transfer of real property | 1.0 | |||||||
| Additional resources to meet official language objectives in the Federal Public Service related to: information exchange, regional bilingualism needs, learning and language retention, bilingual networks and service delivery (Official Languages Innovation Program) | 0.8 | - | - | - | ||||
| Funding to implement the Quebec Parental Insurance Plan and amend the Employment Insurance Plan requirements in the Public Service Pay Systems and web applications | 0.8 | - | - | - | ||||
| Funding for the Federal Contaminated Sites Action Plan | 0.8 | |||||||
| Funding for the implementation of a revised financial framework for the management of the Crown Assets Distribution function | 0.4 | - | - | - | ||||
| Funding to develop and implement software changes related to the Public Service Pay Systems | 0.5 | - | - | - | ||||
| Increased funding related to increased banking fees, postage, cheque and envelope costs for the Receiver General Treasury Function | 0.3 | |||||||
| Funding related to government advertising programs | 0.2 | - | - | - | ||||
| Funding to support employment equity projects to increase the representation in the Federal Public Service, of designated groups, in particular visible minorities, Aboriginal people and persons with disabilities | 0.2 | - | - | - | ||||
| Less: Spending authorities available within the Votes | (162.3) | - | - | - | ||||
| Total Governor General Special Warrants | 184.2 | |||||||
| Earmarked Items | ||||||||
| Funding for capital projects | - | 315.1 | 223.0 | 155.6 | ||||
| Funding for accommodation expenditures | - | 14.1 | 6.2 | 4.6 | ||||
| Funding for grants and contributions | - | 44.1 | - | - | ||||
| Funding for other Real Property expenditures | - | (10.9) | (15.3) | (3.3) | ||||
| Pension administration recoveries to be return to the consolidated revenue fund (statutory) | - | 0.3 | 1.1 | - | ||||
| Funding for the Federal Accountability Act and Action Plan | - | 5.2 | 7.5 | 8.5 | ||||
| Funding for Ministry regional responsibilities | - | 0.3 | 0.3 | 0.3 | ||||
| Expenditure Review - Procurement Savings | - | (25.1) | - | - | ||||
| Total Earmarked Items | - | 343.1 | 222.8 | 165.7 | ||||
| Other adjustments | ||||||||
| Employee benefit plans (EBP) adjustments (statutory) | 5.4 | - | - | - | ||||
| Year-end EBP and other minor statutory adjustments (statutory | 32.3 | |||||||
| Information Technology Service Branch - Transformation Initiatives (statutory) | 7.0 | - | - | - | ||||
| Payment in Lieu of Taxes (PILT) | (1.2) | - | - | - | ||||
| Allocations from TB Vote 10 (Minister's Regional Offices and Joint Career Transition Committee ) | 2.6 | - | - | - | ||||
| Real Property Conversion Factor - Frozen Item | (18.2) | - | - | - | ||||
| Capital - Frozen items | (15.4) | - | - | - | ||||
| Capital carry forward from 2005-2006 to 2006-2007 | (16.4) | - | - | - | ||||
| Total Other adjustments | (3.9) | - | - | - | ||||
| Total Adjustments | 180.3 | 343.1 | 222.8 | 165.7 | ||||
| NET PLANNED SPENDING | 2,664.0 | 2,916.4 | 2,579.2 | 2,410.5 | ||||
| Less: Non-Respendable Revenue | 22.4 | 21.5 | 20.7 | 20.7 | ||||
| Plus: Cost of Services Received Without Charge | 36.5 | 37.9 | 37.3 | 37.2 | ||||
| TOTAL DEPARTMENTAL SPENDING | 2,678.1 | 2,932.8 | 2,595.8 | 2,427.0 | ||||
| Totals may not add up due to rounding | ||||||||
| (FTEs) | ||||||||
| Full Time Equivalents (FTEs) | 12,401 | 12,043 | 11,919 | 11,868 | ||||
|
||||||||
|
Table 2: Services by Program Activities for 2006-2007 |
| (in millions of dollars) |
| Government Services / Program Activity | Budgetary Non-Statutory Expenditures | Budgetary Statutory Expenditures | |||||||||||||||||||||||||||
| Operating | Special Purpose Allot- ments |
Capital | Contribu- tions |
Gross Non- Statutory Expendi- tures |
Less: Respen- dable Revenue |
Net Non- Statutory Expendi- tures |
Employee Benefit Plans and Minister Salary and Car Allowance | Revolving Funds (Note 1) | Total Statutory Expendi- tures |
Total Main Estimates | Adjust- |
Net Planned Spending | |||||||||||||||||
| REAL PROPERTY | |||||||||||||||||||||||||||||
| Federal Accomodation and Holdings | - | 1,825.0 | 342.6 | 1.2 | 2,168.8 | 278.4 | 1,890.4 | - | - | - | 1,890.4 | 347.5 | 2,237.9 | ||||||||||||||||
| Real Property Services Revolving Fund | - | - | - | - | - | - | - | - | - | - | - | - | - | ||||||||||||||||
| Real Property Disposition Revolving Fund | - | - | - | - | - | - | - | - | (8.0) | (8.0) | (8.0) | - | (8.0) | ||||||||||||||||
| Real Property Stewardship | 32.0 | - | - | - | 32.0 | 1.4 | 30.6 | 3.5 | - | 3.5 | 34.1 | (0.4) | 33.7 | ||||||||||||||||
| REAL PROPERTY TOTAL | 32.0 | 1,825.0 | 342.6 | 1.2 | 2,200.8 | 279.8 | 1,921.0 | 3.65 | (8.0) | (4.5) | 1,916.5 | 347.1 | 2,263.6 | ||||||||||||||||
| ACQUISITIONS | |||||||||||||||||||||||||||||
| Acquisition Services | 170.2 | - | - | - | 170.2 | 40.9 | 129.3 | 22.9 | - | 22.9 | 152.2 | 2.2 | 154.4 | ||||||||||||||||
| Optional Services Revolving Fund | - | - | - | - | - | - | - | - | - | - | - | - | - | ||||||||||||||||
| Supply Operations Stewardship | 43.2 | - | - | - | 43.2 | 8.6 | 34.6 | 5.1 | - | 5.1 | 39.7 | (0.6) | 39.1 | ||||||||||||||||
| Defence Production Revolving Fund | - | - | - | - | - | - | - | - | - | - | - | - | - | ||||||||||||||||
| ACQUISITIONS TOTAL | 213.4 | - | - | - | 213.4 | 49.5 | 163.9 | 28.0 | - | 28.0 | 191.9 | 1.6 | 193.5 | ||||||||||||||||
| INFORMATION TECHNOLOGY | |||||||||||||||||||||||||||||
| IM/IT Services | 264.9 | - | - | - | 264.9 | 140.1 | 124.8 | 18.7 | - | 18.7 | 143.5 | (0.3) | 143.2 | ||||||||||||||||
| Telecommunications Services Revolving Fund | - | - | - | - | - | - | - | - | - | - | - | - | - | ||||||||||||||||
| IM/IT Stewardship | 12.2 | - | - | - | 12.2 | 0.6 | 11.6 | 1.3 | - | 1.3 | 12.9 | (3.1) | 9.8 | ||||||||||||||||
| INFORMATION TECHNOLOGY TOTAL | 277.1 | - | - | - | 277.1 | 140.7 | 136.4 | 20.0 | - | 20.0 | 156.4 | (3.4) | 153.0 | ||||||||||||||||
| RECEIVER GENERAL AND PUBLIC SERVICE COMPENSATION | |||||||||||||||||||||||||||||
| Receiver General Services | 9.7 | 1.1 | - | - | 10.8 | 2.4 | 8.4 | 0.6 | - | 0.6 | 9.0 | (0.2) | 8.8 | ||||||||||||||||
| Receiver General Stewardship | 57.7 | 85.2 | - | - | 142.9 | 21.3 | 121.6 | 5.7 | - | 5.7 | 127.3 | (0.4) | 126.9 | ||||||||||||||||
| Public Service Compensation | 3.3 | - | - | - | 3.3 | 1.9 | 1.4 | 0.4 | - | 0.4 | 1.8 | (0.1) | 1.7 | ||||||||||||||||
| Public Service Pay Stewardship | 27.6 | - | - | - | 27.6 | 3.6 | 24.0 | 3.9 | - | 3.9 | 27.9 | (0.2) | 27.7 | ||||||||||||||||
| Public Service Pension Stewardship | 56.5 | - | - | - | 56.5 | 44.1 | 12.4 | 7.6 | - | 7.6 | 20.0 | 0.2 | 20.2 | ||||||||||||||||
| RECEIVER GENERAL AND PUBLIC SERVICE COMPENSATION TOTAL | 154.8 | 86.3 | - | - | 241.1 | 73.3 | 167.8 | 18.2 | - | 18.2 | 186.0 | (0.7) | 185.3 | ||||||||||||||||
| GOVERNMENT INFORMATION AND CONSULTING | |||||||||||||||||||||||||||||
| Government Information Services | 39.1 | - | - | 2.4 | 41.5 | 11.3 | 30.2 | 2.6 | - | 2.6 | 32.8 | (0.5) | 32.3 | ||||||||||||||||
| Government Information Stewardship | 17.5 | - | - | - | 17.5 | 0.1 | 17.4 | 1.1 | - | 1.1 | 18.5 | (0.4) | 18.1 | ||||||||||||||||
| GOVERNMENT INFORMATION AND CONSULTING TOTAL | 56.6 | - | - | 2.4 | 59.0 | 11.4 | 47.6 | 3.7 | - | 3.7 | 51.3 | (0.9) | 50.4 | ||||||||||||||||
| OFFICE OF GREEN GOVERNMENT OPERATIONS | |||||||||||||||||||||||||||||
| Office of Green Government Operations Services | - | - | - | - | - | - | - | - | - | - | - | - | - | ||||||||||||||||
| Office of Green Government Operations Stewardship | 1.2 | - | - | - | 1.2 | - | 1.2 | 0.1 | - | 0.1 | 1.3 | - | 1.3 | ||||||||||||||||
| OFFICE OF GREEN GOVERNMENT OPERATIONS TOTAL | 1.2 | - | - | - | 1.2 | - | 1.2 | 0.1 | - | 0.1 | 1.3 | - | 1.3 | ||||||||||||||||
| BUSINESS INTEGRATION | |||||||||||||||||||||||||||||
| Business Integration Services | 20.6 | - | - | - | 20.6 | 12.2 | 8.4 | 1.8 | - | 1.8 | 10.2 | (0.2) | 10.0 | ||||||||||||||||
| Business Integration - Performance Management (Note 2) | 38.5 | 38.5 | 38.5 | - | 5.4 | - | 5.4 | 5.4 | - | 5.4 | |||||||||||||||||||
| BUSINESS INTEGRATION TOTAL | 59.1 | - | - | - | 59.1 | 50.7 | 8.4 | 7.2 | - | 7.2 | 15.6 | (0.2) | 15.4 | ||||||||||||||||
| SPECIAL OPERATING AGENCIES | |||||||||||||||||||||||||||||
| Consulting and Audit Canada Revolving Fund | - | - | - | - | - | - | - | - | (0.5) | (0.5) | (0.5) | - | (0.5) | ||||||||||||||||
| Translation and Interpretation to Parliament, Conference Interpretation, Terminology | 52.3 | - | - | - | 52.3 | - | 52.3 | - | - | - | 52.3 | (0.4) | 51.9 | ||||||||||||||||
| Translation Bureau Revolving Fund | - | - | - | - | - | - | - | - | - | - | - | - | - | ||||||||||||||||
| Translation Stewardship | 2.5 | - | - | - | 2.5 | - | 2.5 | - | - | - | 2.5 | - | 2.5 | ||||||||||||||||
| SPECIAL OPERATING AGENCIES TOTAL | 54.8 | - | - | - | 54.8 | - | 54.8 | - | (0.5) | (0.5)- | 54.3 | (0.4) | 53.9 | ||||||||||||||||
| TOTAL DEPARTMENT | 849.0 | 1,911.3 | 342.6 | 3.6 | 3,106.5 | 605.4 | 2,501.1 | 80.7 | (8.5) | 72.2 | 2,573.3 | 343.1 | 2,916.4 | ||||||||||||||||
| Totals may not add up due to rounding | |||||||||||||||||||||||||||||
|
Note 1: Detailed financial information for the revolving funds is available in the Revolving Fund financial tables 8 to 14. Note 2: Figure reflects the Internal Recoveries that cannot be charged to other program activities. |
|||||||||||||||||||||||||||||
|
|||||||||||||||||||||||||||||
|
Table 3: Voted and Statutory Items listed in Main Estimates |
| (in millions of dollars) |
| Vote or Statutory Item |
Vote or Statutory Wording | Main Estimates 2006-2007 |
Main Estimates 2005-2006 |
|||||
| 1 | Operating expenditures | 2,154.8 | 2,078.4 | |||||
| 5 | Capital expenditures | 342.6 | 327.9 | |||||
| 10 | Grants and contributions | 3.6 | 7.6 | |||||
| (S) | Minister of Public Works and Government Services - Salary and motor car allowance | 0.1 | 0.1 | |||||
| (S) | Contributions to employee benefit plans | 80.6 | 79.1 | |||||
| (S) | Real Property Disposition Revolving Fund | (8.0) | (9.0) | |||||
| (S) | Optional Services Revolving Fund | - | - | |||||
| (S) | Consulting and Audit Canada Revolving Fund | (0.5) | (0.4) | |||||
| (S) | Translation Bureau Revolving Fund | - | - | |||||
| (S) | Payment in lieu of taxes to municipalities and other taxing authorities | - | - | |||||
| (S) | Real Property Services Revolving Fund | - | - | |||||
| (S) | Telecommunications and Informatics Revolving Fund | - | - | |||||
| (S) | Defense Production Revolving Fund | - | - | |||||
| TOTAL DEPARTMENT | 2,573.3 | 2,483.7 | ||||||
| Totals may not add up due to rounding |
||||||||
|
||||||||
|
Table 4: Cost of Services Received Whithout Charge for the Estimates Year 2006-2007 |
| (in millions of dollars) |
| Government Services | ||||
| Cost of Services Received Without Charge: | ||||
| Contributions covering employer share of employees insurance premiums and expenditures paid by TBS (excluding revolving funds) | 31.8 | |||
| Worker's compensation coverage provided by Human Resources and Social Development Canada | 2.4 | |||
| Salary and associated expenditures of legal services provided by the Department of Justice Canada | 3.7 | |||
| 2006-2007 COST OF SERVICES RECEIVED WITHOUT CHARGE | 37.9 | |||
| Totals may not add up due to rounding |
||||
|
||||
|
Table 5: Capital Spending by Program Activity |
| (in millions of dollars) |
| PROGRAM ACTIVITY | Forecast Spending 2005-2006 |
Planned Spending 2006-2007 |
Planned Spending 2007-2008 |
Planned Spending 2008-2009 |
||||
| FEDERAL ACCOMMODATION AND HOLDINGS | 296.1 | 654.8 | 499.9 | 417.2 | ||||
| Totals may not add up due to rounding |
||||||||
|
||||||||
|
Table 7: Sources of Respendable and Non-Respendable Revenue |
| (in millions of dollars) |
| SERVICE | Forecast Revenue 2005-2006 |
Planned Revenue 2006-2007 |
Planned Revenue 2007-2008 |
Planned Revenue 2008-2009 |
||||
| Program Activity | ||||||||
| RESPENDABLE REVENUE | ||||||||
| REAL PROPERTY | ||||||||
| Federal Accommodation and Holdings | ||||||||
| Rentals and Concessions | 452.7 | 278.4 | 277.9 | 277.9 | ||||
| Real Property Stewardship | 1.8 | 1.4 | 1.5 | 1.5 | ||||
| Real Property Services Revolving Fund | ||||||||
| Recoveries of disbursements on behalf of clients | 623.3 | 678.3 | 739.3 | 737.0 | ||||
| Fee revenues from real property related common services | 161.5 | 168.9 | 171.4 | 173.8 | ||||
| 784.8 | 847.2 | 910.7 | 910.8 | |||||
| Real Property Disposition Revolving Fund | ||||||||
| Sales of real properties | 13.0 | 12.0 | 12.0 | 12.0 | ||||
| SERVICE TOTAL | 1,252.3 | 1,139.0 | 1,202.1 | 1,202.2 | ||||
| ACQUISITIONS | ||||||||
| Acquisition Services | ||||||||
| Major Crown Projects | 12.5 | 6.6 | 6.6 | 6.6 | ||||
| Acquisition | 23.2 | 14.9 | 14.9 | 14.9 | ||||
| Canadian General Standards Board | 2.4 | 1.8 | 1.8 | 1.8 | ||||
| Seized Property Management | 10.7 | 8.6 | 8.6 | 8.6 | ||||
| Others | 11.2 | 9.0 | 9.3 | 9.6 | ||||
| 60.0 | 40.9 | 41.2 | 41.5 | |||||
| Supply Operations Stewardship | 5.7 | 8.6 | 8.4 | 8.6 | ||||
| Optional Services Revolving Fund | ||||||||
| Traffic and Vaccine | 94.7 | 90.0 | 90.0 | 90.0 | ||||
| Crown Assets Distribution | - | - | - | - | ||||
| Communication Procurement | 2.9 | 4.1 | 4.1 | 4.1 | ||||
| Locally Shared Support Services | 7.2 | 6.3 | 6.3 | 6.3 | ||||
| 104.8 | 100.4 | 100.4 | 100.4 | |||||
| SERVICE TOTAL | 170.5 | 149.9 | 150.0 | 150.5 | ||||
| INFORMATION TECHNOLOGY | ||||||||
| IM/IT Services | 218.3 | 140.1 | 139.2 | 139.3 | ||||
| IM/IT Stewardship | 3.6 | 0.6 | 0.6 | 0.6 | ||||
| Telecomunications Services Revolving Fund | 137.9 | 135.8 | 144.0 | 144.0 | ||||
| SERVICE TOTAL | 359..8 | 276.2 | 283.8 | 283.9 | ||||
| RECEIVER GENERAL AND PUBLIC SERVICE COMPENSATION | ||||||||
| Receiver General Services | 3.7 | 2.4 | 2.4 | 2.4 | ||||
| Receiver General Stewardship | 16.4 | 21.3 | 21.2 | 21.3 | ||||
| Public Service Compensation | 2.8 | 1.9 | 1.9 | 1.9 | ||||
| Public Service Pay Stewardship | 7.3 | 3.6 | 3.8 | 3.8 | ||||
| Public Service Pension Stewardship | 54.8 | 44.1 | 32.7 | 29.3 | ||||
| SERVICE TOTAL | 85.0 | 73.3 | 62.0 | 58.7 | ||||
| GOVERNMENT INFORMATION AND CONSULTING | ||||||||
| Government Information Services | 14.1 | 11.3 | 11.3 | 11.3 | ||||
| Government Information Stewardship | 1.5 | 0.1 | 0.1 | 0.1 | ||||
| SERVICE TOTAL | 15.6 | 11.4 | 11.4 | 11.4 | ||||
| BUSINESS INTEGRATION SERVICES | ||||||||
| Business Integration Services | 15.9 | 12.2 | 12.5 | 12.5 | ||||
| Business Integration - Performance Management | 37.6 | 38.5 | 38.5 | 38.5 | ||||
| SERVICE TOTAL | 53.5 | 50.7 | 51.0 | 51.0 | ||||
| SPECIAL OPERATING AGENCIES | ||||||||
| Consulting and Audit Canada Revolving Fund | 122.7 | 99.2 | 100.2 | 101.1 | ||||
| Translation Bureau Revolving Fund | ||||||||
| Translation Services | 207.3 | 201.4 | 204.4 | 205.4 | ||||
| Interpretation Services | 3.6 | 3.5 | 3.0 | 3.0 | ||||
| Terminology Services | 0.6 | 1.0 | 1.0 | 1.0 | ||||
| 211.5 | 205.9 | 208.4 | 209.4 | |||||
| SERVICE TOTAL | 334.2 | 305.1 | 308.6 | 310.5 | ||||
| TOTAL RESPENDABLE REVENUE | 2,270.9 | 2,005.9 | 2,068.9 | 2,068.2 | ||||
| NON-RESPENDABLE REVENUE | ||||||||
| Dry Docks | 5.0 | 5.0 | 5.0 | 5.0 | ||||
| Other non-tax revenue | 17.4 | 16.5 | 15.7 | 15.7 | ||||
| TOTAL NON-RESPENDABLE REVENUE | 22.4 | 21.5 | 20.7 | 20.7 | ||||
| TOTAL RESPENDABLE AND NON-RESPENDABLE REVENUE | 2,293.3 | 2,027.4 | 2,089.6 | 2,088.9 | ||||
Totals may not add up due to rounding |
||||||||
|
Table 8.1: Real Property Services Revolving Fund Statement of Operations |
| (in millions of dollars) |
| Forecast Spending 2005-2006 |
Planned Spending 2006-2007 |
Planned Spending 2007-2008 |
Planned Spending 2008-2009 |
|||||
| Respendable Revenue | 161.5 | 168.9 | 171.4 | 173.8 | ||||
| Expenses | ||||||||
| Operating: | ||||||||
| Salaries and Employee Benefits | 100.0 | 106.1 | 107.9 | 109.5 | ||||
| Occupancy Costs | 3.4 | 6.5 | 6.5 | 6.5 | ||||
| Corporate and Administrative Costs | 16.7 | 16.7 | 16.7 | 16.7 | ||||
| Other Operating Costs | 41.4 | 39.6 | 40.3 | 41.1 | ||||
| Expenses Total | 161.5 | 168.9 | 171.4 | 173.8 | ||||
| Surplus (Loss) | - | - | - | - | ||||
This table refers to the Fund's operating surplus and loss, not cash requirements for the fiscal year. The operating surplus or loss that the Fund will realize is calculated through accrual accounting. Therefore, some cash expenditures in the estimates do not affect the operating balance, and other items that must be considered when calculating the surplus or loss do not require a direct cash outlay. The two tables can be reconciled as follows: |
||||||||
Statement of Cash Flows and Projected Use of Authority |
| (in millions of dollars) |
| Forecast Spending 2005-2006 |
Planned Spending 2006-2007 |
Planned Spending 2007-2008 |
Planned Spending 2008-2009 |
|||||
| Operating Activities: | ||||||||
| (Surplus) Loss | - | - | - | - | ||||
| Authority (provided) used during year | - | - | - | - | ||||
| Net authority (provided) used at the start of year | - | - | - | - | ||||
| Net authority (provided) used at the end of year | - | - | - | - | ||||
| Authority Limit | 150.0 | 150.0 | 150.0 | 150.0 | ||||
| Unused authority carried forward | 150.0 | 150.0 | 150.0 | 150.0 | ||||
|
Totals may not add up due to rounding Note: Recoverable disbursements on behalf of clients are not included in respendable revenue and expenses (2005-2006: $623.3M; 2006-2007: $678.3M; 2007-2008: $739.3M and 2008-2009: $737.0M). |
||||||||
|
||||||||
|
Table 8.2: Real Property Disposition Revolving Fund Statement of Operations |
| (in millions of dollars) |
| Forecast Spending 2005-2006 |
Planned Spending 2006-2007 |
Planned Spending 2007-2008 |
Planned Spending 2008-2009 |
|||||
| Respendable Revenue | 13.0 | 12.0 | 12.0 | 12.0 | ||||
| Expenses | 4.0 | 4.0 | 4.0 | 4.0 | ||||
| Surplus (Loss) | 9.0 | 8.0 | 8.0 | 8.0 | ||||
This table refers to the Fund's operating surplus and loss, not cash requirements for the fiscal year. The operating surplus or loss that the Fund will realize is calculated through accrual accounting. Therefore, some cash expenditures in the estimates do not affect the operating balance, and other items that must be considered when calculating the surplus or loss do not require a direct cash outlay. The two tables can be reconciled as follows: |
||||||||
Statement of Cash Flows and Projected Use of Authority |
| (in millions of dollars) |
| Forecast Spending 2005-2006 |
Planned Spending 2006-2007 |
Planned Spending 2007-2008 |
Planned Spending 2008-2009 |
|||||
| Operating Activities: | ||||||||
| (Surplus) Loss | (9.0) | (8.0) | (8.0) | (8.0) | ||||
| Authority (provided) used during year | (9.0) | (8.0) | (8.0) | (8.0) | ||||
| Net authority (provided) used at the start of year | (2.9) | (2.9) | (2.9) | (2.9) | ||||
| Payments to the Consolidated Revenue Fund | 9.0 | 8.0 | 8.0 | 8.0 | ||||
| Net authority (provided) used at the end of year | (2.9) | (2.9) | (2.9) | (2.9) | ||||
| Authority limit | 5.0 | 5.0 | 5.0 | 5.0 | ||||
| Unused authority carried forward | 7.9 | 7.9 | 7.9 | 7.9 | ||||
Totals may not add up due to rounding |
||||||||
|
||||||||
|
Table 8.4: Optional Services Revolving Fund Statement of Operations |
| (in millions of dollars) |
| Forecast Spending 2005-2006 |
Planned Spending 2006-2007 |
Planned Spending 2007-2008 |
Planned Spending 2008-2009 |
|||||
| Respendable Revenue | 104.8 | 100.4 | 100.4 | 100.4 | ||||
| Expenses | ||||||||
| Operating: | ||||||||
| Salaries and Employee Benefits | 1.7 | 3.4 | 3.4 | 3.4 | ||||
| Product Cost | 85.8 | 94.3 | 94.3 | 94.3 | ||||
| Other Operating Costs | 17.3 | 2.7 | 2.7 | 2.7 | ||||
| Expenses Total | 104.8 | 100.4 | 100.4 | 100.4 | ||||
| Surplus (Loss) | - | - | - | - | ||||
This table refers to the Fund's operating surplus and loss, not cash requirements for the fiscal year. The operating surplus or loss that the Fund will realize is calculated through accrual accounting. Therefore, some cash expenditures in the estimates do not affect the operating balance, and other items that must be considered when calculating the surplus or loss do not require a direct cash outlay. The two tables can be reconciled as follows: |
||||||||
Statement of Cash Flows and Projected Use of Authority |
| (in millions of dollars) |
| Forecast Spending 2005-2006 |
Planned Spending 2006-2007 |
Planned Spending 2007-2008 |
Planned Spending 2008-2009 |
|||||
| Operating Activities: | ||||||||
| (Surplus) Loss | - | - | - | - | ||||
| Authority (provided) used during year | - | - | - | - | ||||
| Net authority (provided) used at the start of year | (5.0) | (5.0) | (5.0) | (5.0) | ||||
| Net authority (provided) used at the end of year | (5.0) | (5.0) | (5.0) | (5.0) | ||||
| Authority Limit | 35.0 | 35.0 | 35.0 | 35.0 | ||||
| Unused authority carried forward | 40.0 | 40.0 | 40.0 | 40.0 | ||||
Totals may not add up due to rounding |
||||||||
|
||||||||
|
Table 8.5: Telecommunications and Informatics Common Services Revolving Fund Statement of Operations |
| (in millions of dollars) |
| Forecast Spending 2005-2006 |
Planned Spending 2006-2007 |
Planned Spending 2007-2008 |
Planned Spending 2008-2009 |
|||||
| Respendable Revenue | 137.9 | 135.8 | 144.0 | 144.0 | ||||
| Expenses | ||||||||
| Operating: | ||||||||
| Salaries and Employee Benefits | 20.2 | 17.9 | 18.3 | 18.3 | ||||
| Product Cost | 103.2 | 99.8 | 107.1 | 107.1 | ||||
| Amortization | 0.2 | 0.2 | 0.2 | 0.2 | ||||
| Other Operating Costs | 14.3 | 17.9 | 18.4 | 18.4 | ||||
| Expenses Total | 137.9 | 135.8 | 144.0 | 144.0 | ||||
| Surplus (Loss) | - | - | - | - | ||||
This table refers to the Fund's operating surplus and loss, not cash requirements for the fiscal year. The operating surplus or loss that the Fund will realize is calculated through accrual accounting. Therefore, some cash expenditures in the estimates do not affect the operating balance, and other items that must be considered when calculating the surplus or loss do not require a direct cash outlay. The two tables can be reconciled as follows: |
||||||||
Statement of Cash Flows and Projected Use of Authority |
| (in millions of dollars) |
| Forecast Spending 2005-2006 |
Planned Spending 2006-2007 |
Planned Spending 2007-2008 |
Planned Spending 2008-2009 |
|||||
| Operating Activities: | ||||||||
| (Surplus) Loss | - | - | - | - | ||||
| Less items not requiring use of funds: | ||||||||
| Amortization | 0.2 | 0.2 | 0.2 | 0.2 | ||||
| Net financial resources (provided by) used in operating activities | (0.2) | (0.2) | (0.2) | (0.2) | ||||
| Investing Activities: | ||||||||
| Capital assets: | ||||||||
| Net Acquisitions | 0.2 | 0.2 | 0.2 | 0.2 | ||||
| Net financial resources (provided by) used in investing activities | 0.2 | 0.2 | 0.2 | 0.2 | ||||
| Financing Activities: | ||||||||
| Transfer of accumulated surplus to the Vote for ITSB transformation (Note 1) | 7.0 | - | - | - | ||||
| Net financial resources (provided by) used in financing activities | 7.0 | - | - | - | ||||
| Authority (provided) used during year | 7.0 | - | - | - | ||||
| Net authority (provided) used at the start of year | (25.7) | (18.7) | (18.7) | (18.7) | ||||
| Net authority (provided) used at the end of year | (18.7) | (18.7) | (18.7) | (18.7) | ||||
| Authority Limit | 20.0 | 20.0 | 20.0 | 20.0 | ||||
| Unused authority carried forward | 38.7 | 38.7 | 38.7 | 38.7 | ||||
|
Totals may not add up due to rounding Note 1: As per TB decision number 831746, investment from Telecommunications and Informatics Common Services Revolving Fund in order to progress certain activities in support of the transformation of the Information Technology Services Branch. |
||||||||
|
||||||||
|
Table 8.6: Consulting and Audit Canada Revolving Fund Statement of Operations |
| (in millions of dollars) |
| Forecast Spending 2005-2006 |
Planned Spending 2006-2007 |
Planned Spending 2007-2008 |
Planned Spending 2008-2009 |
|||||
| Respendable Revenue | 122.7 | 99.2 | 100.2 | 101.1 | ||||
| Expenses | ||||||||
| Operating: | ||||||||
| Salaries and Employee Benefits | 38.7 | 37.9 | 38.7 | 39.5 | ||||
| Product Cost | 73.0 | 50.2 | 50.2 | 50.2 | ||||
| Amortization | 0.5 | 0.3 | 0.3 | 0.2 | ||||
| Other Operating Costs | 10.2 | 10.7 | 10.9 | 11.1 | ||||
| Interest | 0.1 | 0.1 | 0.1 | 0.1 | ||||
| Expenses Total | 122.5 | 99.2 | 100.2 | 101.1 | ||||
| Surplus (Loss) | 0.2 | - | - | - | ||||
This table refers to the Fund's operating surplus and loss, not cash requirements for the fiscal year. The operating surplus or loss that the Fund will realize is calculated through accrual accounting. Therefore, some cash expenditures in the estimates do not affect the operating balance, and other items that must be considered when calculating the surplus or loss do not require a direct cash outlay. The two tables can be reconciled as follows: |
||||||||
Statement of Cash Flows and Projected Use of Authority |
| (in millions of dollars) |
| Forecast Spending 2005-2006 |
Planned Spending 2006-2007 |
Planned Spending 2007-2008 |
Planned Spending 2008-2009 |
|||||
| Operating Activities: | ||||||||
| (Surplus) Loss | (0.2) | - | - | - | ||||
| Less items not requiring use of funds: | ||||||||
| Amortization | 0.5 | 0.3 | 0.3 | 0.2 | ||||
| Provision for employee termination benefits | 0.8 | 0.5 | 0.5 | 0.5 | ||||
| Net financial resources (provided by) used in operating activities | (1.5) | (0.8) | (0.8) | (0.7) | ||||
| Investing Activities: | ||||||||
| Capital assets: | ||||||||
| Net Acquisitions | 1.1 | 0.3 | 0.3 | 0.2 | ||||
| Net financial resources (provided by) used in investing activities | 1.1 | 0.3 | 0.3 | 0.2 | ||||
| Authority (provided) used during year | (0.4) | (0.5) | (0.5) | (0.5) | ||||
| Net authority (provided) used at the start of year | (9.2) | (9.6) | (10.1) | (10.6) | ||||
| Net authority (provided) used at the end of year | (9.6) | (10.1) | (10.6) | (11.1) | ||||
| Authority Limit | 20.0 | 20.0 | 20.0 | 20.0 | ||||
| Unused authority carried forward | 29.6 | 30.1 | 30.6 | 31.1 | ||||
Totals may not add up due to rounding |
||||||||
|
||||||||
|
Table 8.7: Translation Bureau Revolving Fund Statement of Operations |
| (in millions of dollars) |
| Forecast Spending 2005-2006 |
Planned Spending 2006-2007 |
Planned Spending 2007-2008 |
Planned Spending 2008-2009 |
|||||
| Respendable Revenue | 211.5 | 205.9 | 208.4 | 209.4 | ||||
| Expenses | ||||||||
| Operating: | ||||||||
| Salaries and Employee Benefits | 150.0 | 136.8 | 138.0 | 139.0 | ||||
| Amortization | 2.2 | 3.0 | 2.3 | 2.5 | ||||
| Other Operating Costs | 61.2 | 69.8 | 71.0 | 71.0 | ||||
| Expenses Total | 213.4 | 209.6 | 211.3 | 212.5 | ||||
| Surplus (Loss) | (1.9) | (3.7) | (2.9) | (3.1) | ||||
This table refers to the Fund's operating surplus and loss, not cash requirements for the fiscal year. The operating surplus or loss that the Fund will realize is calculated through accrual accounting. Therefore, some cash expenditures in the estimates do not affect the operating balance, and other items that must be considered when calculating the surplus or loss do not require a direct cash outlay. The two tables can be reconciled as follows: |
||||||||
Statement of Cash Flows and Projected Use of Authority |
| (in millions of dollars) |
| Forecast Spending 2005-2006 |
Planned Spending 2006-2007 |
Planned Spending 2007-2008 |
Planned Spending 2008-2009 |
|||||
| Operating Activities: | ||||||||
| (Surplus) Loss | 1.9 | 3.7 | 2.9 | 3.1 | ||||
| Less items not requiring use of funds: | ||||||||
| Amortization | 2.2 | 3.0 | 2.3 | 2.5 | ||||
| Net of provision and payments for employee termination benefits | 2.2 | 2.1 | 2.1 | 2.1 | ||||
| Subtotal | (2.5) | (1.4) | (1.5) | (1.5) | ||||
| Other items not requiring use of funds | 0.5 | 0.4 | 0.5 | 0.5 | ||||
| Net financial resources (provided by) used in operating activities | (2.0) | (1.0) | (1.0) | (1.0) | ||||
| Investing Activities: | ||||||||
| Capital assets | ||||||||
| Net Acquisitions | 2.0 | 1.0 | 1.0 | 1.0 | ||||
| Net financial resources (provided by) used in investing activities | 2.0 | 1.0 | 1.0 | 1.0 | ||||
| Authority (provided) used during year | - | - | - | - | ||||
| Net authority (provided) used at the start of year | (26.0) | (26.0) | (26.0) | (26.0) | ||||
| Net authority (provided) used at the end of year | (26.0) | (26.0) | (26.0) | (26.0) | ||||
| Authority Limit | 10.0 | 10.0 | 10.0 | 10.0 | ||||
| Unused authority carried forward | 36.0 | 36.0 | 36.0 | 36.0 | ||||
Totals may not add up due to rounding |
||||||||
|
||||||||
|
Table 9: User Fees |
|
|
| (in millions of dollars) |
| Description | Current Estimated Total Cost |
Forecast Spending to March 31, 2006 |
Planned Spending 2006-2007 |
Planned Spending 2007-2008 |
Planned Spending 2008-2009 |
Future Years' Spending Require-ments |
||||
| REAL PROPERTY SERVICES |
||||||||||
| Office Accommodations Projects | ||||||||||
| Nova Scotia | ||||||||||
| Halifax - New Government of Canada Building, Bedford Institute of Oceanography - Construction (I-PPA) | 80.3 | 2.3 | 0.5 | 12.7 | 56.6 | 8.2 | ||||
| Halifax - New Royal Canadian Mounted Police Government of Canada Building - Construction (I-PPA) 2 | 57.6 | 6.6 | 2.7 | 14.1 | 18.4 | 15.9 | ||||
| Prince Edward Island | ||||||||||
| Charlottetown-Proposed Government of Canada Building-Construction (S-EPA) | 49.8 | 23.4 | 20.5 | 5.9 | 0.0 | 0.0 | ||||
| Quebec | ||||||||||
| Montreal - 740 Bel-Air Street - Construction of multi-purpose building including items funded by National Defence (S-EPA) | 54.5 | 52.4 | 2.1 | 0.0 | 0.0 | 0.0 | ||||
| National Capital Region (Quebec) | ||||||||||
| Gatineau - Laurier Taché Garage - Renovation (S-EPA) | 61.5 | 46.3 | 12.9 | 2.3 | 0.0 | 0.0 | ||||
| National Capital Region (Ontario) | ||||||||||
| Ottawa - Federal Judicial Building - New Construction (I-PPA-MCP) 1 | 157.7 | 16.9 | 0.2 | 37.7 | 42.8 | 60.1 | ||||
| Ottawa - Skyline Campus - Renovation and Federal Occupancy (S-EPA-MCP) | 114.3 | 13.3 | 20.0 | 64.0 | 17.0 | 0.0 | ||||
| Ottawa - Central Heating and Cooling Plant - East Tunnel Replacement (I-PPA) | 31.2 | 0.5 | 0.5 | 2.7 | 10.0 | 17.5 | ||||
| Parliamentary Precinct 7 | ||||||||||
| Ottawa & Gat, Que - Library of Parliament (LOP) - Conservation, Rehabilitation and Upgrade (S-EPA-MCP) | 127.9 | 115.5 | 12.4 | 0.0 | 0.0 | 0.0 | ||||
| Ottawa - West Block - Renovation (I-PPA-MCP) | 769.2 | 28.2 | 35.0 | 168.2 | 179.3 | 358.5 | ||||
| Ottawa - Site Infrastructure - New Construction (I-PPA-MCP) | 82.5 | 1.4 | 0.0 | 0.0 | 0.0 | 81.1 | ||||
| Ottawa - Wellington Building - Renovation (I-PPA-MCP) | 150.1 | 1.8 | 0.5 | 21.5 | 34.2 | 92.1 | ||||
| Ottawa - Bank Street - New Construction (I- PPA-MCP) (DEFERRED) | 197.9 | 9.4 | 0.0 | 0.0 | 0.0 | 188.5 | ||||
| Saskatchewan | ||||||||||
| Regina - Government of Canada Building – Acquisition, renovation, and fit-up (S-EPA) | 47.8 | 32.8 | 13.4 | 1.6 | 0.0 | 0.0 | ||||
| British Columbia | ||||||||||
| Surrey - Royal Canadian Mounted Police "E" Division Headquarters, Purchase Land and Crown Construct (I-PPA-MCP) 6 | 204.0 | 9.6 | 0.7 | 18.6 | 88.4 | 86.7 | ||||
| Non-Office Accommodation Projects | ||||||||||
| Ottawa - Cellulose Nitrate Film Storage Facility, National Library of Canada and National Archives of Canada - New Construction (I-PPA) 3 | 8.4 | 1.1 | 0.0 | 2.9 | 4.4 | 0.0 | ||||
| Ottawa - Portrait Gallery of Canada - Renovation (S-EPA-MCP) | 32.3 | 5.4 | 13.2 | 13.7 | 0.0 | 0.0 | ||||
| Lease Accommodation Projects | ||||||||||
| National Capital Region (Ontario) | ||||||||||
| 269 Laurier Avenue West, Ottawa, new lease (LPA) 5 | 105.6 | 22.5 | 27.9 | 5.6 | 5.3 | 44.3 | ||||
| 131 Queen St. Ottawa, new lease (LPA) | 166.3 | 4.8 | 32.4 | 55.3 | 12.8 | 61.0 | ||||
| 181 Queen St. Ottawa, new lease (LPA) | 59.9 | 29.7 | 6.7 | 5.9 | 5.9 | 11.7 | ||||
| Ontario | ||||||||||
| 180 Queen Street West, Toronto, new lease (LPA) | 239.0 | 11.6 | 17.8 | 8.6 | 8.6 | 192.4 | ||||
| 277 Front Street East, Toronto, Lease (S-LPA) | 75.5 | 0.3 | 0.7 | 8.9 | 8.9 | 56.7 | ||||
| Engineering Assets Projects | ||||||||||
| Newfoundland and Labrador | ||||||||||
| Argentia - Environmental remediation (S-EPA) | 92.5 | 78.5 | 7.0 | 7.0 | 0.0 | 0.0 | ||||
| Quebec | ||||||||||
| Québec - 55 Wharves - Demolition (S-EPA) | 19.9 | 19.8 | 0.1 | 0.0 | 0.0 | 0.0 | ||||
| National Capital Region (Quebec) | ||||||||||
| Laniel - Laniel Dam Reconstruction (S-EPA) | 22.0 | 4.2 | 12.6 | 5.2 | 0.0 | 0.0 | ||||
| National Capital Region (Ontario) | ||||||||||
| Between Ott. & Gat - Alexandra Bridge - Renovation/Deck Replacement (I-PPA) 4 | 18.6 | 1.2 | 0.6 | 8.4 | 8.4 | 0.0 | ||||
| INFORMATION TECHNOLOGY | ||||||||||
| Projects | ||||||||||
| National Capital Region (Ontario/Quebec) | ||||||||||
| Ottawa/Gatineau - Shared Travel Services Initiative | 96.2 | 20.5 | 4.2 | (0.6) | (0.6) | N/A | ||||
| PUBLIC SERVICE COMPENSATION | ||||||||||
| Pension Modernization Project | 115.5 | 9.5 | 32.8 | 21.8 | 9.2 | 42.2 | ||||
|
* For this Report on Plans and Priorities Forecast Spending = Actual Spending to March 31, 2006
|
||||||||||
|
||||||||||
Table
11: Status Report on Major Crown Projects |
||
| a. Parliamentary Precinct Project | ||
The Long-Term Vision and Plan (LTVP) for the Parliamentary Precinct, approved in 2001, and amended in 2002, is a detailed framework that provides direction for the renewal of Canada's seat of government - the Parliamentary Precinct. During the LTVP's 25-year implementation period, an extensive preservation program will restore the appearance of the buildings, while bringing them up to modern standards by renovating their electrical, mechanical and safety systems and providing more functional offices and committee rooms in existing buildings. New construction will also be undertaken in the Precinct to meet the space requirements of the Senate, the House of Commons and the Library of Parliament, which cannot be met within existing facilities. The original Plan consisted of a series of major projects implemented in five phases. Phase I projects (2001-2002 to 2008-2009) included: Library of Parliament; Bank Street Building; Wellington Building Renovation; Site Infrastructure; Victoria Building; East Block masonry; Federal Judicial Building parking; and Site Development. The West Block Renovation Program was originally scheduled within Phase II of the LTVP, following the completion of the Bank Street Building project. In May 2005, PWGSC received agreement from Cabinet to advance the West Block Renovation to Phase I of the LTVP. As a result the Bank Street Building and Site Infrastructure projects were suspended pending a review of the overall LTVP. The renovation of the Library of Parliament was completed in 2006-07. Further information on this subject may be found on the website located at:
http://www.collineduparlement-parliamenthill.gc.ca/modern/index-eng.html |
||
| b. Shared Travel Services Initiative | ||
The Shared Travel Services Initiative (STSI) project is a multi-million dollar initiative ($ 96.2 million). The solution will provide fully functional, comprehensive, and seamlessly integrated "employee-friendly" travel services to government employees, and provide for better travel expense management. Travel services include the following:
Further information on this subject may be found on the website located at:
http://www.tpsgc-pwgsc.gc.ca/rapports-reports/rpp/2007-2008/section-3a-eng.html |
||
| c. Pension Modernization Project | ||
The Government of Canada Pension Modernization Project (GoCPMP) is the renewal of PWGSC's pension administration systems and business processes to enable PWGSC to replace thirty-five year-old technology and to use industry best practices to deliver pension administration services to public service employees, employers and pensioners. It is expected that the GoCPMP will be able to procure a system solution that has the flexibility and functionality to simultaneously meet the unique requirements of administering the Public Service Superannuation Act as well as providing the capability of administering multiple other pension plans. It will also provide information management and access tools that allow expert pension advisors to administer pensions effectively and provide timely, accurate and consistent responses to plan members, employers and administrators. The solution will provide sustainable systems capable of efficient adoption of future technologies and best pension administration practices. The current cost estimate is $115.5 million ($19.5 million for the Definition Phase) and project completion is planned for early 2012. Further information on this subject may be found on the website located at:
http://www.tpsgc-pwgsc.gc.ca/remuneration-compensation/pmssp-gcpmp/pmssp-gcpmp-navigation-eng.html |
||
| TRANSFER PAYMENTS | Forecast Spending 2007-2008 |
Planned Spending 2006-2007 |
Planned Spending 2007-2008 |
Planned Spending 2008-2009 |
||||
| Contributors | ||||||||
| Canadian Standards Association | 0.012 | 0.012 | 0.012 | 0.012 | ||||
| Contributions to Argentia Management Authority | 4.00 | 1.17 | ||||||
| Divestiture of the Harbourfront Park in Trois-Rivieres | 5.07 | |||||||
| Contributions in support of activities and projects to increase the understanding and appreciation of Canadian identity and to develop social awareness | 1.45 | 1.45 | 1.45 | |||||
| Total Contributors | 9.08 | 2.63 | 1.46 | 1.46 | ||||
| Other Payments (Statutory) | ||||||||
| Payments to Municipalities and Other Taxing Authorities | 471.84 | 496.53 | 506.47 | 516.59 | ||||
| Recoveries from Custodian Departments | (471.84) | (496.53) | (506.47) | (516.59) | ||||
| Grants in support of activities and projects to increase the understanding and appreciation of Canadian identity and to develop social awareness | 1.00 | 1.00 | 1.00 | 1.00 | ||||
| Total Other Payments | 1.00 | 1.00 | 1.00 | 1.00 | ||||
| Total Tranfer Payments | 10.08 | 3.63 | 2.46 | 2.46 | ||||
Totals may not add up due to rounding |
||||||||
|
||||||||
Table 13: Alternative Service Delivery |
||||||||
|
||||||||
| Name of ASD Initiative | Current Status | Projected Implementation Date | Contact | |||||
| New ASD Contract for Property Management and Project delivery services including Optional services on a national scale for an inventory of about 2.9 million sq.m. | Eight (8) separate contracts, valued at about $5.4 Billion, awarded to SNC Lavalin- ProFac (SNCLPF) for a term of 4 years with three renewal options for 2 years each. | Contract commencement
|
Regis Gagne Director, Implementation Service Transformation Office 613 736 3158 regis.gagne@pwgsc.gc.ca |
|||||
| Exercise of Optional services (Lease administration, Facility Management, Commercial leasing, Project delivery ($200K to $1,000K). | Addition to existing SNCLPF contracts:
|
TB approval of Business Case
|
Regis Gagne Director, Implementation Service Transformation Office 613 736 3158 regis.gagne@pwgsc.gc.ca |
|||||
| ASD Contract for Property Management and Project delivery services including Optional services on a national scale for the remaining inventory (about 3 to 4 million sq.m). | Activity delayed. | Expected Contract commencement 2007-08. | Regis Gagne Director, Implementation Service Transformation Office 613 736 3158 regis.gagne@pwgsc.gc.ca |
|||||
Table 14: Horizontal Initiatives |
||
| a. Government of Canada Marketplace | ||
The Government of Canada Marketplace (GoCM) is a project of the Electronic Supply Chain (ESC) Program. This end-to-end purchasing service will allow participating departments and agencies to buy a wide variety of goods and services on-line. It also will capture and make available the purchasing information of the Government of Canada (GoC). The GoCM Service is a key enabler of the GoC's Procurement Reform transformation. It supports this initiative through automated and simplified purchasing processes, provision of timely and comprehensive purchasing information, and promotion of standardized purchasing information across the GoC, while maintaining the highest levels of transparency and accountability. Further information on this subject may be found on the website located at:
http://gocm.gc.ca/gocm/text/index-e.html |
||
| b. Sydney Tar Ponds and Coke Ovens Clean-up Project | ||
The Sydney Tar Ponds and Coke Ovens Clean-up Project is a joint federal-provincial initiative for the remediation of approximately 100 hectares of contaminated site resulting from a century of steel manufacturing in Cape Breton. The project is in support of the federal government's sustainable development initiative, recognizing the environmental, social and economic dimensions of the Sydney area. The project outcomes will result in environmental, economic, and social benefits for Nova Scotians, First Nations Communities and all Canadians. Downtown Sydney will have new land to be developed, which will aid in rejuvenation of the economically depressed area. A Memorandum of Agreement describing the management of the project between the Province of Nova Scotia and the federal government was signed in May 2004. A Project Management Committee (PMC), which includes senior representatives from both the federal and provincial governments, was established to oversee all aspects of the project. The total project cost is estimated at $400 million (Federal: $280 million, Nova Scotia: $120 million). The project is being delivered through the Sydney Tar Pond Agency (STPA). Further information on this subject may be found on the website located at: http://www.pwgsc.gc.ca/reports/text/rpp_2006-2007_sct3_tbl14_b-e.html |
||
|
Table 15: Sustainable Development Strategy |
||||
What are the key goals, objectives, and/or long term targets of the SDS?
|
The PWGSC Sustainable Development Strategy (SDS) 2003 was tabled in Parliament in February 2004. SDS 2003 contained departmental commitments relating to four goals:
|
|||
How do your key goals, objectives and/or long-term targets help achieve your department's strategic outcomes?
|
As in the previous SD strategies, SDS 2003 focused on environmental issues. However, reflecting PWGSC's emphasis on service delivery to colleague departments and agencies, the 2003 strategy considered social and economic factors, as well. Through these SD strategies, PWGSC aims to promote sustainable development and sustainable operations in the federal government over the next 10 to 15 years. | |||
What were your targets for the reporting period? What is your progress to date?
|
Progress toward the PWGSC SDS 2003 targets over fiscal year 2004-05 was steady. Where targets are identified as being at risk, recovery plans will be identified and implemented. Details on performance in relation to SDS 2003 commitments can be found in the PWGSC Sustainable Development Performance Report. This report is available on the Internet at http://www.tpsgc-pwgsc.gc.ca/dd-sd/rendement-performance/index-eng.html. | |||
What adjustments have you made, if any? (To better set the context for this information, discuss how lessons learned have influenced your adjustments.)
|
As implementation of SD is a priority for PWGSC, SDS 2003 and the drafting of the next SDS will play a role in the plans and priorities of the department in 2006-07. To achieve SDS objectives, the Office of Greening Government Operations (OGGO) on behalf of PWGSC, will monitor performance as well as provide environmental expertise, services and support to Branches responsible for implementing the various targets. OGGO will also lead PWGSC in the planning and development of PWGSC’s Sustainable Strategy 2007-09. The department will take into account the Commissioner of the Environment and Sustainable Development (CESD) recommendations to use a government-wide approach (common priorities) on Greening government operations, which is led by PWGSC and which will be disseminated for guidance in February 2006. Furthermore, PWGSC will produce clear and measurable targets to allow transparent management of reporting of the SDS, and contributions to the Way Forward initiative. |
|||
Table 16: Internal Audits and Evaluations |
||||||
| Mandated Internal Audits | Estimated Start Date |
Estimated Completion Date |
||||
| Audit of the Financial Statements for the Translation Bureau Revolving Fund for Fiscal Year Ended March 31, 2006 | January 2006 | September 2006 | ||||
| Audit of the Financial Statements for the Real Property Disposition Revolving Fund for Fiscal Year Ended March 31, 2006 | January 2006 | September 2006 | ||||
| Audit of the Financial Statements for the Consulting & Audit Canada Revolving Fund for Fiscal Year Ended March 31, 2006 | January 2006 | September 2006 | ||||
| Audit of the Financial Statements for the Telecommunications and Informatics Common Services Revolving Fund for Fiscal Year Ended March 31, 2006 | January 2006 | September 2006 | ||||
| Audit of the Financial Statements for the Optional Services Revolving Fund for the Fiscal Year Ended March 31, 2006 | January 2006 | September 2006 | ||||
| Audit of the Financial Statements for the Real Property Services Revolving Fund for the Fiscal Year Ended March 31, 2006 | January 2006 | September 2006 | ||||
| Audit of the Financial Report of the Administrative Costs Chargeable to the Canada Pension Plan Account for the Year Ended March 31, 2006 | April 2006 | December 2006 | ||||
| Follow-up of Internal Audit Recommendations | April 2006 | March 2007 | ||||
| Follow-up of Auditor General Recommendations | April 2006 | March 2007 | ||||
| Mandatory Evaluations | Estimated Start Date |
Estimated Completion Date |
||||
| Evaluation Framework for the Interim Cost-Share Agreement for Sydney Tar Ponds and Coke Ovens Remediation Project | April 2006 | September 2006 | ||||
| Evaluation of the Interim Cost-Share Agreement for Sydney Tar Ponds and Coke Ovens Remediation Project | July 2006 | December 2006 | ||||
| Interim Evaluation of the New Alternative Form of Delivery for Real Property Services - Phase 2 | July 2006 | December 2006 | ||||
|
||||||