
Treasury Board of Canada Secretariat
www.tbs-sct.gc.ca
Common menu bar links
Breadcrumb Trail
ARCHIVED - RPP 2006-2007
The Canadian Space Agency
 This page has been archived.
Archived Content
Information identified as archived on the Web is for reference, research or recordkeeping purposes. It has not been altered or updated after the date of archiving. Web pages that are archived on the Web are not subject to the Government of Canada Web Standards. As per the Communications Policy of the Government of Canada, you can request alternate formats on the "Contact Us" page.
SECTION 3: SUPPLEMENTARY INFORMATION
3.1 ORGANIZATIONAL INFORMATION
Reporting to the Minister of Industry, the CSA Chief Executive Officer is the President, assisted by the Senior Vice-President and the Vice-President of Science, Technology and Programs. The Policy, Planning and Relations Branch, the Communications Directorate, the Canadian Astronaut Office, and the Space Operations Branch report directly to the President. Three of the core branches report to the Vice-President of Science, Technology and Programs. The five Corporate Services report directly to the Senior Vice-President. Legal Services are provided by the Department of Justice. The organizational chart below became effective as of April 1, 2005.
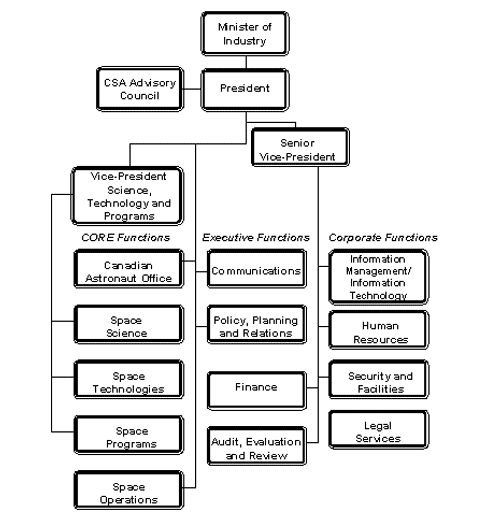
![]()
3.2 FINANCIAL TABLES
1. Departmental Planned Spending and Full-Time Equivalents
| ($ in millions) | Forecast Spending 2005-2006 |
Planned Spending 2006-2007 |
Planned Spending 2007-2008 |
Planned Spending 2008-2009 |
| Space Based Earth Observation | 144.5 | 136.8 | 115.7 | 133.0 |
| Space Science and Exploration | 156.9 | 146.5 | 127.1 | 108.8 |
| Satellite Communications | 34.0 | 35.5 | 32.0 | 33.9 |
| Space Awareness and Learning | 6.2 | 6.5 | 6.7 | 8.2 |
| Generic Space Activities | - | 48.7 | 49.5 | 53.2 |
| Budgetary Main Estimates (gross)1 | 341.6 | 374.1 | 331.1 | 337.1 |
| Non-Budgetary Main Estimates (gross) | 0 | 0 | 0 | 0 |
| Less: Respendable Revenue | 0 | 0 | 0 | 0 |
| Total Main Estimates | 341.6 | 374.1 | 331.1 | 337.1 |
| Adjustments2 : | ||||
| Governor General Warrants | ||||
| Royalties from activities related to the RADARSAT program | 1.7 | |||
| Capital carry-forward (2004-2005 to 2005-2006) | 1.8 | |||
| Collective agreements compensation | 1.9 | |||
| Expenditures review procurement savings | (0.6) | |||
| Additional operating costs | 1.0 | |||
| Supplementary Estimates | ||||
| Royalties from activities related to the RADARSAT program | 4.1 | 4.1 | 4.1 | |
| Expenditures review procurement savings | (3.2) | |||
| Capital carry-forward (2005-2006 to 2006-2007) | (1.6) | 1.6 | ||
| ARLU | ||||
| Reprofiling of funds | (54.5) | |||
| Total Adjustments | (50.3) | 2.6 | 4.1 | 4.1 |
| Total Planned Spending | 291.33 | 376.7 | 335.2 | 341.2 |
| Total Planned Spending | 291.3 | 376.8 | 335.3 | 341.2 |
| Less: Non-Respendable Revenue | 4.3 | 4.9 | 4.9 | 4.9 |
| Plus: Cost of Services Received without Charge | 4.6 | 5.0 | 5.1 | 5.2 |
| Net Cost of Program | 291.5 | 376.8 | 335.4 | 341.5 |
| Full-Time Equivalents | 607 | 690 | 687 | 687 |
Note: Due to rounding, decimals may not add up to totals shown.
1 The Program Activities shown in this table include amounts for Corporate Services and Infrastructure.
2 Adjustments are to accommodate approvals obtained since the Main Estimates and include Budget Initiatives,
Supplementary Estimates, etc.
3 Reflects the best forecast of Total Net Planned Spending to the end of the fiscal year.
2. Resources by Program Activities
|
2006-2007 |
|||||||
|
Program Activity |
Budgetary |
Total Main Estimates |
Adjustments (planned |
Total Planned Spending |
|||
|
Operating |
Capital |
Grants |
Contributions |
||||
|
Space Based Earth Observation (EO) |
56.6 |
67.6 |
0.2 |
12.4 |
136.8 |
1.1 |
137.9 |
|
Space Science and Exploration (SE) |
94.9 |
43.9 |
0.6 |
7.1 |
146.5 |
1.5 |
148.1 |
|
Satellite Communications (SC) |
9.1 |
0.1 |
0.0 |
26.3 |
35.5 |
0.0 |
35.5 |
|
Space Awareness and Learning (AL) |
5.8 |
0.0 |
0.5 |
0.2 |
6.5 |
0.0 |
6.5 |
|
Generic Space Activities in support of EO, SE, and SC (GSA) |
38.6 |
3.1 |
0.1 |
7.0 |
48.7 |
0.0 |
48.7 |
|
Total |
205.0 |
114.7 |
1.4 |
52.9 |
374.1 |
2.6 |
376.7 |
Note: Due to rounding, decimals may not add up to totals shown.
The Program Activities shown in this table include amounts for Corporate Services and Infrastructure.
3. Voted and Statutory Items
|
2006-2007 |
|||
|
Vote or Statutory Item |
Truncated Vote |
2006-2007 Main Estimates |
2005-2006 Main Estimates |
|
25 |
Operating expenditures |
194.4 |
173.4 |
|
30 |
Capital expenditures |
114.7 |
105.4 |
|
35 |
Grants and contributions |
54.3 |
53.3 |
|
(S) |
Contributions to employee benefit plans |
10.7 |
9.5 |
|
|
Total pour l'Agence |
374.1 |
341.6 |
4. Services Received without Charge
|
($ in millions) |
2006-2007 |
|
Accommodation provided by Public Works and Government Services Canada (PWGSC) |
0.2 |
|
Contributions covering employers' share of employees' insurance premiums and expenditures paid by TBS |
4.5 |
|
Salary and associated expenditures of legal services provided by the department of Justice Canada |
0.4 |
|
Total 2006-2007 Services Received without Charge |
5.0 |
5. Summary of Capital Spending by Program Activity
|
($ in millions) |
Forecast Spending 2005-2006 |
Planned Spending 2006-2007 |
Planned Spending 2007-2008 |
Planned Spending 2008-2009 |
|
Space Based Earth Observation (EO) |
23.3 |
67.6 |
58.5 |
80.4 |
|
Space Science and Exploration (SE) |
31.1 |
45.5 |
28.3 |
10.4 |
|
Satellite Communications (SC) |
0.8 |
0.1 |
0.1 |
0.0 |
|
Space Awareness and Learning (AL) |
0.0 |
0.0 |
0.0 |
0.0 |
|
Generic Space Activities in support of EO, SE, and SC (GSA) |
0.0 |
3.1 |
1.8 |
3.4 |
|
Total |
55.3 |
116.4* |
88.7 |
94.3 |
Note: Due to rounding, decimals may not add up to totals shown.
The Program Activities shown in this table include amounts for Corporate Services and Infrastructure.
* The $116.4 million includes $114.7 million requested in Main Estimates 2006-2007, plus Capital carry-forward request to be
sought through supplementary Estimates. (See Table 1)
6. Sources of Respendable and Non-Respendable Revenue
|
Respendable Revenue |
||||
|
($ in millions) |
Forecast Revenue 2005-2006 |
Planned Revenue 2006-2007 |
Planned Revenue 2007-2008 |
Planned Revenue 2008-2009 |
|
Respendable Revenue |
0.0 |
0.0 |
0.0 |
0.0 |
|
Total Respendable Revenue |
0.0 |
0.0 |
0.0 |
0.0 |
|
Non-Respendable Revenue |
||||
|
($ in millions) |
Forecast Revenue 2005-2006 |
Planned Revenue 2006-2007 |
Planned Revenue 2007-2008 |
Planned Revenue 2008-2009 |
|
Space Based Earth Observation |
|
|
|
|
|
Royalties from activities related to the RADARSAT program |
3.2 |
4.1 |
4.1 |
4.1 |
|
|
|
|
|
|
|
Generic Space Activities in support of EO, SE, and SC (GSA) |
|
|
|
|
|
Testing facilities and services of the David Florida Laboratory |
1.1 |
0.7 |
0.7 |
0.7 |
|
|
|
|
|
|
|
Satellite Communications |
|
|
|
|
|
Revenue of royalties from intellectual property |
0.0 |
0.1 |
0.1 |
0.1 |
|
|
|
|
|
|
|
Total Non-Respendable Revenue |
4.3 |
4.9 |
4.9 |
4.9 |
|
|
|
|
|
|
|
Total Respendable and Non-Respendable Revenue |
4.3 |
4.9 |
4.9 |
4.9 |
Note: Due to rounding, decimals may not add up to totals shown.
7. Resource Requirements by Sector
|
2006-2007 |
||||||
|
($ in millions) |
Space Based Earth Observation |
Space Science and Exploration |
Satellite Communi-cations |
Space Awareness and Learning |
Generic Space Activities in support of EO, SE, and SC |
Total Planned Spending |
|
Space Programs |
66.0 |
43.2 |
20.3 |
0.0 |
0.0 |
129.6 |
|
Space Technologies |
33.3 |
6.3 |
11.9 |
0.3 |
37.6 |
89.2 |
|
Space Sciences |
33.3 |
6.3 |
11.9 |
0.3 |
37.6 |
89.2 |
|
Space Sciences |
5.1 |
27.2 |
0.0 |
0.1 |
0.0 |
32.4 |
|
Canadian Astronauts Office |
0.0 |
5.1 |
0.0 |
0.3 |
0.0 |
5.3 |
|
Space Operations |
19.4 |
52.4 |
0.3 |
0.1 |
7.1 |
79.3 |
|
Corporate Services Sectors |
13.0 |
12.4 |
3.0 |
5.9 |
4.0 |
38.3 |
|
Total |
136.8 |
146.5 |
35.5 |
6.5 |
48.7 |
374.1 |
Note: Due to rounding, decimals may not add up to totals shown.
The Program Activities shown in this table include amounts from Corporate Services and Infrastructure Program Activity.
8. Details on Project Spending
|
($ in millions) |
Current Estimated Total Cost |
Forecast Spending to March 31, 2006 |
Planned Spending 2006-2007 |
Planned Spending 2007-2008 |
Planned Spending 2008-2009 |
Future Year Spending Requirement |
|
Space Based Earth Observation |
|
|
|
|
|
|
|
(Q) RADARSAT-1 (MCP) |
713.0 |
701.6 |
11.4 |
|
|
|
|
(BC-Q) RADARSAT-2 (MCP) |
421.6 |
389.3 |
32.3 |
|
|
|
|
(TBD) SWIFT -CHINOOK (PPA) |
105.5 |
6.1 |
11.2 |
14.0 |
28.6 |
45.6 |
|
(O-Q) HYDROS (PPA) |
11.6 |
1.4 |
1.5 |
2.3 |
2.8 |
3.6 |
|
Space Science and Exploration |
|
|
|
|
|
|
|
(O) Herschel HIFI (EPA) |
10.5 |
10.2 |
0.3 |
|
|
|
|
(O) JWST (PPA) |
65.9 |
15.2 |
25.1 |
17.9 |
6.8 |
1.0 |
|
(O) MARS PHOENIX (EPA) |
23.9 |
17.0 |
6.2 |
0.7 |
0.6 |
|
|
(TBD) UVIT (EPA) |
6.3 |
1.7 |
3.5 |
1.1 |
|
|
|
TOTAL |
1564.4 |
1149.2 |
120.7 |
78.8 |
85.6 |
130.2 |
Note: Due to rounding, decimals may not add up to totals shown.
|
Province where the capital project will be carried out: |
Class of Project: |
Annexes
The annexes are linked to the Report on Plans and Priorities 2006-2007 posted on the Canadian Space Agency Web site at:
http://www.espace.gc.ca/asc/eng/resources/publications/default.asp#parliament