
Treasury Board of Canada Secretariat
www.tbs-sct.gc.ca
Common menu bar links
Breadcrumb Trail
ARCHIVED - 2010-11 Part I - The Government Expense Plan
 This page has been archived.
Archived Content
Information identified as archived on the Web is for reference, research or recordkeeping purposes. It has not been altered or updated after the date of archiving. Web pages that are archived on the Web are not subject to the Government of Canada Web Standards. As per the Communications Policy of the Government of Canada, you can request alternate formats on the "Contact Us" page.
Introduction
Each year, the government prepares Estimates in support of its request to Parliament for authority to spend public monies. These Estimates are tabled in the House of Commons by the President of the Treasury Board in three parts: the Government Expense Plan, the Main Estimates, and the Departmental Expenditure Plans.
By Standing Order of the House of Commons, the Estimates must be tabled on or before March 1st. Accordingly, it is not always possible to include emerging priorities and items announced in the Government's Budget in the Estimates. These additional requirements are presented through Supplementary Estimates later in the fiscal .
This part of the Estimates – the Government Expense Plan – provides an overview of the government's requirements and highlights the key drivers influencing changes in expenditures from the previous year.
Summary of Estimates
Total Net Expenditures $259.0 billion
In total, net expenditures for 2010-11 are estimated at $259.0 billion. This is a projected increase of $22.9 billion or 9.7% relative to the previous Main Estimates and can be accounted for by a $12.3 billion increase in statutory forecasts and a $10.6 billion increase in voted expenditures.
Table 1 shows a breakdown of net voted and statutory expenditures as compared to previous Main Estimates. This table also provides an adjusted total to facilitate the comparison of net estimated expenditures to expenses previously presented Economic and Fiscal Updates and Budgets.
Table 1: Summary of Main Estimates
| Change | ||||||||
| 2010-11 | 2009-10 | $ | % | |||||
| (billions) | ||||||||
| Net expenditures | ||||||||
| Voted | 96.3 | 85.7 | 10.6 | 12.4 | ||||
| Statutory forecasts | 162.7 | 150.4 | 12.3 | 8.2 | ||||
| Total net expenditures | 259.0 | 236.1 | 22.9 | 9.7 | ||||
| Adjustments1 | 19.4 | 12.3 | 7.1 | 58.1 | ||||
| Net expenses | 278.4 | 248.4 | 30.0 | 12.1 | ||||
Note: Totals may not add and may not agree with details presented later in this document due to rounding.
1. This includes adjustments for: the impact of accrual accounting; expenses charged to previous years, expenses not yet allocated for initiatives that require further development or legislation; revisions to major transfers to other levels of government; and a net adjustment to account for major components of budgetary expenses that are affected by the move in Budget 2006 from a net basis to a gross basis of presentation.
Voted Expenditures $96.3 billion
These Estimates support the government's request to Parliament for authority to expend $96.3 billion through annual appropriations. Of this request, $96.2 billion is for budgetary expenditures – operating and capital expenditures; transfer payments to other levels of government, organizations or individuals; and payments to Crown corporations.
The remaining $78.6 million is for non-budgetary expenditures – outlays for loans, investments and advances and represents a change in the composition of the financial assets of the Government of Canada.
These expenditures, called voted expenditures, require annual approval from Parliament which is sought through an appropriation bill. The bill that governs the purpose and conditions under which expenditures can be made and the funds subject to these terms and conditions.
Statutory Forecasts $162.7 billion
Statutory forecasts represent payments to be made under legislation previously approved by Parliament. Statutory forecasts of $162.7 billion are included in these Estimates to provide a more complete picture of total estimated expenditures. Of these forecasts, $165.0 billion is for budgetary expenditures (including the cost of servicing the public debt) with a decrease of $2.3 billion in non-budgetary expenditures.
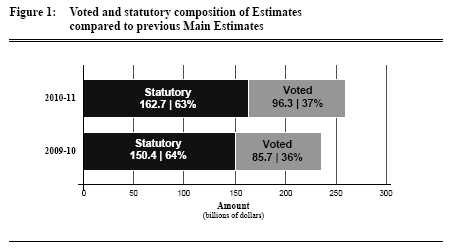
Table 2 provides a breakdown of net voted and statutory expenditures by budgetary and non-budgetary category as compared to previous Main Estimates.
Table 2: Comparison of budgetary and non-budgetary Estimates
| 2010-11 | 2009-10 | Change | ||||||||||||||
| Non- | Non- | |||||||||||||||
| Budgetary | budgetary | Total | Budgetary | budgetary | Total | $ | % | |||||||||
| (billions) | ||||||||||||||||
| Net expenditures | ||||||||||||||||
| Voted | 96.2 | 0.1 | 96.3 | 85.6 | 0.1 | 85.7 | 10.6 | 12.4 | ||||||||
| Statutory forecasts | 165.0 | (2.3) | 162.7 | 150.2 | 0.3 | 150.4 | 12.3 | 8.2 | ||||||||
| Total net expenditures | 261.2 | (2.2) | 259.0 | 235.8 | 0.4 | 236.1 | 22.9 | 9.7 | ||||||||
Supplementary Estimates $96.1 billion
Many of the year-over-year increases in these Main Estimates are accounted for by supplementary funding and changes to statutory forecasts totalling $96.1 billion including $50.0 billion for the Insured Mortgage Purchase Program and other programs related to Canada's Economic Action Plan.
As shown in Figure 2 and Table 3, the difference between these Main Estimates and the 2009-10 total Estimates is ($73.6 billion) or (22.1%) .
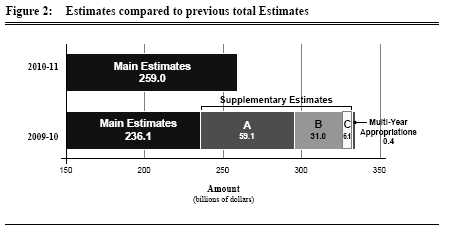
Table 3: Estimates compared to previous total Estimates
| 2009-10 | ||||||||||||||||
| Supplementary Estimates | ||||||||||||||||
| 2010-11 | Total | Main | Change | |||||||||||||
| Estimates Estimates | C | B | A | Estimates | $ | % | ||||||||||
| (billions) | ||||||||||||||||
| Net expenditures | ||||||||||||||||
| Voted | 96.3 | 97.7 | 1.8 | 4.9 | 5.3 | 85.7 | (1.3) | (1.4) | ||||||||
| Statutory forecasts | 162.7 | 234.6 | 4.3 | 26.0 | 53.8 | 150.4 | (71.9) | (30.7) | ||||||||
| Sub-total net expenditures | 259.0 | 332.3 | 6.1 | 31.0 | 59.1 | 236.1 | (73.2) | (22.0) | ||||||||
| Multi-year appropriations 1 | . . . . . | 0.4 | . . . . . | . . . . . | . . . . . | . . . . . | (0.4) | (100.0) | ||||||||
| Total net expenditures | 259.0 | 332.6 | 6.1 | 31.0 | 59.1 | 236.1 | (73.6) | (22.1) | ||||||||
1. This adjustment includes amounts for the Canada Revenue Agency, the Parks Canada Agency and the Canada Border Services Agency who have been given multi-year appropriation authority.
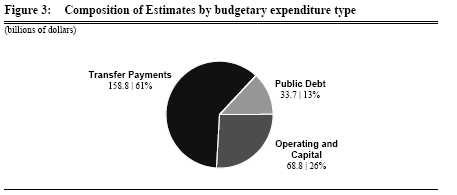
Budgetary Expenditures $261.2 billion
The budgetary spending in the 2010-11 Main Estimates amounts to $261.2 billion. This represents an increase of $25.5 billion or 10.8% compared to the 2009-10 Main Estimates.
Transfer Payments $158.8 billion
The majority of expenditures in 2010-11 will be transfer payments – payments made to other levels of government, individuals and other organizations. Transfer payments make up approximately 60.8% of expenditures or $158.8 billion. This represents a projected increase of $19.7 billion or 14.2% from previous Main Estimates.
Operating and Capital $68.8 billion
Operating and capital expenditures account for 26.3% of expenditures or $68.8 billion. This represents a projected increase of $3.9 billion or 6% from previous Main Estimates.
Public Debt Charges $33.7 billion
Public debt charges are approximately 12.9% of expenditures or $33.7 billion, a projected increase of $1.8 billion or 5.7% from previous Main Estimates.
Figure 3 shows the composition of Estimates by budgetary expenditure type.
Non-Budgetary Expenditures ($2.2) billion
For the 2010-11 Main Estimates recoveries are expected to exceed expenditures by $2.2 billion for non-budgetary items. This amounts to a reduction of $2.6 billion or 732.3% compared to the 2009-10 Main Estimates.
Table 4 shows the Estimates by expenditure type as compared to the previous Main Estimates.
Table 4: Estimates by Expenditure Type
|
Change |
||||||||
| 2010-11 | 2009-10 | $ | % | |||||
| (billions) | ||||||||
| Net expenditures | ||||||||
| Budgetary | ||||||||
| Transfer payments | 158.8 | 139.1 | 19.7 | 14.2 | ||||
| Operating and capital | 68.8 | 64.9 | 3.9 | 6.0 | ||||
| Public debt charges | 33.7 | 31.9 | 1.8 | 5.7 | ||||
| Sub-total budgetary | 261.2 | 235.8 | 25.5 | 10.8 | ||||
| Non-budgetary 1 | (2.2) | 0.4 | (2.6) | (732.3) | ||||
| Total net expenditures | 259.0 | 236.1 | 22.9 | 9.7 | ||||
Note: Totals may not add and may not agree with details presented later in this document due to rounding.
1. Loans, investments and advances less scheduled repayments.
Major Transfer Payments
Major transfer payments – significant transfers to other levels of government and transfers to persons – will account for 73% of estimated transfer payment expenditures or $115.1 billion.
Table 5: Major Transfer Payments
|
Change |
||||||||
| 2010-11 | 2009-10 | $ | % | |||||
| (billions) | ||||||||
| Major transfer payments | ||||||||
| Transfers to other levels of government | ||||||||
| Canada Health Transfer | 25.4 | 24.0 | 1.4 | 6.0 | ||||
| Fiscal Equalization | 14.4 | 16.1 | (1.7) | (10.7) | ||||
| Canada Social Transfer | 11.2 | 10.9 | 0.3 | 2.9 | ||||
| Implementation of Harmonized Sales Tax | 3.0 | . . . . . | 3.0 | N/A | ||||
| Territorial Financing | 2.7 | 2.5 | 0.2 | 6.8 | ||||
| Wait Times Reduction Transfer | 0.3 | 0.3 | . . . . . | . . . . . | ||||
| Payment to Ontario | 0.2 | . . . . . | 0.2 | N/A | ||||
| Capital Tax Elimination Incentive | 0.2 | 0.1 | . . . . . | 41.7 | ||||
| Other transfers to other levels of government | 0.0 | 0.0 | . . . . . | . . . . . | ||||
| Youth allowance recovery | (0.7) | (0.7) | . . . . . | (4.3) | ||||
| Alternative payments for standing programs | (3.0) | (3.1) | 0.1 | (4.5) | ||||
| Total transfers to other levels of government | 53.7 | 50.0 | 3.6 | 7.3 | ||||
| Transfers to persons | ||||||||
| Elderly Benefits | 36.9 | 35.2 | 1.7 | 4.7 | ||||
| Employment Insurance | 22.0 | 16.6 | 5.4 | 32.7 | ||||
| Universal Child Care Benefit | 2.6 | 2.5 | 0.1 | 2.0 | ||||
| Total transfers to persons | 61.5 | 54.3 | 7.1 | 13.2 | ||||
| Total major transfer payments | 115.1 | 104.3 | 10.8 | 10.3 | ||||
Transfers to other levels of government $53.7 billion
Transfers to other levels of government are projected to increase by $3.6 billion or 7.3% for 2010-11.
The Canada Health Transfer is a federal transfer provided to provinces and territories in support of health care
The Canada Health Transfer (CHT) is a federal transfer provided to provinces and territories in support of health care. CHT support is provided through cash payments and tax point transfers and is subject to the five criteria of the Canada Health Act and the prohibitions against extra-billing and user fees. The cash transfer levels of the CHT have been increased by $1.4 billion between 2009-10 and 2010-11 as a result of the automatic 6% escalator announced in the September 2004 Ten Year Plan to Strengthen Health Care. The cash transfer of the CHT will continue to grow by 6% per year until the end of the legislated period in 2013-14.
Fiscal Equalization refers to unconditional transfer payments to less prosperous provinces so that they can provide their residents with public services that are reasonably comparable to those in other provinces, at reasonably comparable levels of taxation. These payments are $1.7 billion or 10.7% lower than in Main Estimates 2009-10 as a result of changes implemented as part of the Budget Implementation Act, 2009 .
The Canada Social Transfer is a federal transfer to provinces and territories in support of social assistance and social services, post-secondary education, and programs for children
The Canada Social Transfer (CST) is a federal transfer to provinces and territories in support of social assistance and social services, post-secondary education, and programs for children. For 2010-11, the increase of $317.9 million or 2.9% represents the legislated increase of 3% along with a decrease in the transitional payments announced in Budget 2007 that protect provinces against declines in their CST cash transfers.
An initial payment of $3.0 billion is planned for the implementation of the harmonized sales tax. Further transitional payments may be made under this authority, including a payment to Ontario in 2011-12 and payments to British Columbia, subject to fulfilling the terms of the Canada-British Columbia Comprehensive Integrated Tax Coordination Agreement.
Territorial Financing payments are unconditional federal transfers provided to the three territorial governments that gives territorial residents access to a range of public services comparable to those offered by provincial governments, at comparable levels of taxation. The transfers are based on a formula that fills the gap between the expenditure requirements and revenue-raising capacity of the territories. These payments are $165.6 million higher than in Main Estimates 2009-10 largely as a result of the introduction of the new formula announced in Budget 2009.
Budget 2009 introduced a separate payment to Ontario outside of the Canada Health Transfer cash envelope for 2009-10 and 2010-11 to ensure its per capita cash entitlements in relation to the CHT are the same as for other Equalization-receiving provinces. For 2010-11, the amount is $213.8 million.
Wait Times Reduction Funding is part of the 10-Year Plan to Strengthen Health Care in which First Ministers committed to achieving meaningful reductions in wait times in priority areas such as cancer, heart, diagnostic imaging, joint replacements and sight restoration. Budget 2005 committed to a transfer of $5.5 billion for wait times reduction. Of this amount, $4.3 billion was provided to provinces and territories by way of third-party trusts. The remaining $1.2 billion will be paid in bi-monthly instalments totalling $250.0 million per year between 2009-10 and 2013-14.
Budget 2007 provided a temporary financial incentive for provinces to eliminate their capital taxes by 2011. The amount of the incentive in a year depends on eligible provincial capital tax reductions. The incentive will be paid annually to 2011. To be eligible, a province must re-structure or eliminate its currently existing general capital tax. The amount identified for 2010-11 is $170.0 million.
Youth Allowance Recovery relates to tax points transferred to the province of Quebec for the Youth Allowance program, which has since expired. The equivalent value of the tax point reduction is recovered from the federal cash transfers to the province. The change in recoveries for the Youth Allowances Recovery Program is entirely due to year-over-year changes to the value of federal personal income taxes, the recovery being a percentage of these taxes. For 2010-11, the decreased recovery of $33.1 million is related to a decrease in the estimated value of personal income tax points.
Alternative Payments for Standing Programs represent recoveries from Quebec of an additional tax point transfer above and beyond the tax point transfer under the Canada Health Transfer (CHT) and the Canada Social Transfer (CST). The change in recoveries to the Alternative Payments for Standing Programs is entirely due to year-over-year changes to the value of federal personal income taxes, the recovery being a percentage of these taxes. For 2010-11, the decreased recovery of $147.3 million is attributable to a decrease in the value of personal income tax points.
Transfers to persons $61.5 billion
Transfers to persons are projected to increase by $7.1 billion or 13.2% for 2010-11.
Elderly benefits include Old Age Security and Guaranteed Income Supplement and Allowance
Elderly benefits include Old Security, Guaranteed Income Supplement and Allowance Payments, and earnings-related pension under the Canada and Quebec Pension Plans. Elderly benefit payments are expected to increase by $1.7 billion or 4.7% due to the growth in the elderly population and an increase in average benefits. These benefits are fully indexed to quarterly changes in consumer prices.
Employment temporary financial assistance for unemployed Canadians while they look for work or upgrade their skills. Employment insurance benefit payments are forecast to increase by $5.4 billion or 32.7% .
Universal Child Care benefits provides families with resources to support childcare choices
Universal Child Care benefits provides families with resources to support childcare choices, and is paid to families in monthly instalments of $100 per child under the age of six. Universal child care benefit payments are forecast to increase by $50.0 million or 2.0% in due to a slight increase in the projected number of recipients and a slight increase in take-up rates.
Estimates by Sector
To facilitate presentation and discussion in the Part I, federal departments, agencies and Crown Corporations have been grouped into ten sectors according to their common attributes and objectives. Within each sector, these expenditures are further broken down by federal department, agency, Crown Corporation, and where applicable by major transfer payments.
The table and figure below summarize net budgetary expenditures by sector.
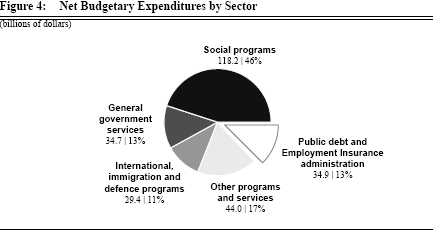
Table 6: Net Budgetary Expenditures by Sector
| Change | % of | |||||||||
| 2010-11 | 2009-10 | $ | % | Total | ||||||
| (thousands) | ||||||||||
| Sectors | ||||||||||
| Social programs 1 | 118,244,728 | 106,494,160 | 11,750,568 | 11.0 | 45.3 | |||||
| General government services 2 | 34,688,202 | 35,107,027 | (418,825) | (1.2) | 13.3 | |||||
| International, immigration and defence programs | 29,369,960 | 26,739,370 | 2,630,590 | 9.8 | 11.2 | |||||
| Industrial, regional, and scientific-technological | ||||||||||
| support programs | 15,702,871 | 9,164,547 | 6,538,324 | 71.3 | 6.0 | |||||
| Environment and resource-based programs | 11,481,416 | 9,837,816 | 1,643,600 | 16.7 | 4.4 | |||||
| Security and public safety programs | 7,901,049 | 7,311,730 | 589,319 | 8.1 | 3.0 | |||||
| Cultural programs | 3,976,576 | 3,790,124 | 186,451 | 4.9 | 1.5 | |||||
| Transportation programs | 2,917,460 | 2,307,776 | 609,685 | 26.4 | 1.1 | |||||
| Justice and legal programs | 1,461,160 | 1,415,698 | 45,462 | 3.2 | 0.6 | |||||
| Parliament and Governor General | 603,284 | 584,312 | 18,971 | 3.2 | 0.2 | |||||
| Sub-total sectors | 226,346,706 | 202,752,907 | 23,593,798 | 11.6 | 86.6 | |||||
| Other items not allocated to a specific sector | ||||||||||
| Public debt charges | 33,693,000 | 31,868,000 | 1,825,000 | 5.7 | 12.9 | |||||
| Employment insurance administration 3 | 1,195,163 | 1,164,038 | 31,125 | 2.7 | 0.5 | |||||
| Sub-total other items | 34,888,163 | 33,032,038 | 1,856,125 | 5.6 | 13.4 | |||||
| Total net budgetary expenditures | 261,234,868 | 235,784,945 | 25,449,924 | 10.8 | 100.0 | |||||
Note: Totals may not add due to rounding.
1. Includes transfer payments for Employment Insurance, Elderly Benefits, the Canada Health Transfer, and the Canada Social Transfer.
2. Includes transfer payments to territorial governments and equalization payments.
3. This represents administrative charges associated with the provision of the Employment Insurance Plan.
The largest portion of expenditures are devoted to social programs which accounts for $118.2 billion or 45.3% of the total estimated expenditures for 2010-11. An additional $97.8 billion or 37.4% of total expenditures are accounted for by public debt charges, general government services, and international, immigration and defence programs.
The forecast increase of $1.8 billion or 5.7% in public debt charges are higher as a result of an increase in projected debt levels mainly resulting from higher projected budgetary deficits and lower projected returns on public sector pension-plan assets, which are deducted from pension interest expense.
Social Programs $118.2 billion
The social programs sector comprises those departments, agencies and Crown Corporations that deliver programs that aim to promote the health and well-being of Canadians and foster equality of access to the benefits of Canadian society and includes major transfers to Canadians. These organizations include Indian Affairs and Northern Development, Human
Resources and Skills Development, Health and Veterans Affairs, as well as a number of departmental agencies.
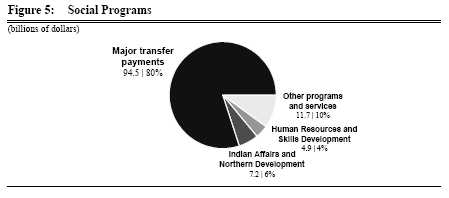
Table 7: Social Programs
| Change | ||||||||
| 2010-11 | 2009-10 | $ | % | |||||
| (thousands) | ||||||||
| Departments and agencies | ||||||||
| Indian Affairs and Northern Development | 7,223,387 | 6,856,145 | 367,242 | 5.4 | ||||
| Human Resources and Skills Development | 4,876,583 | 3,846,179 | 1,030,404 | 26.8 | ||||
| Health | 3,419,376 | 3,368,658 | 50,718 | 1.5 | ||||
| Veterans Affairs | 3,414,105 | 3,364,117 | 49,988 | 1.5 | ||||
| Canada Mortgage and Housing Corporation | 3,131,341 | 2,044,709 | 1,086,632 | 53.1 | ||||
| Canadian Institutes of Health Research | 980,821 | 924,326 | 56,495 | 6.1 | ||||
| Public Health Agency of Canada | 677,995 | 648,000 | 29,996 | 4.6 | ||||
| Indian Residentials Schools Truth and Reconciliation | ||||||||
| Commission | 15,315 | 18,585 | (3,270) | (17.6) | ||||
| Patented Medicine Prices Review Board | 12,182 | 11,358 | 824 | 7.3 | ||||
| Assisted Human Reproduction Agency of Canada | 10,523 | 10,516 | 7 | 0.1 | ||||
| Hazardous Materials Information Review Commission | 5,704 | 5,555 | 149 | 2.7 | ||||
| Canadian Centre for Occupational Health and Safety | 5,056 | 4,855 | 201 | 4.1 | ||||
| First Nations Statistical Institute | 5,000 | 4,700 | 300 | 6.4 | ||||
| Registry of the Specific Claims Tribunal | 2,840 | 2,568 | 272 | 10.6 | ||||
| Canadian Polar Commission | 1,016 | 988 | 28 | 2.9 | ||||
| Sub-total departments and agencies | 23,781,244 | 21,111,259 | 2,669,986 | 12.6 | ||||
| Major transfer payments | ||||||||
| Elderly | 36,865,000 | 35,197,000 | 1,668,000 | 4.7 | ||||
| Canada Health Transfer | 25,426,286 | 23,987,062 | 1,439,224 | 6.0 | ||||
| Employment Insurance | 22,000,000 | 16,575,000 | 5,425,000 | 32.7 | ||||
| Canada Social Transfer | 11,178,703 | 10,860,781 | 317,922 | 2.9 | ||||
| Universal Child Care Benefit | 2,594,000 | 2,544,000 | 50,000 | 2.0 | ||||
| Other transfers to other levels of government | 32,000 | 32,000 | . . . . . | . . . . . | ||||
| Youth allowance recovery | (655,786) | (688,935) | 33,149 | (4.8) | ||||
| Alternative payments for standing programs | (2,976,719) | (3,124,006) | 147,287 | (4.7) | ||||
| Sub-total major transfer payments | 94,463,484 | 85,382,902 | 9,080,582 | 10.6 | ||||
| Total | 118,244,728 | 106,494,160 | 11,750,568 | 11.0 | ||||
As presented in these Main Estimates, proposed spending in the social programs sector in 2010-11 is estimated at $118.2 billion, which represents by far the largest component of total program spending at 45.3% . Of this amount, $23.8 billion or 20.1% will be for direct program spending, and $94.5 billion or 80%, will be for major transfer payments. Compared to the previous year's Main Estimates, this sector's spending in 2010-11 is set to increase by $11.8 billion or 11.0% .
Indian Affairs and Northern Development ↑$367.2 million
Indian Affairs and Northern Development's increase in net spending of $367.2 million or 5.4% is due to an increase in operating costs of $73.9 million, and an increase in contributions and other transfer payments of $398.6 million, partially offset by decreases of $38.0 million in capital and $67.3 million in grants. Two other major decreases include $132.2 million from the sunsetting of funding for First Nations Water and Wastewater Action Plan and $114.6 million reflecting changes in the cash flow for the negotiation, settlement and comprehensive claims primarily for the Cree of Quebec. Factors contributing to the net increase include:
$289.3 million to support investments in First Nations infrastructure for school construction, water and wastewater projects, and on–reserve housing
-
$289.3 million to support investments in First Nations infrastructure for school construction, water and wastewater projects, and on-reserve housing;
-
$95.0 million to meet increased demand for ongoing Indian and Inuit programs, which reflects a 2% allowance for inflation and population growth and provides access to basic services such as education, housing, community infrastructure (water and sewage systems), and social support services;
-
$94.4 million related to the assessment, management and remediation of federal contaminated sites;
-
$51.8 million to support the implementation of the new Arctic Research Infrastructure Fund and undertake the feasibility study for the High Arctic Research Station to deliver on commitments to invest in maintaining or upgrading key existing Arctic research facilities;
-
$36.6 million to support investments in First Nations education facilities and the First Nations Infrastructure Fund which aims to improve the environment and the quality of life of First Nation communities by improving and increasing the development of public infrastructure; and
-
$33.1 million to support the implementation of initiatives under the new Federal Framework for Aboriginal Economic Development which focusses the federal government's actions – from programs to legislation to partnerships – to increase the participation of First Nations, Inuit and M�tis peoples in the Canadian economy and improve economic actions for Aboriginal peoples in all parts of Canada.
Human Resources and Skills Development ↑$1.0 billion
Excluding the proposed spending increase of over $1.7 billion for the delivery of Elderly Benefits (Old Age Security, Guaranteed Income Supplement and Allowance payments) and the Universal Child Care Benefit, Human Resources and Skills Development's increase in net spending of $1.0 billion or 26.1% is due to an increase in operating costs of $180.0 million, an increase in grants of $151.7 million, and an increase in contributions and other transfer payments of $724.2 million. Factors contributing to the net increase include:
-
$253.5 million related to the Strategic Training and Transition Fund to respond to the increased needs for training resulting from the economic downturn;
-
$172.2 to the Canada Student Loans Program;
-
$143.3 million to direct financing under the Canada Student Financial Assistance Act ;
-
$139.8 million for the extension to March 31, 2011 of the Homelessness Partnering Strategy which aims to promote strategic partnerships, longer-term housing solutions and stable supports to assist homeless people to move toward autonomy and self- sufficiency;
-
$115.0 million to voted grants and contributions. In 2009-10, the total spending authority was adjusted to account for lower than expected expenditures. The spending authority is being restored to its original level in 2010-11;
-
$70.9 million for the Aboriginal Skills and Employment Partnership for which the objective is to provide sustainable employment for Aboriginal people in major economic industries, leading to lasting benefits for Aboriginal communities, families and individuals;
-
$59.7 million related to the review of the Employment Insurance administrative cost allocation methodology which indicated that there was a requirement to realign administrative authorities between the Employment Insurance Account and the Consolidated Revenue Fund;
-
$59.1 million for the extension of the Targeted Initiative for Older Workers to support unemployed older workers in communities affected by significant downsizing or closures, by providing programs aimed at reintegrating them into employment; and
-
$45.7 million to Canada Student Grants. The costing model for the Canada Student Grants Program was adjusted to reflect the increase in growth rate as well as the past historical trend.
Health ↑ $50.7 million
Health's increase in net spending of $50.7 million or 1.5% is due to an increase in operating costs of $93.9 million. This increase is partially offset by reductions in capital, and grants and contributions and other transfer payments totalling some $43.1 million. Factors contributing to the net increase include:
-
$237.3 million to stabilize the primary care services and the Non-Insured Health Benefits program which provides coverage for a limited range of goods and services when they are not insured elsewhere (drugs, dental care, vision care, etc.); and
-
$43.9 million related to the annual growth of the First Nations and Inuit Health Envelope which includes resources for all First Nations and Inuit health programs.
Veterans Affairs ↑ $50.0 million
Veterans Affairs' increase in net spending of $50.0 million or 1.5% is due to a $79.5 million increase in grants, partially offset by reductions of $7.1 million and $11.3 million in operations and contributions and other transfer payments respectively. The major item is $86.2 million for Disability Awards and Allowances due to payments of awards in 2010-11 resulting from approved pending applications, an increase in the forecasted number of new clients, an increase in forecasted costs for new conditions and reassessments of awards, and annual price indexation adjustments to award payments.
Canada Mortgage and Housing Corporation ↑ $1.1 billion
Canada Mortgage and Housing Corporation's net appropriation requirements are increasing by $1.1 billion or 53.1% due to an increase in operating costs. Factors contributing to the net increase include:
-
$914.8 million for a number of programs in support of Canada's Economic Action Plan. These include: Renovation and retrofit of existing social housing; Housing for low-income seniors; Housing for persons with disabilities; and First Nations new housing construction and existing housing repair and renovation;
-
$106.2 million to the Affordable Housing Initiative due to the extension of the program; and
-
$48.1 million to the Renovation Rehabilitation Assistance Program due to the extension of the program and revised timing of program advances.
Canadian Institutes of Health Research ↑ $56.5 million
The Canadian Institutes of Health Research's increase in spending of $56.5 million or 6.1% is due to an increase in operating costs of $6.2 million, and $50.2 million in grants. Factors contributing to the net increase include:
-
$34 million reflecting the government's decision to provide the agency with a permanent base budget to fund several new programs launched over the past few years; and
-
$14 million for Canada Graduate Scholarships program which aims to ensure Canada has a reliable supply of highly-skilled personnel in the knowledge economy going forward.
Public Health Agency of Canada ↑ � $30.0 million
The Public Health Agency of Canada's increase in net spending of $30.0 million or 4.6% is due to increases in operating costs of $55.0 million, and $27.1 million in capital, partially offset by a combined decrease of $52.2 million in grants, and contributions and other transfer payments. Factors contributing to the net increase include:
-
$45 million to support the installation of a new influenza fill line at ID Biomedical Corporation in Ste–Foy, Quebec, in order to secure, protect and improve ongoing domestic vaccine capacity in Canada for seasonal and pandemic influenza; and
-
$20.6 million to modernize the common service areas relating to Waste Management, Specimen Receiving, Culture Media Preparation, Stores, Shipping/Receiving, and Real Property Safety and Security at the National Microbiology Laboratory.
General Government Services ↑ $34.7 billion
The general government services sector comprises those departments, agencies and Crown Corporations that provide central services to support the internal operations of government, and includes fiscal equalization and transfers to Territorial governments, under the Department of Finance. These organizations include the Treasury Board, Canada Revenue Agency, and Public Works and Government Services as well as a number of departmental agencies.
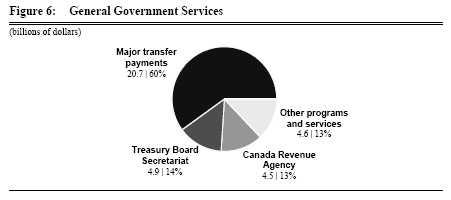
Table 8: General Government Services
| Change | ||||||||
| 2010-11 | 2009-10 | $ | % | |||||
| (thousands) | ||||||||
| Departments and agencies | ||||||||
| Treasury Board Secretariat | 4,946,290 | 7,757,177 (2,810,887) | (36.2) | |||||
| Canada Revenue Agency | 4,476,430 | 4,387,974 | 88,456 | 2.0 | ||||
| Public Works and Government Services | 2,843,326 | 2,387,444 | 455,882 | 19.1 | ||||
| Statistics Canada | 562,733 | 454,391 | 108,342 | 23.8 | ||||
| Finance | 494,237 | 387,716 | 106,521 | 27.5 | ||||
| Privy Council | 143,948 | 128,782 | 15,165 | 11.8 | ||||
| Chief Electoral | 121,821 | 119,635 | 2,186 | 1.8 | ||||
| Canada School of Public Service | 112,691 | 114,190 | (1,498) | (1.3) | ||||
| Public Service Commission | 98,962 | 91,767 | 7,195 | 7.8 | ||||
| Auditor General | 85,065 | 82,175 | 2,890 | 3.5 | ||||
| Financial Transactions and Reports Analysis Centre of | ||||||||
| Canada | 49,774 | 47,956 | 1,818 | 3.8 | ||||
| Canada Post Corporation | 22,210 | 72,210 | (50,000) | (69.2) | ||||
| Office of the Commissioner of Official | 20,615 | 19,935 | 679 | 3.4 | ||||
| Public Service Labour Relations Board | 13,654 | 6,821 | 6,833 | 100.2 | ||||
| Canadian Intergovernmental Conference Secretariat | 6,616 | 6,525 | 91 | 1.4 | ||||
| Office of the Public Sector Integrity Commissioner | 6,538 | 6,538 | . . . . . | . . . . . | ||||
| Public Service Staffing Tribunal | 5,463 | 1,579 | 3,885 | 246.0 | ||||
| Office of the Commissioner of Lobbying | 4,625 | 4,528 | 97 | 2.1 | ||||
| Registry of the Public Servants Disclosure Protection | ||||||||
| Tribunal | 1,828 | 1,828 | . . . . . | . . . . . | ||||
| Public Appointments Commission Secretariat | 1,063 | 1,063 | . . . . . | . . . . . | ||||
| Office of the Superintendent of Financial | 947 | 873 | 74 | 8.5 | ||||
| Public Service Human Resources Management Agency of | ||||||||
| Canada | . . . . . | 68,858 | (68,858) | (100.0) | ||||
| Sub-total departments and agencies | 14,018,835 | 16,149,965 | (2,131,130) | (13.2) | ||||
| Major transfer payments | ||||||||
| Fiscal Equalization | 14,372,000 | 16,086,136 | (1,714,136) | (10.7) | ||||
| Implementation of Harmonized Sales Tax | 3,000,000 | . . . . . | 3,000,000 | N/A | ||||
| Territorial Financing | 2,663,567 | 2,497,926 | 165,641 | 6.6 | ||||
| Wait Times Reduction Transfer | 250,000 | 250,000 | . . . . . | . . . . . | ||||
| Payment to Ontario | 213,800 | . . . . . | 213,800 | N/A | ||||
| Capital Tax Elimination Incentive | 170,000 | 123,000 | 47,000 | 38.2 | ||||
| Sub-total transfer payments | 20,669,367 | 18,957,062 | 1,712,305 | 9.0 | ||||
| Total | 34,688,202 | 35,107,027 | (418,825) | (1.2) | ||||
As presented in these Main Estimates, proposed spending in the General Government Services Sector for 2010-11 is estimated at $34.7 billion, which represents 13.3% of total program spending. Of this amount, $14.0 billion or 40.4% will be for direct program spending and the remaining $20.7 billion will be for major transfer payments. Compared to the previous year's Main Estimates, this sector's total spending in 2010-11 has decreased by $418.8 million or 1.2%.
Treasury Board Secretariat ↓ $2.8 billion
The Treasury Board Secretariat's decrease in net spending of $2.8 billion or 36.2% is primarily due to the expiration of the $3 billion central vote for Budget Implementation Initiatives identified in the 2009-10 Main Estimates in order to support the timely implementation of initiatives within Canada's Economic Action Plan. Among the initiatives requiring an increase in funding are:
-
$86.1 million for increases in costs related to public service insurance;
-
$81.4 million for modifications to the Canadian Forces Service Income Security Insurance Plan's Long Term Disability Plans; and
-
$58.6 million for the amalgamation and combination of the Public Service Human Resources Management Agency of Canada under the Secretary of the Treasury Board, effective March 2, 2009. This represents the total transfer of the resources and completes the implementation of the decision.
Canada Revenue Agency ↑ $88.5 million
The Canada Revenue Agency's (CRA) increase in net spending of $88.5 million or 2% is due to an increase in operating costs of $39.9 million, an increase in contributions and other transfer payments of $54.0 million, offset by an additional $5.4 million in expected revenue due to an increase in Canada Pension Plan (CPP) and Employment Insurance (EI) recoveries. In addition, the establishment of a new capital authority results in the transfer of $136.1 million from operating costs to the new Vote. Factors contributing to the net increase include:
-
$50.0 million for payments to provinces under the Softwood Lumber Products Export Charge Act ;
-
$22.7 million related primarily to the transfer from Public Works and Government Services Canada for increased charges for accommodation and real property services; and
-
$22.1 million for initiatives administered on behalf of Service Canada and the Province of Ontario on a cost recovery basis.
Public Works and Government Services ↑ $455.9 million
Public Works and Government Services's increase in net spending of $455.9 million or 19.1% . Factors contributing to the net increase include:
-
$183.4 million for the Accelerated Infrastructure Program designed to accelerate investments in bridges, roads, and other infrastructure;
-
$88.1 million to accommodate volume and inflationary pressures on non-discretionary charges such as utilities subject to deregulation and market conditions, expansion requests from approved program growth in other government departments, market conditions impacting rental rates in leased facilities, etc.;
-
$43.9 million for collective agreements; and
-
$20.8 million for the 13% accommodation levy which pays for departmental accommodation costs.
Statistics Canada ↑ $108.3 million
Statistics Canada's increase in net spending of $108.3 million or 23.8% is due to an increase in operating costs. Factors contributing to the net increase include: $92.2 million for the 2011 Census of Population; and $27.8 million for collective agreements and the Agency's share of contributions to Employee Benefit Plan.
Finance ↑ $106.5 million
Excluding major transfers to other levels of government and public debt charges, Finance's net increase $106.5 million or 27.5% is mainly due to the addition of $161 million to support the introduction of a Canadian securities regulation regime and regulatory authority and the establishment of a Canadian securities transition office, partially offset by a reduction to the Toronto Waterfront Revitalization Initiative.
Canada Post Corporation ↓ $50.0 million
Canada Post Corporation's net appropriation requirements are decreasing by $50 million due to the termination of the Transitional Funding for the Canada Post Pension Plan.
International, Immigration and Defence Programs $29.4 billion
The international, immigration and defence programs sector comprises those departments, agencies and Crown Corporations that deliver programs which support the security of Canadians, defend Canadian interests, promote a stable international environment and project Canadian values and culture in world affairs. Organizations include National Defence and its associated agencies, the Department of Foreign Affairs and International Trade and its associated agencies, and Citizenship and Immigration.
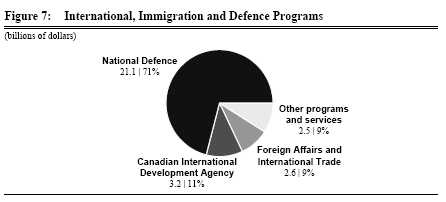
Table 9: International, Immigration and Defence Programs
| Change | ||||||||
| 2010-11 | 2009-10 | $ | % | |||||
| (thousands) | ||||||||
| National Defence | 21,101,512 | 19,239,461 | 1,862,051 | 9.7 | ||||
| Canadian International Development Agency | 3,153,572 | 3,069,262 | 84,309 | 2.7 | ||||
| Foreign Affairs and International Trade | 2,567,220 | 2,162,871 | 404,349 | 18.7 | ||||
| Citizenship and Immigration | 1,532,469 | 1,358,318 | 174,151 | 12.8 | ||||
| Finance – International Assistance – Transfer Payments | 664,481 | 583,680 | 80,801 | 13.8 | ||||
| International Development Research Centre | 181,304 | 161,750 | 19,554 | 12.1 | ||||
| Immigration and Refugee Board of Canada | 117,060 | 113,357 | 3,704 | 3.3 | ||||
| Canadian Commercial Corporation | 15,550 | 15,192 | 358 | 2.4 | ||||
| Canadian International Trade Tribunal | 11,941 | 9,530 | 2,411 | 25.3 | ||||
| International Joint Commission | 8,375 | 9,011 | (636) | (7.1) | ||||
| Canadian Forces Grievance Board | 6,641 | 6,458 | 183 | 2.8 | ||||
| Military Police Complaints Commission | 4,685 | 5,973 | (1,288) | (21.6) | ||||
| NAFTA Secretariat – Canadian Section | 3,051 | 3,014 | 36 | 1.2 | ||||
| Office of the Communications Security Establishment | ||||||||
| Commissioner | 2,100 | 1,494 | 606 | 40.6 | ||||
| Total. | 29,369,960 | 26,739,370 | 2,630,590 | 9.8 | ||||
As presented in these Main Estimates, proposed spending in the International, Immigration and Defence Programs Sector in 2010-11 is estimated at $29.4 billion, which represents 11.2% of total program spending. Compared to the previous year's Main Estimates, this sector's spending in 2010-11 has increased by $2.6 billion, or 9.8% .
National Defence ↑ $1.9 billion
National Defence's increase in net spending of $1.9 billion or 9.7% is due to an increase in operating costs of $1.3 billion, an increase in capital costs of $581.7 million, and an increase in grants, contributions and other transfer payments of $3.7 million. Factors contributing to the net increase include:
$822.0 million for the Afghanistan mission to ensure the safety and operational effectiveness of Canadian troops
-
$822.0 million for the Afghanistan mission to ensure the safety and operational effectiveness of Canadian troops;
-
$297.5 million for the Medium–to Heavy Lift Helicopter project, to provide a new capability and CH–147 Chinook helicopters for the Canadian Forces;
-
$246.6 million for the Tactical Airlift Capability Project, to replace Canadian Forces' Hercules aircraft that are reaching the end of their useful life;
-
$200.0 million for the Maritime Helicopter Project, to replace the CH124 Sea King with a fleet of new helicopters;
-
$196.0 million in funding to offset the loss of purchasing power due to price increases;
-
$166.6 million for increases to pay and allowances for the Canadian Forces;
-
$128.1 million for the Tank Replacement Project to replace the Canadian Forces' aging Leopard 1 tank fleet;
-
$125.4 million for the Family of Land Combat Vehicles projects, to upgrade or replace armoured military vehicles to modernize the Canadian Forces;
-
$122.9 million for increases in civilian pay;
-
$65.5 million for the Communications Security Establishment, to replace and upgrade its existing equipment, infrastructure and information technology, and for sustaining operations;
-
$43.6 million for ongoing Public Security and Anti–Terrorism initiatives; and
-
$36.4 million for the construction of a new facility at Pleasantville, Newfoundland.
Canadian International Development Agency ↑ $84.3 million
The Canadian International Development Agency's increase in net spending of $84.3 million or 2.7% is mainly due to a combined increase in grants, contributions and other transfer payments of $84.5 million; the major item being $70 million to enable the agency to respond to increasing global food aid requirements and continue to contribute to the needs of the world's most food-insecure populations.
Foreign Affairs and International Trade ↑ $404.3 million
Foreign Affairs and International Trade's increase in net spending of $404.3 million or 18.7% is due to an increase in operating costs of $201.3 million, an increase in capital of $9.0 million, and a combined increase in grants, contributions and other transfer payments of $197.1 million. Factors contributing to the net increase include:
-
$164.7 million to cover the increased cost of assessed contributions which represent Canada's treaty obligations and legal commitments to international organizations such as United Nations and World Health Organization;
-
$78.5 million for activities related to hosting the 2010 G8 Summit in Muskoka;
-
$52.7 million for strengthening Canada's network of missions to enhance Canada's representation abroad;
-
$33.5 million for realigning Canadian programming in Afghanistan with Canada's new priorities for 2008-11;
-
$28.6 million to compensate for the effect of foreign inflation in excess of Canadian domestic inflation; and
-
$23.1 million for a new Investment Cooperation Program that provides incentives to Canadian firms to study the commercial viability of projects in developing countries.
Citizenship and Immigration ↑ $174.2 million
Citizenship and Immigration's increase in net spending of $174.2 million or 12.8% is due to an increase in operating costs of $71.7 million, and a combined increase of $102.5 million in grants, and contributions and other transfer payments. Factors contributing to the net increase include:
-
$80.0 million in funding related to the Canada–Ontario Immigration Agreement which is designed to help newcomers successfully integrate into Ontario communities and achieve their full potential; and
-
$48.4 million to manage immigration pressures in North America.
Finance – International Transfer Payments ↑ $80.8 million
Finance plans to increase its international grant assistance by $80.8 million or 13.8% in 2010-11 for compensation to Canadian agencies or entities for reduction of debts of debtor countries.
International Development Research Centre ↑ $19.6 million
The International Development Research Centre's net appropriation requirements are increasing by $19.6 million or 12.1% due to an increase in operating costs. The bulk of the funding is for the implementation of the Development Innovation Fund, which aims to support leading-edge scientific global health research that improves the lives of the poor in developing countries by mobilizing the scientific community to address priority areas for health research, and by the use of research findings to address development challenges.
Industrial, Regional and Scientific-Technological Support Programs $15.7 billion
The industrial, regional and scientific–technological support programs sector comprises those departments, agencies and Crown Corporations that deliver programs which foster economic growth and job creation through measures that stimulate private-sector investment across Canada, encourage regional development, improve the country's innovation performance, and promote a stronger science and technology capability in Canada. Organizations include Office of Infrastructure of Canada, Industry, the five regional development agencies, and Crown Corporations, including Enterprise Cape Breton Corporation, as well as a number of departmental agencies such as the National Research Council, the Social Sciences and Humanities Research Council and the Natural Sciences and Engineering Research Council.
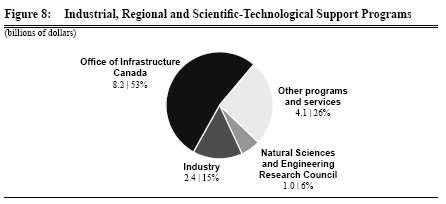
Table 10: Industrial, Regional and Scientific-Technological Support Programs
| Change | ||||||||
| 2010-11 | 2009-10 | $ | % | |||||
| (thousands) | ||||||||
| Office of Infrastructure of Canada | 8,182,658 | 4,160,714 | 4,021,944 | 96.7 | ||||
| Industry | 2,412,708 | 1,188,043 | 1,224,665 | 103.1 | ||||
| Natural Sciences and Engineering Research Council | 1,020,198 | 968,403 | 51,795 | 5.3 | ||||
| National Research Council of Canada | 748,969 | 705,159 | 43,810 | 6.2 | ||||
| Social Sciences and Humanities Research Council | 674,917 | 652,611 | 22,305 | 3.4 | ||||
| Federal Economic Development Agency for Southern Ontario | 506,965 | . . . . . | 506,965 | N/A | ||||
| Economic Development Agency for the Regions of Quebec | 429,162 | 287,428 | 141,734 | 49.3 | ||||
| Western Economic Diversification | 428,958 | 241,771 | 187,187 | 77.4 | ||||
| Canadian Space Agency | 390,757 | 355,088 | 35,669 | 10.0 | ||||
| Atlantic Canada Opportunities Agency | 382,140 | 332,418 | 49,722 | 15.0 | ||||
| PPP Canada Inc | 255,200 | 82,900 | 172,300 | 207.8 | ||||
| Canadian Tourism Commission | 100,643 | 83,526 | 17,117 | 20.5 | ||||
| Enterprise Cape Breton Corporation | 83,070 | 8,650 | 74,420 | 860.3 | ||||
| Canadian Northern Economic Development Agency | 61,203 | . . . . . | 61,203 | N/A | ||||
| Canada Industrial Relations Board | 13,017 | 12,587 | 430 | 3.4 | ||||
| Standards Council of Canada | 7,129 | 7,129 | . . . . . | . . . . . | ||||
| Copyright Board | 3,110 | 2,624 | 486 | 18.5 | ||||
| Registry of the Competition Tribunal | 2,066 | 2,012 | 54 | 2.7 | ||||
| Cape Breton Development Corporation | . . . . . | 73,484 | (73,484) | (100.0) | ||||
| Total. | 15,702,871 | 9,164,547 | 6,538,324 | 71.3 | ||||
As presented in these Main Estimates, proposed spending in the Industrial, Regional and Scientific–Technological Support Programs Sector in 2010-11 is estimated at $15.7 billion, which represents 6.0% of total program spending. Compared to the previous year's Main Estimates, the spending level in 2010-11 is set to increase by $6.5 billion or 71.3% .
Office of Infrastructure Canada ↑ $4.0 billion
The Office of Infrastructure Canada's increase in spending of $4.0 billion or 96.7% is due to an increase in operating costs of $17.6 million, and an increase in contributions and other transfer payments of $4,004.3 million. Factors contributing to the net increase include:
-
$2,862.8 million for the Infrastructure Stimulus Fund which provides funding to provincial, territorial and municipal contruction-ready infrastructure rehabilitation projects;
-
$386.3 million for the Green Infrastructure Fund which supports sustainable energy generation and transmission, along with municipal wastewater and solid waste management infrastructure;
-
$385.2 million for the Building Canada Fund Communities Component Top Up which funds additional infrastructure projects in communities with populations of less than 100,000 persons and with infrastructure needs related to 18 approved categories of project investment. The additional Top-Up funds were initiated in view of the current economic crisis when the government undertook to accelerate funding over the next two years to provide stimulus to the economy, under the Economic Action Plan (Budget 2009).
-
$262.6 million for the Building Canada Fund Communities Component which focusses on projects in communities with populations of less than 100,000 in order to help them face their unique challenges;
-
$261.2 million for the Provincial–Territorial Infrastructure Base Funding which can be used for construction or rehabilitation of infrastructure in almost all Building Canada Fund eligible categories, as well as for Highway System infrastructure; and
-
$173.6 million for the Building Canada Fund Major Infrastructure Component which will target larger, strategic projects of national and regional significance.
Industry ↑ $1.2 billion
Industry's increase in net spending of $1.2 billion or 103.1% is due to an increase in operating costs of $55.3 million, and an increase in contributions and other transfer payments of $1,203.1 million. This increase was partially offset by a reduction of $44.5 million in grants. Factors contributing to the net increase include:
-
$999.7 million available under the Knowledge Infrastructure Program to support deferred maintenance repair and expansion projects at post-secondary institutions across Canada;
-
$171.8 million to the Broadband Program to provide federal funding via a contribution program to increase the availability of broadband Internet services to Canadian households within defined geographic service areas;
-
$74.4 million under the Canada Foundation for Innovation Program to support the modernization of research infrastructure at Canadian universities, colleges, research hospitals and other not-for-profit research institutions across Canada; and
-
$49.9 million to the Marquee Tourism Events Program to help existing marquee tourism events enhance their offerings and deliver world-class programs and experiences.
Natural Sciences and Engineering Research Council ↑ $51.8 million
The Natural Sciences and Engineering Research Council's increase in net spending of $51.8 million or 5.3% is due to an increase in operating costs of $1.4 million, and an increase of $50.4 million in grants; the major item being $34.0 million to support collaborative research that directly contributes to the knowledge and innovation needs of Canada's automotive, manufacturing, forestry and fishing industries.
National Research Council of Canada ↑ $43.8 million
The National Research Council of Canada's increase in spending of $43.8 million or 6.2% is due to a combined increase in grants, and contributions and other transfer payments of $72.4 million, partially offset by a decrease in operating costs of $34.5 million. The major item is $110.4 million for the Industrial Research Assistance Program and Modernizing Federal Laboratories.
Social Sciences and Humanities Research Council ↑ $22.3 million
The Social Sciences and Humanities Research Council's increase in net spending of $22.3 million or 3.4% is primarily due to an increase in contributions and other transfer payments of $21.6 million. Factors contributing to the net increase include: $15.0 million to support the Indirect Costs of Research program; and $12.0 million to support a better understanding of how the environment affects the lives of Canadians and of the social and economic development needs of northern communities.
Federal Economic Development Agency for Southern Ontario ↑ $507.0 million
The Federal Economic Development Agency for Southern Ontario is a new organization in the Industry portfolio that was created by Order in Council on August 13, 2009. The purpose of this organization is to help workers, businesses and communities in Southern Ontario take advantage of opportunities as economic growth recovers in Canada and around the world. Initial funding of $507.0 million is being provided for start up. Of this amount, the bulk of the funding is $444.7 million for contributions and other transfer payments.
Economic Development Agency of Canada for the Regions of Quebec ↑ $141.7 million
The Economic Development Agency of Canada for the Regions of Quebec's increase in net spending of $141.7 million or 49.3% is due to an increase in operating costs of$5.7 million and an increase in contributions and other transfer payments of $136.9 million. Factors contributing to the net increase include:
-
$105.2 million to foster economic development, science and technology initiatives and other measures to promote economic diversification in Canadian communities (Community Adjustment Fund);
-
$45.1 million to support construction activities related to recreational infrastructure; and
-
$23.7 million to implement the Support Initiative for International Cruise Ship Development on the St. Lawrence and Saguenay Rivers which is aimed at upgrading port facilities for the berthing of large cruise ships and for the enhancement of tourist attractions in Quebec.
Western Economic Diversification ↑ $187.2 million
increase in net spending of $187.2 million or 77.4% is due to an increase in operating costs of $14.2 million, and an increase in contributions and other transfer payments of $172.9 million. Factors contributing to the net increase include:
-
$152.6 million for the Community Adjustment Fund. A Budget 2009 economic stimulus initiative to create employment opportunities and support adjustment measures in communities impacted by the economic downturn; and
-
$88.4 million for the delivery of Recreational Infrastructure Canada, a Budget 2009 economic stimulus initiative that will help reduce the impacts of the global recession while renewing, upgrading and expanding recreational infrastructure across Western Canada.
Canadian Space Agency ↑ $35.7 million
The Canadian Space Agency's increase in spending of $35.7 million or 10.0% is due to an increase in operating costs of $45.1 million, and an increase of $1.0 million in grants. These increases were partially offset by reductions totalling $10.5 million in capital and contributions and other transfer payments. The increase is mainly attributable to Budget 2009 wherein the agency was granted a sum of $110 million over three years to support the Canadian space industry in developing advanced robotic applications and other space technologies.
Atlantic Canada Opportunities Agency ↑ $49.7 million
The Atlantic Canada Opportunities Agency's increase in net spending of $49.7 million or 15.0% is due to an increase in operating costs of $6.0 million, and an increase in contributions and other transfer payments of $43.7 million; the major item being $50 million to foster economic development, science and technology initiatives and other measures to promote economic diversification in Canadian communities (Community Adjustment Fund).
PPP Canada Incorporated ↑ $172.3 million
PPP Canada Incorporated's net appropriation requirements are increasing by $172.3 million or 207.8% in order to reflect the planned growth in the activities and investments in public– private partnerships by the Corporation.
Canadian Tourism Commission ↑ $17.1 million
The Canadian Tourism Commission's net appropriation requirements are increasing by $17.1 million as a result of funding from Budget 2009 (Canada Economic Action Plan) in order to invest in a new domestic advertising program to encourage Canadians to travel within the country and in new programs focused on exploiting the US leisure market and the international meeting and travel market.
Enterprise Cape Breton Corporation ↑ $74.4 million
Enterprise Cape Breton Corporation's net appropriation requirements are increasing by $74.4 million since it will be assuming responsibility for all existing Cape Breton Development Corporation assets and liabilities upon its dissolution, effective December 31, 2009.
Canadian Northern Economic Development Agency ↑ $61.2 million
The Canadian Northern Economic Development Agency was created by Order in Council on August 18, 2009 and is being provided with 61.2 million in funding in 2010-11 as a result of the transfer of responsibility for the control and supervision of the portion of the federal public administration in the Department of Indian Affairs and Northern Development known as the Northern Economic Development Branch.
Environment and Resource-based Programs $11.5 billion
The environment and resource-based programs sector comprises those departments, agencies and Crown Corporations that deliver programs that promote the sustainable development of Canada's environment, natural resources, and agriculture industries. These organizations include Natural Resources, Agriculture and Agri-Food, Fisheries and Oceans, and Environment.
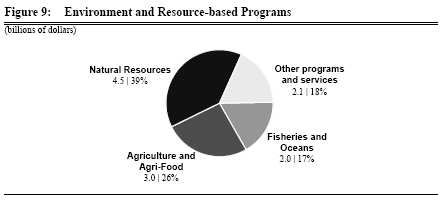
Table 11: Environment and Resource-based Programs
| Change | ||||||||
| 2010-11 | 2009-10 | $ | % | |||||
| (thousands) | ||||||||
| Natural Resources | 4,452,723 | 3,639,905 | 812,819 | 22.3 | ||||
| Agriculture and Agri-Food | 2,990,142 | 2,649,600 | 340,542 | 12.9 | ||||
| Fisheries and Oceans | 1,967,737 | 1,641,516 | 326,221 | 19.9 | ||||
| Environment | 1,094,065 | 992,583 | 101,482 | 10.2 | ||||
| Canadian Food Inspection Agency | 645,426 | 572,045 | 73,381 | 12.8 | ||||
| Canadian Nuclear Safety Commission | 131,422 | 142,731 | (11,309) | (7.9) | ||||
| Atomic Energy of Canada Limited | 102,452 | 108,691 | (6,239) | (5.7) | ||||
| National Energy Board | 52,549 | 44,380 | 8,169 | 18.4 | ||||
| Canadian Environmental Assessment Agency | 28,960 | 32,049 | (3,089) | (9.6) | ||||
| Canadian Grain Commission | 5,394 | 5,197 | 197 | 3.8 | ||||
| National Round Table on the Environment and the Economy | 5,243 | 5,134 | 110 | 2.1 | ||||
| Canadian Dairy Commission | 3,981 | 3,721 | 261 | 7.0 | ||||
| Northern Pipeline Agency | 1,321 | 264 | 1,057 | 400.0 | ||||
| Total. | 11,481,416 | 9,837,816 | 1,643,600 | 16.7 | ||||
As presented in these Main Estimates, proposed spending in the Environment and Resource-Based Programs Sector in 2010-11 is estimated at $11.5 billion, which represents 4.4% of total program spending. Compared to the previous year's Main Estimates, the 2010-11 spending in this sector is forecast to increase by $1.6 billion, or 16.7% .
Natural Resources ↑ $812.8 million
Natural Resources' increase in net spending of $812.8 million or 22.3% is due to an increase in operating costs of $119.4 million, an increase in capital of $11.1 million, and a combined increase in grants, contributions and other transfer payments of $687.8 million. Factors contributing to the net increase include:
-
$649.8 million for the Pulp and Paper Green Transformation program which will lay the groundwork for a greener, more sustainable future for Canada's pulp and paper sector by supporting innovation and environmentally friendly investments in areas such as energy efficiency and renewable energy production;
-
$174.9 million for the Clean Energy Fund which will provide funding over five years for the demonstration of promising technologies, including large-scale carbon capture and storage projects, and renewable energy and clean energy systems demonstrations;
-
$389.9 million for the ecoEnergy Retrofit – Homes project which provides funding to home and property owners with grants up to $5,000 per unit to offset the cost of making energy efficiency improvements;
-
$107.3 million for the Investing in Canada's Forest Sector program which promotes the sustainable development of Canada's forests and the competitiveness of the Canadian forest sector;
-
$87.9 million for the Clean Energy Agenda; and
-
$70.0 million for the ecoEnergy for Biofuels project whose goal is to expand the production and use of cleaner, renewable biofuels such as ethanol and biodiesel.
Agriculture and Agri-Food ↑ $340.5 million
Agriculture and Agri-Food's increase in net spending of $340.5 million or 12.9% is due to an increase in operating costs of $105.6 million, an increase in capital of $16.3 million, and an increase in contributions and other transfer payments of $340.4 million. These increases are partially offset by a decrease of $120.4 million in grants. Factors contributing to the net increase include:
$124.2 million for the Agricultural Flexibility Fund to help the agriculture sector improve its competitiveness
-
$124.2 million for the Agricultural Flexibility Fund to help the agriculture sector adapt to pressures and improve its competitiveness;
-
$63.9 million in support of the AgriStability program to provide income support for larger income losses;
-
$41.2 million for assistance to the Pork Industry Initiative to help the pork and hog industry recover and transition to new market realities;
-
$35.1 million for the ecoAgriculture Biofuels Capital Initiative to ensure that agricultural producers have an opportunity to invest and participate in the emerging renewable fuels industry;
-
$20.9 million for the Slaughter Improvement program to strengthen the competitiveness of Canada's red meat packing and processing industry;
-
$19.3 million for Modernizing Federal Labs; and
-
$19.0 million additional funding related to amendments to the Agricultural Marketing Programs Act to expand the conditions for emergency advances to help swine and cattle producers under the Advance Payments program.
Fisheries and Oceans ↑ $326.2 million
Fisheries and Oceans' increase in net spending of $326.2 million or 19.9% is due to an increase in operating costs of $120.7 million, an increase in capital of $184.9 million and a combined increase in grants, and contributions and other transfer payments of $18.7 million. Factors contributing to the net increase include:
-
$97.4 million for the Small Craft Harbours program to undertake dredging and to accelerate the repair and maintenance of core commercial harbours across Canada and the Northwest Territories;
-
$85.0 million for the Canadian Coast Guard fleet to be used for vessel procurement, life extensions and refits; and
-
$32.5 million for the mid Shore Patrol Vessels project which is designed to provide four new vessels to be used primarily for fisheries patrols for domestic overfishing infractions and conservation and protection enforcement.
Environment ↑ $101.5 million
Environment's increase in net spending of $101.5 million or 10.2% is due to an increase in operating costs of $65.0 million, an increase in capital of $6.5 million, and a combined increase in grants, and contributions and other transfer payments of $28.9 million. Factors contributing to the net increase include:
-
$41.0 million for the Clean Air Agenda which will serve to inform Canada's domestic regulatory approach to greenhouse gas emissions, provide a platform to deepen engagement with the US on climate change issues, and enhance Canada's visibility as an international leader in clean energy technology; and
-
$25 million for Environmental Sustainable Development Technology Canada which is a 7–year funding agreement between the Government of Canada, as represented by Natural Resources Canada and Environment Canada, and the Canada Foundation for Sustainable Development Technology for delivery of the Next Generation Biofuels.
Canadian Food Inspection Agency ↑ $73.4 million
The Canadian Food Inspection Agency's increase in net spending of $73.4 million or 12.8% is due to an increase in operating costs of $56.5 million, and an increase in capital of $13.7 million. Factors contributing to the net increase include:
-
$36.9 million to continue a comprehensive strategy for managing Bovine Spongiform Encephalopathy (BSE) in Canada;
-
$14.2 million to implement projects approved under the Modernizing Federal Laboratories Initiative announced in Budget 2009; and
-
$11.0 million for strengthening and modernizing Canada's safety system for health, consumer and food products to protect the health of Canadians, through program investments and legislative amendments.
Security and Public Safety Programs $7.9 billion
The security and public safety programs sector comprises those departments and agencies that deliver programs which are intended to close security gaps and ensure that the country's national interests and citizens are protected from risks to personal safety ranging from crime or naturally occurring events such as severe blizzards, floods or forest fires, to threats to national security from terrorist activity. Organizations include: the portfolio of Public Safety and Emergency Preparedness, including the Royal Canadian Mounted Police; the Canadian Security Intelligence Service; the Canada Border Services Agency; Correctional Service; and the National Parole Board.
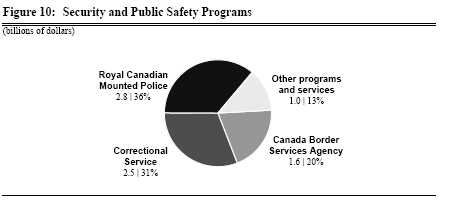
Table 12: Security and Public Safety Programs
| Change | ||||||||
| 2010-11 | 2009-10 | $ | % | |||||
| (thousands) | ||||||||
| Royal Canadian Mounted Police | 2,813,950 | 2,647,206 | 166,744 | 6.3 | ||||
| Correctional Service | 2,460,249 | 2,204,517 | 255,733 | 11.6 | ||||
| Canada Border Services Agency | 1,619,390 | 1,483,029 | 136,361 | 9.2 | ||||
| Canadian Security Intelligence Service | 506,573 | 496,357 | 10,215 | 2.1 | ||||
| Public Safety and Emergency Preparedness | 440,729 | 422,086 | 18,643 | 4.4 | ||||
| National Parole Board | 46,407 | 46,178 | 229 | 0.5 | ||||
| Royal Canadian Mounted Police Public | ||||||||
| Complaints Commission | 5,388 | 5,181 | 207 | 4.0 | ||||
| Office of the Correctional Investigator | 3,557 | 3,176 | 381 | 12.0 | ||||
| Security Intelligence Review Committee | 2,996 | 2,926 | 70 | 2.4 | ||||
| Royal Canadian Mounted Police External Review Committee | 1,811 | 1,074 | 737 | 68.6 | ||||
| Total. | 7,901,049 | 7,311,730 | 589,319 | 8.1 | ||||
As presented in these Main Estimates, proposed spending in the Security and Public Safety Programs Sector in 2010-11 is estimated at $7.9 billion, or 3.0% of total program spending. Compared to the previous year's Main Estimates, this sector's spending in 2010-11 has increased by $589.3 million or 8.1% .
Royal Canadian Mounted Police ↑ $166.7 million
The Royal Canadian Mounted Police's increase in net spending of $166.7 million or 6.3% is due to an increase in operating costs of $269.7 million, partially offset by a decrease of $28.8 million in capital. Factors contributing to the net increase include:
-
$83.5 million to fund incremental resources requested by provinces, territories, and municipalities under policing services agreements;
-
$70 million to fund initiatives under the Government Economic Action Plan;
-
$56.5 million for the introduction of the new Operational Response Allowance Policy and Service Pay improvements, in response to the Task Force on Governance and Cultural Change recommendations;
-
$30.5 million to enforce the law against serious criminal capital market fraud offences in Canada (Integrated Market Enforcement Teams program);
-
$27.3 million for the additional RCMP positions and federal prosecutors to focus on law enforcement priorities such as drugs, corruption and border security; and
-
$25.6 million for the RCMP pension administration for costs associated with the project to migrate the RCMP's pension administration services to the Government of Canada Pension Modernization Project at Public Works and Government Services.
Correctional Service ↑ $255.7 million
The Correctional Service's increase in net spending of $255.7 million or 11.6% is due to an increase in operating costs of $153.5 million, and an increase in capital of $98.6 million. Factors contributing to the net increase include: $87.2 million for implementation of the Government's Truth in Sentencing Act (Bill C–25); and $84.6 million related to various accommodation measures for the maintenance and housing of offenders as approved in the National Capital, Accommodation and Operations Plan.
Canada Border Services Agency ↑ $136.4 million
The Canada Border Services Agency's increase in net spending of $136.4 million or 9.2% is due to an increase in operating costs of $97.6 million, and an increase in capital of $38.8 million. Factors contributing to the net increase include: $104.0 million for collective agreements; $31.7 million in additional on-going funding to ensure the agency continues to achieve its mandate of providing integrated border services that supports national security and public safety priorities and facilitates the free flow of people and goods; and $30.0 million to modernize three ports of entry in British Columbia (Kingsgate, Pacific Highway, Huntingdon) and one in Ontario (Prescott) which supports the economic recovery plan of the government.
Public Safety and
Emergency Preparedness ↑ $18.6 million
Public Safety and Emergency Preparedness' increase in net spending of $18.6 million or 4.4% is due mainly to an increase in contributions and other transfer payments of which $16.5 million is for Short-Term Sustainability of Policing Agreements & Program Review of First Nations Policing Program and $1.2 million is for the Renewal of the Strategy for the Protection of Children from Sexual Exploitation on the Internet.
Cultural Programs $4.0 billion
The cultural programs sector comprises those departments, agencies and Crown Corporations that deliver programs which support the growth and development of Canadian cultural life, participation and equity in Canadian society, the nation's linguistic duality and diverse multicultural heritage, and the preservation of its national parks, historic sites and heritage.
Organizations include the Department of Canadian Heritage and its associated agencies as well as certain Crown Corporations and departmental agencies.
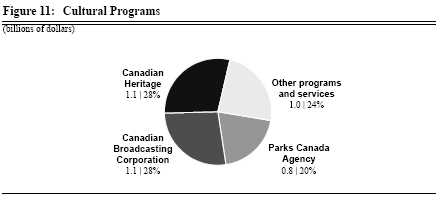
Table 13: Cultural Programs
| Change | ||||||||
| 2010-11 | 2009-10 | $ | % | |||||
| (thousands) | ||||||||
| Canadian Heritage | 1,145,949 | 1,254,446 | (108,497) | (8.6) | ||||
| Canadian Broadcasting Corporation | 1,090,906 | 1,052,608 | 38,298 | 3.6 | ||||
| Parks Canada Agency | 804,955 | 619,306 | 185,649 | 30.0 | ||||
| Canada Council for the Arts | 181,697 | 180,786 | 911 | 0.5 | ||||
| Library and Archives of Canada | 120,285 | 121,383 | (1,098) | (0.9) | ||||
| National Capital Commission | 117,361 | 110,140 | 7,221 | 6.6 | ||||
| Telefilm Canada | 105,418 | 104,662 | 756 | 0.7 | ||||
| National Film Board | 67,218 | 65,062 | 2,155 | 3.3 | ||||
| Canadian Museum of Civilization | 65,325 | 62,266 | 3,059 | 4.9 | ||||
| Canadian Museum for Human Rights | 55,850 | 1,500 | 54,350 | 3,623.3 | ||||
| National Gallery of Canada | 49,266 | 49,672 | (406) | (0.8) | ||||
| National Arts Centre Corporation | 35,183 | 35,175 | 8 | . . . . . | ||||
| Office of the Co-ordinator, Status of Women | 30,840 | 29,648 | 1,191 | 4.0 | ||||
| National Museum of Science and Technology | 30,684 | 34,604 | (3,920) | (11.3) | ||||
| Canadian Museum of Nature | 30,361 | 32,385 | (2,024) | (6.3) | ||||
| Old Port of Montreal Corporation Inc. | 28,073 | 19,800 | 8,273 | 41.8 | ||||
| National Battlefields | 9,472 | 9,319 | 154 | 1.6 | ||||
| Canadian Radio-television | ||||||||
| and Telecommunications Commission | 5,665 | 5,352 | 313 | 5.8 | ||||
| Canadian Artists and Producers Professional Relations Tribunal | 2,068 | 2,008 | 59 | 3.0 | ||||
| Total. | 3,976,576 | 3,790,124 | 186,451 | 4.9 | ||||
As presented in these Main Estimates, proposed spending in the Cultural Programs Sector in 2010-11 is estimated at $4.0 billion, which represents approximately 1.5% of total program spending. Compared to the previous year's Main Estimates, this sector's spending in 2010-11 is set to increase by $186.5 million or 4.9% .
Canadian Heritage ↓ $108.5 million
Canadian Heritage's decrease in net spending of $108.5 million or 8.6% is due to a decrease in operating costs of $49.3 million, and a decrease in contributions and other transfer payments of $76.1 million, partially offset by an increase in grants of $17.6 million. Factors contributing to the net decrease include:
-
A reduction of $50.3 million for the Vancouver Olympics;
-
A reduction of $35.8 million for the Canadian Culture On-Line Initiative;
-
A reduction of $28.7 million due to the transfer of responsibilities for the multiculturalism and Historical Recognition Programs to Citizenship and Immigration Canada; and
-
A reduction of $24.9 million for the Aboriginal Peoples' Program – Urban Multipurpose Aboriginal Youth Centre.
Canadian Broadcasting Corporation ↑ $38.3 million
The Canadian Broadcasting Corporation's net appropriation requirements are increasing by $38.3 million or 3.6% primarily due to collective agreement adjustments. Revenues are projected to decrease by $34.0 million due to the global economic downturn.
Parks Canada Agency ↑ $185.6 million
The Parks Canada Agency's increase in net spending of $185.6 million or 30% is due to an increase in operating costs of $36.4 million, $150.3 million in capital and a reduction of $1.1 million in contributions and other transfer payments. Factors contributing to the net increase include:
-
$79.9 million for improvements and upgrades to national historic sites and Parks Canada's visitor facilities; and
-
$50.0 million for upgrading a section of the Trans-Canada Highway from a two-lane undivided highway to a four-lane divided highway in Banff National Park and reach the British Columbia border in order to improve public safety and accommodate the increased volume in commercial as well as tourist traffic.
Canadian Museum for Human Rights ↑ $54.4 million
The Canadian Museum for Human Rights's net appropriation requirements are increasing by $54.4 million, most of which is for the construction of the 47,000 square foot Museum facility.
Transportation Programs $2.9 billion
The transportation programs sector comprises those departments, agencies, and Crown Corporations that deliver transportation programs. Organizations include the Department of Transport, several Crown Corporations such as VIA Rail, the Canadian Air Transport Security Authority, and Marine Atlantic Incorporated as well as a number of departmental agencies.
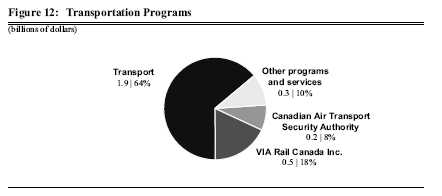
Table 12: Transportation Programs
| Change | ||||||||
| 2010-11 | 2009-10 | $ | % | |||||
| (thousands) | ||||||||
| Transport | 1,867,272 | 1,448,150 | 419,122 | 28.9 | ||||
| VIA Rail Canada Inc | 523,721 | 351,917 | 171,804 | 48.8 | ||||
| Canadian Air Transport Security Authority | 243,556 | 262,479 | (18,923) | (7.2) | ||||
| Marine Atlantic Inc | 108,202 | 101,283 | 6,919 | 6.8 | ||||
| The Jacques Cartier and Champlain Bridges Incorporated | 60,558 | 46,618 | 13,940 | 29.9 | ||||
| Federal Bridge Corporation Limited | 55,639 | 40,895 | 14,744 | 36.1 | ||||
| Canadian Transportation Accident Investigation | ||||||||
| and Safety Board | 29,786 | 28,944 | 842 | 2.9 | ||||
| Canadian Transportation Agency | 27,310 | 26,152 | 1,158 | 4.4 | ||||
| Transportation Appeal Tribunal of Canada | 1,417 | 1,337 | 79 | 5.9 | ||||
| Total. | 2,917,460 | 2,307,776 | 609,685 | 26.4 | ||||
As presented in these Main Estimates, proposed spending in the Transportation Programs Sector in 2010-11 is estimated at $2.9 billion, which represents approximately 1.1% of total program spending. Compared to the previous year's Main Estimates, this sector's spending in 2010-11 is set to increase by $609.7 million, or 26.4% .
Transport ↑ $419.1 million
Transport's increase in net spending of $419.1 million or 28.9% is due primarily to a change in the accounting for airport lease rent revenues; however, the department is also showing an increase of $49.2 million in operating costs as well as an increase of $140.2 million in capital. Factors contributing to the net increase include:
-
$235.7 million to compensate the department for a change in accounting which will see Airport rent revenues deposited directly to the Consolidated Revenue Fund rather than being credited to the vote;
-
$134.5 million in Capital funding to buy land required for the new Detroit River Crossing Major Crown Project which is part of a long term transportation strategy that would ensure the safe and efficient movement of people, goods and services across the United States and Canadian border within the region of Southeast Michigan and Southwest Ontario, including improved connections to national, provincial, and regional transportation systems; and
-
$72.8 million in funding for projects related to Canada's Economic Action Plan.
VIA Rail ↑ $171.8 million
VIA Rail's net appropriation requirements are increasing by $171.8 million or 48.8% . This is based on an additional $174.3 million for major equipment maintenance, overhaul, and certain capital projects, offset by a reduction of $2.5 million in operating costs.
Canadian Air Transport Security Authority ↑ $18.9 million
The Canadian Air Transport Security Authority's net appropriation requirements are decreasing by $18.9 million or 7.2% and is due to a decrease in capital planned funding because of the completion of some of the airport expansion projects and equipment purchases.
Justice and Legal Programs $1.5 billion
The justice and legal program sector comprises those departments and agencies that deliver programs covering the administration of justice and law enforcement. Organizations include the Department of Justice and all of its associated agencies.
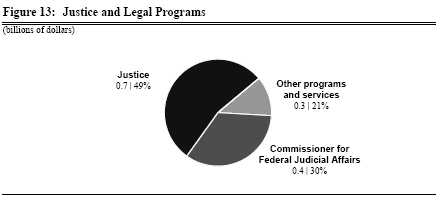
Table 15: Justice and Legal Programs
| Change | ||||||||
| 2010-11 | 2009-10 | $ | % | |||||
| (thousands) | ||||||||
| Justice | 712,271 | 689,429 | 22,842 | 3.3 | ||||
| Commissioner for Federal Judicial Affairs | 439,462 | 424,736 | 14,726 | 3.5 | ||||
| Office of the Director of Public Prosecutions | 158,879 | 155,968 | 2,912 | 1.9 | ||||
| Courts Administration Service | 59,709 | 61,074 | (1,365) | (2.2) | ||||
| Offices of the Information and Privacy Commissioners of | ||||||||
| Canada | 34,453 | 30,829 | 3,624 | 11.8 | ||||
| Supreme Court of Canada | 29,401 | 28,606 | 796 | 2.8 | ||||
| Canadian Human Rights Commission | 22,475 | 20,651 | 1,824 | 8.8 | ||||
| Canadian Human Rights Tribunal | 4,510 | 4,406 | 104 | 2.4 | ||||
| Total justice and legal programs | 1,461,160 | 1,415,698 | 45,462 | 3.2 | ||||
As presented in these Main Estimates, proposed spending in the Justice and Legal
Programs Sector in 2010-11 is estimated at $1.5 billion, which represents less than 1% of total program spending. Compared to the previous year's Main Estimates, this sector's spending in 2010-11 is set to increase by $45.5 million, or 3.2% .
Justice ↑ $22.8 million
Justice's increase in net spending of $22.8 million or 3.3% is due to an increase in operating costs of $43.5 million, and an increase in contributions and other transfer payments of $16.6 million; the major item being $23.9 million for the Supporting Families Experiencing Separation and Divorce Initiative.
Commissioner for Federal Judicial Affairs ↑ $14.7 million
The Commissioner for Federal Judicial Affairs's increase in net spending of $14.7 million or 3.5% is due mainly to an increase in the number of judicial appointments as well as an increase in the overall average in the amounts of pensions being paid to pensioners in accordance with the Judges Act as well as a provision for a salary increase to federally appointed judges contained in the Judges Act .
Parliament and Governor General $603.0 million
The Parliament and Governor General sector includes the Senate, the House of Commons, the Library of Parliament, the Office of the Secretary to the Governor General, as well as the Office of the Conflict of Interest and Ethics Commissioner, and the Senate Ethics Officer. The requirements of each of these organizations are appropriated annually. The Board of Internal Economy approves the requirements of the House of Commons, whereas the Standing Committee of Internal Economy, Budgets and Administration approves the Senate's requirements. The Speakers of both Houses approve the requirements of the Library of Parliament. The Speaker of the House of Commons approves the requirements of the Office of the Conflict of Interest and Ethics Commissioner, while the Speaker of the Senate approves the requirements of the Senate Ethics Officer. There are no parliamentary officers or committees involved in the approval of the requirements of the Office of the Secretary to the Governor General.
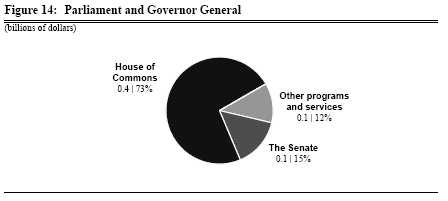
Table 16: Parliament and Governor General
| Change | ||||||||
| 2010-11 | 2009-10 | $ | % | |||||
| (thousands) | ||||||||
| House of Commons | 440,312 | 426,541 | 13,771 | 3.2 | ||||
| The Senate | 92,871 | 90,606 | 2,265 | 2.5 | ||||
| Library of Parliament | 42,456 | 40,307 | 2,149 | 5.3 | ||||
| Governor General | 19,716 | 18,947 | 769 | 4.1 | ||||
| Office of the Conflict of Interest and Ethics | 7,105 | 7,105 | . . . . . | . . . . . | ||||
| Senate Ethics Officer | 823 | 806 | 17 | 2.1 | ||||
| Total Parliament and Governor General | 603,284 | 584,312 | 18,971 | 3.2 | ||||
As presented in these Main Estimates, proposed spending in the Parliament and Governor General Sector in 2010-11 is estimated at $603.3 million, which represents less than 1% of total program spending. Compared to the previous year's Main Estimates, this sector's spending is set to increase by $19.0 million, or 3.2% .
Non-Budgetary Expenditures
For the 2010-11 Main Estimates recoveries are expected to exceed expenditures by $2.2 billion for non-budgetary items. This amounts to a reduction of $2.6 billion or 732.3% compared to the 2009-10 Main Estimates.
Table 17: Net Non-Budgetary Expenditures
| Change | ||||||||
| 2010-11 | 2009-10 | $ | % | |||||
| (thousands) | ||||||||
| Human Resources and Skills Development | 765,111 | 595,969 | 169,142 | 28.4 | ||||
| Indian Affairs and Northern Development | 77,803 | 77,803 | . . . . . | . . . . . | ||||
| Industry | 800 | 800 | . . . . . | . . . . . | ||||
| Finance | . . . . . | 1,749 | (1,749) | (100.0) | ||||
| Foreign Affairs and International Trade | (552,000) | (120,500) | (431,500) | 358.1 | ||||
| Canada Mortgage and Housing Corporation | (2,504,996) | (205,794) | (2,299,202) | 1,117.2 | ||||
| Total non-budgetary | (2,213,282) | 350,027 | (2,563,309) | (732.3) | ||||
Canada Mortgage and Housing Corporation ↓ $2.3 billion
The Canada Mortgage and Housing Corporation is estimating a non-budgetary spending decrease of $2.3 billion due to $4.5 billion in non-budgetary scheduled repayments under the Crown Borrowing Program. The loan repayments include $3.6 billion in the Insured Mortgage Purchase Plan and $938.4 million for Direct Lending renewals and loan repayments. This spending decrease is partially offset by $2.2 billion in non-budgetary loan advances to finance existing Direct Lending Activity as renewals occur as well advances made in support of new capital commitments over the planning period, primarily for the Municipal Infrastructure Loan Program under Canada's Economic Action Plan.
Finance ↓ $1.7 million
Finance is estimating a $1.7 million decrease in payments and encashment of notes tothe European Bank for Reconstruction and Development (ERBD) – capital subscriptions. The decrease reflects the agreed schedule of Canada's payments and encashments for the ERBD's 1998 capital subscription increase and the impacts of exchange rate changes.
Human Resources and Skills Development ↑ $169.1 million
Human Resources and Skills Development is estimating a net increase of $169.1 million related to the loans negotiated and the repayments under the Canada Student Financial Assistance Act . The Office of the Chief Actuary has revised the forecast from a 1.7% increase to a 7.5% increase in the amount of new loans issued for the loan year 2009-10 due to the economic context. This increase is offset by a reduction resulting for the coming into force of the new up-front Canada Student Grant Program.
Foreign Affairs and International Trade ↓ $431.5 million
Foreign Affairs and International Trade is estimating a reduction of $431.5 million in loans, investments and advances for payments to the Export Development Corporation to discharge obligations incurred pursuant to Section 23 of the Export Development Act (Canada Account) for the purpose of facilitating trade between Canada and other countries.