ARCHIVED - Statistics Canada - Report
 This page has been archived.
Archived Content
Information identified as archived on the Web is for reference, research or recordkeeping purposes. It has not been altered or updated after the date of archiving. Web pages that are archived on the Web are not subject to the Government of Canada Web Standards. As per the Communications Policy of the Government of Canada, you can request alternate formats on the "Contact Us" page.
2010-11
Departmental Performance Report
Statistics Canada
The original version was signed by
The Honourable Christian Paradis
Minister of Industry and Minister of State (Agriculture)
Table of Contents
Section I: Organizational Overview
- Raison d'�tre
- Responsibilities
- Strategic Outcome and Program Activity Architecture
- Organizational Priorities
- Risk Analysis
- Summary of Performance
- Expenditure Profile
- Estimates by Vote
Section II: Analysis of Program Activities by Strategic Outcome
- Strategic Outcome
Section III: Supplementary Information
- Financial Highlights
- Financial Highlights Charts
- Financial Statements
- List of Supplementary Information Tables
Section IV: Other Items of Interest
Minister's Message

Last year, the Industry Portfolio played a key role in advancing the government's agenda in Year 2 of Canada's Economic Action Plan.
Specific stimulus measures taken by the Industry Portfolio under Canada's Economic Action Plan were aimed at boosting economic development, supporting small and medium-sized enterprises, improving Canada's research and development capacity and strengthening communities. The Portfolio's stimulus measures targeted communities through the Marquee Tourism Events Program and the Broadband Canada: Connecting Rural Canadians program. Further investments in the Industrial Research Assistance Program, the Industrial Research and Development Internship program, the Canada Graduate Scholarships Program and the Knowledge Infrastructure Program expanded Canada's research and development capacity. Investing in the Canadian space industry maintained Canadian expertise and leadership in space robotics. Through these and other stimulus initiatives, we helped create jobs, build communities and nurture the roots of economic recovery.
In 2010–11, Statistics Canada continued to provide Canadians with trusted information in response to the nation's highest priority of supporting public and private decision making. Preparations were completed for the 2011 Census of Population and the new voluntary National Household Survey, which will provide Canadians with a rich source of information. Statistics Canada also continued to renew statistical programs by increasing access to data and the efficiency of its operations.
Cultivating an environment for job creation, growth and competitiveness, both domestically and internationally, remains a priority for the Industry Portfolio. We will work to improve cost-effectiveness and efficiency and will contribute to the Government of Canada's priority of balancing the budget and achieving real results for all Canadians.
It is my pleasure to present Statistics Canada's Departmental Performance Report for 2010-11.
The original version was signed by Christian Paradis, Minister of Industry and Minister of State (Agriculture)
Chief Statistician's Message
Throughout 2010-11, Statistics Canada continued its tradition of providing Canadians with accurate, timely and objective information on the state of Canada's economy, environment and society. The agency published new information releases every business day of the year. For the most important monthly and quarterly economic data, Statistics Canada announced planned release dates a year in advance. Every announced date was met, without exception, ensuring decision makers had the information they required to guide economic and social policy and to manage their affairs.
Statistics Canada also met some unique challenges during 2010-11. The agency implemented major methodology and collection changes in both the 2011 Census and the new voluntary National Household Survey. In other significant developments, a multi-year enhancement of the Consumer Price Index program was successfully launched, and steps were taken to provide extended statistical support to the Harmonized Sales Tax program.
The year also saw substantial progress in a long-term initiative to improve the efficiency, robustness and responsiveness of the agency's business structures, systems, processes and practices. A number of components of the broader initiative were successfully completed, enabling redeployment of funds to ensure the continuity and the quality of Statistics Canada's programs. These investments will also serve to reduce the response burden imposed by surveys on Canadian businesses and farmers.
On behalf of all the employees of Statistics Canada, I invite Canadians to visit our website at www.statcan.gc.ca and make the widest possible use of the agency's information offerings.
The original version was signed by Wayne R. Smith
Chief Statistician of Canada
Section I: Organizational Overview
Raison d'�tre
The Government of Canada established Statistics Canada to ensure that Canadians have access to a trusted source of official statistics on Canada. Access to trusted information is fundamental in an open, democratic society to support decision making by citizens and their elected representatives. A large portion of Statistics Canada's activities is devoted to meeting the needs of federal, provincial and territorial government policy departments and continually measuring Canadian socioeconomic dynamics and emerging trends.
Statistics Canada's mandate comes primarily from the Statistics Act. The act requires that the agency collect, compile, analyse and publish statistical information on the economic, social and general conditions of the country and its people. This mandate covers a broad range of statutory requirements, as well as contractual obligations.
The Statistics Act requires Statistics Canada to conduct a census of population and a census of agriculture every fifth year. The act also confers substantial powers on the agency to collect information for statistical purposes through surveys of businesses and households and through exploiting administrative data held by Canadian institutions.
Statistics Canada is also mandated to co-ordinate and lead the national statistical system, specifically to avoid duplication in the information collected by government. Statistics Canada is a leader among world statistical agencies in reducing reporting burden using administrative data, partnerships and cost-recovery arrangements with other organizations.
Responsibilities
Statistics Canada works to ensure that Canadians have access to a trusted source of statistics on Canada that meet their highest priority information needs. Access to trusted statistical information is an essential underpinning of democratic societies, both to support evidence-based decision making in the public and private sectors and to inform debate on public policy issues.
Under the Constitution Act of 1867, "census and statistics" was made a federal jurisdiction. Parliament has exercised its responsibility for the census and statistics primarily through the Statistics Act. The act creates Statistics Canada as Canada's national statistical office and establishes its mandate, powers and obligations.
Under the Statistics Act, participation in surveys is compulsory for households and businesses, although the agency can declare participation in a survey to be voluntary. This is often done for household surveys. Administrative records can also be acquired to aid the agency's work. In tandem with these powers, Statistics Canada is charged with ensuring the confidentiality of information in its hands and limiting the use of that information to statistical purposes.
Finally, to promote the efficiency of the national statistical system, Statistics Canada is mandated to collaborate with other government departments, as well as with provincial and territorial governments, to develop a well-integrated, coherent national system of statistics that minimizes duplication and reporting burden on households and businesses.
Statistics Canada is also mandated under the Corporations Returns Act to collect and publish information on inter-corporate ownership in Canada, notably foreign ownership of Canadian enterprises. The particularity of the Corporation Returns Act is that it allows Statistics Canada to disclose information on the ownership of individual corporations, something that would be prohibited under the Statistics Act.
Numerous federal and provincial laws and regulations specifically require information from Statistics Canada for their implementation. Some key examples are the Canada Pension Plan Act (Consumer Price Index); the Employment Insurance Act (Labour Force Survey); the Federal–Provincial Fiscal Arrangements Act (numerous economic and demographic measures); the Income Tax Act (Consumer Price Index); the regulations to the Official Languages Act (census data on official languages); and the Electoral Boundaries Readjustment Act (census).
Statistics Canada's Corporate Management Framework illustrates how the agency fulfills its responsibilities. For details on this framework, and on the enablers that allow the strategic outcome to be achieved, please see http://www.statcan.gc.ca/about-apercu/reports2-rapports2-eng.htm.
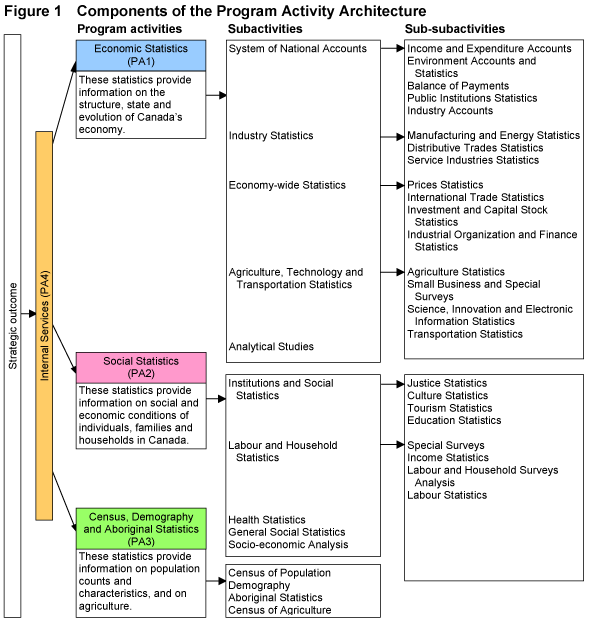
Strategic Outcome and Program Activity Architecture
Statistics Canada is part of the Government Affairs outcome area in the Whole of Government performance framework—a transparent, accountable and responsive federal government—through which the Government of Canada safeguards public trust in government; strengthens the interaction between government and Canadians; delivers services that are responsive to the needs of citizens; and implements measures to ensure the federal government is both transparent and accountable to its citizens. Although the official categorization places Statistics Canada in the Government Affairs domain, the agency contributes to most federal government outcomes in the domains of economic, social, international and government affairs. This contribution is both direct, by informing public debate and decision making outside the federal government, and indirect, by supporting policy formulation, implementation and evaluation within the federal government.
Statistics Canada's strategic outcome, which is supported by a framework of program activities and subactivities, follows:
Strategic Outcome
Canadians have access to timely, relevant and quality statistical information on Canada's changing economy and society for informed debate, research and decision making on social and economic issues.
Statistics Canada's Program Activity Architecture is shown in Figure 1.
Organizational Priorities
To support decision making by Canadians and their elected representatives, Statistics Canada remained committed to providing access to a trusted source of information. The main accomplishments in 2010-11 were to ensure that our information was more easily accessible, that our economic and social statistics remained strong in relevance and quality, that our 2011 Census preparations were completed, and that our operations continue to pursue the highest possible efficiency. The agency also identified and implemented cost-saving measures to accommodate the government's five-year freeze of operating budgets announced in Budget 2010. Notable among these measures were the cancellations of the National Population Health Survey and the Survey of Financing of Small and Medium-sized Enterprises, as well as slight reductions to analytical and dissemination programs.
In Table 1, which follows, the twenty priorities identified in the 2010-11 Report on Plans and Priorities are listed and evaluated. The priorities are enumerated under the four broad priority categories used in the 2011-12 Report on Plans and Priorities. These categories comprise: deliver ongoing economic and social statistics programs; conduct the Census of Population, the Census of Agriculture, and the National Household Survey; continue to renew statistical programs; and improve the agency's business processes and further integrate its results-based corporate infrastructure.
The following scale is used to evaluate performance in both Section I and Section II of this document.
Performance/Priority Status Legend
Exceeded: More than 100% of the expected level of performance (as evidenced by the indicator and target or planned activities and expected outputs) for the expected result or priority identified in the corresponding Report on Plans and Priorities (RPP) was achieved during the fiscal year.
Met all: 100% of the expected level of performance (as evidenced by the indicator and target or planned activities and expected outputs) for the expected result or priority identified in the corresponding RPP was achieved during the fiscal year.
Mostly met: 80 to 99% of the expected level of performance (as evidenced by the indicator and target or planned activities and expected outputs) for the expected result or priority identified in the corresponding RPP was achieved during the fiscal year.
Somewhat met: 60 to 79% of the expected level of performance (as evidenced by the indicator and target or planned activities and expected outputs) for the expected result or priority identified in the corresponding RPP was achieved during the fiscal year.
Not met: Less than 60% of the expected level of performance (as evidenced by the indicator and target or planned activities and expected outputs) for the expected result or priority identified in the corresponding RPP was achieved during the fiscal year.
| Priority | Type1 | Program Activities |
|---|---|---|
| Deliver ongoing economic and social statistics programs | Ongoing | Economic Statistics, Social Statistics |
| Status: Met all | ||
|
||
| 1. Type is defined as follows: 'previously committed to'—committed to in the first or second fiscal year before the subject year of the report; 'ongoing'—committed to at least three fiscal years before the subject year of the report; and 'new'—newly committed to in the reporting year of the DPR. | ||
| Priority | Type1 | Program Activities |
|---|---|---|
| Conduct the Census of Population, the Census of Agriculture, and the National Household Survey | Ongoing | Census, Demography and Aboriginal Statistics |
| Status: Met all | ||
|
||
| 1. Type is defined as follows: 'previously committed to'—committed to in the first or second fiscal year before the subject year of the report; 'ongoing'—committed to at least three fiscal years before the subject year of the report; and 'new'—newly committed to in the reporting year of the DPR. | ||
| Priority | Type1 | Program Activities |
|---|---|---|
| Continue to renew statistical programs | Ongoing | Economic Statistics, Social Statistics, Census, Demography and Aboriginal Statistics |
| Status: Mostly met | ||
|
||
| 1. Type is defined as follows: 'previously committed to'—committed to in the first or second fiscal year before the subject year of the report; 'ongoing'—committed to at least three fiscal years before the subject year of the report; and 'new'—newly committed to in the reporting year of the DPR. | ||
| Priority | Type1 | Program Activity |
|---|---|---|
| Improve the agency's business processes and further integrate its results-based corporate infrastructure | Ongoing | Internal Services |
| Status: Mostly met | ||
|
||
| 1. Type is defined as follows: 'previously committed to'—committed to in the first or second fiscal year before the subject year of the report; 'ongoing'—committed to at least three fiscal years before the subject year of the report; and 'new'—newly committed to in the reporting year of the DPR. 2. New hires include employees who have qualified and have been appointed from the agency's external recruitment programs. These may include current Statistics Canada employees and employees transferred in from other government departments who have met the educational qualifications and required experience identified in the selection process. These qualified candidates are not considered new hires. |
||
Risk Analysis
While risk management has always been an important part of Statistics Canada's operations, significant progress has been made over the past year in bringing risk considerations to the forefront using a risk management model. Forward-looking environmental scans, external consultations, program evaluations and quality review activities are among the mechanisms used to refresh the risk register and corporate risk profile. Decisions are made on how to optimize the organization's structure and business practices with respect to the current and future achievement of corporate objectives. The risk management model helps senior management identify, monitor and prioritize risk management activity and investments.
In the integrated risk management model Statistics Canada has implemented, risks are identified, assessed, addressed and monitored. In 2010-11, senior managers, program managers, and subject-matter experts identified the corporate and operational risks associated with each of the corporate objectives—relevance, trust, access, and stewardship. After considering mitigating strategies, the probability and potential impact of the residual component of that risk was assessed. Where that residual risk was deemed significant, information was collected on the estimated cost of implementing further mitigation strategies and on whether these investments would be worth the cost.
The risk management model includes an agency-wide picture of all identified risks in a detailed risk register and a corporate risk profile, which considers both operational, or short-term, risks and longer-term strategic risks to the organization. This information provides context to project proposals as part of the annual long-term planning process.
The 2010-11 Corporate Risk Profile identified the following major corporate risks, which are applicable across all program activities, along with associated mitigation strategies:
| Major Corporate Risks | Description | Mitigation Strategies |
|---|---|---|
| Public trust, confidence and cooperation | Because most household surveys are voluntary, the integrity of the statistical program depends on the co-operation and participation of households in data-collection activities. (Most business surveys are mandatory.) The public's trust and confidence in the quality and objectivity of Statistics Canada outputs are fundamental pillars of the organization. Domestic and international use of agency outputs may be affected if trust in the organization is compromised and the agency's professional credibility is questioned. |
|
| Budget and resources | Federal budgets and strategic program reviews have reduced the effective resources available to the agency, including respendable revenues from other government departments and agencies. |
|
| Legislation and statutory data requirements | Two-thirds of the agency's programs respond to statutory and regulatory data requirements. Changes in these data requirements may affect the statistical programs used to fulfill them. |
|
| Leadership and intergovernmental coordination of the national statistics program | Changes in federal–provincial partnerships, or in mutually beneficial relationships with other governments, may affect the scope, quality or timeliness of data available to the national statistics program. |
|
Summary of Performance
Statistics Canada successfully achieved the objectives identified in the 2010-11 Report on Plans and Priorities while meeting new budgetary requirements. These objectives included successful outcomes on all its major priorities: delivering ongoing economic and social programs; preparing to conduct the Census of Population, the Census of Agriculture and the National Household Survey; continuing to renew statistical programs; improving the agency's business processes and further integrating its results-based corporate infrastructure. The ability of internal informatics and methodology services to quickly and effectively adapt to fundamental changes to the 2011 Census and National Household Survey was exemplary. In addition, Statistics Canada showed strong results on a range of performance indicators.
Statistics Canada's statistical program is funded through direct parliamentary appropriations and cost-recovery activities. In recent years, the agency's 'respendable' cost-recovery revenues—revenues Statistics Canada is authorized to spend on the activity that generated them—have generally added approximately $100 million per year to Statistics Canada's budget, enabling production of a wide variety of statistics used by other federal departments to run their programs effectively. Provincial governments, private companies and other entities also use these statistics extensively.
| Planned spending | Total authorities | Actual spending |
|---|---|---|
| 562,733 | 599,834 | 575,209 |
| 1. Totals may differ within and between tables because of rounding. Amounts shown are net of respendable revenue. | ||
| Planned | Actual | Difference |
|---|---|---|
| 6,115 | 5,691 | 424 |
| 1. The difference between total planned FTEs and total actual FTEs is mainly owing to a change in planned salary expenditures, made after the submission of the 2010-11 Report on Plans and Priorities. | ||
Included in the above total of 5,691 FTEs are approximately 660 public servant FTEs based outside the national capital region, across Canada (this is higher than the usual average staff complement, as it includes temporary census requirements). Not included in the 5,691 total are approximately 1,900 interviewers outside the national capital region. These interviewers are part-time workers whose assigned work weeks are affected by the volume of collection work available; they are hired under the Statistics Act, by authority of the Minister of Industry. Interviewers are covered by two separate collective agreements, and are employed through Statistical Survey Operations. Many of Statistics Canada's main outputs rely heavily on data collection and analysis and on the administration of these activities that takes place in the regions.
Strategic Outcome
Canadians have access to timely, relevant and quality statistical information on Canada's changing economy and society for informed debate, research and decision making on social and economic issues.
Statistics Canada's expected results are as follows:
- Statistics produced by Statistics Canada are available through a wide range of easily accessible media formats and venues.
- Canadians are aware of the availability of these statistics and of their high quality, and of the professionalism and non-partisanship of Statistics Canada.
| Performance Indicators1 | Targets | 2010-11 Performance |
|---|---|---|
| Page views of electronic publications—number and annual percentage change | Annual increase exceeds 5% |
Exceeded: Page views in 2010-11 were up 26% from 2009-10. Page views ('000), 2006-07 to 2010-11:
|
| Success in finding information on the Statistics Canada website | 65% of visitors surveyed found what they were looking for | Statistics Canada mostly met its targets for success in finding information. In the Economic Statistics program, 62% of visitors said they were satisfied, in Social Statistics, 60%; and in Census, Demography and Aboriginal Statistics, 69%. This result reflects efforts to improve the effectiveness of the website. This is a new indicator; there is no prior time series. |
| Ease of finding information on the Statistics Canada website | 70% of visitors surveyed would say they were satisfied | Statistics Canada mostly met its targets for ease of finding information. In the Economic Statistics program, 65% of visitors said they were satisfied, in Social Statistics, 67%; and in Census, Demography and Aboriginal Statistics, 67%. This result is due to efforts to improve the effectiveness of the website. This is a new indicator; there is no prior time series. |
| Data series downloaded from the CANSIM online database—number and annual percentage change | Annual increase exceeds 5% |
Not met: CANSIM downloads in 2010-11 were up 1% from 2009-10. Although health-related data are free on CANSIM, other statistics are not. In late 2011-12, Statistics Canada plans to remove pricing from CANSIM. This should strengthen the percentage increase in downloaded data series. CANSIM downloads ('000), 2006-07 to 2010-11:
|
| Rating on 15 areas of management, as defined in the Management Accountability Framework | Obtain rating of 'strong' or 'acceptable' in 90% of areas of management |
Statistics Canada obtained a rating of 'strong' or 'acceptable' in 80% of areas of management. It therefore did not meet the 90% target. The 2010-11 MAF results indicate that the management efficiency of Statistics Canada remains high—a continuation of the findings of each of the previous rounds of evaluation. Highlights of the 2010-11 assessment include
Areas that received the result 'opportunity for improvement' are the quality and use of evaluation, the effectiveness of corporate risk management and the effectiveness of the agency's information management. However, a great deal of work has been done and continues in all three areas. Regarding risk management, a new corporate risk framework was approved, and the corporate risk profile is being updated. Also, a new integrated strategic planning process that increases the use of risk management in planning was introduced. A new information management strategy was also approved. As a result of these actions, ratings are expected to improve in the next round of MAF. Note: The target for this indicator is changed from what was shown in the 2010-11 Report on Plans and Priorities. At that time, the target was to "rank among the best of other departments of similar size." This target was dropped because of uncertainty relating to the timely availability of the necessary data from the various other government departments and agencies. |
| Financial management |
Statistics Canada met all its financial management targets. All financial reports to Policy Committee were provided as scheduled. Information was regularly shared with the Departmental Audit Committee. Efficient and effective financial management service is delivered, based on a solid organizational foundation consisting of sound business practices, processes, systems and people. The agency adheres to Treasury Board Secretariat policies on financial management. The agency maintained an "acceptable" score for Area of Management 17 (Effectiveness of Financial Management and Control). Several initiatives were implemented to better align the financial management and control function with central agencies' requirements: in particular, much work was done on compliance with the Policy on Internal Control. Phase II of the Web of Rules project was completed by October 31, and surpassed targeted results. Work continued to further integrate corporate planning exercises including corporate business plan update, human resources strategy, information technology strategy, investment planning and project management. A corporate risk profile has been developed that includes a risk register and a process paper. Efficient and effective governance and strategic directions are being provided. |
|
| Human resources |
Statistics Canada showed continued strength in people management, as measured by the Departmental Staffing Accountability Report. In 2010, the overall rating remained 'strong'. All indicators were rated 'acceptable' or 'strong'. Statistics Canada maintained an overall 'strong' rating for people management and 'acceptable' for values and ethics in the 2010-11 round of the Management Accountability Framework. Statistics Canada once again received recognition as one of Canada's Top 100 employers, and ranked among Canada's best diversity employers, Canada's top 25 family-friendly employers and the National Capital Region's top 25 employers. The agency conducted an Employee Opinion Survey in November 2010, which achieved a response rate of 81%. Results were shared with all employees and program managers in March 2011. Through the leadership of the agency's employment equity champions, Statistics Canada successfully completed the first year of its five-year employment equity plan. The plan was developed with full participation of the Diversity Committee, which includes management and employee representation. |
|
| 1. See Section IV for indicator definitions. | ||
| Program activity | 2009-10 actual spending ($ thousands) |
2010-11 ($ thousands)1 | Alignment to Government of Canada outcomes | |||
|---|---|---|---|---|---|---|
| Main estimates |
Planned spending |
Total authorities |
Actual spending |
|||
| Economic Statistics | 190,129 | 178,754 | 178,754 | 187,198 | 181,796 | A transparent, accountable and responsive federal government |
| Social Statistics | 136,495 | 135,419 | 135,419 | 140,815 | 132,150 | |
| Census, Demography and Aboriginal Statistics | 93,146 | 161,859 | 161,859 | 177,025 | 169,313 | |
| Total | 419,770 | 476,032 | 476,032 | 505,038 | 483,259 | |
| 1. Totals may differ within and between tables because of rounding. Amounts shown are net of respendable revenue. | ||||||
| Program activity | 2009-10 actual spending ($ thousands) |
2010-11 ($ thousands)1 | |||
|---|---|---|---|---|---|
| Main estimates |
Planned spending |
Total authorities |
Actual spending |
||
| Internal Services | 89,323 | 86,701 | 86,701 | 94,796 | 91,950 |
| 1. The Main Estimates and Planned Spending figures are equal: they represent approved funding levels prior to the start of the fiscal year. Total authorities represent planned spending adjusted for all funding changes approved during the fiscal year. The difference between total authorities and actual spending owes mostly to operational timing differences in programs that span more than one fiscal year. | |||||
Expenditure Profile
Canada's Economic Action Plan (CEAP)
For 2010-11, there are no CEAP projects for Statistics Canada to report on.
Departmental Spending Trend
Figure 2 shows the seven-year trend of Statistics Canada's total spending and spending net of respendable revenue.
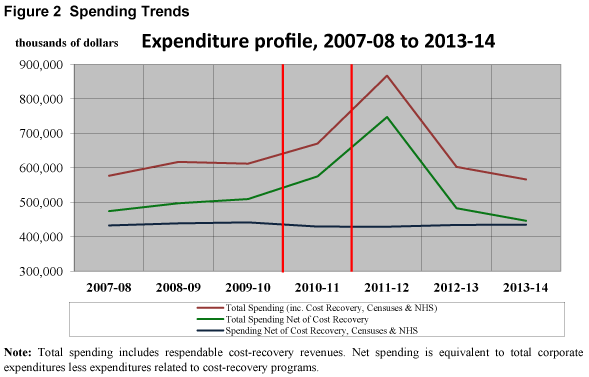
As shown in Figure 2, total and net spending rise in 2010-11, peak in 2011-12 when the 2011 Census of Population, NHS and 2011 Census of Agriculture are conducted, and drop sharply in 2012-13 as these activities begin to wind down. This pattern is typical for the agency, a function of the cycle of the census program.
Figure 2 also shows that spending, net of cost recovery, the censuses and the NHS remains relatively stable over the seven-year cycle. Funding for regular economic increases for wages, and new spending on initiatives such as the Canadian Environmental Sustainability Indicators, the Harmonized Sales Tax and the Consumer Price Index, have been offset by spending cuts, including the cuts resulting from the strategic review process in 2007, procurement savings, and other cost-containment measures.
Estimates by Vote
For information on our organizational votes and/or statutory expenditures, please see the 2010–11 Public Accounts of Canada (Volume II).
Section II: Analysis of Program Activities by Strategic Outcome
Strategic Outcome
Statistics Canada has one strategic outcome. All program activities support that one strategic outcome:
Strategic Outcome
Canadians have access to timely, relevant and quality statistical information on Canada's changing economy and society for informed debate, research and decision making on social and economic issues.
This section describes Statistics Canada's program activities, and the financial and non-financial resources available to each. Performance is assessed and the lessons learned are presented for each of the four program activities:
- Economic Statistics
- Social Statistics
- Census, Demography and Aboriginal Statistics
- Internal Services
Program Activity 1: Economic Statistics
Program activity description1
The Economic Statistics program's purpose is to create a trusted, relevant and comprehensive source of information on the entire spectrum of Canada's economy in order to: inform public debate on economic issues; support economic policy development, implementation and evaluation; and guide business decision making. It is the primary source of information for developing the country's fiscal and monetary policies and for studying the economic evolution of Canadian industries and of regions. The information provides for informed public debate on current economic issues of concern and interest. The outputs are vital to research and to economic policy development, implementation and evaluation by a number of federal departments, such as the Bank of Canada, Finance Canada, Industry Canada, Foreign Affairs and International Trade, and Transport Canada, as well as by provincial and territorial governments; and they are extensively used by the private sector for business planning and decision making. The programs' data also support statutory requirements and regulatory instruments. Statistics produced range from gross domestic product, production, costs, sales, productivity and prices for industrial sectors to the flows and stocks of fixed and financial capital assets, international trade and finance, and the extent of foreign ownership in Canada's economy.
| Planned spending | Total authorities | Actual spending |
|---|---|---|
| 178,754 | 187,198 | 181,796 |
| 1. Totals may differ within and between tables because of rounding. Amounts shown are net of respendable revenue. | ||
| Planned | Actual | Difference |
|---|---|---|
| 2,123 | 2,018 | 105 |
| Expected Results |
Performance Indicators1 |
Targets | Performance Status |
|---|---|---|---|
| Statistics produced by Statistics Canada are available through a wide range of easily accessible media formats and venues. | Page views of electronic publications—number and annual percentage change | Annual increase exceeds 5% |
Exceeded: Page views in 2010-11 were up 23% from 2009-10. The increase in the number of page views in 2010-11 compared with 2009-10 is mainly attributable to rising popularity of specific publications, such as the Canadian Economic Observer. Page views ('000), 2006-07 to 2010-11:
|
| Success in finding information on the Statistics Canada website | 65% of visitors surveyed found what they were looking for | Mostly met: 62% of visitors surveyed found what they were looking for. This is a new indicator: there is no prior time series. | |
| Ease of finding information on the Statistics Canada website | 70% of visitors surveyed would say they were satisfied | Mostly met: 65% of visitors surveyed said they were satisfied. This is a new indicator: there is no prior time series. | |
| Client satisfaction with price to access data, ease of retrieval process, convenience of output formats, Statistics Canada's ability to meet their needs | 4 on a scale of 1 to 5 |
Mostly met: For client satisfaction with the price to access data, the rating in 2010-11 was 3.3 on a scale of 1 to 5. For client satisfaction with ease of retrieval, the rating was 3.6. For client satisfaction with convenience of output formats, the rating was 3.7. For client satisfaction with Statistics Canada's ability to meet their needs, the rating was 3.6.
|
|
| Canadians are aware of the availability of these statistics and of their high quality, and of the professionalism and non-partisanship of Statistics Canada. | Data series downloaded from the CANSIM online database—number and annual percentage change | Annual increase exceeds 5% |
Not met: CANSIM downloads in 2010-11 were up 2% from 2009‑10. The increase reflects the rising popularity of some economic series—particularly those on income and expenditures, wealth, and industry. However, the increase was not enough to meet the target. In late 2011‑12, Statistics Canada plans to remove pricing from CANSIM. This should strengthen the percentage increase in downloaded data series.CANSIM downloads ('000), 2006-07 to 2010-11:
|
| Percentage of major statistical outputs whose sampling accuracy is within set objectives | 95.0% |
Exceeded: The sampling accuracy of 96.8% of major statistical outputs from the Economic Statistics program was within set objectives. Sampling accuracy within set objectives, 2006-07 to 2010‑11:
|
|
| Percentage of major statistical outputs released as planned | 100% |
Met all: All major statistical outputs from the Economic Statistics program activity were released on time, adhering to the pre-established release schedule. Percentage of major statistical outputs released as planned, 2006-07 to 2010-11:
|
|
| Percentage of major statistical outputs corrected after release | Less than 2.5% |
Exceeded: 0.4% of major statistical outputs from the Economic Statistics program activity required correction after release. Percentage of major statistical outputs corrected after release, 2006-07 to 2010-11:
|
|
| Organizational efficiency | Business surveys using tax / administrative data—number and percentage | Continual increase |
Somewhat met: 47 business surveys—22% of the total—used tax/administrative data in 2010-11. This was unchanged from 2009-10. The number of business and agricultural surveys using administrative data has reached a plateau. Statistics Canada is currently enabling the use of more administrative data by conducting evaluations in agriculture and energy. At the same time, the
agency is negotiating partnerships with other federal departments to use other sources of administrative data in lieu of survey data. Number and percentage of business surveys using tax/administrative data, fiscal years 2006-07 to 2010-11:
|
| Number of administrative records used to reduce survey sizes | Continual increase |
Met all: 307,000 administrative records were used. Administrative records ('000) used to reduce survey sizes, 2006-07 to 2010-11:
|
|
| Index of response burden hours | 60 or less |
Somewhat met: Index=65 Response burden continues to be a concern. Statistics Canada is looking for all possible opportunities to reduce burden through increased use of both administrative data and electronic data reporting. Statistics Canada has reduced response burden by 35% since 1991. This is a considerable decrease. The index of response burden has been revised to incorporate more precision in completion time by survey. Index of response burden hours (1991=100), 2006-07 to 2010-11:
|
|
| International comparability | Rank among the best in comparison with other G7 countries | Met all: For measurement and dissemination of gross domestic product (GDP) data, Canada meets all of the standards set by the International Monetary Fund (IMF). In addition, Canada has the second lowest GDP revision rate of the G7 countries. This is unchanged from 2009-10. An annual report on the observance of the IMF standards is available on its website at http://dsbb.imf.org/images/pdfs/AnnualReports/2010/ CAN_SDDS_AR2010.pdf |
|
| 1. See Section IV for indicator definitions. | |||
Performance Summary and Analysis of Program Activity
The range and quality of Canada's economic statistics, together with Statistics Canada's reputation for quality and integrity, ensure that Canadian governments and businesses can access international financial markets on the most favourable terms.
In this regard, the Economic Statistics program activity performed extremely well in 2010-11. It continued to deliver high-quality economic statistics through its ongoing programs and continued its renewal activities.
The Economic Statistics program activity exceeded its target growth rate for electronic page views by clients. This is mainly attributable to rising popularity of specific publications, such as the Canadian Economic Observer.
The Economic Statistics program activity saw a slight increase in the number of tables downloaded in CANSIM. This increase was a result of the increased popularity of some economic datasets—including datasets related to income and expenditures, wealth, and industry. The small size of the increase is the direct result of providing more products to users for free through vehicles other than CANSIM. This trend is expected to continue.
All major statistical outputs from the Economic Statistics program activity were released on time, adhering to the pre-established release schedule, and according to accuracy targets.
Managing Canada's macro-economy through monetary and fiscal policies is the responsibility of the federal government. The Bank of Canada, the Department of Finance and international organizations, such as the Organisation for Economic Co‑operation and Development (OECD) and the International Monetary Fund (IMF), expect that the national statistical office will produce, in general compliance with international standards, a comprehensive and timely set of economic indicators to guide macro-economic policy.
Statistics Canada is internationally recognized for producing a comprehensive, high-quality and timely set of economic indicators. A May 2010 report by the OECD Statistics Directorate listed 28 categories of statistical measures (4 more than in 2009) that member countries are expected to maintain and report. Canada was reported as fully compliant in 22 categories, Australia in 25, the United Kingdom in 23 and the United States in 25. Canada's compliance improved with the provision of capital stock by industry data, but declined in terms of consumer opinion surveys: this is not currently part of Statistics Canada's program. Compliance was lacking with respect to business tendency surveys, monthly international trade in goods by Standard International Trade Classification sections, and two new categories related to structural and business statistics.
Canada meets all IMF standards for measuring and disseminating GDP data. In fact, according to the annual report for 2010 on observance of the Special Data Dissemination Standard, "the quality, coverage, periodicity and timeliness of Canada's economic data are considered to be excellent both in the context of the Article IV consultation and for purposes of ongoing surveillance."
Timeliness is measured as the lag between the end of the reference period and the dissemination of the earliest measures of GDP. Although Canada meets the IMF standard—it releases 60 days after the end of the reference period, 30 days ahead of the IMF limit—it appears to lag other G7 countries. This is because Canada releases GDP and the whole National Accounts database at once, providing users a timely estimate of GDP and, at the same time, helping users understand the overall context. Many other countries, such as the United States, put out early or 'flash' estimates of GDP (the headline variable) without the associated database. Most other G7 countries release the comprehensive database with a lag of 75 to 90 days from the end of the reference period.
Revisions to economic indicators are a normal consequence of the statistical compilation process. The first publication of quarterly real GDP based on income and expenditure is released approximately 60 days after the reference period, and provides timely information about the economy. These initial estimates are based on data available at the time of the release. However, this information will, at times, be incomplete. The initial estimates are revised or changed in value as increasingly complete source data becomes available. Those initial estimates must be reliable or close approximations of the final estimate.
Canada has the second lowest revision rate of the G7 countries. However, there is a trade-off between timeliness and accuracy, measured in the average revisions of the GDP growth rate. Canadian users are often consulted on their views on these trade-offs and are usually satisfied with the status quo.
The Economic Statistics program activity continued to use more and more administrative data in lieu of questionnaires.
Lessons Learned
What worked well
The development and conducting of the Survey of Innovation and Business Strategies went extremely well. The purpose of the survey was to seek detailed information, at the firm level, to help sharpen understanding of business drivers and behaviours and their impacts on growth and performance. This voluntary survey proved successful thanks to a strong partnership among Statistics Canada, Industry Canada, and Foreign Affairs and International Trade Canada, as well as to participants' willingness to compromise between richer survey content and a shorter and less intrusive survey. The strategy proved effective: the survey has provided a rich database that will be instrumental for economic research in the years to come.
What could be improved and what we are doing about it
Response burden continues to be a high priority for Statistics Canada. In its recent consultations, the Red Tape Commission has identified response burden and collection practices as irritants to the business and agricultural communities. Statistics Canada has reduced significantly the number of survey questionnaires. The agency is committed to continue exploring new opportunities to use administrative data in collaboration with other federal departments. In addition, it will keep improving its survey instruments to accommodate better the respondent using electronic reporting such as web-based collection methods. This new data-collection strategy should offer respondents more flexibility and reduce the need for follow-up calls.
After a report in the news media in December 2010 that there had been an early release of economic data by Statistics Canada, the consulting firm KPMG was engaged to conduct a review of agency dissemination practices. The review made a number of recommendations that Statistics Canada has accepted and is taking steps to implement. A comprehensive and thorough review of the dissemination process is underway, with a focus on procedures for information technology, and a clear definition of roles and responsibilities.
Program Activity 2: Social Statistics
Program activity description1
The Social Statistics program's purpose is to provide integrated information and relevant analysis on the social and socio economic characteristics of individuals, families and households and on the major factors that affect their well-being in order to: inform public debate on socio-economic issues; support social policy development, implementation and evaluation; and guide public and private decision making. It is the primary source for assessing the impact of changing economic circumstances on Canadians. Federal departments such as Human Resources and Skills Development Canada, Industry Canada, Justice Canada, Citizenship and Immigration Canada, Canadian Heritage, Indian and Northern Affairs Canada, Transport Canada and Infrastructure Canada, as well as provincial governments extensively use its information to evaluate and cost economic and social policy options and alternatives. Objective statistical information is essential in an open and democratic society and this information allows Canadians to participate knowledgeably in debates on topics of interest to them. It supports statistical requirements specified by legislation or regulations such as in areas of labour, immigration and employment equity. The program also provides information, analysis and measures on publicly funded facilities, agencies and systems designed to meet the socio-economic and physical needs of Canadians, on the characteristics of the individual Canadians and families they serve, and on the outcomes of the services they provide, such as justice, health, and education, as well as on cultural institutions and industries.
| Planned spending | Total authorities | Actual spending |
|---|---|---|
| 135,419 | 140,815 | 132,150 |
| 1. Totals may differ within and between tables because of rounding. Amounts shown are net of respendable revenue. | ||
| Planned | Actual | Difference |
|---|---|---|
| 1,781 | 1,394 | 387 |
| Expected Results |
Performance Indicators1 |
Targets | Performance Status |
|---|---|---|---|
| Statistics produced by Statistics Canada are available through a wide range of easily accessible media formats and venues. | Page views of electronic publications—number and annual percentage change | Annual increase exceeds 5% |
Exceeded: Page views in 2010-11 were up 26% from 2009-10. The increase in the number of page views in 2010-11 compared with 2009-10 is mainly attributable to rising popularity of specific publications, including Perspectives on Labour and Income, Health Fact Sheets, Juristat and Health Reports. Page views ('000), 2006-07 to 2010-11:
|
| Success in finding information on the Statistics Canada website | 65% of visitors surveyed found what they were looking for | Mostly met: 60% of visitors surveyed found what they were looking for. This is a new indicator: there is no prior time series. | |
| Ease of finding information on the Statistics Canada website | 70% of visitors surveyed would say they were satisfied | Mostly met: 67% of visitors surveyed said they were satisfied. This is a new indicator: there is no prior time series. | |
| Client satisfaction with price to access data, ease of retrieval process, convenience of output formats, Statistics Canada's ability to meet their needs | 4 on a scale of 1 to 5 |
Mostly met: For client satisfaction with price to access data, the rating in 2010-11 was 3.4 on a scale of 1 to 5. For client satisfaction with ease of retrieval process, the rating was also 3.4. For client satisfaction with convenience of output formats and for client satisfaction with Statistics Canada's ability to meet their needs, the rating was 3.7. Client satisfaction ratings, 2006-07 to 2010-11 Price to access data
|
|
| Canadians are aware of the availability of these statistics and of their high quality, and of the professionalism and non-partisanship of Statistics Canada. | Data series downloaded from the CANSIM online database—number and annual percentage change | Annual increase exceeds 5% |
Not met: CANSIM downloads in 2010-11 were down 2% from 2009‑10. Although health-related data are free on CANSIM, other social statistics are not. In late 2011-12, Statistics Canada plans to remove pricing from CANSIM. This should reverse the declining trend. CANSIM downloads ('000), 2006-07 to 2010-11:
|
| Percentage of major statistical outputs whose sampling accuracy is within set objectives | 95.0% |
Exceeded: The sampling accuracy of 99.7% of major statistical outputs from the Social Statistics program was within set objectives. Sampling accuracy within set objectives, 2006-07 to 2010‑11:
|
|
| Percentage of major statistical outputs released as planned | 100% |
Met all: All major statistical outputs from the Social Statistics program activity were released on time, adhering to the pre-established release schedule. Percentage of major statistical outputs released as planned, 2006-07 to 2010-11:
|
|
| Percentage of major statistical outputs corrected after release | Less than 2.5% |
Exceeded: 0.5% of major statistical outputs from the Social Statistics program activity required correction after release. Percentage of major statistical outputs corrected after release, 2006-07 to 2010-11:
|
|
| Organizational efficiency | International comparability | Rank among the best in comparison with other G7 countries |
Met all: For unemployment data, Canada met or exceeded all the IMF quarterly periodicity and timeliness requirements. This is unchanged from 2009-10. An annual report on the observance of these IMF standards is available on its website at http://dsbb.imf.org/images/pdfs/AnnualReports/2010/ |
| 1. See Section IV for indicator definitions. | |||
Performance Summary and Analysis of Program Activity
Demographic trends are shaping our country. They will have a profound effect on labour markets, demand for government services such as health, education and justice, as well as on incomes and life paths. A robust, comprehensive program of social statistics is essential to anticipating and meeting these challenges.
The Social Statistics program activity performed extremely well in 2010-11. It continued to deliver high-quality social and economic data through its ongoing programs, and continued its renewal activities.
The Social Statistics program activity again exceeded its target growth rate for electronic page views by clients. This is unlikely to continue in light of reduced spending in this area.
The Social Statistics program activity did not see an increase in the number of tables downloaded in CANSIM, which is the direct result of providing more products to users for free. This downward trend is expected to continue as more and more products become available for free.
All major statistical outputs from the Social Statistics program activity were released on time, adhering to the pre-established release schedule, and in accordance with accuracy targets.
In 2010-11, the Social Statistics program made significant progress in the streamlining and integration of its business processes. For example, the Social Survey Processing Environment provides a suite of generic tools and utilities related to the processing of social survey data.
Lessons Learned
What worked well
The Social Statistics Microdata Access Division is contributing significantly to the accessibility of Statistics Canada information. For example, the remote microdata access application called Real Time Remote Access was launched this year for federal government researchers. For public-use microdata files, a new subscription program was announced in The Daily to offer access to Statistics Canada's collection of public-use microdata files to Canadian or international organizations not covered by the Data Liberation Initiative. Statistics Canada's Canadian Research Data Centres Network has expanded this year to include branch centres at the University of Lethbridge and the University of Windsor, increasing the research access points through this program to one federal and 25 university research data centres.
A new occupational classification will be available in 2012: it will be used in the household survey program, including the National Household Survey. The classification results from last year's agreement between Statistics Canada and its partner, Human Resources and Skills Development Canada, to consolidate the two major occupational classifications into a single national classification. This consolidation is a considerable advance toward coherent occupational statistics across the Government of Canada.
What could be improved and what we are doing about it
A continued threat to the quality of Statistics Canada data is the increasing challenge in contacting respondents to collect survey information and maintaining response rates. The active lifestyles of Canadian families and the diminishing use of landline telephones make it more difficult to reach respondents at home. To address this challenge, Statistics Canada will be conducting a pilot test designed to determine if cellphone contact information can be used in the collection process. Statistics Canada is also developing an Internet application as an option for respondents to complete social surveys online. This application will be developed first for the Labour Force Survey and, once implemented, will be extended to more social surveys as a mode of response.
The measurement of societal well-being has been identified internationally as an area for improvement. Statistics Canada is a member of two working groups created by the OECD to discuss collection methods to fill such data gaps. The agency has also participated in the review of a number of chapters in the OECD's new publication, How's Life?
Program Activity 3: Census, Demography and Aboriginal Statistics
Program activity description1
The program's purpose is to provide statistical information, analyses and services that measure changes in the Canadian population, its demographic characteristics and its conditions, and its agricultural sector, as well as the well-being of Aboriginal peoples, in order to serve as a basis for public and private decision making, research and analysis in areas of concern to the people of Canada. The program includes the Censuses of Population and Agriculture. The Census of Population provides detailed information on population sub-groups and for small geographical levels required to assess the effects of specifically targeted policy initiatives and serves as a foundation for other statistical surveys. It also provides population estimates, projections and in-depth information on special populations, such as operators of agriculture holdings and Aboriginal peoples. Population counts and estimates are used in determining electoral boundaries, distribution of federal transfer payments, and the transfer and allocation of funds among regional and municipal governments, school boards and other locally based agencies within provinces. It meets statistical requirements specified constitutionally, and supports those in statutory requirements and regulatory instruments. All per capita measures in fiscal policies and arrangements and other economic analysis, and in program and service planning, come from this program's statistical information. Statistics produced range from demographic, social and economic conditions of the population, annual and quarterly estimates of the population, households and families and their projections to numbers and types of farms and farm operators, and the socio-economic conditions and well-being of Aboriginal peoples.
| Planned spending | Total authorities | Actual spending |
|---|---|---|
| 161,859 | 177,025 | 169,313 |
| 1. Totals may differ within and between tables because of rounding. Amounts shown are net of respendable revenue. | ||
| Planned | Actual | Difference |
|---|---|---|
| 1,290 | 1,370 | (80) |
| Expected Results |
Performance Indicators1 |
Targets | Performance Status |
|---|---|---|---|
| Statistics produced by Statistics Canada are available through a wide range of easily accessible media formats and venues. | Page views of electronic publications—number and annual percentage change | Annual increase exceeds 5% |
Exceeded: Page views in 2010-11 were up 40% from 2009-10. The increase in the number of page views in 2010-11 compared with 2009-10 reflects interest in demographic data as the census approaches. A number of new publications added to the increase, particularly those focusing upon aboriginal statistics. Page views ('000), 2006-07 to 2010-11:
|
| Success in finding information on the Statistics Canada website | 65% of visitors surveyed found what they were looking for | Exceeded: 69% of visitors surveyed found what they were looking for. This is a new indicator: there is no prior time series. | |
| Ease of finding information on the Statistics Canada website | 70% of visitors surveyed would say they were satisfied | Mostly met: 67% of visitors surveyed said they were satisfied. This is a new indicator: there is no prior time series. | |
| Canadians are aware of the availability of these statistics and of their high quality, and of the professionalism and non-partisanship of Statistics Canada. | Data series downloaded from the CANSIM online database—number and annual percentage change | Annual increase exceeds 5% |
Exceeded: CANSIM downloads in 2010-11 were up 27% from 2009-10. This is a direct result of increased interest in socio-demographic data, including population estimates and projections. CANSIM downloads ('000), 2006-07 to 2010-11:
|
| Net undercoverage for the 2011 Census of Population | Less than 3% | At the end of the reporting year, Census preparations were still underway. No indicator data are currently available. | |
| Response rate for the 2011 Census of Population | 98% or more | At the end of the reporting year, Census preparations were still underway. No indicator data are currently available. | |
| Response rate for the National Household Survey | At least 50% | At the end of the reporting year, National Household Survey preparations were still underway. No indicator data are currently available. | |
| Organizational efficiency | Cost per dwelling for the 2011 Census of Population | Less than $42 | At the end of the reporting year, Census preparations were still underway. No indicator data are currently available. |
| 1. See Section IV for indicator definitions. | |||
Performance Summary and Analysis of Program Activity
The Census, Demography and Aboriginal Statistics program activity performed extremely well, under very challenging conditions, in 2010-11. It continued to prepare to conduct the Census of Population and the Census of Agriculture, and also to introduce the National Household Survey, a new voluntary survey that will collect the comprehensive data that was previously part of the comprehensive portion of the mandatory census.
The National Household Survey introduced a number of changes in the 2011 cycle, which adds pressure to the 2011 budgets and timelines. The census (short form) was to be sent to 100% of dwellings, up from 80% in 2006. The National Household Survey was to be sent to 30% of dwellings; the equivalent 'long form' of the 2006 Census was sent to 20% of dwellings. An additional $30 million was added to the 2011 budget to implement these changes and to ensure that response rate objectives are attained.
The Census, Demography and Aboriginal Statistics program activity exceeded its target growth rate for electronic page views by clients.
The Census of Population, preparing for the 2011 Census, saw a slight decline in the number of tables downloaded from its online database. This is typical of the level of demand at this point in the census cycle.
Lessons Learned
What worked well
In the months leading up to the implementation phase of the 2011 Census, the primary focus of the program was preparing for full-scale operations, including making the changes needed to support the new National Household Survey. Strong governance ensured that the required changes were made in a timely and effective manner. This was demonstrated by the successful conclusion of integrated systems testing to validate major systems, and implementation of changes in procedures and processes.
What could be improved and what we are doing about it
As part of the preparations for the 2011 Census, a test was conducted in May 2009, consisting of 125,000 households. Results from the test were used to make adjustments prior to the 2011 Census, and to scale up systems and infrastructure to the volumes required. In particular, the test validated the implementation of the wave methodology, a new approach being introduced for the 2011 Census to encourage respondents to complete their questionnaires online. The test also validated the new Field Management System, and identified several issues with the availability of management information systems reports that were subsequently resolved.
As is customary with all census cycles, an in-house evaluation program was set up to evaluate lessons learned from the 2011 Censuses and the National Household Survey. In addition, in light of the significant changes to the Census of Population for 2011, Statistics Canada will study approaches for population censuses in place around the world, their applicability in the Canadian context, and their adherence to Statistics Canada's mandate and business model. Based on this review and the outcome of the 2011 Census and the National Household Survey, Statistics Canada will develop options for the 2016 Census program.
Program Activity 4: Internal Services
Program activity description
Internal Services are groups of related activities and resources that are administered to support the needs of programs and other corporate obligations of an organization. These groups are management and oversight services; communications services; legal services; human resources management services; financial management services; information management services; information technology services; real property services; materiel services; acquisition services; and travel and other administrative services. Internal Services include only those activities and resources that apply across an organization and not to those provided specifically to a program.
| Planned spending | Total authorities | Actual spending |
|---|---|---|
| 86,701 | 94,796 | 91,950 |
| 1. Totals may differ within and between tables because of rounding. Amounts shown are net of respendable revenue. | ||
| Planned | Actual | Difference |
|---|---|---|
| 921 | 909 | 12 |
Performance Summary and Analysis of Program Activity
The Internal Services program activity achieved successful results in all the priorities it identified in the 2010-11 Report on Plans and Priorities: providing a more user-friendly website; increasing stakeholder engagement for improved relevance of Statistics Canada's programs; implementing the new human resource management action plan; consolidating governance of informatics technology services; enhancing and documenting the integrated risk management strategy; and strengthening the internal audit function.
Lessons Learned
What worked well
The agency made its internal audit function more effective, and improved its contribution to government-wide priorities, by implementing robust governance processes and issuing periodic internal audit reports as per its 2010-13 risk-based audit plan. A Departmental Project Management Office was created to develop standardized tools for documentation and status reporting, following the best practices of the Project Management Institute's Project Management Body of Knowledge. A revised agency-wide integrated strategic planning process was introduced, which further consolidated planning for human resources, informatics technology and finance.
The agency also strengthened the quality of performance reporting and the effectiveness of its information technology management.
All this work was very successful, as indicated by the MAF scores for these areas of management. Internal audit and performance reporting went from 'opportunity for improvement' to 'acceptable'. The organizational contribution to government-wide priorities and the management of information technology went from 'acceptable' to 'strong'. In all, 13 areas of management were assessed in the current round: 4 improved, 1 declined, 6 were unchanged and 2 cannot be compared.
What could be improved and what we are doing about it
Quality and use of evaluation declined from 'acceptable' to 'opportunity for improvement' in MAF VIII. The evaluation function has since been made the responsibility of Internal Audit Services, and a five-year evaluation plan is in development.
The effectiveness of corporate risk management declined from 'acceptable' to 'opportunity for improvement'. The main reason: although a comprehensive risk register and corporate risk profile were developed and the methodology was documented, the strategy was not fully integrated into all management processes. Significant work has been done by the Administrative Practices Committee and through the integrated strategic planning process to ensure that integrated risk management is part of the foundation for decision-making in the agency.
Statistics Canada's Information Management (MAF Area of Management 12) overall rating in MAF VIII was unchanged from last year: 'opportunity for improvement'. A strong culture of sound information management (IM) practices is considered fundamental to Statistics Canada's mandate. While the agency is strong in the areas of privacy and access to information, there are opportunities for improvement in IM strategy planning and implementation and in IM practice. The recommendation is to continue IM strategy implementation and address the requirements of Treasury Board's Directive on Recordkeeping. With a sound governance model and IM framework in place, Statistics Canada's IM Action Plan outlines how the agency continues to implement its IM strategy. For example, the integration of good IM practices into business processes is an integral part of several strategic projects, including developing the Departmental Project Management Framework, setting up Data Service Centres, and developing the Administrative Processes Review and Automation Project. In addition, Statistics Canada is implementing and monitoring practices for managing structured information, the agency's key business asset. All these initiatives facilitate identifying and managing information resources of business value, based on an analysis of the agency's business processes, as required by the Directive on Recordkeeping.
Section III: Supplementary Information
Financial Highlights
| % change | 2010-11 | 2009-10 | |
|---|---|---|---|
| Total assets | 13.7 | 235,072 | 206,706 |
| Total liabilities | 15.1 | 183,720 | 159,559 |
| Equity of Canada | 8.9 | 51,352 | 47,147 |
| Total | 13.7 | 235,072 | 206,706 |
| % change | 2010-11 | 2009-10 | |
|---|---|---|---|
| Total expenses | 12.9 | 742,513 | 657,497 |
| Total revenues | (4.3) | 97,794 | 102,193 |
| Net cost of operations | 16.1 | 644,719 | 555,304 |
Financial Highlights Charts
Figure 3 Assets by Type
Total assets were $235.1 million at the end of 2010-11, up $28.4 million, or 13.7%, from $206.7 million the previous year. Tangible capital assets, composed mainly of informatics software ($71.1 million), software under development ($45.2 million) and informatics hardware ($26.0 million), made up the largest portion of assets at $155.9 million, or 66.3% of the total. The remaining 33.7% comprised amounts from the Consolidated Revenue Fund (25.4%), accounts receivable and advances (4.3%), prepaid expenses (2.6%) and inventory (1.4%).
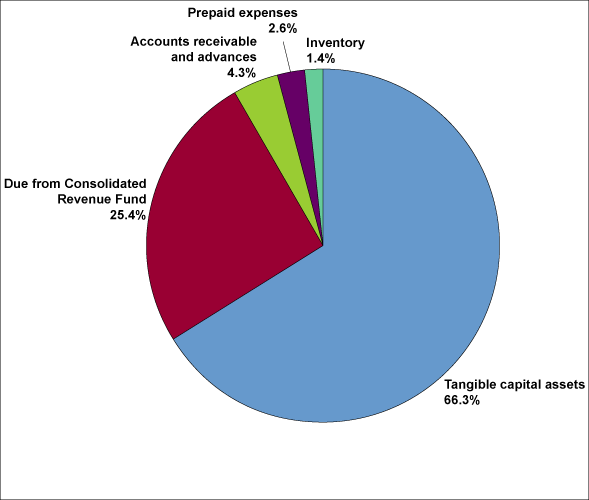
Figure 4 Liabilities by Type
Total liabilities were $183.7 million at the end of 2010-11, up $24.1 million, or 15.1%, from $159.6 million the previous year. Employee future benefits made up the largest portion of the liabilities at $90.7 million, or 49.4% of the total. Accounts payable and accrued liabilities were the next largest portion at $64.0 million or 34.8% of the total, composed of accounts payable external parties ($47.7 million), accrued salaries and wages ($8.8 million) and accounts payable to other federal government departments and agencies ($7.5 million). Vacation pay and compensatory leave make up $24.3 million, or 13.2% of the total.
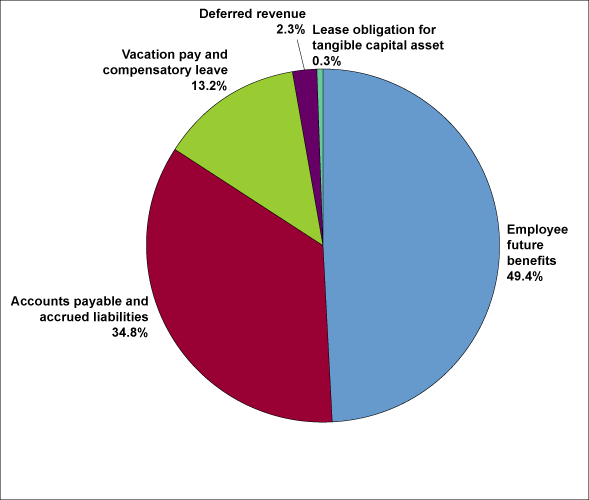
Figure 5 Revenues—Where Funds Come From
The agency's total revenues amounted to $97.8 million for 2010-11, down $4.4 million, or 4.3%, from $102.2 million the previous year; this decrease is mostly due to the cyclical nature of some surveys. The Social Statistics program generated $52.3 million (53.4%); the Economic Statistics program, $23.1 million (23.6%); the Census, Demography and Aboriginal Statistics program, $19.6 million (20.1%); and Internal Services, $2.8 million (2.9%).
Figure 6 Expenses—Where Funds Go
Total expenses, including respendable revenue and services provided without charge by other government departments, were $742.5 million in 2010-11, up $85.0 million, or 12.9%, from $657.5 million the previous year. This increase is mostly due to the 2011 Census of Population and NHS and the 2011 Census of Agriculture; new work on initiatives such as the Canadian Environmental Sustainability Indicators, the Consumer Price Index and the Harmonized Sales Tax also accounts for some of the spending increase. This is typical for the agency because of the cyclical nature of the census programs: in 2010-11, census activities ramp up in preparation for the peak year of the cycle, 2011-12. The Economic Statistics program accounted for $227.6 million (30.7%); the Census, Demography and Aboriginal Statistics program, $207.2 million (27.9%); the Social Statistics program, $202.2 million (27.2%); and Internal Services, $105.5 million (14.2%).
Figure 7 Expenses by Type
Statistics Canada spent $742.5 million in 2010-11. The expenses are as follows: salaries and employee benefits, $542.6 million; professional services, $37.9 million; transportation and postage, $37.5 million; accommodations, $36.7 million; amortization, $32.7 million; repairs and maintenance, $19.9 million; communication and printing, $19.7 million; and other expenses, $15.5 million.
Financial Statements
Financial statements can be found at http://www.statcan.gc.ca/dpr-rmr/2010-2011/financ-eng.htm.
List of Supplementary Information Tables
All electronic supplementary information tables found in the 2010–11 Departmental Performance Report can be found on the Treasury Board of Canada Secretariat's website:
- Sources of Respendable and Non-Respendable Revenue
- User Fees Reporting
- Green Procurement
- Response to Parliamentary Committees and External Audits
- Internal Audits and Evaluations
Section IV: Other Items of Interest
Organizational Contact Information
Email
infostats@statcan.gc.ca
Telephone
1-800-263-1136 or 613-951-8116
Fax
1-877-287-4369 or 613-951-0581
TTY
1-800-363-7629
Mail
Statistics Canada
150 Tunney's Pasture Driveway
Ottawa, Ontario
K1A 0T6
Website: http://www.statcan.gc.ca
Indicator Definitions
Number of page views of electronic publications: The number of web pages viewed during visitor sessions on the Statistics Canada website.
Success in finding information on the Statistics Canada website: Users are asked to indicate whether they successfully located the information they were seeking in their current visit to the Statistics Canada website. This feedback is collected in the Web Evaluation Survey, conducted annually by Statistics Canada. An invitation to participate in the survey appears as users view the site's pages.
Ease of finding information on the Statistics Canada website: Users are asked to rate, on a five-point scale ranging from very easy to very difficult, how easily they found the information they were seeking in their current visit to the Statistics Canada website. This feedback is collected in the Web Evaluation Survey, conducted annually by Statistics Canada. An invitation to participate in the survey appears as users view the site's pages.
Number of print publications sold: The number of print copies for which a price was charged. Statistics Canada has moved to free dissemination of electronic versions of publications to encourage broader access.
Client satisfaction: These data are derived from the client satisfaction surveys. The surveys use measures that are consistent with the common measurement tool in use across the federal government.
Data series downloaded from the online database: Data series downloaded by external users from CANSIM, Statistics Canada's online database.
Major statistical outputs released as planned: Each year Statistics Canada publishes the planned release dates for major statistical outputs for the coming year on its website. These outputs and their release dates can be accessed at http://www.statcan.gc.ca/release-diffusion/index-eng.htm.
Major statistical outputs whose sampling accuracy is within set objectives: Most surveys are based on statistical sampling. Sampling is an important means of achieving timely and cost-effective results. At the same time, estimates based on sampling can be expected to vary from sample to sample, and to differ from those that would result from a complete census. Sampling accuracy objectives are set on a survey-by-survey basis.
Percentage of major statistical outputs corrected after release: The proportion of data releases that need correction after being published.
International comparability: Comparison of periodicity and timeliness of national accounts data and unemployment data among G7 countries, based on IMF standards. Periodicity is measured as frequency of data compilation. Timeliness is the lag between the end of the reference period and the dissemination of data. International comparability also refers to average GDP revision compared with other G7 countries. Average GDP revision is measured as the average of the absolute revisions to real GDP growth rate over the period.
Use of administrative data: Statistics Canada uses data from the Canada Revenue Agency and other administrative sources as an alternative to obtaining data directly from respondents. Sometimes called 'survey data replacement', this practice reduces the number of questionnaires going to respondents and the associated response burden.
Response burden hours: This estimate is calculated annually using the frequency of each survey, the average time to complete the questionnaire and the number of surveyed respondents. Dividing by the estimated number of Canadian businesses gives average burden per establishment. The average is indexed, to a base year of 1991. The calculation excludes the quinquennial Census of Agriculture.
Net census undercoverage: The number of people missed less the number of people counted more than once. Following each census since the 1961 Census, the reverse record check (RRC) has been carried out to measure census population undercoverage. The RRC estimates the number of people missed in the census. This estimate is combined with the estimate from the census overcoverage study of the number of people enumerated more than once to calculate net undercoverage. In the Census of Agriculture, net census undercoverage—number of farms is the number of farms missed by the census less the number of farms counted more than once. As well, net census undercoverage—total farm area is the total farm area missed by the census less the total farm area counted more than once.
Response rates: The accuracy of the data disseminated by Statistics Canada is directly related to the accuracy of the data provided by respondents to its surveys or censuses. It follows that an important indication of accuracy is the percentage of respondents asked to provide data who actually do so. Generally, the higher the response rate, the greater the accuracy of census results.
Cost per dwelling: The total cost divided by the total number of dwellings.
1. A more detailed description of this program activity and planned release dates are available at http://www.statcan.gc.ca/about-apercu/structure/paa-aap-eng.htm and http://www.statcan.gc.ca/release-diffusion/index-eng.htm.