ARCHIVED - Infrastructure Canada - Report
 This page has been archived.
Archived Content
Information identified as archived on the Web is for reference, research or recordkeeping purposes. It has not been altered or updated after the date of archiving. Web pages that are archived on the Web are not subject to the Government of Canada Web Standards. As per the Communications Policy of the Government of Canada, you can request alternate formats on the "Contact Us" page.
2009-10
Departmental Performance Report
Infrastructure Canada
The original version was signed by
The Honourable Chuck Strahl, P.C., M.P.
Minister of Transport, Infrastructure and Communities
Table of Contents
- Minister's Message
- Section I: Departmental Overview
- Section II: Analysis of Program Activities by Strategic Outcome
- Section III: Supplementary Information
Minister’s Message

Chuck Strahl
As Canada’s Minister of Transport, Infrastructure and Communities, I am pleased to present Infrastructure Canada’s Departmental Performance Report for 2009-2010. The report outlines the department’s accomplishments in providing financial support for public infrastructure that strengthens the country’s economy as we move towards a promising and prosperous future.
Canada’s Economic Action Plan provided a $62 billion boost to create jobs, to support workers, to build consumer confidence and to strengthen our economy. Our government’s commitment to protect Canadians from the worst effects of the global downturn, to create jobs and to strengthen Canada’s economy included unprecedented funding to provincial, territorial and municipal infrastructure projects. These investments in infrastructure, such as improved transit systems, water facilities, roads and highways and community centres, have benefited Canadians across the country by improving their quality of life, contributing to a cleaner environment and a stronger economy.
Under the Economic Action Plan (EAP), the department is responsible for delivering $5.5 billion in new, short-term funding to support construction-ready infrastructure projects. It has also accelerated existing programs under the Building Canada Plan to make funding available sooner. I am proud that we have successfully managed our programs and delivered stimulus funding faster than any previous federal infrastructure program. In fact, the department was awarded the APEX 2010 Award for Leadership in Service Innovation, for delivering the new $4 billion Infrastructure Stimulus Fund in record time, giving a green light for construction on thousands of projects which provinces, territories, municipalities and other partners were ready to build. Across all of its funds, Infrastructure Canada has now committed more than $10.2 billion towards over 6,100 infrastructure projects as part of Canada’s Economic Action Plan. When combined with the contributions of our funding partners, there is close to $30.5 billion committed to infrastructure projects across the country.
Infrastructure Canada’s accomplishments in the first year of the Government of Canada’s two-year Economic Action Plan are having a very real and positive impact, both on the economy and the environment. We have cut red tape and streamlined the approval process to speed up the start of necessary infrastructure projects. The economy is improving, more Canadians are working, and communities are benefitting from world-class, modern infrastructure. While recognizing that much has been achieved, much remains to be done. The department will continue to focus on delivering commitments made under Canada’s Economic Action Plan and will work with our provincial, territorial and municipal partners to ensure that stimulus projects are substantially completed by March 31, 2011.
As we reach the end of the government’s stimulus programs, we will continue to provide Canadians with quality, cost-effective public infrastructure that meets their needs in a competitive economy, a cleaner environment and liveable communities through long-term funding programs such as the Building Canada Plan, the Green Infrastructure Fund and the Gas Tax Fund. Through both targeted short-term investments and long-term stable funding, our infrastructure investments are providing enduring benefits for Canadians.
I invite you to follow our progress as we move forward in implementing our infrastructure goals, at http://www.creatingjobs.gc.ca.
The Honourable Chuck Strahl, P.C., M.P.
Minister of Transport, Infrastructure and Communities
Section I: Departmental Overview
1.1 Summary Information
1.1.1 Raison d’être
Strong, modern, world-class public infrastructure is a key factor in achieving the Government of Canada's priorities of a stronger economy, a cleaner environment and more prosperous, safer communities. Infrastructure Canada leads the Government of Canada’s efforts in addressing Canada’s public infrastructure challenges.
1.1.2 Responsibilities
I. Overview
Infrastructure Canada is responsible for federal efforts to enhance Canada’s public infrastructure through strategic investments, key partnerships, sound policies and practical research. The department ensures that Canadians benefit from world-class public infrastructure by supporting initiatives from coast to coast to coast. As a focal point for infrastructure issues and programs, the department is also a centre of expertise for federal infrastructure and a key funding partner for cities and communities across Canada.
The department has played a leading role in delivering Canada’s Economic Action Plan (EAP), rolling out an unprecedented amount of infrastructure investment in record time. We have developed and implemented $5.5 billion worth of new infrastructure funding programs for construction-ready projects, and accelerated funding under the government’s $33 billion Building Canada Plan (BCP) announced in Budget 2007.
II. Programs
Infrastructure Canada delivers a broad range of infrastructure programs, providing flexible and effective funding support to provincial, territorial, municipal and private sector infrastructure projects. The department’s funding activities include:
- The $33 billion programs under BCP announced in Budget 2007;
- The $5.5 billion in programs delivered by the department under the EAP; and
- Several previous programs currently winding down.
The following is a brief overview of Infrastructure Canada’s main programs as managed under the Building Canada Plan, Economic Action Plan, and Sunsetting and Other Programs.
| Building Canada Plan | ||
|---|---|---|
| Provincial-Territorial Infrastructure Base Fund (PT-Base Fund) | $2.3 Billion | Provides an annual amount ($25 million per year) to provinces and territories for infrastructure priorities identified in each jurisdiction’s Annual Capital Plan.The Fund was designed to help restore the fiscal balance, particularly in jurisdictions with smaller populations. Under the Economic Action Plan, jurisdictions could choose to accelerate all or part of the fund to be spent by March 31, 2011. ($495 million was accelerated). (2007-2008 to 2013-2014). |
| Gas Tax Fund (GTF) | $5 Billion from 2005 to 2010. ($2 Billion a Year from 2010-2011 to 2013-2014) | Through provincial and other agreements, this program activity provides municipalities with predictable, long-term funding coupled with local decision-making to enable them to build and rehabilitate public infrastructure that achieves environmental outcomes. (Started in 2005-2006, and in Budget 2008 the government announced that it intends to make this program ongoing). |
| Building Canada Fund-Communities Component (BCF-CC) | $1 Billion | Provides funding to address the unique infrastructure pressures facing smaller communities focusing on project investments in communities with populations of less than 100,000. The fund leverages additional contributions from other partners by limiting the maximum federal share for funded projects to normally one-third, with matching contributions from both the provincial and municipal level. (2008-2009 to 2016-2017). |
| Building Canada Fund-Major Infrastructure Component (BCF - MIC) | $6.7 Billion | Targets larger, strategic infrastructure projects of national and regional significance. At least two-thirds of the funding is targeted to national priorities of water, wastewater, public transit, the core national highway system and green energy. By providing up to 50% federal funding on a cost-shared basis, it leverages additional contributions from other partners to promote increased investment in strategic infrastructure. (2008-2009 to 2016-2017). |
| Economic Action Plan | ||
|---|---|---|
| Green Infrastructure Fund (GIF) | $1 Billion | Provides funding over five years for infrastructure projects that promote cleaner air, reduced greenhouse gas emissions and cleaner water. The Green Infrastructure Fund provides up to 50% of eligible project costs to promote increased investment in infrastructure investment in support of a more sustainable economy. (2009-2010 to 2013-2014). |
| Infrastructure Stimulus Fund (ISF) | $4 Billion | Is intended to accelerate and increase the number of provincial, territorial, municipal and some not-for-profit infrastructure projects. It focuses on the rehabilitation of existing assets and new infrastructure that are construction-ready and can be substantially completed by March 31, 2011. By providing up to 50% federal funding to projects, the Infrastructure Stimulus Fund leverages funding from other partners, generating a much greater overall effect to the Canadian economy through infrastructure spending. (2008-2009 to 2010-2011). |
| Building Canada Fund-Communities Component Top-Up (BCF-CC Top-Up) | $500 Million | Provides additional funding in the amount of $500 million (added to the Building Canada Fund-Communities Component) to fund additional two-year infrastructure projects in communities with populations of less than 100,000. All Building Canada Fund-Communities Component funding had to be committed in order to access Top-Up funding. (2008-2009 to 2010-2011). |
| National Trails Coalition | $25 Million | Through Infrastructure Canada’s National Recreational Trails program, funding is provided to the National Trails Coalition, who in turn provides funding to its partners to create, upgrade and sustain non-motorized, snowmobile and all-terrain-vehicle trails throughout the country.The government’s contribution is equally matched (50%) by the Coalition and its partners. (The program began in 2009-2010 and all funds were committed in this fiscal year period). |
| Sunsetting and Other Programs | ||
|---|---|---|
| Canada Strategic Infrastructure Fund (CSIF) | $4.9 Billion | Provides funding for projects in areas that are vital to sustaining economic growth and enhancing the quality of life of Canadians. The Canada Strategic Infrastructure Fund leverages additional contributions from other partners by providing up to 50% funding for eligible projects. (2003-2004 to 2012-2013). |
| Municipal Rural Infrastructure Fund (MRIF) | $1.1 Billion | Provides funding for small-scale municipal infrastructure projects designed to promote and improve quality of life in both urban and rural communities. For most projects, the MRIF provides up to one-third federal funding for eligible projects. (2003-2004 to 2012-2013). |
| Border Infrastructure Fund (BIF) | $675 Million | Provides funding for investments in physical infrastructure, transportation system infrastructure and improved analytical capacity at surface border crossings. The fund provides up to 50% federal funding. (2003-2004 to 2012-2013). |
| Infrastructure Canada Program | $2.05 Billion | This program, which sunsetted in 2009-2010, was designed to enhance infrastructure in Canada’s urban and rural communities and to improve the quality of life through investments that protected the environment and supported long-term community and economic growth. Funding has been approved for over 3,700 projects since the fund’s inception in 2000-2001. (2000-2001 to 2009-2010). |
| Support for the G8 Summit (2010) | $50 Million | Provided funding for infrastructure projects that supported the hosting of the G8 Summit in June 2010 in Huntsville, Ontario, and provided a legacy to local communities and the region as a result of hosting the Summit. (2009-2010 to 2010-2011). |
Federal Delivery Partners
As the lead federal department responsible for infrastructure policy development and program delivery, Infrastructure Canada collaborates with other federal departments and agencies. The department’s Federal Delivery Partners (FDPs) are: Transport Canada, Indian and Northern Affairs Canada, Industry Canada, Western Economic Diversification, Canada Economic Development for Quebec Regions, and the Atlantic Canada Opportunities Agency.
These departments and agencies share their knowledge of local needs and priorities, as well as their technical expertise, resources and governance structures and are critical to Infrastructure Canada in fulfilling its mandate.
PROJECT SPOTLIGHT
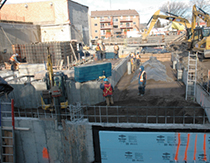
Reduced Operating Costs: Enhanced Recycling, More Jobs
Saint John, New Brunswick
 |
A $220,477 contribution from the Communities Component of the federal Building Canada Fund has improved the recycling process in Saint John, reducing the volume of recyclable materials ending up in landfills. The Fundy Region Solid Waste Commission used the funds to build a sorting conveyor that facilitates the separation of recyclables, and to buy new baling equipment that packages the sorted materials on-site for direct shipment to buyers. |
1.1.3 Strategic Outcome and Program Activity Architecture (PAA)
In accordance with the Treasury Board’s Management, Resources and Results Structure Policy, Infrastructure Canada’s Program Activity Architecture (PAA) structure provides a framework for all departmental activities. It organizes resource allocation (both human and financial) against activities and expected outcomes, and provides a meaningful way to link activities to broader Government of Canada Outcomes.
Infrastructure Canada’s PAA structure continues to evolve as priorities change, the department is given more responsibilities, and the number of programs increases. In late 2009, the department’s Strategic Outcomes and PAA structure were amended to reflect its activities and new responsibilities. The new structure is detailed in Figure 1, under the following three strategic outcomes:
- Provinces, territories and municipalities have federal financial support for their infrastructure priorities: Provides federal transfers to provincial, territorial and municipal governments for their local infrastructure priorities and to help maintain a level of core infrastructure across the country.
- Funding for quality, cost-effective public infrastructure that meets the needs of Canadians in a competitive economy, a cleaner environment and liveable communities is provided: Provides targeted project-specific investments to address federal/provincial priorities in smaller communities as well as large strategic investments of national and regional benefit.
- Construction-ready infrastructure projects are provided with federal funding support: Provides timely, temporary and targeted funding to construction-ready projects to support short-term economic stimulating over a two-year period to March 31, 2011 under the Economic Action Plan.
The strategic outcomes highlight three major activity areas of the department. They speak to the long-term benefits of our infrastructure investments under programs such as the Building Canada Plan, and of our more temporary activities – such as the significant funding being provided under the Economic Action Plan.
This document reports on the basis of the latest approved PAA, as reflected in the 2010-2011 Report on Plans and Priorities, in order to adequately report on the EAP programs of 2009-2010. Each program activity is discussed in detail in Section II of this report.
Figure 1: Program Activity Architecture
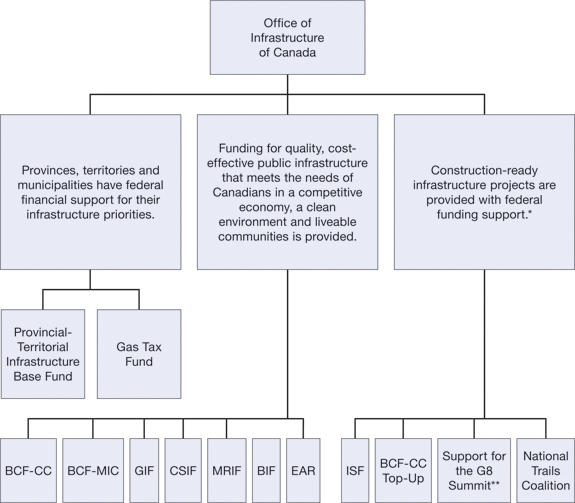
| * |
This is a temporary strategic outcome to accommodate short-term measures including the Economic Action Plan initiatives assigned to Infrastructure Canada. Funding in support of the G8 Summit and for the National Trails Coalition was provided in 2009-2010. |
| ** |
These funds are not part of the Economic Action Plan. |
|
Additional note: An additional program activity, Internal Services, is not reflected in this chart. |
Acronymns
BCF-CC – Building Canada Fund-Communities Component
BCF-MIC – Building Canada Fund-Major Infrastructure Component
GIF – Green Infrastructure Fund
CSIF – Canada Strategic Infrastructure Fund
MRIF – Municipal Rural Infrastructure Fund
BIF – Border Infrastructure Fund
EAR – Economic Analysis and Research
ISF – Infrastructure Stimulus Fund
BCF-CC – Top-Up – Building Canada Fund-Communities Component Top-Up
1.1.4 Program Activity Architecture Crosswalk
Until 2009-2010, Infrastructure Canada had one strategic outcome: “Quality, cost-effective public infrastructure that meets the needs of Canadians in a competitive economy, a clean environment and liveable communities”, and five program activities:
- Targeted Provincial Project-Based Infrastructure Funding;
- Provincial-Territorial Infrastructure Base Fund;
- Gas Tax Fund;
- Knowledge and Research; and
- Internal Services.
Under the new PAA adopted in late 2009, the Targeted Project-based Infrastructure Funding program activity was dropped, and the five funding programs which were previously under that activity became program activities in their own right.
In fact, each of the department’s 12 major funding programs are now individual program activities. Knowledge and Research (now called Economic Analysis and Research) and Internal Services remain as program activities.
The new PAA organizes program activities under three strategic objectives (see Figure 1).Funding, human resources and performance indicators are organized against the 14 activities. This amendment to the program activity architecture structure is reflected in the 2010-2011 Report on Plans and Priorities. Each program activity is discussed in detail in Section II of this report.
1.2 Summary of Performance
2009-2010 was the most challenging and successful year in Infrastructure Canada’s short history. Faced with the worst economic recession since the 1930s, the Government introduced the Economic Action Plan (EAP) in Budget 2009 to quickly turn the economy around and create jobs.With stimulus spending on infrastructure as a key part of the EAP package, the department had to work quickly to respond to the challenge.
In just two months after Budget 2009 was introduced in January 2009, new infrastructure programs such as the Infrastructure Stimulus Fund had been developed, approved and launched. We also worked to accelerate funding and project approvals for already-existing infrastructure programs under our existing Building Canada Plan. Key to our efforts in developing our new programs was creating streamlined on-line application and approval processes to make it easier and faster for project proponents to apply for funding, and for the department to review applications.
In the early part of fiscal year 2009-2010, Infrastructure Canada continued to move very quickly, negotiating and signing funding agreements with all provinces and territories. We received and reviewed thousands of project applications from municipalities, provinces/territories and other project proponents under the Infrastructure Stimulus Fund and the Building Canada-Communities Component Top-Up alone. We committed close to $10.2 billion in funding to more than 6,100 projects across Canada. That $10.2 billion committed is leveraging significant funding from partners, providing an incredible $30.5 billion in overall infrastructure investment. Infrastructure Canada delivered in record time – program design and implementation, project applications and approvals, and funding commitments were done in a matter of months, a process that in the past has taken several years.
Today, there is work underway in every province and territory – everything from road work and bridges to water works, libraries and recreation centres. (The Project Spotlights throughout Section I of this report give examples of these projects). Close to 4,200 projects are underway as of August 2010, worth a total of $20 billion in total investment. People are working, and communities are receiving vital infrastructure.
As the department moves into the 2010-2011 fiscal year, we have shifted our focus from committing EAP funding to ensuring that projects are completed, financial claims from proponents are processed quickly and efficiently, and Canadians and communities are receiving short- and long-term value from our investments.
PROJECT SPOTLIGHT
New, Safe Water Supply
Lorette, Manitoba
 |
With the help of $600,000 from the Communities Component of the Building Canada Fund, the community of Lorette, Manitoba got a new water supply well, a one-million-litre concrete reservoir, and a pumping station with filtration and disinfection capacity. The project eliminated potable water contamination in Lorette's municipal system and extends service to more of the town's 2,100 residents. |
1.2.1 Financial and Human Resources
Infrastructure Canada’s financial and human resources information over the reporting period are summarized in the two tables that follow.
Table 1: 2009-2010 Total Financial Resources
| Planned Spending | Total Authorities1 | Actual Spending |
|---|---|---|
| 7,134,885 | 5,470,649 | 4,218,060 |
Table 2: 2009-2010 Total Human Resources
| Planned | Actual2 | Difference |
|---|---|---|
| 256 | 298 | 42 |
For comparison purposes, the financial and human resources information for 2008-2009 is presented in the tables below:
Table 3: 2008-2009 Total Financial Resources
| Planned Spending | Total Authorities | Actual Spending |
|---|---|---|
| 2,910,254 | 3,350,720 | 2,279,846 |
Table 4: 2008-2009 Total Human Resources
| Planned | Actual | Difference |
|---|---|---|
| 257 | 231 | (26) |
As a small department, Infrastructure Canada's employees work on multiple programs and are not permanently linked to any specific program. This flexibility has allowed the department to re-allocate individuals and use resources on more than one single funding program. This has been one of its key success factors in moving quickly to develop, implement and manage the new programs under the EAP. For the purposes of this document, where applicable and appropriate, FTEs and actual spending are aligned with specific programs, as delivered in 2009-2010.
1.2.2 Program Activities by Strategic Outcome and Actual Spending
Table 5 summarizes the achieved results of the 14 main program activities, the actual spending under each activity, as well as the alignment of these activities to the Government of Canada outcomes. The overall expected results for these program activities are improved and increased stock of core public infrastructure and improved quality of life and economic opportunities for Canadians. Internal Services is also in this table, which underpins and supports the entire department in meeting Government of Canada outcomes.
Table 5: Performance Summary
| Strategic Outcome 1: Provinces, territories and municipalities have federal financial support for their infrastructure priorities. | ||||||
|---|---|---|---|---|---|---|
| Performance Indicators | Results | 2009-2010 Performance | ||||
| The number of agreements signed between the department and its partners, the number of initiatives approved, amount of federal funding committed, and funding leveraged from its partners and stakeholders. |
As part of the EAP, the department accelerated funding under the Provincial-Territorial Infrastructure Base Fund in eight provinces and territories. We signed eight contribution agreements, approved plans with 318 initiatives, and committed $1.1 billion in funding which leveraged an additional $1.6 billion in overall investment. In 2009-2010 Infrastructure Canada transferred $1.8 billion in Gas Tax Fund money to over 3,600 Canadian municipalities. |
Faced with the enormous challenge of delivering infrastructure investments under the EAP in record time, the department successfully accelerated funding under the P/T Base Fund to those provinces and territories who opted for it. The department also continued to successfully implement the Gas Tax Fund, signing amendments to agreements to extend funding until 2014. |
||||
| Program Activity | 2008-2009 Actual Spending | 2009-20103 | Alignment to Government of Canada Outcomes4 | |||
|---|---|---|---|---|---|---|
| Main Estimates | Planned Spending | Total Authorities | Actual Spending | |||
| Provincial-Territorial Infrastructure Base Fund | 390,602 | 329,131 | 824,131 | 771,831 | 672,032 | Strong Economic Growth |
| Gas Tax Fund | 986,006 | 1,976,488 | 1,976,488 | 1,974,980 | 1,873,874 | Strong Economic Growth |
| Sub-Total: | 1,376,608 | 2,305,619 | 2,800,619 | 2,746,811 | 2,545,906 | |
| Strategic Outcome 2: Funding for quality, cost-effective public infrastructure that meets the needs of Canadians in a competitive economy, a cleaner environment and liveable communities is provided. | ||||||
|---|---|---|---|---|---|---|
| Performance Indicators | Results | 2009-2010 Performance | ||||
| The number of agreements signed between the department and its partners, the number of projects approved by the department, amount of federal funding committed by the department, and dollars leveraged from its partners and stakeholders. |
As part of the EAP, the department significantly accelerated funding under several programs, including the Building Canada Plan-Major Infrastructure Component. The Community Component was also accelerated, and fully committed in all provinces. Overall, for all of the programs under this strategic outcome, the department has committed $8.6 billion in funding to nearly 3,100 projects worth $43.3 billion. Section II provides greater details of each individual program. |
By working with partners to effectively and efficiently accelerate funding and approve projects, Infrastructure Canada is delivering on its significant EAP commitments. It has approved projects and committed an unprecedented amount of funding in record time. |
||||
| Program Activity | 2008-2009 Actual Spending | 2009-20105 | Alignment to Government of Canada Outcomes6 | |||
|---|---|---|---|---|---|---|
| Main Estimates | Planned Spending | Total Authorities | Actual Spending | |||
| Building Canada Fund-Communities Component | 808 | 117,500 | 117,500 | 207,935 | 101,065 | Strong Economic Growth |
| Building Canada Fund-Major Infrastructure Component | 55,425 | 674,257 | 665,090 | 594,969 | 196,876 | Strong Economic Growth |
| Green Infrastructure Fund7 | See Footnote 7 | See Footnote 7 | 200,000 | 5,160 | 5,760 | Clean and Healthy Environment |
| Canada Strategic Infrastructure Fund | 505,429 | 484,239 | 513,410 | 648,876 | 420,202 | Strong Economic Growth |
| Municipal Rural Infrastructure Fund | 220,324 | 483,763 | 483,763 | 483,763 | 221,766 | Strong Economic Growth |
| Border Infrastructure Fund | 81,111 | 66,715 | 66,715 | 99,987 | 80,863 | Strong Economic Growth |
| Economic Analysis and Research | 1,747 | 10,398 | 19,565 | 10,609 | 4,142 | Innovative and Knowledge-Based Economy |
| Internal Services | 38,394 | 18,223 | 18,223 | 70,765 | 51,837 | |
| Sub-Total: | 903,238 | 1,855,095 | 2,084,266 | 2,122,064 | 1,082,511 | |
| Strategic Outcome 3: Construction-ready infrastructure projects are provided with federal funding support. | ||||||
|---|---|---|---|---|---|---|
| Performance Indicators | Results | 2009-2010 Performance | ||||
|
The number of agreements signed between the department and its partners, the number of projects approved by the department, amount of federal funding committed by the department, and dollars leveraged from its partners and stakeholders. |
Under this strategic outcome, Infrastructure Canada launched new funding programs coming out of the EAP, and fully committed all funding. Overall, since the inception of all of the programs under this strategic outcome, the department has committed more than $4.5 billion in funding to more than 5,000 projects worth $10.1 billion. Section I provides greater details of each individual program. Through its efforts, Infrastructure Canada is providing short-term economic stimulus, timely and temporary funds for construction-ready projects to support short-term economic stimulus. |
Working with provinces, territories, municipalities and other partners, Infrastructure Canada moved from new program design to project approvals and funding commitments in a matter of months. |
||||
| Program Activity | 2008-2009 Actual Spending | 2009-20108 | Alignment to Government of Canada Outcomes9 | |||
|---|---|---|---|---|---|---|
| Main Estimates | Planned Spending | Total Authorities | Actual Spending | |||
| Infrastructure Stimulus Fund10 | See Footnote 10 | See Footnote 10 | 2,000,000 | 496,729 | 493,129 | Strong Economic Growth |
| Building Canada Fund-Communities Component Top-Up10 | See Footnote 10 | See Footnote 10 | 250,000 | 30,045 | 30,745 | Strong Economic Growth |
| Support for the G8 Summit (2010)11 | See Footnote 11 | See Footnote 11 | See Footnote 11 | 50,000 | 40,669 | Strong Economic Growth |
| National Trails Coalition11 | See Footnote 11 | See Footnote 11 | See Footnote 11 | 25,000 | 25,100 | Strong Economic Growth |
| Sub-Total: | 2,250,000 | 601,774 | 589,643 | |||
| Total Actual Spending: | 2,279,846 | 4,160,714 | 7,134,885 | 5,470,649 | 4,218,060 | |
PROJECT SPOTLIGHT
Preserving Inuit Culture in Nunavut: Piqqusilirvvik (Inuit Cultural Learning Facility)
Clyde River, Nunavut
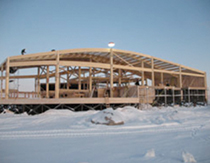 |
With $182.68 million from the Provincial-Territorial Base Fund, Nunavut is undertaking several initiatives, including building a new Inuit cultural learning centre on the northeast coast of Baffin Island. The centre will be used as a school, as well as a learning centre for elders to help young people maintain their cultural values. The facility will help protect Inuit culture and history and will play a vital role in the promotion and preservation of Inuit culture, language and heritage for future generations. |
1.3 Contribution of Priorities to Strategic Outcomes
Infrastructure Canada’s priorities for 2009-2010 included one operational priority and two management priorities that were either ongoing or previous commitments:
Operational Priority
- To expedite investments in provincial, territorial and municipal infrastructure projects.
Management Priorities
- To respond to opportunities for improvement identified in the Management Accountability Framework (MAF) assessments of 2008; and
- To support Public Service Renewal and improve People Management.
Table 6: Contribution of Priorities to Strategic Outcome
| Operational Priorities | Type12 | Status | Linkages to Strategic Outcome (s) |
|---|---|---|---|
| 1. To expedite investments in provincial, territorial and municipal infrastructure projects. | New | In 2009-2010 Infrastructure Canada launched new programs under EAP, and accelerated funding under existing programs. The department negotiated and signed agreements with all provinces and territories, and approved and committed close to $10.2 billion to over 6,100 projects. This is leveraging total infrastructure investments of close to $30.5 billion nationally. We successfully delivered year one of EAP in record time. | Strategic Outcome 1 |
| Management Priorities | Type12 | Status | Linkages to Strategic Outcome (s) |
|---|---|---|---|
| 1. To respond to opportunities for improvement of the Management Accountability Framework (MAF) assessment of 2008. | New |
Infrastructure Canada’s 2009-2010 MAF assessment was generally positive, with improved ratings in some key areas. For example, the department strengthened its internal audit and evaluation functions, allowing it to better assess the relevance, success and cost-effectiveness of its programs. The department is currently developing measures to maintain our positive ratings, and to address areas needing improvement. |
Strategic Outcome 1 |
| 2. To support Public Service Renewal and improve People Management. | Ongoing | In 2009-2010 Infrastructure Canada developed and implemented a Vision for People Management, and revised the Integrated Business and Human Resources Plan (IBHRP) to incorporate this vision into action planning, and to develop measurable indicators. The People Management Committee is monitoring implementation of the plan via monthly meetings and quarterly statistics. As a result, the department has improved on its recruitment and retention targets, and made significant progress in addressing the priorities set out in the Public Service Renewal Action Plan. | Strategic Outcome 1 |
PROJECT SPOTLIGHT
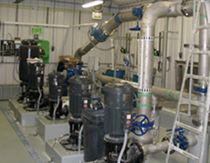
Desjardins Drinking Water Treatment Facility
Lévis, Quebec
 |
With almost $10.8 million from the federal Building Canada Fund, the upgrades to the Desjardins Drinking Water Treatment Facility will support growing community, industrial and commercial demands for reliable, potable water in Lévis, Quebec. By adding filters and an ultraviolet disinfection system, and completing building repairs, the facility will almost triple its production capacity – meeting the water needs of the area for the next 30 years. |
1.4 Risk Analysis
1.4.1 Risk Analysis Approach
Infrastructure Canada applies a comprehensive approach to actively identify, assess, and manage risks at four distinct levels: Strategic, operations, program and project. The department conducts regular environmental scans to identify internal and external risk factors. These risks are then analyzed to determine probability and potential impact, and mitigation strategies are developed. All of this is captured in the department’s Corporate Risk Profile and semi-annual Report on Risk Responses and Re-Assessment of Critical Risk Placements. The department also performs specific risk analyses for its large programs, such as the Infrastructure Stimulus Fund and the Building Canada-Major Infrastructure Component.
1.4.2 Changing Economic Conditions and Government-Wide Priorities
Within the last few years, the Canadian economy has faced extraordinary challenges. The government’s Economic Action Plan committed $12 billion to infrastructure improvements to help stimulate the economy. Following the meeting of First Ministers in January 2009, Infrastructure Canada moved quickly to reduce duplication and streamline federal processes to accelerate federal infrastructure funding. It committed funding to thousands of projects through new programs – and accelerated funding under existing ones – in partnership with provincial, territorial and municipal governments. This included identifying projects in each jurisdiction that could be completed by March 31, 2011.
Under the EAP, the Government of Canada launched a national partnership with provinces, territories and municipalities, who provided matching funding for projects, and identified projects that could be tracked and substantially completed by March 31, 2011.
For its part, Infrastructure Canada streamlined its project review and approval process and the government approved new regulations to accelerate environmental approvals while protecting the environment. As a result, Infrastructure Canada launched programs and approved projects in record time, allowing partners, who manage construction, to proceed quickly.
1.4.3 Key Critical Risks
Human Resources Capacity and Capability
The 2009 Corporate Risk Profile identified human resources challenges as the most significant risk to the department’s ability to deliver on its mandate. In addressing this risk, the department worked to complete its Integrated Business and Human Resources Plan, recruit skilled individuals and decrease the staff turnover rate. This included aggressively putting in place staffing strategies, conducting orientation sessions for its new employees, and developing business models and work tools to support employees. Because of these efforts, this risk has moved from an “Acceptable Risk” to a “Manageable Risk” in the Corporate Risk Profile.
1.4.4 Oversight of Infrastructure Projects
Fast-tracking thousands of project approvals and accelerating infrastructure funding in partnership with provincial, territorial and municipal governments presented an important challenge in ensuring oversight of projects. This challenge was assessed as the second highest risk to Infrastructure Canada’s achievement of its mandate. But thanks to risk responses such as establishing accountability mechanisms, creating oversight and management committees, and more rigorous project application and reporting systems, the likelihood and potential impact of this risk has been reduced.
PROJECT SPOTLIGHT
Working Together: Improving Public Safety
Pouce Coupe, British Columbia
 |
With $200,000 in federal assistance from the Infrastructure Stimulus Fund, Pouce Coupe, a village in British Columbia’s Peace River Valley, built and opened a new fire hall in 2009. It now houses the village's two pumpers and one tanker, and provides training facilities for volunteers, helping give Pouce Coupe a modern, up-to-date fire department. |
1.5 Expenditure Profile
1.5.1 Spending Trends
Infrastructure Canada’s spending has increased significantly as the department continues to implement the new programs under the Economic Action Plan (EAP) and its existing programs. Figure 2 represents the department’s forecast and actual spending profile from 2005-2006 to 2009-2010. From 2005-2006 to 2007-2008, total spending included all Parliamentary appropriation sources: Main Estimates, Supplementary Estimates, Treasury Board Votes 10, 15 and 22, as well as carry-forward adjustments. Spending up to 2009-2010 corresponds to previously planned, plus spending related to new infrastructure funds announced in Budget 2009. Spending related to the EAP started in 2009-2010, and is planned to continue until 2011-2012 (except for the Green Infrastructure Fund, which is planned to continue until 2013-2014).
Figure 2: Departmental Spending Trend and the Economic Action Plan (EAP)
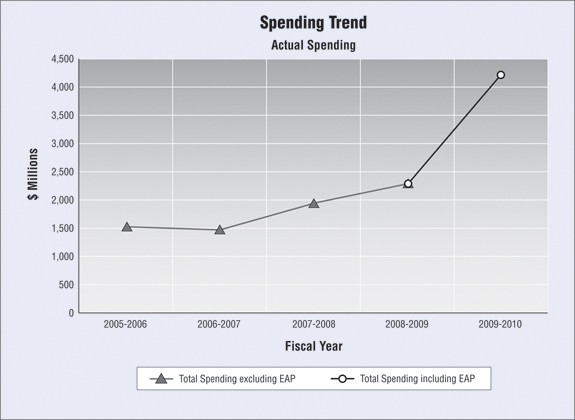
In 2009-2010, Infrastructure Canada spent a record $4.2 billion on infrastructure investments under new and sunsetting programs. The department’s spending increased by 85% over 2008-2009, which was also a record year.
Statutory funding authority for the programs under the Economic Action Plan was provided in the Budget Implementation Act. These programs are: The Infrastructure Stimulus Fund, the accelerated funding under the Provincial-Territorial Infrastructure Base Fund, the Green Infrastructure Fund and the Building Canada Fund-Communities Component Top-Up, all of which are expected to be completed by March 31, 2011.
1.5.2 Variations in Program Spending Trends
In 2009-2010, Infrastructure Canada flowed a record amount of funding to provinces, territories, municipalities and non-governmental organizations to support public infrastructure projects. Through a suite of transfer payment programs, the department supports quality, cost-effective public infrastructure investments across Canada.
Program design recognizes the provincial, territorial and municipal responsibility for a majority of public infrastructure, and Infrastructure Canada's participation as a funding partner. The department is not responsible for the management of infrastructure projects, but rather for the reimbursement of eligible expenses submitted by recipient project managers (for contributions programs), or in the case of other transfer payment programs, it provides stable base funding to provinces, territories and municipalities under the terms of signed agreements.
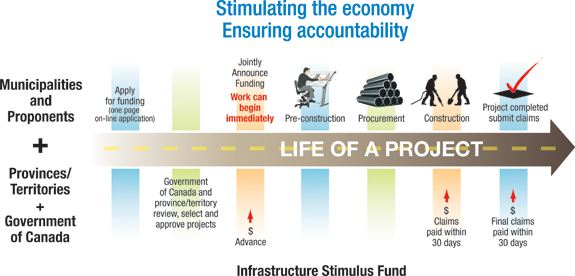
It is important to note that the department’s cash flow lags behind the actual rate of construction of projects, and is not a good indicator of economic activity. Work begins upon project approval: contracts are put in place, plans drawn up, materials are ordered and construction starts. While the department commits funds immediately upon approval, federal funding only flows to recipients to reimburse actual costs incurred as construction proceeds. In many cases, recipients wait until completion of the project before submitting a claim. Upon receiving completed claims, the department pays in 30 days.
We continually work with our partners to ensure our forecasts are as accurate as possible, and to reprofile Infrastructure Canada’s funding to meet the needs of our partners.
As such, the $1.2 billion of unspent 2009-2010 authorities has been re-profiled to future years to better match the needs of our partners.
1.5.3 Voted and Statutory Items
Table 7: Voted and Statutory Items Listed in Main Estimates
| Vote # or Statutory Item (s) | Truncated Vote or Statutory Wording | 2007-2008 Actual Spending | 2008-2009 Actual Spending | 2009-2010 Main Estimates | 2009-2010 Actual Spending |
|---|---|---|---|---|---|
| 50 | Operating expenditures | 35,177 | 36,637 | 40,283 | 59,391 |
| 55 | Contributions | 1,917,009 | 2,240,257 | 4,117,074 | 3,448,906 |
| (S) | Contributions13 | – | – | – | 705,317 |
| (S) | Contributions to employee benefit plans | 2,582 | 2,952 | 3,357 | 4,446 |
| Total | 1,954,768 | 2,279,846 | 4,160,714 | 4,218,060 | |
In 2009-2010, Infrastructure Canada spent a record of over $4.2–billion on infrastructure investments under new and sunsetting programs to meet the expected results of its program activities and contribute to its strategic outcomes. This represents an increase of $1.9–billion over the previous year. This was primarily due to new funding received for the Building Canada Fund (BCF), the doubling of the Gas Tax Fund (GTF), as well as the new programs introduced by the Economic Action Plan (EAP) in Budget 2009.
The Main Estimates can be accessed at: http://www.tbs-sct.gc.ca/est-pre/20092010/p2-eng.asp.
Section II: Analysis of Program Activities by Strategic Outcome
2.1 Program Activities and Strategic Outcomes
Infrastructure Canada has three strategic outcomes in support of its mandate.
- Provinces, territories and municipalities have federal financial support for their infrastructure priorities;
- Funding for quality, cost-effective public infrastructure that meets the needs of Canadians in a competitive economy, a clean environment and liveable communities is provided, and
- Construction-ready infrastructure projects are provided with federal funding support.
The strategic outcomes highlight three major activity areas of the department. They speak to the long-term benefits of our infrastructure investments under such programs as the Building Canada Plan, and of our more short-term activities – such as the significant funding being provided under the Economic Action Plan.
They also meet the requirements of the Management, Resources and Results Structure Policy, and provide tangible, measurable goals for the department that are within its scope of influence.
The information presented in this section is organized according to Infrastructure Canada’s current Program Activity Architecture structure, which consists of 13 program activities plus an Internal Services activity: Provincial-Territorial Infrastructure Base Fund, Gas Tax Fund, Building Canada Fund-Communities Component, Building Canada Fund-Major Infrastructure Component, Green Infrastructure Fund, Canada Strategic Infrastructure Fund, Municipal Rural Infrastructure Fund, Border Infrastructure Fund, Economic Analysis and Research, Infrastructure Stimulus Fund, Support for G8 Summit (2010), and National Trails Coalition. Internal Services underpins and supports all strategic outcomes.
Overall, the programs activities result in the construction, renewal and/or enhancement of public infrastructure, contributing to broad government objectives of a competitive economy, a clean environment and liveable communities.
As previously mentioned in this report, the department’s PAA structures have changed significantly over the years to accommodate the continued increase of programs and the scope of the department’s mandate. Infrastructure Canada is currently developing a Performance Measurement Framework to reflect the changes in the department’s objectives and activities. It will take a holistic and horizontal approach to performance management, and establish performance indicators and targets under each program activity.
2.2 Strategic Outcome 1
Provinces, territories and municipalities have federal financial support for their infrastructure priorities.
2.2.1 Provincial-Territorial Infrastructure Base Fund
Table 8: Provincial-Territorial Infrastructure Base Fund
| Program Activity Summary: This fund, as originally designed, provides a pre-determined level of base funding of $25 million per year over seven years to provinces and territories for infrastructure initiatives. Through the Economic Action Plan, the Government of Canada offered each province and territory the opportunity to accelerate funding under this program to provide short-term economic stimulus. The department fast-tracked the negotiation and execution of eight accelerated funding agreements, quickly ensured approval of provincial and territorial funding proposals, and committed over $1.1 billion towards infrastructure initiatives in 2009-2010. Provinces and territories submit a list of infrastructure initiatives through a capital plan and federal funding flows when the plans are accepted by the Minister. Capital plans can include eligible infrastructure initiatives, including the construction, rehabilitation and safety-related maintenance of infrastructure in almost all the project categories eligible under the Building Canada Fund, as well as secondary provincial highway infrastructure. Payments are made in advance and provinces and territories may pool, bank, or cash-manage these funds to give them flexibility in implementation. The program was designed to help restore the fiscal balance while enhancing Canada’s public infrastructure system. It also enhances economic competitiveness and productivity, and promotes cleaner air, water and land, and stronger and healthier communities. Canadians in all provinces and territories are benefitting from this investment in modern public infrastructure, particularly in jurisdictions with smaller populations. While payments are made to provinces and territories, ultimate recipients also include local and regional governments or private sector bodies. Funding will be matched by provinces (50% federal share) and territories (75% federal share) to maximize investment by all orders of government. | |||||
|---|---|---|---|---|---|
| 2009-2010 Financial Resources (in $ thousands) |
2009-2010 Human Resources (FTEs) | ||||
| Planned Spending | Total Authorities | Actual Spending | Planned | Actual | Difference |
| 824,131 | 771,831 | 672,032 | 5 | 2 | 3 |
| Results | Performance Indicators | Targets | Performance Status | Performance Summary |
|---|---|---|---|---|
|
In 2009-2010, Infrastructure Canada:
|
Number of accelerated agreements signed. | Sign agreements with all provinces to accelerate programs. | Eight agreements were signed. |
In 2009-2010, the program successfully provided timely, accelerated funding for infrastructure initiatives across Canada, and leveraged significant investments from partners. Provincial-Territorial Infrastructure Base Fund terms and conditions were amended in order to accelerate funding in fiscal year 2009-2010 and 2010 in support of the Economic Action Plan. The department successfully fast-tracked the negotiation and execution of agreements with provinces and territories who opted to accelerate funding. Capital plans proposed by provinces and territories were approved quickly, while continuing to maintain appropriate program controls. |
| Number of initiatives approved. | Approve all initiatives under the program. | 318 initiatives approved. | ||
| Amount of federal funding committed. | Commit the entire funding envelope under the program. | $1.1 billion committed. | ||
| Amount of dollars leveraged. | Amount of dollars leveraged from other partners at least equal to federal funding. | $1.6 billion in additional funding leveraged. |
Economic Action Plan (EAP): Through the Economic Action Plan (EAP), the Government of Canada committed to accelerate existing infrastructure investments under this fund. For those provinces and territories that had agreed to cost-share and match accelerated federal funding, the program focused on initiatives that could begin construction over the 2009-2010 and 2010-2011 fiscal years. As of March 31, 2010, eight jurisdictions have signed accelerated funding agreements. In 2009-2010, the total accelerated spending was $179.4 million.
Benefits for Canadians: The Provincial-Territorial Infrastructure Base Fund provides stable, predictable annual funding. It also offers significant flexibility to provinces and territories to support their core infrastructure priorities, including most of the categories under the Building Canada Fund, as well as all road infrastructure and the safety-related rehabilitation of infrastructure. By accelerated funding under the EAP, the department provided important financial stimulus to the economy and contributed to the long-term prosperity of communities.
Performance Analysis: In 2009-2010, Infrastructure Canada fast-tracked the negotiation and execution of agreements to accelerate funding with the following eight jurisdictions: British Columbia, Alberta, Saskatchewan, Manitoba, Quebec, Nova Scotia, Prince Edward Island and the Northwest Territories. The department also quickly approved 20 capital plans for these provinces and territories, collectively resulting in federal funding commitments of more than $1.1 billion towards 318 initiatives. These plans leveraged an additional $1.65 billion from provinces, territories, municipalities and other funding partners. The remaining funds will flow once provinces and territories have satisfied the remaining conditions for payment in accordance with their funding agreements.
Lessons Learned: In 2009-2010, Infrastructure Canada focused on the transition of the fund from program start-up and negotiation of funding agreements to acceleration, approval of annual capital plans and expenditure reports, and expediting payments. Since its inception, the program has proven extremely efficient, and 2009-2010 was no exception.
The signed acceleration agreements, fast approval of capital plans, funding commitments and the additional funds leveraged highlight the significant benefits that can be quickly achieved by streamlined programs. This will be useful for Infrastructure Canada and other departments as future transfer payment programs are developed, designed and implemented to address public policy priorities.
2.2.2 Gas Tax Fund
Table 9: Gas Tax Fund
| Program Activity Summary: The Gas Tax Fund provides municipalities with predictable long-term funding coupled with local decision-making to enable them to build and rehabilitate their core public infrastructure. The federal government entered into Gas Tax Fund Agreements with provinces, territories, the Association of Municipalities of Ontario, the Union of British Columbia Municipalities and the City of Toronto. These agreements establish an accountability framework allowing the Government of Canada to flow Gas Tax Fund money twice a year to signatories which in turn, flow funds to municipalities based on an agreed-upon allocation formula. For their part, municipalities decide which projects to prioritize within established investment categories. Projects focus on ensuring cleaner air, cleaner water and reduced greenhouse gas emissions, and increasing communities’ long-term planning capacities. Municipalities can pool, bank and borrow against this funding, providing significant additional financial flexibility. Eligible recipients are required to report annually on their use of funds and their compliance to terms and conditions of the federal-provincial Gas Tax Fund Agreements. Budget 2007 added $8 billion in new funding and extended the Gas Tax Fund from 2010 to 2014, doubling it to $2 billion per year. Budget 2008 announced that the government intends to make it ongoing. | |||||
|---|---|---|---|---|---|
| 2009-2010 Financial Resources (in $ thousands) |
2009-2010 Human Resources (FTEs) | ||||
| Planned Spending | Total Authorities | Actual Spending | Planned | Actual | Difference |
| 1,976,488 | 1,974,980 | 1,873,874 | 15 | 15 | 0 |
| Results | Performance Indicators | Targets | Performance Status | Performance Summary |
|---|---|---|---|---|
|
In 2009-2010, Infrastructure Canada:
|
Amount of federal funding received by municipalities. | Municipalities received 95% of funds transferred to provinces and territories in 2008-2009. | $959 million transferred to municipalities (97.1%) in 2008-2009. |
Since the program’s inception in 2005, $5.5 billion has flowed from the Government of Canada for municipal infrastructure through the fund, and more than 3,400 municipalities have received funding. Municipalities have spent funds transferred on approximately 7,000 projects. According to the national roll-up of outcomes reports from all jurisdictions, Gas Tax Fund funding has resulted in 3,395 completed projects, with the largest categories of investment being in water, wastewater and public transit. |
| Number of municipal recipients that received Gas Tax Fund funding. | 95% of 3,612 eligible municipalities received their allocations. | 93% of municipalities (over 1,500) received their Gas Tax Fund allocations. | ||
| Number of extension agreements signed. | Sign extension agreements with all 13 jurisdictions. | All 13 jurisdictions have signed extension agreements and confirmed municipal allocations. | ||
| Number of jurisdictions that produced Outcomes Reports. | All 13 jurisdictions produce outcomes reports. | All 13 jurisdictions have produced outcomes reports. |
Economic Action Plan (EAP): In 2008-2009 and 2009-2010 Infrastructure Canada accelerated the delivery of the first payments to signatories three months in advance so municipalities could take advantage of the spring and summer construction season.
Benefits for Canadians: By combining predictable long-term funding with local decision-making, municipalities can better plan and implement sustainable investments in core public infrastructure that contribute to cleaner air and water, and to reducing greenhouse gas emissions. Since the program’s inception, $5.5 billion in Gas Tax Fund funding has flowed from the federal government to municipal recipients. Jurisdictions report annually, providing expenditure details for the previous fiscal year. In 2009-2010 Infrastructure Canada received results for 2008-2009, showing that of the funds transferred, municipalities had spent almost $2.2 billion on over 7,000 projects.
Performance Analysis: In 2009-2010, Infrastructure Canada coordinated and collaborated with provinces, territories and municipalities to implement and administer the fund. It completed amendments to the Gas Tax Fund Agreements to extend funding until 2014, and determined annual transfer payment allocations for the extension period, allowing for predictable, long-term infrastructure planning. The department also supported all signatories in developing their outcomes reports. According to the national roll-up of all outcomes reports, Gas Tax Fund investments have resulted in 3,395 completed projects, many of them water, wastewater and public transit.
Lessons Learned: The Gas Tax Fund formative evaluation and the outcomes reports provided by the signatories demonstrate the fund is effective in addressing the ongoing infrastructure needs of Canadian municipalities, and efficiently meets its expected results of cleaner air, cleaner water and reduced greenhouse gas emissions. There is room for improvement, however, in reporting and communicating the program’s achievements to Canadians. Infrastructure Canada will collaborate with signatories to better promote projects to Canadians, focusing on larger centres.
Infrastructure Canada is also continually improving the fund’s data management approach by streamlining and integrating it between signatories, as well as strengthening data integrity. Collecting the relevant data is an ongoing challenge, and the department will work towards reviewing and simplifying the data requirements for capital spending commitments.
2.3 Strategic Outcome 2
Funding for quality, cost-effective public infrastructure that meets the needs of Canadians in a competitive economy, a clean environment and liveable communities is provided.
2.3.1 Building Canada Fund-Communities Component
Table 10: Building Canada Fund-Communities Component
| Program Activity Summary: This funding addresses the unique infrastructure pressures facing smaller communities with populations of less than 100,000. Working in partnership through federal delivery partners and recipients, the fund supports the construction, renewal and enhancement of basic infrastructure needs such as potable water, wastewater treatment, local roads and other infrastructure needs of small communities. The fund leverages additional contributions from other partners by generally providing 1/3 of the costs to be matched by the province and municipality. | |||||
|---|---|---|---|---|---|
| 2009-2010 Financial Resources (in $ thousands) |
2009-2010 Human Resources (FTEs) | ||||
| Planned Spending | Total Authorities | Actual Spending | Planned14 | Actual | Difference |
| 117,500 | 207,935 | 101,065 | See Footnote 14 | 13 | Not Applicable |
| Results | Performance Indicators | Targets | Performance Status | Performance Summary |
|---|---|---|---|---|
|
In 2009-2010 Infrastructure Canada:
|
Number of agreements signed. | Sign targeted contribution agreements. | All ten targeted contribution agreements were signed prior to 2009-2010. |
Since its inception in 2007, more than $1 billion has been committed by the federal government in support of 859 projects, leveraging an additional $2.1 billion in infrastructure investment. As Infrastructure Canada was able to commit all existing funding, communities were able to access and commit the additional $500 million in Top-Up funding under the Economic Action Plan. |
| Number of projects approved. | Approve projects under the announced funding program. | 859 projects have been approved since inception of the program. | ||
|
Amount of federal funding committed. |
Commit remaining federal funding of $524.4 million in funding envelope. | $524.4 million of federal funds were committed, bringing the total federal commitment to over $1 billion. | ||
| Amount of dollars leveraged. | Amount of dollars leveraged from other partners at least equal to federal funding. | Over $1 billion in additional funding from partners leveraged in 2009-2010. | ||
| Number of projects completed/underway. | Initiate and complete projects within established timeframes. | 90 projects were completed with an additional 500 projects underway. |
Economic Action Plan (EAP): As part of the EAP, Budget 2009 increased the Building Canada Fund-Communities Component with a $500 million Top-Up over two years for projects that can be substantially completed by March 31, 2011. In order to access the Top-Up funding, the entire allocation of the Building Canada Fund-Communities Component had to be committed. Significant efforts were made under the EAP to accelerate the approval process of projects under this program activity, which encompasses projects related to safe drinking water, disaster mitigation, brownfield re-development, and local roads and bridges.
Since the EAP was launched, the entire Communities Component allocation of more than $1 billion has been approved in support of over 859 projects in communities across Canada. As they are funded under Building Canada, these projects are not required to be completed by March 31, 2011.
Benefits for Canadians: The fund addresses the local needs of Canada’s smaller communities. Infrastructure Canada’s contributions under the fund enable construction or rehabilitation of infrastructure that may otherwise be beyond the community’s normal budgetary capacity. This helps lead to strong economic and productivity growth, improved water, air and land quality, and strong, competitive and sustainable communities.
Performance Analysis: During 2009-2010 Infrastructure Canada collaborated with Federal Delivery Partners and provinces to complete project selection for the fund. In 2009-2010, $524.4 million of federal funding was committed, leveraging over $1 billion in additional investment. In addition, 90 projects were completed, with an additional 500 projects underway. The largest categories of investments were wastewater infrastructure (122 projects), and water infrastructure (146 projects).
As of March 31, 2010, the entire allocation of federal funding of $1 billion was committed in support of 859 smaller-scale projects in communities with populations of fewer than 100,000. This allowed communities to access the Building Canada Fund-Communities Component Top-Up funding as indicated in the Economic Action Plan.
Lessons Learned: An evaluation of the Building Canada Fund-Communities Component has not been conducted, as the program is relatively early in its life-cycle. However, an evaluation is planned for on or before 2013. This fund builds on lessons learned from earlier Infrastructure Canada programs, such as the Infrastructure Canada Program (ICP) and the Municipal Rural Infrastructure Fund (MRIF). For example, the formative evaluation of the ICP recommended that the department review opportunities to improve data quality, while working with Federal Delivery Partners and partner provinces and territories to improve program delivery, and to work internally to strengthen and streamline performance indicators. These recommendations were used to develop the Communities Component.
2.3.2 Building Canada Fund-Major Infrastructure Component
Table 11: Building Canada Fund-Major Infrastructure Component
| Program Activity Summary: This fund targets larger, strategic infrastructure projects of national and regional significance. It increases overall investment in public infrastructure and contributes to broad federal objectives of economic growth, a cleaner environment and strong and prosperous communities. At least two-thirds of the funding is targeted to national priorities of water, wastewater, public transit, the core national highway system and green energy. The Major Infrastructure Component has 11 additional eligible categories of investment, and priority projects are identified through discussions with provinces. By providing up to 50% federal funding on a cost-shared basis, it leverages additional contributions from other partners to increase overall investment in strategic infrastructure. Eligible recipients include provinces, local or regional governments, public sector bodies, non-profit organizations and private companies. Projects must be supported by a business case which is reviewed against key program criteria. As part of the Economic Action Plan, the government has made a commitment to accelerate funding. As part of this commitment, the department has streamlined the federal evaluation and approval of projects under this fund, simplifying and developing a more efficient review process to help projects get started sooner. | |||||
|---|---|---|---|---|---|
| 2009-2010 Financial Resources (in $ thousands) |
2009-2010 Human Resources (FTEs) | ||||
| Planned Spending | Total Authorities | Actual Spending | Planned15 | Actual | Difference |
| 665,090 | 594,969 | 196,876 | See Footnote 15 | 21 | Not Applicable |
| Results | Performance Indicators | Targets | Performance Status | Performance Summary |
|---|---|---|---|---|
|
In 2009-2010, Infrastructure Canada worked with provinces and other stakeholders to quickly identify, review and approve projects. Funding is almost completely committed in six provinces. The department simplified and streamlined the federal review and approval of projects. In 2009-2010 alone, under this new process, more than $2.3 billion in federal funding was committed for 84 major projects. This leveraged additional funding commitments of almost $6 billion. Since the launch of the Major Infrastructure Component under Budget 2007, $5.7 billion has been committed to major projects across Canada. Thanks to streamlined approval and review of projects, proponents were able to begin construction sooner. In 2009-2010 approximately 34 major projects began construction, bringing the total number of projects underway since the fund started to 48. In 2009-2010, six major projects worth $35.7 million ($13.85 million of federal investment) completed construction. |
Number of projects approved. | Approve projects under the announced funding program. | In 2009-2010, $2.3 billion in federal funding was approved for 84 projects. | During the 2009-2010 reporting period, the program was successfully streamlined and accelerated. |
| Amount of dollars leveraged. | Amount of dollars leveraged from other partners at least equal to federal funding. | In total almost $6 billion in additional funding from partners was leveraged. | ||
| Number of projects completed/underway. | Initiate and complete projects within established timeframes. | In 2009-2010, work started on 34 major projects. In addition, six major projects were completed. |
Economic Action Plan (EAP): Under the Economic Action Plan, the government committed to accelerate funding under the Building Canada Plan. As part of this commitment, the department simplified and streamlined the process for evaluating and approving projects, in order to help projects get started sooner. Under this new process, more than $2.3 billion of new federal funding was approved for 84 priority projects in 2009-2010.
Benefits for Canadians: The fund provides Canadians with modern, strategic and large scale infrastructure projects that reflect the government’s priorities of strong economic and productivity growth, a healthy and sustainable environment and stronger Canadian communities. At least two-thirds of the funding is intended to address the national priorities of drinking water, wastewater, public transit, core highway systems and green energy, so that Canadians can benefit from new, modern infrastructure in the most crucial areas. To date, Infrastructure Canada has committed approximately 84% of the Building Canada Fund-Major Infrastructure Component funding towards projects in these categories.
More information on federal commitments since the fund’s inception, by category, is presented in the table below.
| Category | Number of Projects | Total Cost of Project (in $ thousands) |
Federal Share (in $ thousands) |
|---|---|---|---|
| National Priorities | |||
| Drinking Water Infrastructure | 7 | 545,668 | 169,455 |
| Green Energy Infrastructure | 1 | 14,789 | 4,500 |
| National Highway System Infrastructure | 46 | 7,931,391 | 2,438,469 |
| Public Transit Infrastructure | 20 | 7,080,062 | 1,932,519 |
| Wastewater Infrastructure | 9 | 638,751 | 217,008 |
| Total for National Priorities | 83 | 16,210,661 | 4,761,950 |
| Local Priorities | |||
| Brownfield Redevelopment Infrastructure | 1 | 120,000 | 30,000 |
| Connectivity and Broadband Infrastructure | 1 | 221,458 | 55,000 |
| Culture Infrastructure | 14 | 895,930 | 261,820 |
| Disaster Mitigation Infrastructure | 1 | 665,000 | 141,500 |
| Local Roads Infrastructure | 8 | 361,040 | 142,458 |
| Recreation Infrastructure | 8 | 215,322 | 59,414 |
| Sport Infrastructure | 5 | 396,694 | 109,550 |
| Tourism Infrastructure | 4 | 384,131 | 120,000 |
| Total for Local Priorities | 42 | 3,259,575 | 919,742 |
| Total | 125 | 19,470,236 | 5,681,692 |
Performance Analysis: Since the fund’s launch in Budget 2007, $5.7 billion, representing approximately 84% of the funds available, has been committed to 125 major projects across the country (as of March 31, 2010). Program funding is almost completely committed in six of the ten provinces.
In order to accelerate funding, the department has streamlined the federal review and approval of projects, simplifying criteria and reducing the amount of information required in the project assessment process. Part of this effort included reducing the number of separate federal environmental assessments for infrastructure projects funded under the Building Canada Plan by making changes to the Navigable Waters Protection Act, which were passed with the Budget Implementation Act in March 2009. A series of regulations under the Canadian Environmental Assessment Act were also introduced and came into force in March 2009. These measures have considerably reduced the time needed to provide federal approvals for projects under this fund. Under this new process, 84 major projects were approved in 2009-2010 alone.
In 2009-2010, streamlining of processes allowed for funding to flow and for proponents to begin construction sooner. In 2009-2010 roughly 34 major projects began construction. In this same period, six major projects worth $35.7 million ($13.85 million federal contribution) completed construction.
Lessons Learned: Initiatives to accelerate funding have been successful. The identification of priority projects was fast-tracked through close cooperation with provinces and other stakeholders. By simplifying and streamlining the federal review process, projects for funding consideration were quickly assessed by federal officials, while ensuring necessary due diligence. Initiatives to streamline and simplify the federal review process should continue to be applied, and should be considered in designing future programming.
2.3.3 Green Infrastructure Fund
Table 12: Green Infrastructure Fund
| Program Activity Summary: This five-year, $1 billion fund supports infrastructure projects that promote cleaner air, reduced greenhouse gas emissions and cleaner water. Targeted investments in green infrastructure can contribute to improving the quality of the environment and lead to a more sustainable economy over the longer term. There are five eligible categories of investment: Wastewater infrastructure, green energy generation infrastructure, green energy transmission infrastructure, solid waste infrastructure, and carbon transmission and storage infrastructure. By providing up to 50% federal funding on a cost-shared basis, the fund leverages additional investments from other partners. Eligible recipients include provinces, territories, local or regional governments, public sector bodies, other eligible non-profit organizations and private sector companies, either alone or in partnership with a province, territory or a government body. Projects can be identified through a variety of channels, but provinces and territories are the main proponents, as their funding and support for projects is key to leveraging funds and ensuring that projects are of national or regional significance. The fund is allocated based on assessment criteria such as eligibility, leveraging financial investments and project benefits. The Green Infrastructure Fund was designed to incorporate the streamlined approach to federal evaluation and approval of projects originally adopted for Building Canada Plan programs. | |||||
|---|---|---|---|---|---|
| 2009-2010 Financial Resources (in $ thousands) |
2009-2010 Human Resources (FTEs) | ||||
| Planned Spending | Total Authorities | Actual Spending | Planned16 | Actual | Difference |
| 200,000 | 5,160 | 5,760 | See Footnote 16 | 6 | Not Applicable |
| Results | Performance Indicators | Targets | Performance Status | Performance Summary |
|---|---|---|---|---|
|
The program was launched very quickly – 17 weeks following its announcement in Budget 2009. Infrastructure Canada announced $627 million in funding to 18 projects with significant environmental and public benefits. Seven projects, worth $301 million in federal investment, are now underway. |
Amount of federal funding announced. | Infrastructure investment in public infrastructure with significant environmental benefits. | 18 projects announced, with a federal commitment of $627 million. | The program was quickly and successfully launched, and projects are underway. |
| Number of projects approved. | Approve projects under the announced funding program. | An additional $1.5 billion was leveraged from all funding partners. | ||
| Amount of funding leveraged. | Amount of dollars leveraged from other partners at least equal to federal funding. | Seven projects are now underway. | ||
| Amount of projects completed/underway. | Initiate and complete projects within established timeframes. |
Economic Action Plan (EAP): This funding contributes to green public infrastructure projects, and complements the economic and environmental efforts of other federal government measures, so that Canada emerges from the current economic downturn more quickly and with greener infrastructure.
Benefits for Canadians: The goal of this fund is to improve the environment and to promote long-term growth. By focusing on funding projects with positive, long-term environmental impacts, all provinces and territories will benefit.
In 2009-2010, projects were committed in a number of different categories under the Green Infrastructure Fund.
| Project Category | Number of Projects | Total Cost of Project (in $ thousands) |
Federal Share (in $ thousands) |
|---|---|---|---|
| Green Energy Generation Infrastructure | 1 | 29,770 | 9,787 |
| Green Energy Transmission Infrastructure | 2 | 564,000 | 201,000 |
| Solid Waste | 6 | 627,591 | 170,882 |
| Wastewater Infrastructure | 9 | 915,210 | 245,310 |
| Total | 18 | 2,136,571 | 626,979 |
Performance Analysis: Under the Economic Action Plan, the government announced $1 billion in funding for a new, five-year Green Infrastructure Fund. The program was officially launched on May 29, 2009 with the announcement of funding for the Mayo (YT) Hydro facility along with Phase 2 of the Carmacks, YT-Stewart, BC transmission line, approximately 17 weeks after the announcement of the program.
Since the launch of the program, $627 million has been committed to 18 projects. These include:
- Almost $171 million for bio-methanization projects in the Province of Quebec, which will divert organic solid waste from municipal landfills and generate energy from bio-gas;
- More than $211 million for transmission line infrastructure in British Columbia and the Yukon, and a district energy system project in Saint John, New Brunswick. These projects will increase use of green energy and reduce greenhouse gas emissions; and
- A total of $245 million in funding for wastewater infrastructure in Ontario and Manitoba. Funding for these projects will improve water quality and help municipalities meet the requirements of the new federal Wastewater Systems Effluent Regulations. Investments in wastewater through the Green Infrastructure Fund also contribute to meeting the objectives under the Canada-US Great Lakes Water Quality Agreement.
In 2009-2010, seven projects valued at $980 million got underway under the Green Infrastructure Fund, with $301 million in federal funding.
Lessons Learned: The Green Infrastructure Fund was launched under the EAP to deliver timely funding for infrastructure projects that provide environmental benefits. Overall, the program has been able to meet this objective.
Unlike other Infrastructure Canada programs, the Green Infrastructure Fund does not have a set provincial or territorial allocation, allowing resources to be focused where they are most likely to generate the greatest impact. Infrastructure Canada will continue to work in close partnerships with provinces and territories to identify priorities for the remaining funds.
2.3.4 Canada Strategic Infrastructure Fund
Table 13: Canada Strategic Infrastructure Fund
| Program Activity Summary: This fund supports projects that sustain economic growth and enhance the quality of life of Canadians. Investments are made in cooperation with the provinces, territories, municipalities and the private sector, and contribute to the construction, renewal and/or enhancement of public infrastructure. The Canada Strategic Infrastructure Fund leverages additional contributions from other partners by providing up to 50% funding for eligible projects. This program activity began in 2003, and is scheduled to end in 2012-2013. | |||||
|---|---|---|---|---|---|
| 2009-2010 Financial Resources (in $ thousands) |
2009-2010 Human Resources (FTEs) | ||||
| Planned Spending | Total Authorities | Actual Spending | Planned17 | Actual | Difference |
| 513,410 | 648,876 | 420,202 | See Footnote 17 | 19 | Not Applicable |
| Results | Performance Indicators | Targets | Performance Status | Performance Summary |
|---|---|---|---|---|
|
In 2009-2010 Infrastructure Canada:
|
Number of agreements signed. | Sign targeted contribution agreements. | In 2009-2010: Three new agreements signed. |
Since inception of this program, Infrastructure Canada contributed to the implementation of roughly 75 projects with a total project value of $14 billion. Infrastructure Canada committed the remaining $3 billion under this program in 2009-2010. With the help of its Federal Delivery Partners the department continued to monitor the progress of 41 ongoing/newly started projects and completed seven projects. |
| Amount of federal funding committed. | Commit the remaining $3 billion of federal funding. | $3 billion committed. | ||
| Amount of dollars leveraged. | Amount of dollars leveraged from other partners at least equal to federal funding. | $6 billion in additional funding leveraged. | ||
| Number of projects completed/underway. | Initiate and complete projects within established timeframes. | Seven projects completed, and an additional 41 projects underway. |
Economic Action Plan (EAP): While the Canada Strategic Infrastructure Fund is not part of the Economic Action Plan, planned expenditures will also support the construction of public infrastructure and economic growth.
Benefits for Canadians: Projects under this program support the safe and efficient movement of goods and people; and contribute to safe, cleaner and reliable drinking water, and the responsible and sustainable treatment of wastewater.
Performance Analysis: In 2009-2010, Infrastructure Canada funded projects in cooperation with provinces, territories, municipalities and the private sector, to contribute to the construction, renewal and/or enhancement of public infrastructure. By 2009-2010, the $4.3 billion program was fully committed and a significant portion of the funds were spent. In addition, seven projects were completed.
Lessons Learned: This program is effective in providing funding for projects of major national and regional significance in areas that are vital to sustaining economic growth and enhancing quality of life of Canadians.The Canada Strategic Infrastructure Fund was the first federal government program in modern history to deal with large-scale infrastructure requests from provinces, territories and municipalities. It played an important role in paving the way for other large-scale strategic programs such as the Building Canada Fund-Major Infrastructure Component and the Green Infrastructure Fund. These programs have benefited from the lessons learned.
2.3.5 Municipal Rural Infrastructure Fund
Table 14: Municipal Rural Infrastructure Fund
| Program Activity Summary: This fund supports small-scale municipal infrastructure projects designed to promote and improve quality of life in both urban and rural communities. The program initially provided $1.1 billion in federal funding and was augmented with an additional $200 million in January 2007. At least 80% of funding under the fund has been dedicated to municipalities with a population of less than 250,000. For most projects, the MRIF provides up to one-third federal funding for eligible projects. Its long-term commitment to public infrastructure helps promote sustainable economic growth, innovation and healthy communities. Projects contribute to the construction, renewal and/or enhancement of public infrastructure to build capacity in partnership with recipients. The fund was announced in 2003, and has been extended until 2013-2014. It is delivered through a partnership with federal regional development agencies (ACOA, CED-Q, FedDev Ontario, WED and INAC in the northern territories and for First Nations). | |||||
|---|---|---|---|---|---|
| 2009-2010 Financial Resources (in $ thousands) |
2009-2010 Human Resources (FTEs) | ||||
| Planned Spending | Total Authorities | Actual Spending | Planned18 | Actual | Difference |
| 481,763 | 483,763 | 221,766 | See Footnote 18 | 6 | Not Applicable |
| Results | Performance Indicators | Targets | Performance Status | Performance Summary |
|---|---|---|---|---|
|
In 2009-2010 Infrastructure Canada allocated the majority of the Municipal Rural Infrastructure Fund, including the $200 million top-up in most jurisdictions, through its federal delivery partners. |
Number of agreements signed. | Sign targeted contribution agreements. | Since the program’s inception, agreements were signed with all provinces and territories. Agreements for the $200 million top-up were signed with 12 jurisdictions. |
In 2009-2010, federal funding spent on projects under the fund totaled $475 million. The program has been extended until March 31, 2014. Despite delays as of 2009-2010, virtually all of the funding has been allocated. |
| Number of projects approved. | Approve projects under the funding program. | 2,004 projects approved. | ||
| Amount of federal funding committed. | Commit all federal funding under the program’s funding envelope. | All MRIF funding committed, including the $200 million top-up. | ||
| Amount of funding leveraged. | Amount of dollars leveraged from other partners at least equal to federal funding. | An additional $2.6 billion leveraged. | ||
| Number of projects completed/underway. | Initiate and complete projects within established timeframes. | 483 projects completed. |
Economic Action Plan (EAP): The fund pre-dates the EAP, but expenditures have complemented it by providing continued federal funding for infrastructure projects.
Benefits for Canadians: The MRIF has been structured to provide a balanced response to the local infrastructure needs of Canadian communities, particularly those with fewer than 250,000 people. The program provides Canadians in smaller communities with improved drinking water, wastewater, solid waste management, public transit, local roads, culture, recreation, tourism and green energy.
Performance Analysis: Under the fund, Canada is contributing to the implementation of over 2,000 projects with a total project value of approximately $3.6 billion. While project selection is fully completed, construction continues on many of these projects across Canada.
In 2009-2010, $475 million of federal funding was spent on projects under the fund. An additional 80 projects were announced, representing over $20 million in federal contributions. Construction on some MRIF projects across the country has been delayed for a number of reasons, including delays in project approvals, changes to federal or provincial standards related to drinking water and wastewater effluent, and unforeseen project complexities. Consequently, $393 million remains to be expended under the program, which has been extended until March 31, 2014.
Lessons Learned: This program has proven effective in providing and leveraging funding for small-scale municipal infrastructure projects that promote and improve quality of life in both urban and rural communities. It is the successor to the Infrastructure Canada Program and was built on lessons learned from that program. In turn, lessons learned from the MRIF program delivery model, have been incorporated into the design of the Building Canada Fund-Communities Component, which continues to fund infrastructure priorities in small communities on a cost-shared basis.
2.3.6 Border Infrastructure Fund
Table 15: Border Infrastructure Fund
| Program Activity Summary: This fund provides $600 million of funding for investments in physical infrastructure, transportation system infrastructure and improved analytical capacity at the largest surface border crossings between Canada and the United States, as well as several other crossing points in Canada. Established in 2002, the fund provides up to 50% federal funding to support eligible projects at Canada’s border crossings. This program activity began in 2003, and is scheduled to end in 2013-2014. Transport Canada is the federal partner for this program. | |||||
|---|---|---|---|---|---|
| 2009-2010 Financial Resources (in $ thousands) |
2009-2010 Human Resources (FTEs) | ||||
| Planned Spending | Total Authorities | Actual Spending | Planned19 | Actual | Difference |
| 66,715 | 99,987 | 80,863 | See Footnote 19 | 1 | Not Applicable |
| Results | Performance Indicators | Targets | Performance Status | Performance Summary |
|---|---|---|---|---|
|
In 2009-2010 Infrastructure Canada:
|
Number of agreements signed. | Sign targeted contribution agreements. | Since inception: Nine agreements signed. | All federal funding of $600 million has been committed. |
| Number of projects approved. | Approve projects under the funding program. | 59 projects approved. | ||
| Amount of federal funding committed. | Commit all federal funding under the program’s funding envelope. | $600 million of federal funding committed. | ||
| Amount of dollars leveraged. | Amount of dollars leveraged from other partners at least equal to federal funding. | An additional $1.1 billion leveraged from other partners. | ||
| Number of projects completed/underway. | Initiate and complete projects within established timeframes. | In 2009-2010, 13 projects were completed, with an additional 11 projects getting underway. |
Economic Action Plan (EAP): While the spending under the fund is not part of the EAP, program results have focused on improvements to Canada’s transportation system.
Benefits for Canadians: Through the fund, infrastructure improvements have helped to increase border infrastructure security, and improved the flow of trade between Canada and the United States. The ultimate outcomes are sustainable economic growth and safe and efficient borders, which help alleviate border congestion and increase trade, systems capacity and safety and security.
Performance Analysis: Transport Canada is responsible for the delivery of the Border Infrastructure Fund. This program is scheduled to end on March 31, 2014. Transport Canada implemented and administered 59 projects worth approximately $1.7 billion in total project costs and almost $600 million in total federal contributions. These projects were governed with due diligence, ensuring effective management of costs and budgets, timely collection of project information, and the proper execution of evaluations. Thirteen projects under the fund were successfully completed in British Columbia, Ontario, New Brunswick and Saskatchewan.
Lessons Learned: Given that most projects have cross-border impacts and have Canadian and American stakeholders, communications is an ongoing challenge. In addition, the international nature of many of these projects adds significant technical and regulatory complexities. Effective horizontal cooperation across multiple federal departments is also critical, and effective communications and strong coordination have been keys to the success of the program in 2009-2010. An audit was conducted in 2007 and an Assurance Follow-up Audit of the Contribution Management Control Framework was conducted in March 2010.
2.3.7 Economic Analysis and Research
Table 16: Economic Analysis and Research
| Program Activity Summary: This program activity helps to ensure that Canada’s infrastructure investment priorities and activities include the building, connecting and sharing of applied knowledge and research on infrastructure issues, projects and programs. It targets key gaps in infrastructure knowledge and information, promotes the development of an enhanced evidence-based approach for sound decision making at all orders of government, and contributes to improved measurement of the impacts of infrastructure policy and investment decisions. This program activity supports strategic research capacity and knowledge generation and applications at the national level, as well as cooperation with other orders of government in addressing their unique research and capacity-building needs. It leverages research resources and expertise across various orders of government and stakeholder groups to address the infrastructure challenges and proposed solutions for Canada’s economy, environment and communities. | |||||
|---|---|---|---|---|---|
| 2009-2010 Financial Resources (in $ thousands) |
2009-2010 Human Resources (FTEs) | ||||
| Planned Spending | Total Authorities | Actual Spending | Planned | Actual | Difference |
| 19,565 | 10,609 | 4,142 | 36.5 | 17 | 19.5 |
| Results | Performance Indicators | Targets | Performance Status | Performance Summary |
|---|---|---|---|---|
|
In 2009-2010, Infrastructure Canada:
|
Funding provided in support of research and research projects. | Support research and research projects. | Over its five-year duration, the Research, Knowledge and Outreach program provided $12.5 million towards 77 externally-generated research projects. | Throughout 2009-2010, the department continued its support for multi-disciplinary and economic research by addressing emerging infrastructure questions. Key areas of research included financing mechanisms, water and wastewater, transportation and asset management. |
| The federal contributions also leveraged an additional 80% from other funders |
Economic Action Plan (EAP): The funds spent under the Knowledge and Research program activity are not part of EAP, but they complement these efforts by providing federal funding for infrastructure research projects and economic analysis.
Benefits for Canadians: By improving research, knowledge and capacity-building, this program promotes innovation and progress in the delivery, management and maintenance of world-class public infrastructure. By providing a strong knowledge-base, it also supports effective decision-making and policy development, and improves understanding of long-term infrastructure issues.
Performance Analysis: In 2009-2010, Infrastructure Canada continued to deliver high quality and timely policy support and advice to develop strategic policies based on sound knowledge and strong partnerships. The department’s research efforts shifted to more targeted research, increased economic analysis, better transfer of knowledge and strengthened partnerships. This assisted in the development of EAP programs.
Lessons Learned: Infrastructure Canada’s Research, Knowledge and Outreach program has contributed to an increase in awareness and understanding of infrastructure issues and practices, The department is working to better integrate its research function into policy development to help ensure sound policy, program and strategic investment decisions by Infrastructure Canada and its partners.
2.4 Strategic Outcome 3
Construction-ready infrastructure projects are provided with federal funding support.
2.4.1 Infrastructure Stimulus Fund
Table 17: Infrastructure Stimulus Fund
| Program Activity Summary: This fund provides significant, timely and targeted funding to support provincial, territorial and municipal infrastructure projects, as well as infrastructure projects submitted by not-for-profit and for-profit entities. It focuses on the rehabilitation of existing assets and building new infrastructure that is construction-ready and can be substantially completed by March 31, 2011. Categories include: Water, wastewater, public transit, solid waste management, highways, roads, culture, community centres and services, temporary shelter infrastructure, parks and trails, rail and port infrastructure. By providing up to 50% federal funding to construction-ready projects, it leverages funding from other partners, and is able to generate a much greater overall impact on the Canadian economy through infrastructure spending. | |||||
|---|---|---|---|---|---|
| 2009-2010 Financial Resources (in $ thousands) |
2009-2010 Human Resources (FTEs) | ||||
| Planned Spending | Total Authorities | Actual Spending | Planned20 | Actual | Difference |
| 2,000,000 | 496,729 | 493,129 | See Footnote 20 | 24 | Not Applicable |
| Results | Performance Indicators | Targets | Performance Status | Performance Summary |
|---|---|---|---|---|
|
In 2009-2010 Infrastructure Canada:
|
Number of agreements signed. | Sign agreements with all provinces and territories. | Signed more than 35 agreements with all provinces and territories, port authorities, some municipalities, cultural and not-for-profit organizations. |
The department delivered the Infrastructure Stimulus Fund in record time through collaboration and innovation. In just over nine months, the government approved close to 4,000 projects with total federal funding of $4 billion. Over 1,600 projects were underway as of March 31, 2010, providing $5.3 billion in stimulus to the economy. |
| Number of projects approved. | Approve as many shovel-ready projects as possible while using federal funds to leverage additional funds from provinces, territories, municipalities, and other partners. | Approved close to 4,000 federal, provincial, territorial, municipal and other assets by January 29, 2010. | ||
| Amount of federal funding committed. | Commit $4 billion under the program’s funding envelope. | Committed all federal funds by January 29, 2010. | ||
| Amount of dollars leveraged. | Maximize leverage. | Leveraged an additional $6 billion from partners, providing over $10 billion in stimulus to the economy. | ||
| Number of projects completed/underway. | Initiate and complete projects within established timeframes. | By March 31, 2010, Infrastructure Canada's funding partners reported that close to 1,600 infrastructure projects were underway, and approximately 250 projects were reported as completed. |
Economic Action Plan (EAP): The EAP established the $4 billion Infrastructure Stimulus Fund to provide a short-term boost to the economy by accelerating funding to construction-ready infrastructure projects that can be substantially completed by March 31, 2011.
Benefits for Canadians: This program provides short-term economic stimulus, contributing to the long-term prosperity of communities by fast-tracking infrastructure funding. In addition, all provinces and territories, particularly smaller jurisdictions, have enjoyed social, cultural and environmental benefits from modern public infrastructure investments.
Performance Analysis: With a small but dedicated team working in close partnership with provinces, territories, municipalities and other partners, Infrastructure Canada delivered an unprecedented federal investment in public infrastructure in record time. In just over nine months, the government approved close to 4,000 projects under the Infrastructure Stimulus Fund across Canada, with total federal funding of $4 billion. An additional $6 billion in infrastructure investment was leveraged from provinces, territories, municipalities and other partners, and in total, approximately $10 billion in combined funding was committed towards funding infrastructure projects across the country.
By March 31, 2010, based on progress reports submitted, Infrastructure Canada's funding partners reported that close to 1,600 infrastructure projects were underway, and approximately 250 projects were reported as completed. The department received and paid out close to $492 million in claims received from funding recipients for the first year of this program. However, hundreds of projects were underway for which no claim was submitted, as many recipients will submit claims after project completion.
Lessons Learned: Infrastructure Canada was able to deliver the Infrastructure Stimulus Fund in record time through a collaborative and innovative approach built on:
- Streamlining administrative and approvals processes and procedures;
- A national partnership involving hundreds of provincial, territorial and municipal governments;
- A sound management control framework that integrates risk management into program design, project approval and monitoring to focus on areas of greatest risk; and
- Innovative technology and systems that allow Infrastructure Canada to approve, manage and report effectively on thousands of projects by hundreds of organizations across Canada.
The approach has received significant praise from Infrastructure Canada’s partners who believe that the department has made significant improvements in the management and delivery of federal infrastructure funds. The innovative use of technology, risk management practices, national partnerships and collaboration across teams can all provide useful tools for other government agencies managing funding and contribution programs.
Infrastructure Canada will undertake an evaluation including a lessons learned review in fiscal year 2010-2011. This evaluation will be part of the cluster evaluation comprising three of the Infrastructure Canada’s EAP initiatives including the ISF, the BCF-CC Top-Up component and the funding for the National Trails Coalition. The results, combined with independent reviews by Infrastructure Canada’s internal auditors and the Office of the Auditor General, will be used to identify best practices for future federal infrastructure programs.
While formal reviews of the program have not yet been completed, it is worth noting that the program was unprecedented in size, speed and scope, and meant significant short-term pressures for the department. In order to deliver, staff members were reassigned to priority areas within the department, we quickly increased the overall number of resources, and employees worked extended hours.
As this was the first time a program of this nature has been designed and delivered, the department expects that there will be both successful innovations as well as some areas for improvement to learn from and apply to future programs.
2.4.2 Building Canada Fund-Communities Component Top-Up
Table 18: Building Canada Fund-Communities Component Top-Up
| Program Activity Summary: This program activity provides additional federal funding in the amount of $500 million (added to the original Building Canada Fund-Communities Component) to fund additional infrastructure projects in 2009-2010 and 2010-2011 in communities with populations of less than 100,000, with infrastructure needs related to 18 approved categories of project investment. The additional Top-Up funds are part of the EAP and are providing targeted economic stimulus. The funds are being allocated to projects that were ready to get started at the time the Top-Up was announced, and that can be substantially completed by March 31, 2011. All Building Canada Fund-Communities Component funding had to be committed before access to Top-Up funding could occur. | |||||
|---|---|---|---|---|---|
| 2009-2010 Financial Resources (in $ thousands) |
2009-2010 Human Resources (FTEs) | ||||
| Planned Spending | Total Authorities | Actual Spending | Planned21 | Actual | Difference |
| 250,000 | 30,045 | 30,745 | See Footnote 21 | 7 | Not Applicable |
| Results | Performance Indicators | Targets | Performance Status | Performance Summary |
|---|---|---|---|---|
|
In 2009-2010 Infrastructure Canada:
|
Number of agreements signed. | Sign agreements with all provinces to access the Communities Component Top-Up funding as part of the Economic Action Plan. | Ten agreements signed. |
In addition to the original Building Canada Fund-Communities Component, the Top-Up funds have resulted in the approval of 529 projects with a total project value of $1.5 billion. All remaining funds of the Communities Component Top-Up were committed in 2009-2010. The monitoring of Building Canada Fund-Communities Component Top-Up projects is ongoing to ensure that projects are substantially completed by the end of the program (March 31, 2011). |
| Number of projects approved. | Approve as many projects as possible from provinces that have access to Top-Up funding beyond the funding from the Building Canada Fund-Communities Component. | Under the Top-Up funding: 529 projects were approved with a total project value of $1.5 billion. |
||
| Amount of federal funding committed. | Commit all Top-Up funding ($500 million) under the program’s funding envelope, as part of the Economic Action Plan. | $486 million federal funding committed. | ||
| Amount of dollars leveraged. | Amount of dollars leveraged at least equal to federal funding. | More than $1 billion in additional funds were leveraged. | ||
| Number of projects completed/underway. | Initiate and complete projects within established timeframes. | 381 projects are underway, and 39 projects are completed. |
Economic Action Plan (EAP): The Top-Up provides additional funding in the amount of $500 million (added to the original $1 billion Building Canada Fund-Communities Component program activity) to fund additional infrastructure projects in communities with populations of less than 100,000, and with infrastructure needs related to 18 approved categories of project investment. The Top-Up funds are part of EAP. In order to provide timely and targeted stimulus to the economy, the Top-Up funds were allocated for construction-ready projects that can be substantially completed by March 31, 2011. All Building Canada Fund-Communities Component funding had to be committed before access to Top-Up funding could occur.
Benefits for Canadians: The Top-Up program provides the same benefits to smaller municipalities as the original Building Canada Fund-Communities Component program. This program injects funds into the economy and leverages new investments from partners, and this short-term stimulus helps the country to emerge from the recession more quickly. It also means more and better infrastructure that will contribute to the long-term prosperity of Canada’s communities.
Performance Analysis: In 2009-2010, Infrastructure Canada amended all contribution agreements previously signed with provinces under the Building Canada Fund-Communities Component in order to set the new allocations and reflect the new requirements of the Top-Up program.
Throughout 2009-2010, Infrastructure Canada also announced federal financial support for 529 projects under the Building Canada Fund-Communities Component Top-Up, fully allocating all remaining funds within the $500 million program envelope and leveraging an additional $1 billion from funding partners.
Lessons Learned: The Economic Action Plan component of this program will be evaluated during the 2010-2011 fiscal year as part of the EAP cluster evaluation (ISF, BCF-CC Top-Up and NTC). While no program performance results are available as the program is early in its life-cycle, no evaluation has yet been conducted. However, efficiencies identified under earlier initiatives, such as the Municipal Rural Infrastructure Fund and the original Building Canada Fund-Communities Component, are incorporated into the Top-Up delivery and management model. For example, the governance structure and the projects selection process are identical to that of the original Building Canada Fund-Communities Component.
While formal reviews of the program have not yet been completed, it is worth noting that the program, like the Infrastructure Stimulus Fund, meant significant short-term pressures for the department. In order to deliver, staff was reassigned to priority areas within the department, we quickly increased the overall number of resources, and employees worked extended hours.
The department expects that there will be both successful innovations as well as some areas for improvement to learn from and apply to future programs.
2.4.3 Support for the G8 Summit (2010)
Table 19: Support for the G8 Summit (2010)
| Program Activity Summary: This provides up to $50 million in funding for infrastructure projects that supported the hosting of the G8 Summit in June 2010 in Huntsville, Ontario, and provided a legacy to local communities and the region as a result of hosting the Summit. The maximum share of federal funding will be up to one hundred percent (100%) of total eligible costs. The funds will enhance local infrastructure and enable the region to showcase itself to visitors and media during the Summit. | |||||
|---|---|---|---|---|---|
| 2009-2010 Financial Resources (in $ thousands) |
2009-2010 Human Resources (FTEs) | ||||
| Planned Spending22 | Total Authorities | Actual Spending | Planned | Actual | Difference |
| See Footnote 22 | 50,000 | 40,669 | See Footnote 22 | 1 | Not Applicable |
| Results | Performance Indicators | Targets | Performance Status | Performance Summary |
|---|---|---|---|---|
|
In 2009-2010:
|
Number of agreements signed and projects approved. | Sign all contribution agreements and approve all projects. | 17 agreements signed for 32 approved projects. |
Projects were announced by the Minister of Industry Canada. Infrastructure Canada negotiated 17 contribution agreements for 32 projects with a total federal investment of over $45 million. All projects were completed before the June 2010 G8 Summit. |
| Amount of federal funding committed. | Commit all funds ($50 million) under the G8 Summit initiative. | $45.7 million in federal funds committed. | ||
| Number of projects completed in time for the Summit. | Complete all projects within the established timeframes for the Summit. | All projects were substantially completed in time for the Summit. |
Economic Action Plan (EAP): The funds spent under this initiative are not part of EAP, but they complemented these efforts, as they provided federal funding for infrastructure projects that were substantially completed by June 2010.
Benefits for Canadians: The G8 Summit initiative enhanced local infrastructure and enabled the region to showcase its positive attributes to the participants and media who attended the Summit. G8 funding was provided as a legacy to the region, not only in order to help the region to prepare for the event but also as form of compensation for the inconveniences faced by host residents during such high-profile events. G8 funding investments were used for an airport, media centre, and to rehabilitate roads and sidewalks, to improve signage and lighting, to update streetscape furniture, and for improvements to public parks and beautification projects.
Performance Analysis: Projects were announced by the Minister of Industry Canada. Infrastructure Canada negotiated 17 contribution agreements for 32 projects with a total federal investment of over $45 million. All projects were completed before the June 2010 G8 Summit.
Lessons Learned: No evaluation has been conducted for the program. The program was a once-only initiative specifically for the hosting of the 2010 G8 Summit.
2.4.4 National Trails Coalition
Table 20: National Trails Coalition
| Program Activity Summary: Through the National Recreational Trails program, funding is provided to the National Trails Coalition, who in turn provides funding to organizations to create, upgrade and sustain non-motorized, snowmobile and all-terrain-vehicle trails throughout the country. The government’s contribution is equally matched by the Coalition and its partners, creating a lasting legacy of trail infrastructure that will benefit Canadians for many years to come. Funds for this initiative were fully expended during fiscal year 2009-2010. This initiative is part of the Economic Action Plan, which is accelerating infrastructure funding, and generating economic activity in Canada. | |||||
|---|---|---|---|---|---|
| 2009-2010 Financial Resources (in $ thousands) |
2009-2010 Human Resources (FTEs) | ||||
| Planned Spending23 | Total Authorities | Actual Spending | Planned | Actual | Difference |
| See Footnote 23 | 25,000 | 25,100 | See Footnote 23 | 1 | Not Applicable |
| Results | Performance Indicators | Targets | Performance Status | Performance Summary |
|---|---|---|---|---|
|
In 2009-2010 Infrastructure Canada:
|
Number of projects approved. | Approve projects that support the objectives of the program. | 474 projects approved. |
The National Trails Coalition program activity has met its short-term objective of providing rapid funding to small and rural communities across Canada. It also created a lasting legacy of trail infrastructure for Canadians by increasing and improving trails across the country. Through this program, over 20,000 kilometres of trail have been built, upgraded or rehabilitated, much of that in small and rural communities. |
| Amount of federal funding committed. | Commit all funds ($25 million) under the program’s funding envelope. | Over $24 million committed. | ||
| Amount of dollars leveraged. |
Amount of dollars leveraged at least equal to federal funding. |
$33.4 million in additional funds leveraged. | ||
| Number of projects completed/underway. | Complete all projects within the established timeframes for the Initiative. | Completed all projects (474) by March 31, 2010. | ||
| Amount of funds committed to non-motorized, snowmobile and all-terrain vehicles (ATV) trails. | One-third of funds to each trail type. |
|
||
| Kilometres of trails built, upgraded or rehabilitated. |
Economic Action Plan (EAP): Through the EAP, the federal government committed $25 million to the National Trails Coalition in 2009-2010. This funding was used by the Coalition and its partners to build and renew multi-purpose trails for walking, running, cross-country skiing, biking, all-terrain vehicles and snowmobiles.
Benefits for Canadians: This contribution uses new investment in infrastructure to immediately inject funds into the economy and to build modern, world-class public infrastructure. This initiative brought immediate seasonal economic activity to small and rural communities. It also resulted in a lasting legacy of recreational trails that will benefit Canadians for many years to come. In total, over 20,000 kilometres of trails were built, upgraded or rehabilitated, including 766 bridges.
Performance Analysis: Infrastructure Canada worked with the National Trails Coalition throughout the year to monitor the program’s progress and ensure accurate reporting. As a one-year EAP initiative, this program was rolled out very quickly and met its objectives. Infrastructure Canada committed more than $24 million to the Coalition for 474 trail-building projects that were completed by the March 31, 2010 deadline. The program leveraged additional funds of over $33 million from other funding sources. Overall, the funding targeted small and rural communities, including official language minority communities, and provided economic stimulus to residents in these communities.
Lessons Learned: This program will be evaluated during the 2010-2011 fiscal year as part of the EAP cluster evaluation (ISF, BCF-CC Top-Up and NTC). The results of the evaluation will be used for developing future infrastructure programs.
2.5 Internal Services
Table 21: Internal Services
| Program Activity Summary: This program activity promotes excellence in program and corporate management in support of Infrastructure Canada’s priorities. Internal Services activities and resources support the needs of programs and other corporate obligations of an organization, including Management and Oversights, Risk Management, Communications, Legal, Internal Audit, Evaluation, Human Resources Management, Financial Management, Information Management, Information Technology, Travel Real Property, Materiel Management and Acquisitions. | |||||
|---|---|---|---|---|---|
| 2009-2010 Financial Resources (in $ thousands) |
2009-2010 Human Resources (FTEs) | ||||
| Planned Spending | Total Authorities | Actual Spending | Planned | Actual | Difference |
| 18,223 | 70,765 | 51,837 | 101.5 | 178 | 76.5 |
Results Achieved
Finance
- The department provided quality, timely and accurate financial services and advice for the establishment and delivery of billion-dollar programs under the EAP. This included the management and oversight of $4.2 billion in expenditures in 2009-2010, for which the department has been commended on its sound management performance in delivering on large priority initiatives within a very
short timeframe.
- Additional significant results and improvements were achieved in the area of financial management including:
- Providing secretariat support and advice to the Project Review Panel for the review of infrastructure projects;
- Improving financial processing systems and reporting capacity, and developing new integrated systems tools to manage and report on funding programs and projects;
- Ensuring quality, timely and accurate financial statements, expenditure forecasts and management reports;
- Strengthening internal financial management capacity through training, staffing vacant positions, engaging consultants , and implementing new internal controls; and
- Developing new financial policies and procedures for account verification and the treatment of capital assets, and renewing the department’s financial signing authority processes, documentation and instruments of delegation.
- Providing secretariat support and advice to the Project Review Panel for the review of infrastructure projects;
- The department also made improvements in overall administration by developing new administrative and contracting controls and procedures; providing training and documentation of business processes; and completing major design, planning and coordination work for the department’s relocation and consolidation to a new location in early 2010-2011.
Human Resources Management
- The department made several improvements in how it manages its people, including:
- Modernization/Enabling Infrastructure: A new three-year Integrated Business and Human Resources Plan set out a Vision for People Management, and specific strategies and measurable actions for the 2009-2010 fiscal year. Implementation of the plan is now being monitored via quarterly HR indicators.
- Recruitment: The number of employees at Infrastructure Canada grew from 237 to 324 (indeterminate, secondments and interchanges) employees during 2009-2010, successfully closing the gaps in all occupational groups.
- Retention: In 2009-2010 turnover rates decreased from 24% to 17%, and the department has put in place leading practices in how it engages and communicates with employees.
- Development: Infrastructure Canada implemented a Development Program for employees at the EC Category (EC-02 to EC-04). In addition, employees and managers are strongly supported in developing learning plans, which are reviewed and updated at least once a year. The department also named a Learning Champion at the Assistant Deputy Minister level, who is leading the
development of a learning culture.
- Diversity, Employment Equity and Official Languages: The department has named senior executives (Associate Deputy Minister and Assistant Deputy Minister) as Champions for Official Languages and for Employment Equity/Diversity. Diversity awareness research, such as the 2008 Public Service Employee Survey results, shows no evidence of barriers. Infrastructure Canada is developing its diversity strategy and will continue to ensure it has the capacity to deliver its programs and services to both employees and the public, and to maintain a healthy work environment.
- Modernization/Enabling Infrastructure: A new three-year Integrated Business and Human Resources Plan set out a Vision for People Management, and specific strategies and measurable actions for the 2009-2010 fiscal year. Implementation of the plan is now being monitored via quarterly HR indicators.
- The department also implemented several Values and Ethics initiatives. It organized a discussion on ethics with an expert in the field, conducted employee consultations on the Public Service Code of Conduct draft, held a focus group on Conflict of Interest and Post-Employment guidelines, and promoted participation in courses and workshops held by the Canada School of Public Service and
Fisheries and Oceans Canada.
- The department provided employees with access to an Integrity Office and Informal Conflict Management Services, through agreements with Transport Canada and Health Canada, respectively. The Human Resources Division also employs qualified personnel to assess/troubleshoot conflict concerns.
- The department responded quickly and comprehensively to address shortcomings identified by the Public Service Commission in its audit released in 2008-2009. The PSC has indicated it is satisfied with the department’s overall response.
Communications
- Communications activities increased to keep pace with accelerated investments in infrastructure through the EAP. The department:
- Informed Canadians about the federal infrastructure investments making a difference in their communities, and provided information about infrastructure programs to potential funding recipients.
- Worked with funding partners on more than 300 announcements, undertook a print and television advertising campaign on behalf of the infrastructure programs of 18 departments, responded to over 4,500 public enquiries by phone or email, and fielded more than 5,000 letters.
- Published unprecedented details on over 6,000 funded projects via the internet, provided a wealth of other information through the web site about both the programs and the results of funding, and worked with partners to show Canadians where projects are being funded, through the installation of signage.
- Provided municipalities, not-for-profit organizations and other project proponents with application details for infrastructure programs through media announcements, electronic newsletters, trade show participation, presentations, and joint communications with municipal associations to their members.
- Responded to an increased number of inquiries under the Access to Information Act and the Privacy Act.
- Informed Canadians about the federal infrastructure investments making a difference in their communities, and provided information about infrastructure programs to potential funding recipients.
Information Management and Information Technology
- The department used information technology (IT) and information management (IM) products and services strategically to support Infrastructure Canada’s priorities.
- It managed the existing Master Service Agreement for IT shared services with Public Works and Government Services Canada, and implemented additional shared services in support of departmental growth.
- Extensive work was done in the Shared Information Management System for Infrastructure Canada (SIMSI) for the quick implementation of the new infrastructure programs under the EAP. This enabled the department to proceed with a call for funding applications under the EAP’s Infrastructure Stimulus Fund less than two months after the Budget 2009 announcement. By summer 2009, SIMSI
assessment and approval modules were being used to quickly evaluate thousands of project applications. SIMSI was also enhanced to support other EAP initiatives, such as the Top-Up to the Building Canada Fund-Communities Component. Other significant enhancements to SIMSI included new requirements to capture key project data such as the start date of construction for projects.
- As part of EAP implementation, all projects in SIMSI (close to 5,000) were reviewed and mapped against those listed on the Actionplan.gc.ca site.
- Internal IT and IM M activities increased significantly to keep pace with a significant increase in the number of employees, including:
- Equipping new employees with computer equipment and access to the network and office automation software within five working days;
- Supporting Communications in posting EAP information to – and maintaining – the department’s websites;
- Supporting the compliance to various Government of Canada Information IT and IM policies, standards, frameworks and directives; and
- Regularly maintaining and upgrading the departmental and mission critical system infrastructures to avoid “rust out” of systems, and looking for areas to contain operations and maintenance costs.
- Equipping new employees with computer equipment and access to the network and office automation software within five working days;
Internal Audit
- The department continued the implementation of the 2009 Treasury Board Policy on Internal Audit by creating a joint Departmental Audit Committee (DAC) with Transport Canada. A DAC Charter was developed in November 2009, which details the scope of responsibilities and is consistent with the Policy on Internal Audit and the Directive on Departmental Audit
Committees. The committee includes four external members, and has met four times since November 2009 to provide the Deputy Minister with advice on the adequacy of the department’s risk management, control and governance processes.
- In addition, an Internal Audit Charter was prepared and approved by the DAC in November 2009. The Charter reflects Internal Audit’s mission and scope, as well as the independence of the function by the direct reporting relationship of the Chief Audit Executive to the Deputy Minister.
- Because of the department’s significant involvement in the EAP, the Office of the Comptroller General endorsed that Internal Audit’s role be expanded to include assurance and advisory services to support management in meeting EAP objectives, while maintaining Internal Audit’s independence and objectivity. Following this expansion, the 2009-2012 Risk-Based Audit Plan was
tailored to address high-risk priority areas within the department, support management with EAP implementation and prepare for the audit work by the Office of the Auditor General. Eighty percent of Internal Audit’s efforts are focused on EAP initiatives. This work includes readiness and risk assessments, process mapping and risk-based targeted reviews. Internal Audit is helping the
department examine and assess programs and projects in terms of their design and accountability, management frameworks and compliance with legislation.
- Internal Audit continued to expand its advisory services by continuously auditing to provide early warning and timely insight into risk and control issues for EAP programs. For example, continuous auditing efforts of the Infrastructure Stimulus Fund initially explored the feasibility of data access and analytical techniques and later assessed the data quality and business rule compliance
through a review of the program.
- Internal Audit also introduced a follow-up procedure for audit recommendations and related management action plans (MAPs) to monitor their implementation level. The status of the audit recommendations and MAPs were reported at all Departmental Audit Committee meetings.
- The follow-up assurance audit of the Travel, Hospitality and Acquisition Cards was completed and approved by the Departmental Audit Committee on January 27, 2010.
- A template was created to perform quality assurance reviews in compliance with the Institute of Internal Auditors’ Professional Standards. This template will be used by qualified, external assessors to perform quality assurance reviews.
Internal Evaluation
- Internal Evaluation implemented the new Treasury Board Policy on Evaluation (2009). A new five-year risk-based Evaluation Plan was developed in alignment with the departmental Program Activity Architecture (PAA) structure and focused on two work streams: a) Performance Measurement and b) Evaluation. Under the new plan, the majority of Infrastructure Canada’s direct program spending
will be evaluated every five years and evaluations will be conducted jointly by clustering programs based on departmental strategic outcomes, funding recipients or delivery mechanisms.
- The National Summative Evaluation of the Gas Tax Fund and the Public Transit Fund and the Evaluation of Infrastructure Canada Program-First Nation Component were completed and approved by the Departmental Evaluation Committee.
- Evaluation continued to increase internal capacity (hiring and training evaluators) to ensure comprehensive and value-added strategic evaluations, provide support on performance measurement and help develop performance measurement strategies.
Risk Management
- During 2009-2010, Infrastructure Canada built consistent operational risk management capacity and ensured due diligence under accelerated contribution program timelines to manage funding and implementation of the EAP.
- The department continued to refine and implement a sound integrated risk management approach throughout the organization. For example, business models use risk management principles and practices at all key decision points, staff are provided with guidance and instructions related to project risk identification and assessment (including a formal instruction form for the Infrastructure
Stimulus Fund), and risk management is used consistently to add value throughout program development and project cycles.
- In order the ensure the department can effectively deliver on EAP initiatives, existing integrated risk management tools have been quickly updated and refined, and new resources have been developed. The department has worked extensively internally and horizontally with partners to overcome approval and implementation barriers on a sustained basis.
- Finally, Infrastructure Canada has implemented a dynamic process for reporting progress on risk responses and impact on risk placement to senior management. This ensures that decisions concerning program design and resource allocation explicitly consider risk management.
Benefits for Canadians
Internal services provide senior management with direction and support for effective and efficient program design and delivery, to ensure stewardship and accountability of public funds, and build human resources capacity and leadership for program success.
Performance Analysis
The reporting period of 2009-2010 saw a rapidly changing economic climate and the development of major new infrastructure program initiatives, including new programs under EAP. The department reacted quickly to accelerate infrastructure funding of the existing programs, and to develop and implement new programs.
In order to meet the challenge, the department received Treasury Board approval for an increase in the Minister’s delegation of authority to approve infrastructure projects, and a departmental senior management Project Review Panel was established to provide independent advice and recommendations to the Minister. As well, approval was obtained for a revised policy framework for the Building Canada Fund, and legal and policy approvals were obtained for the new and revised programs under EAP.
The department also made significant progress on key horizontal management initiatives to improve planning and oversight. Its Program Activity Architecture structure was renewed and updated to reflect new strategic outcomes. The Corporate Risk Profile was updated to capture risks for EAP programs. The Project Review Panel Secretariat ensured that project risk identification and assessment criteria were applied consistently, and that projects conformed to government policy.
The Integrated Business and Human Resources Plan report was updated, including the specific incorporation of the values and ethics criteria and adjustments to reflect EAP programs. Internal controls, training and documentation were improved and client business service models were designed to support continuous improvement and facilitate shared services delivery. Overall, the department continued to build internal capacity and expertise in corporate services areas to support its growing program delivery requirements.
Significant efforts were made to further enhance the Shared Information Management System for Infrastructure. In partnership with federal delivery agencies, provinces, territories and municipalities, Infrastructure Canada progressed in implementing a foundation for the capture and life-cycle management of data for geographic project representation and mapping.
Finally, Communications services were provided to support ministerial announcements and events, and to develop strategic communications and marketing approaches to increase Canadians’ awareness and understanding of the department’s work. The web site Creating Jobs: Building Communities was developed to provide a single window for information on the department’s EAP projects. Media relations, monitoring and analysis, new media, exhibits and media outreach also contributed to reaching stakeholders and the general public. Project funding announcements, key trade shows such as the Federation of Canadian Municipalities, and the Association of Municipalities of Ontario and significant web initiatives all helped tell our story to Canadians.
Section III: Supplementary Information
3.1 Financial Highlights
The financial highlights presented in this Departmental Performance Report are intended to serve as a general overview of Infrastructure Canada’s financial position and financial operations. Financial statements can be found in the departmental web site at: http://www.infc.gc.ca/media/pub/index-eng.html.
3.1.1 Condensed Financial Statements
Table 22 represents the department’s Condensed Statements of Financial Position, and Table 23 represents the Condensed Statement of Financial Operations.
Table 22: Condensed Statement of Financial Position for the Period Ending on March 31, 2010
| Condensed Statement of Financial Position At the End of Fiscal Year (March 31, 2010) | % Change | 2009-2010 | 2008-2009 |
|---|---|---|---|
| Total Assets: | 180% | 123,250 | 59,230 |
| Total Liabilities: | 302% | 535,098 | 132,856 |
| Total Equity: | -459% | (411,848) | (73,626) |
Table 23: Condensed Statement of Financial Operations for the Period Ending on March 31, 2010
| Condensed Statement of Financial Operations At the End of Fiscal Year (March 31, 2010) | % Change | 2009-2010 | 2008-2009 |
|---|---|---|---|
| Total Expenses | 83% | 4,194,566 | 2,285,061 |
| Total Revenue | 0% | 8 | 9 |
| Net Cost of Operations: | 83% | 4,194,558 | 2,285,052 |
The sources of revenue are proceeds from crown assets disposals, from other fees such as Access to Information and Privacy requests, and from miscellaneous revenue such as the Bank of Montreal’s rebates on acquisition cards.
3.2 Financial Statements
Infrastructure Canada’s financial statements can be found at the departmental web site at: http://www.infc.gc.ca/media/pub/index-eng.html.
3.3 Supplementary Information Tables
3.3.1 List of Supplementary Information Tables
The following supplementary information tables are available electronically at the Treasury Board Secretariat’s web site at: http://www.tbs-sct.gc.ca/dpr-rmr/st-ts-eng.asp.
- Details on Transfer Payment Programs (TPPs)
- Horizontal Initiatives
- Green Procurement
- Response to Parliamentary Committees and External Audits
- Internal Audits and Evaluations
As prescribed by the Policy on Transfer Payments, as of June 30, 2009, the summary of the Three-Year Plan for Transfer Payments is available at: http://www.infc.gc.ca/pd-dp/tpp-ppt/index-eng.html.
3.4 Other Items of Interest
Since Infrastructure Canada was instituted in 2002, many of its organizations have been occupying office spaces in different locations in downtown Ottawa, Ontario, i.e. in different building addresses in the downtown core. Then, in early 2009, the department was able to secure permanent office space at 180 Kent Street, in a completely new building adjacent to the Minto Place Complex on Slater Street. Presently, more than half of Infrastructure Canada’s employees have moved to this new address, and the relocation is expected to be finalized in 2011-2012. This will be the first time that the whole department will be in the same building. It is expected that employees and the department as a whole will greatly benefit from this relocation, such as saving time travelling to and from meetings in different locations, having easier access to one another, being able to interact with each other, as well as many other benefits of being all in the same location.
3.5 Contact Information
For more information, please visit http://www.infrastructure.gc.ca or contact:
Infrastructure Canada
180 Kent Street, Suite 1100
Ottawa, Ontario
K1P 0B6
National information line on infrastructure: 613-948-1148
Telephone toll free: 1-800 O-Canada (1-800-622-6232)
National fax line on infrastructure: 613-948-9138
For more information on the Building Canada Plan, please visit http://www.buildingcanada.gc.ca.
- Total Authorities are lower than Planned Spending due to the fact that Statutory Funding Authorities are adjusted for information purposes during the year. Statutory funding authority for the programs under the Economic Action Plan was provided in the Budget Implementation Act. These programs are: Infrastructure Stimulus Fund, the accelerated funding under the Provincial-Territorial Infrastructure Base Fund, Green Infrastructure Fund and the Building Canada Fund-Communities Component Top-Up, all of which are expected to be completed by March 31, 2011.
- The increase in human resources requirement in 2009-2010 was due to the implementation of the programs introduced by the Economic Action Plan (EAP) in Budget 2009.
- Commencing in the 2009-2010 Estimates cycle, the resources for Program Activity: Internal Services are displayed separately from other program activities. They are no longer distributed among the remaining program activities, as was the case in previous Main Estimates. This has affected the comparability of spending and FTE information by Program Activity between fiscal years.
- For description of the Government of Canada Outcomes, please access the Treasury Board Secretariat web site at: http://www.tbs-sct.gc.ca/ppg-cpr/frame-cadre-eng.aspx.
- There are no 2008-2009 Actual Spending and 2009-2010 Main Estimates numbers for this program, as it was introduced in February 2009, as part of the Economic Action Plan (Budget 2009).
- There are no 2008-2009 Actual Spending, 2009-2010 Main Estimates numbers and no 2009-2010 Planned Spending for this program, as it was introduced in February 2009, as part of the Economic Action Plan (Budget 2009).
- Type is defined as follows: previously committed to-committed to in the first or second fiscal year prior to the subject year of the report; ongoing-committed to at least three fiscal years prior to the subject year of the report; and new – newly committed to in the reporting year of the Report on Plans and Priorities (RPP) or the Departmental Performance Report (DPR).
- Statutory funding authority for the programs under the Economic Action Plan was provided in the Budget Implementation Act. These programs are: Infrastructure Stimulus Fund, the accelerated funding under the Provincial-Territorial Infrastructure Base Fund, Green Infrastructure Fund and the Building Canada Fund-Communities Component Top-Up, all of which are expected to be completed by March 31, 2011.
- There are no 2009-2010 Human Resources Planned figures for this program. In November 2009, this program became a new program activity, and previous to this date, it was a funding program under the former Targeted Project-Based Infrastructure Funding program activity. Therefore its 2009-2010 Human Resources Planned figures were under the former program activity.
- There are no 2009-2010 Human Resources Planned figures for this program. In November 2009, this program became a new program activity, and previous to this date, it was a funding program under the former Targeted Project-Based Infrastructure Funding program activity. Therefore its 2009-2010 Human Resources Planned figures were under the former program activity.
- There are no 2009-2010 Human Resources Planned figures, as the program was introduced in February 2009, as part of the Economic Action Plan (Budget 2009).
- There are no 2009-2010 Human Resources Planned figures for this program. In November 2009, this program became a new program activity, and previous to this date, it was a funding program under the former Targeted Project-Based Infrastructure Funding program activity. Therefore its 2009-2010 Human Resources Planned figures were under the former program activity.
- There are no 2009-2010 Human Resources Planned figures for this program. In November 2009, this program became a new program activity, and previous to this date, it was a funding program under the former Targeted Project-Based Infrastructure Funding program activity. Therefore its 2009-2010 Human Resources Planned figures were under the former program activity.
- There are no 2009-2010 Human Resources Planned figures for this program. In November 2009, this program became a new program activity, and previous to this date, it was a funding program under the former Targeted Project-Based Infrastructure Funding program activity. Therefore its 2009-2010 Human Resources Planned figures were under the former program activity.
- There are no 2009-2010 Human Resources Planned figures for this program, as it was introduced in February 2009, as part of the Economic Action Plan (Budget 2009).
- There are no 2009-2010 Human Resources Planned figures for this program, as it was introduced in February 2009, as part of the Economic Action Plan (Budget 2009).
- There are no 2009-2010 Planned Spending and no 2009-2010 Human Resources Planned figures for this program, as it was introduced in February 2009, as part of the Economic Action Plan (Budget 2009).
- There are no 2009-2010 Planned Spending and no 2009-2010 Human Resources Planned figures for this program, as it was introduced in February 2009, as part of the Economic Action Plan (Budget 2009).