ARCHIVED - Natural Resources Canada
 This page has been archived.
Archived Content
Information identified as archived on the Web is for reference, research or recordkeeping purposes. It has not been altered or updated after the date of archiving. Web pages that are archived on the Web are not subject to the Government of Canada Web Standards. As per the Communications Policy of the Government of Canada, you can request alternate formats on the "Contact Us" page.
2006-2007
Departmental Performance Report
Natural Resources Canada
The Honourable Gary Lunn
Minister of Natural Resources
Table of Contents
Section I – Overview

Minister of Natural Resources
Minister's Message
I am pleased to present the Departmental Performance Report for Natural Resources Canada (NRCan) for the period ending March 31, 2007.
Canada's vast natural resources continue to play a vital role in shaping our economy, our society and our place in the world. In 2006, our energy, forests, minerals and metals sectors directly supported almost one million employees and produced a trade surplus of $92 billion.
To maintain Canada's position as a leader in rapidly changing global markets, NRCan has looked at a variety of ways to help our natural resources sectors improve their productivity and competitiveness. In the last year, the Department focused on more efficient exploration and development of natural resources, worked to reduce regulatory restrictions and other technical barriers to market access and investment, and supported the expansion of markets for Canada's products.
In the area of energy, Canada stands out as an emerging superpower. With our oil sands, we possess the world's second-largest oil reserves, and we continue to be the largest exporter of energy to the United States. In 2006, our energy exports reached $86 billion and accounted for nearly 20 percent of our merchandise trade exports.
In the field of minerals, metals and mining, Canada is viewed as a global mining giant in terms of reserves, level of production, exploration, investment and innovation. Moreover, Canada continues to be a leader in the Kimberley Process to control the legitimate trade in diamonds by ensuring that all of the country's diamond exports and imports are properly certified.
On the important questions of the sustainable development of our resources and the protection of the environment, the Department plays a key leadership role in many areas, including the control of natural hazards - such as insect infestations and wild fires - to ensure the continued supply of our forest resources, improving technologies for extraction and processing, developing biofuels, wind power and other clean energy sources, and controlling and reducing pollution.
NRCan also helps individual Canadians make a real contribution to the reduction of greenhouse gas emissions and the fight against climate change. My department supported the development and implementation of the Government of Canada's Clean Air Agenda and its $2 billion investment in ecoENERGY initiatives to encourage energy efficiency, increase the production of renewable energy and reduce the environmental impact of conventional energy resources.
In addition to its role in these activities, NRCan conducts innovative science and research with practical applications for resource development, such as the models of seafloor hazards that were incorporated in the hydrocarbon development proposals for offshore Newfoundland and the Beaufort Sea. In this way and others, NRCan carries on its long tradition of using science, technology and research to put Canada in a more competitive position internationally and improve the quality of life for Canadians.
These results are only a few highlights of the department's many achievements. I look forward to another productive year in which the sustainable development of our natural resources will help ensure a clean, healthy environment and build a prosperous Canada.
Management Representation Statement
I submit for tabling in Parliament, the 2006-07 Departmental Performance Report (DPR) for Natural Resources Canada.
This document has been prepared based on the reporting principles contained in the Guide to the Preparation of Part III of the 2006-07 Estimates: Report on Plans and Priorities and Departmental Performance Report.
- It adheres to the specific reporting requirements outlined in the Treasury Board Secretariat (TBS) guidance.
- It is based on the Department's approved Strategic Outcome and Program Activity Architecture that were approved by the Treasury Board.
- It presents consistent, comprehensive, balanced and reliable information.
- It provides a basis of accountability for the results achieved with the resources and authorities entrusted to it.
- It reports finances based on approved numbers from the Estimates and the Public Accounts of Canada.
Deputy Minister
Summary Information
NRCan's mandate is to develop, implement and deliver policies, programs, science and technology (S&T) for the sustainable development and responsible use of Canada's mineral, energy and forestry resources. The department is also responsible for developing an understanding of Canada's landmass and collecting and disseminating information on sustainable resource development. NRCan also maintains key roles related to the safety and security of people and natural resources, including security of natural resource infrastructure and supply.
NRCan's Minister is responsible for, or has responsibilities under, more than 30 Acts of Parliament. The core powers, duties and functions are set forth in the Department of Natural Resources Act, the Resources and Technical Surveys Act, and the Forestry Act. The remaining Acts set out the terms for the management of Crown lands and of Canada's natural resource policies, including energy and nuclear policy.
The Department's work is concentrated in areas of core federal jurisdiction, which includes:
- international and interprovincial trade;
- natural resource-based science and technology in support of federal objectives related to economic development, environmental protection, supply security and resource-related health and safety;
- natural resource management on Crown lands, the North and offshore areas; and
- uranium and nuclear power.
In carrying out these responsibilities, NRCan works closely with other federal departments with resource-related responsibilities, and supports the federal role in regional development and Aboriginal affairs in matters related to the resource sectors. NRCan also works in areas of shared responsibility with the provinces, such as the environment.
Financial Resources
| Main Estimates ($M) | Total Authorities ($M) | Actual Spending($M) |
|---|---|---|
| 1,426.1 | 1,738.1 | 1,685.7 |
Human Resources
| Planned | Actual | Difference |
|---|---|---|
| 4,456 | 4,379 | 77 |
Context, Departmental Priorities and Performance Highlights
Canada's vast resources have shaped our history, generating wealth and a distinctive way of life for generations of Canadians. Natural resources are a cornerstone of our success as a modern industrial society from before Confederation, and will continue to be into the 21st century. We have used our resource assets to our advantage, turning Canada into a world-leading commodity producer with related strengths in financial services, engineering, environmental consultancy, manufacturing and specialized science, technologies and services.
Yet, in a world characterized by a rapidly changing global economy and growing environmental awareness, we must work to ensure that Canada uses the right approach to sustainable resource growth, for now, and for the future. We need to recognize that, in the 21st century, vast natural resource endowments are not a sufficient condition of economic success, a better quality of life or a healthy environment. Sustainable, responsible, and modernized use of these endowments is what will create these positive benefits for Canadians.
NRCan works to build a more sustainable resource future by focussing its efforts in priority areas where we can build competitive advantage in today's global knowledge economy and society. The Department's strategic priorities guide NRCan's activities, support our strategic outcome, and advance the priorities of the Government of Canada. These priorities stem from inter-related issues of importance to Canadians, and shape our policies, programs and S&T.
Priority 1: Improve resource-sector productivity and competitiveness
In the global economy, the demand for Canada's natural resources is increasing as China and India increasingly become engines of growth. As these economies develop, their needs for energy, vital minerals and metals, and forest products will only grow (e.g., in base metals, copper, aluminum, nickel and zinc, China accounts for 20 percent of global demand). This strong Asian demand, coupled with the continuing demands from the U.S., continues to support historically high commodity prices. As a net exporter of resources, this implies a wealth gain for Canada. At the same time we are facing increasing competition from resource-rich emerging markets such as Russia, Brazil and China. This places a strong emphasis on the need for Canadians to continuously innovate, expand into new markets and move up the global value chain in order to remain competitive.
Commodity booms are cyclical, with some lasting longer than others depending on the extent of demand, pace of new project investments and the health of the global economy. The risk factors to growth - U.S. economic slowdown, the potential overheating of the Chinese economy - should not be underestimated. As well, while Canada is in the enviable position of attracting hundreds of billions of dollars in potential new resource investments, this is creating real economic strains - from skilled labour shortages, pressing needs for new infrastructure, to regulatory bottlenecks and insufficient capacity to deal with a range of issues including the engagement of Aboriginal peoples.
Productive and efficient exploration, development of value-added products and use of Canada's natural resources is critical to our future prosperity. Productivity improvement enhances the viability of communities, environmental quality, and the competitiveness of the Canadian economy. Upgrading and applying NRCan's S&T expertise in a strategic manner to promote innovation for greater economic efficiency, and improved environmental performance has been, and will continue to be, a vital part of this effort, as will creating greater regulatory efficiency.
Improvements to resource sector productivity and competitiveness include the delivery of the Government of Canada's Advantage Canada commitments to improve the efficiency and effectiveness of the regulatory system for major natural resource projects, promotion of the development of new value-added wood products from previously under-utilized tree species, and improvements to economic and environmental performance through S&T efforts on technology development and processing for minerals and metals.
Priority 2: Advance resource efficiency and conservation
The linkages between natural resources, the environment and sustainability are well-known. As rising demand puts increasing pressure on our natural resources, including water, this, in turn, places the spotlight on important environmental issues both within Canada and internationally - from rising greenhouse gas emissions (GHGs), air pollution, the future of the boreal forest (e.g., pests, forest fires), rising water quantity and quality issues, to the changing North. In this context, sound management of our natural resource endowments, which is shared with the provinces and territories, is important for the quality of life and well being of all Canadians.
Both Canada and the global community need to find effective ways of reconciling the increasing demand for vital resources, especially fossil fuels, with the adverse environmental impacts this increased usage generates. Among other things, this means placing a high priority on using regulation wisely to reduce the environmental footprint of industrial production and our modern way of life. It means setting long-term goals for GHG reductions, reducing air pollution and creating new energy efficiency standards. It also means investing strategically in a clean energy agenda focussed on promoting smarter energy use, increasing the supply of clean energy and addressing the emissions from conventional sources of energy.
In these areas, NRCan has made significant progress. Our efforts have contributed to a decline of 16 percent in Canada's emissions intensity between 1990 and 2005 (expressed as carbon dioxide emissions from fuel combustion per unit of GDP) and, Canada's energy efficiency has improved by an estimated 14 percent between 1990 and 2004. Resource efficiency and conservation improvements include the advancement of energy technologies along the innovation curve through research projects, pilot plant activities and demonstration projects, and the construction of new ethanol plants that have increased Canadian annual ethanol production capacity under the Ethanol Expansion Program.
Priority 3: Ensure the safety and security of people and resources
Terrorist attacks and the increasing frequency and intensity of natural disasters have raised safety and security imperatives at the international level. NRCan provided expertise and analysis of nuclear testing carried out around the world. In addition, the Department's 24/7 monitoring of earthquake activity and magnetic disturbances, and analysis of tsunami risk off Canada's coasts contributed to the state of readiness and response by people, industry and emergency preparedness organizations. Close to home, forests are challenged by incidences of forest pests such as Mountain Pine Beetle outbreaks, while foresters are increasingly preoccupied by wildfires across Canada. These bring issues of natural resource security and supply-of-mind. It is anticipated that issues related to the security of natural resource supply and infrastructure, particularly with respect to energy, will continue to be a major concern for government, the private sector and consumers.
Safety and security is therefore an important public policy driver that NRCan must address strategically. This entails not only the department's specific regulatory mandate, but also keen attention paid to the safety and security of individual livelihoods, community stability, emergency management, and national natural resource supply strategies. Aware of these concerns, NRCan provides expertise, accurate and timely information to decision-makers which, in turn, provides organizations with the tools to safeguard people and the resource base. Critical information has been provided on the rate and severity of the Mountain Pine Beetle infestation by mapping 3,750,000 hectares of beetle-affected forests and our understanding of water supply has deepened by mapping aquifers across Canada through the Groundwater Mapping Program. Shipments of Canadian diamonds, both imported and exported, were completed in compliance with the Kimberley Process Certification Scheme, and civil emergency plans were established to ensure that in the event of a crisis, citizens are protected.
Priority 4: Provide science, information and tools for decision making and support responsible development of Canada's North
Sustainable development is about having and using the right knowledge and technology tools which permit effective, integrated decision making that considers economic, environmental and social factors - a prerequisite for strong cities and communities. Building community capacity is about fostering the conditions for advancing development by improving communities' ability to make better decisions.
It is a legislated requirement that environmental considerations of natural resource development continue to be a departmental priority. NRCan science ensures that this decision making is informed and effective. There is, therefore, an imperative for NRCan to continue to build the national knowledge base of Canada's land-based and offshore resources, and to develop and improve the tools and technologies that will enable communities to use this knowledge effectively.
With respect to the North, Canada has many reasons for adopting a more strategic approach to its support for the development of the northern natural resource base. Declining base metal and conventional energy reserves, coupled with growing global demand for these natural resources, has led to an increased awareness of the potential opportunities for natural resource development in Canada's North. Access to sound NRCan science will be key to making the most of these opportunities. NRCan's Targeted Geoscience Initiative 3, focussed on base metal resources, has led to increased private sector investment and targeted exploration. However, the exploration and extraction of tremendous, but non-renewable resources, must proceed hand-in-hand with community advancement, and must not compromise environmental integrity.
NRCan initiatives have contributed to effective decision-making and support for responsible resource development across Canada, including the North. These include the production of several key seafloor maps for the use in fisheries management plans and conservation strategies through the Geoscience for Oceans Management Program; the Model Forest Program supported over 250 research, demonstration and outreach partnership projects across Canada, engaging approximately 500 partners; and the Northern Resource Development Program has made significant progress toward an expanded and improved public geoscience knowledge base for the territories and the northern parts of the provinces.
Priority 5: Enhance NRCan's capacity to deliver policies, programs, science and technology
Canadians want good governance. They want to know that government programs are managed with honesty and integrity and in a manner that is open and transparent. This priority requires strong corporate management which ensures that the department has the right people, tools and structures to deliver on its mandate, mission and departmental priorities.
To ensure that NRCan is prepared and properly positioned to deliver on the priorities of Canadians and their Government, NRCan made a further investment in its systematic strategic planning process and launched the "North Star" initiative that emphasizes the development of a strategic natural resources framework and departmental integration; advanced its human resources renewal agenda; moved towards an enterprise-wide approach to information technologies and information management planning and investing; generated savings of $3.3 million through shared services; and strengthened its evaluation and audit functions.
A summary of these and other departmental accomplishments can be found in this section, whereas Section II of this report provides more details on all accomplishments by program activity.
Program Activity Crosswalk to Departmental Priorities
The following table provides a crosswalk of program activities to departmental priorities and to Government of Canada outcome areas.
| Strategic Outcome: Canadians derive sustainable social and economic benefits from the assessment, development and use of energy, forest and mineral resources, and have the knowledge to mitigate environmental impacts and respond effectively to natural and man-made hazards | ||||||||
| Government of Canada Outcomes | Strong Economic Growth | A Clean and Healthy Environment | Strong Economic Growth | Strong Economic Growth | ||||
|---|---|---|---|---|---|---|---|---|
| Program Activities (Spending in M$) |
Earth Sciences | Energy* | Sustainable Forest* | Minerals and Metals | ||||
| Departmental Priorities | Planned Spending | Actual Spending | Planned Spending | Actual Spending | Planned Spending | Actual Spending | Planned Spending | Actual Spending |
| 1. Improve resource sector productivity and competitiveness | 33.5 | 29.5 | 20.1 | 22.1 | 58.9 | 72.4 | 20.6 | 20.9 |
| 2. Advance resource efficiency and conservation | 8.7 | 9.6 | 408.9 | 415.8 | 35.1 | 38.9 | 10.9 | 15.0 |
| 3. Ensure the safety and security of people and resources | 25.1 | 26.3 | 7.7 | 3.5 | 0.0 | 0.0 | 4.9 | 6.4 |
| 4. Provide science, information and tools for decision-making and support responsible development of Canada's North | 60.1 | 56.9 | 0.0 | 0.0 | 8.3 | 10.1 | 0.7 | 0.5 |
| Other supporting and enabling initiatives/services** | 103.0 | 116.3 | 34.6 | 50.4 | 50.1 | 56.7 | 20.9 | 31.5 |
| Statutory programs - Atlantic offshore | 0.0 | 0.0 | 558.7 | 702.9 | 0.0 | 0.0 | 0.0 | 0.0 |
| Total NRCan | 230.4 | 238.6 | 1030.1 | 1194.7 | 152.4 | 178.1 | 58.0 | 74.3 |
* Planned spending excludes: $110M for the Newfoundland Fiscal Equalization Offset Payments; $65M received via the Supplementary Estimates for activities related to the safe decommissioning of shutdown buildings and contaminated lands in order to meet federal regulatory requirements, and for the long-term strategy needed for the disposal of nuclear wastes (Nuclear Legacy Liabilities Program); and $30M received via Supplementary Estimates in support of the federal response to the Mountain Pine Beetle infestation in B.C.
** Includes program management and support, and corporate management for all program activities. The apparent increase in corporate management costs reflects a change in reporting of some corporate activities (i.e., shared services, communications and information technology) which were previously included in sector/program planned spending. This change was made to improve accountability and transparency associated with reporting of these areas.
1Section II of the 2006-07 Report on Plans and Priorities presented information by departmental priority rather than by program activity. Section II of this corresponding Departmental Performance Report presents information by program activity to better reflect the contribution of our programs.
Departmental Results Structure
NRCan manages its program delivery through four major program activities: Earth Sciences, Energy, Sustainable Forest, and Minerals and Metals. Each of NRCan's program activities is divided into smaller groups of activities that are designed to achieve intermediate outcomes that collectively contribute to the realization of the overall departmental strategic outcome. The Corporate Management program activity provides internal support and enables the delivery of other departmental programs.
| Strategic Outcome: Canadians derive sustainable social and economic benefits from the assessment, development and use of energy, forest and mineral resources, and have the knowledge to mitigate environmental impact and respond effectively to natural and man-made hazards. | ||||
| Program Activities: Expected Results | Earth Sciences | Energy | Sustainable Forest | Minerals & Metals |
|---|---|---|---|---|
| Earth sciences knowledge and tools enable Canadians to achieve economic opportunities, a clean environment, and adapt to a changing climate, in safety and security. | Canadians benefit economically, environmentally, and socially from the sustainable production, development and use of Canada's abundant energy resources. | Healthy forests continue to provide balanced social, environmental and economic benefits to Canadians. | Canadians derive sustainable social and economic net benefits from the assessment, development and use of mineral expertise, mineral resources, and related industries. | |
| Sub-Activities: Expected Results |
Economic opportunities: New economic opportunities created for Canadians A clean environment: reduced stress on the environmental ecosystems and human health Enhancing resilience to a changing climate: Canadians and their insitutions understand and prepare for the effects of a changing climate Public safety & security: Increased safety and security of Canadians |
Energy policy: Domestic and international energy policy analysis, development and advice that supports the sustainable development of Canada's energy sector Electricy & renewable energy: Sustainable development and safe and reliable delivery of electricity with a reduced environmental impact Petroleum resources: A fair, efficient and competitive oil, natural gas and petroleum products marketplace that is consistent with Canada's social and environmental goals Energy efficiency and alternative transportation fuels: Improved energy efficiency of all sectors and increased production and use of alternative transportation fuels in Canada Energy S & T: Canadians derive new economic, environmental and social benefits through federal energy S & T |
Leading change in Canada's forest sector: An integrated national forest sector innovation system that addresses current and emerging issues Climate change: Canada's climate change reporting obligations are met, and forest-based options for adaptation to, and mitigation of, climate change are developed International: Canada is a globally-recognized leader of forest sector sustainability Sustainability of Canada's forests: Forest losses are addressed through the provision of balanced social, economic and environmental information and advice Strong communities: Forest-dependent communities have choices and options for economic opportunities Competitiveness of Canada's forest products industry: Canada's forest industry competes successfully in the global forest products market |
Fiscal and social policy: Investment in Canada's exploration and mining industries is strengthened Industry analysis and business development: Market access for mineral and metal commodities (including recyclables) and related industries is promoted and, where necessary, protected; Canada's international prominence and investment in mining are secured Minerals and metals S & T: Canadians benefit from R & D with respect to minerals, metals and value-added products Explosives safety and security: Safety and security of workers and the public throughout Canada are improved with respect to explosives Minerals and metals programs: Canadians are provided with information to improve deicisons regarding minerals and metals |
| Corporate Management – NRCan is enabled by supportive corporate management functions | ||||
Departmental Performance Summary by Program Activity
The performance information presented in this report is based on NRCan's results structure presented on the previous page. By focusing on this results structure, NRCan has improved its ability to manage for results. It has also ensured that individual programs, projects and initiatives are relevant to the Government of Canada and departmental priorities, and continue to provide value for money to Canadians.
The table below presents the core suite of performance indicators and a summary of the key achievements, by program activity and sub-activity.
| Strategic Outcome - Canadians derive sustainable social and economic benefits from the assessment, development and use of energy, forest and mineral resources, and have the knowledge to mitigate environmental impacts and respond effectively to natural and man-made hazards | |
| PROGRAM ACTIVITY - EARTH SCIENCES - Earth sciences knowledge and tools enable Canadians to achieve economic opportunities, a clean environment, and adapt to a changing climate, in safety and security | |
|---|---|
| Key Performance Indicators | Key Achievements |
| Sub-Activity/Expected Result - Economic opportunities: New economic opportunities created for Canadians | |
| Increased mineral and energy exploration investment made by the private sector as a result of public geoscience investments | Public geoscience led to the discovery and development of new or unconventional mineral and energy resources; for example, the increase in private sector exploration expenditures in the Targeted Geoscience Initiative 3 (TGI3) target areas is estimated at $50 million to date and the identification of new drilling targets in all four areas is being attributed to TGI3 activities. |
| Meet the legal requirements to provide a survey system on Canada Lands to enable economic development | NRCan carried out surveys in support of treaty entitlement claims and implementation plans for comprehensive land claims agreements in several provinces including Ontario, Quebec, Alberta and British Columbia (B.C.). |
| Geospatial data availability and user satisfaction with access, data quality and service | NRCan's GeoBase initiative, a national partnership that is providing fundamental geographical information for Canada, contributed data for the six base layers including roads, elevations, remotely-sensed imagery, waterways and geographical names. |
| Under Canada's Ocean Strategy, new ocean management plans, policies and protected areas incorporate earth sciences information | The Geoscience for Oceans Management Program produced several key seafloor maps that were used in fisheries management plans and conservation strategies, as well as input to five oceans management plans. In addition, models of seafloor hazards were incorporated directly into offshore hydrocarbon development proposals, including the Beaufort Sea and offshore Newfoundland. |
| Sub-Activity/Expected Result - A clean environment: Reduced stress on the environmental ecosystems and human health | |
| The use of NRCan assessments of environmental hazards that result in corrective actions | NRCan provided environmental and resource assessments for several mining projects including the Victor diamond mine. In addition, the Department worked with a mine operator in B.C. to develop environmental models that reduced the risk of exposure from mine tailings to the surrounding landscape. |
| Percentage of key Canadian aquifers with complete assessments | NRCan's Groundwater Mapping Program identifies, maps and assesses aquifers in Canada to estimate groundwater availability, vulnerability and sustainability. Nine of the thirty key aquifers across Canada were mapped by the end of 2006-07. |
| Sub-Activity/Expected Result - Enhancing resilience to a changing climate: Canadians and their institutions understand and prepare for the effects of a changing climate | |
| The availability of NRCan information to Canadians in developing strategies to adapt to climate change | NRCan worked in collaboration with Hydro-Quebec and Manitoba Hydro to assess climate-related trends and variability in water supply. The Department aims to extend the knowledge gained from these case studies to assist other utilities to plan future capacity. |
| Sub-Activity/Expected Result - Public safety and security: Increased safety and security of Canadians | |
| NRCan meets its emergency response obligations in the event of real or simulated civil emergencies | NRCan provided expertise in support of the Comprehensive Test Ban Treaty Implementation Act and the Federal Nuclear Emergency Plan. In December 2006, the Department provided confirmation and detailed follow-up assessments of the Democratic Peoples Republic of Korea's nuclear test; these were critical in determining the nature of the nuclear test. |
| Increased use of NRCan hazard assessments in planning and hazard mitigation decisions | The Department carried out a number of risk assessments, including probable height of tsunami waves for the B.C. Emergency Preparedness Organization. It also developed, in conjunction with the University of Calgary, equipment for measuring the disruption of radio communications and Global Positioning Systems resulting from space-based weather hazards. |
| Meet international treaty obligations to maintain a well defined Canada/U.S. boundary for border security purposes | Delivered, on schedule, five-year and fifteen-year maintenance plans for the Canadian section of the International Boundary Commission. |
| Program Activity: Energy - Canadians benefit economically, environmentally, and socially from the sustainable production, development and use of Canada's abundant energy resources | |
| Key Performance Indicators | Key Achievements |
| Sub-Activity/Expected Result - Energy policy: Domestic and international energy policy analysis, development and advice that supports the sustainable development of Canada's energy sector | |
| Canada's energy contribution to Gross Domestic Product (GDP) | Canada's energy contribution to GDP represented 5.8 percent in 2006. |
| Canada's energy exports | Canada's energy exports were $86 billion in 2006, representing approximately 19 percent of its merchandise trade exports. |
| Canada's emissions intensity | Canada's emissions intensity, expressed as carbon dioxide emissions from fuel combustion per unit of GDP, declined by 16 percent between 1990 and 2005. |
| Sub-Activity/Expected Result - Electricity and renewable energy: Sustainable development and safe and reliable delivery of electricity with a reduced environmental footprint | |
| Number of petajoules (PJ) of zero or low emission electrical and thermal energy in Canada | In 2005, over 1600 PJ of electrical energy was produced from zero or low emission sources, up from about 1550 PJ in 2004. Moreover, in 2005, hydro accounted for 1290.4 PJ of the electrical energy produced (wind 5.6 PJ; nuclear 312.6 PJ; and biomass 26.2 PJ). |
| Index of electricity reliability (IOR) | In 2003 (the latest year for which data are available), the IOR was 0.99878; excluding the impacts of the August 14th blackout and Hurricane Juan of 2003, the IOR increases to 0.99941. |
| Emissions intensity of electricity generation in Canada | A relative increase in the production of electricity from natural gas and petroleum coke, and a relative decrease in nuclear and hydro, resulted in a 5 percent increase in greenhouse gas intensity of energy used to produce electricity from 1990 to 2004, from 31.5 tonnes/terajoules (TJ) to 33.0 tonnes/TJ. However, with a decrease from 36.1 tonnes/TJ in 2003 to 33.0 tonnes/TJ in 2004, the intensity effect is at its lowest level since 1997 because three nuclear reactors in Ontario returned to service in 2003. |
| Public confidence in nuclear fuel cycle activities | Polling in the Port Hope area indicated that years of discussion and education have yielded steady growth in community awareness and understanding of waste cleanup efforts. Today, 73 percent of local residents are confident in the Government's proposal. |
| Sub-Activity/Expected Result - Petroleum resources: A fair, efficient and competitive oil, natural gas and petroleum products marketplace that is consistent with Canada's social and environmental goals | |
| Increased public awareness and understanding of petroleum markets | Canadians have access to NRCan data on gasoline markets and up-to-date information of petroleum products. |
| Sub-Activity/Expected Result - Energy efficiency and alternative transportation fuels: Improved energy efficiency of all sectors and increased production and use of alternative transportation fuels in Canada | |
| Percent improvements in energy efficiency | Canada's energy efficiency improved by an estimated 14 percent between 1990 and 2004 (latest year for which data are available). |
| The number of petajoules energy savings due to energy efficiency | In 2004 alone, improvements reduced energy use by 902.7 petajoules from what it would have been otherwise. |
| Renewable fuel production as a percentage of total transportation fuel | In 2004, renewable fuel production was 0.23 percent of total on-road transportation fuel use |
| Alternative fuel use as a percentage of total transportation fuel | In 2004, alternative fuel use was approximately 1.3 percent of total on-road transportation fuel use |
| Sub-Activity/Expected Result - Energy S&T: Canadians derive new economic, environmental and social benefits through federal energy S&T | |
| Technology focusing (i.e., project distribution along the innovation curve) | Significant progress was made advancing technologies along the innovation curve: 233 basic research projects; 237 applied research projects; 73 pilot plant activities; and 29 demonstrations projects. |
| Number of codes published, presentation, active Memorandum of Understanding (MOU), patents, licences issued | The development of codes, standards and regulations breaks down barriers to adopting new technologies and advances market penetration, while also leading to a competitive advantage for the Canadian industry. In 2006-07: 36 codes were published; 1005 presentations were made by scientists in the programs; 109 MOU and 36 patents were active; 9 patents and 55 licences were issued. |
| Number of energy S&T partnerships, both domestic and international | Partnerships help increase Canadians' scientific knowledge, strengthen our standing in the international community, and increase our exports of innovative technologies. In 2006-07, there was 486 and 481 formal collaborations on domestic and international projects, respectively. |
| PROGRAM ACTIVITY - SUSTAINABLE FOREST - Healthy forests continue to provide balanced social, environmental and economic benefits to Canadians | |
| Key Performance Indicators | Key Achievements |
| Sub-Activity/Expected Result - Leading change in Canada's forest sector: An integrated national forest sector innovation system that addresses current and emerging issues | |
| A national forest research institute which includes the new NRCan-created Canadian Wood Fibre Centre (CWFC), is established, and defines innovation priorities and goals to improve the competitiveness of the forest sector in Canada | A new national forest research institute, FPInnovations, is created through the merger of Paprican, FERIC, and Forintek, and includes the CWFC. |
| The CWFC is fully operational and has integrated its priorities with the national forest research institute | CWFC launched in April 2006 and is developing its priorities in collaboration with the newly created FPInnovations. |
| Academia is actively engaged in the development and launch of a national forest innovation work program | CWFC design team includes active representation from academia. |
| Sub-Activity/Expected Result - Climate change: Canada's climate change forest reporting obligations are met, and forest-based options for adaptation to, and mitigation of, climate change are developed | |
| Information and options for inclusion of forests in adaptation strategies, including options for managing Canada's forest | NRCan Forest Carbon Monitoring, Accounting and Reporting System is used to understand how forest management can affect forest carbon. |
| Forest-related information is reported in Canada's National Inventory Report of Greenhouse Gas Sources and Sinks to the U.N. Framework Convention on Climate Change (UNFCCC) by April of each year | NRCan assisted Environment Canada in meeting reporting requirements of the UNFCCC in April 2006. An integrated science/policy risk analysis of the question of whether to count Canada's managed forests towards the Kyoto Protocol targets was completed. |
| Sub-Activity/Expected Result - International: Canada is a globally-recognized leader of forest sector sustainability | |
| Number of forest countries actively committed to the Canada-led initiative to secure an international agreement on sustainable forest management | NRCan, the Department of Foreign Affairs & International Trade, and the Canadian International Development Agency co-hosted a meeting of 20 like-minded countries in pursuit of a legally binding instrument (LBI) for sustainable forest management during October 2006 in Gatineau, Quebec. A series of bilateral meetings with nine like-minded, LBI-inclined countries were also held on the margins of the U.N. Food and Agriculture Organization Committee on Forestry in Rome, Italy in March of 2007. |
| Value of leveraged contributions in key bilateral science and technology relationships, including the U.S., Russia and China | In 2005 Canada and Russia signed a Statement of Technical Cooperation for a three-year period, with a view to improving sustainable management of the Russian forest. In 2006-07, significant progress was achieved towards introducing Canadian tools in Russia for fire management and forest carbon monitoring. Enhancing Russia's capacity in these areas will serve to help the country achieve its greenhouse gas reduction objectives. |
| Sub-Activity/Expected Result - Sustainability of Canada's forests: Forest losses are addressed through provision of balanced social, economic and environmental information and advice | |
| Full implementation of the controlling the spread element of the Federal Response to the Mountain Pine Beetle (MPB) Infestation in B.C., including mitigating the eastern spread of the beetle by applying control strategies to beetle-affected forested areas. | Provided critical information on the rate and severity of MPB infestation. For example, digital mapping was completed on 3,750,000 hectares of beetle-affected forests. Ninety-thousand beetle-infested trees were removed through fall and burn on provincial forest lands along the B.C.-Alberta border. |
| Number of Canadian jurisdictions and value of their contributions coordinating their operational management of forest pest risks under a national forest pest strategy | The National Forest Pest Strategy prospectus was approved by the Canadian Council of Forest Ministers. A steering group was established with representation from NRCan, the Canadian Food Inspection Agency, and the provinces of Alberta, B.C., and Ontario. |
| Sub-Activity/Expected Result - Strong communities: Forest-dependent communities have choices and options for economic opportunities | |
| Initiation of the protecting communities and forest resources element of the Federal Response to the MPB Infestation in B.C., including developing options for new natural-resource based opportunities for affected communities | Options were completed for three First Nations communities and fuel load management accomplished on 115 hectares. The construction of fireguards was completed on the south and southwest sides of the town of Banff, in Banff National Park. |
| Number of partnerships and their contributions under Canada's Model Forest Program (MFP) | MFP supported over 250 research, demonstration and outreach partnership projects across Canada, engaging approximately 500 partners drawn from industry, provincial governments, land use planning authorities, Aboriginal organizations, environmental and community groups. |
| Number of partnerships and their contributions under the First Nations Forestry Program (FNFP) | FNFP was responsible for approximately 150 capacity-building projects, involving 155 First Nations communities. The program expended a total of $3.8 million, leveraging additional cash and in-kind contributions from partners for a total project value of $13.7 million. |
| Conversion of the South Moresby Forest Replacement Account (SMRFA) into a locally managed vehicle for the support of projects that contribute to the long-term sustainability of forest resources and community stability on the Queen Charlotte Islands | NRCan, Environment Canada and the Province of B.C. transferred $25 million of remaining funds from the SMFRA to the Gwaii Forest Charitable Trust. |
| Sub-Activity/Expected Result - Competitiveness of Canada's forest products industry: Canada's forest industry competes successfully in the global forest products market | |
| Reduction of technical barriers to wood use in offshore, and North American markets | In China, first drafts of a Shanghai local wood frame construction code and fire code were completed, and are awaiting approval. In Japan, ministerial approval was obtained for post and beam structures in fire-protected zones; Jack pine was accepted as an approved species in the manufacture of structural laminated wood products; and the Canada Tsuga (hemlock) kiln-dried product line was certified with strength equivalency to engineered wood products. |
| Improved competitiveness and productivity of the Canadian secondary-manufacturing wood sector | New value-added wood products developed from previously under-utilized tree species in Northern Quebec and Ontario have contributed to the growth of the I-Joist industry in Eastern Canada and have indirectly resulted in the establishment of new manufacturing facilities creating significant employment opportunities. |
| Expansion of wood markets in targeted offshore, and North American markets | Wood exports to China increased by $100 million since 2000 and now total $121 million. After years of decline, exports to Japan have stabilized; the value of wood exports to South Korea increased by 38% in 2006, totalling $100 million; the value of wood exports to Europe increased by 18% in 2006, totalling $632 million. |
| PROGRAM ACTIVITY - MINERALS AND METALS - Canadians derive sustainable social and economic net benefits from the assessment, development and use of mineral expertise, mineral resources, and related industries | |
| Key Performance Indicators | Key Achievements |
| Sub-Activity/Expected Result - Fiscal and social policy: Investment in Canada's exploration and mining industries is strengthened | |
| Canada accounts for more than 35 percent of the equity raised for mineral exploration and mining in the world | Through Canadian financial institutions, Canadian-based companies raised just under 40 percent of all equity, worldwide, for mineral exploration and development in 2006. |
| Canada accounts for more than 15 percent of global expenditures on mineral exploration | Based on 2006 exploration budget data, more than 19 percent of the world's total exploration budget was targeted at Canada. |
| The rate of decline in base-metal reserves is moderated | Data for 2005 showed increased reserves of copper, nickel, molybdenum and gold, and the rising exploration spending trend continues unabated. |
| Sub-Activity/Expected Result - Industry analysis and business development: Market access for mineral and metal commodities (including recyclables) and related industries is promoted, and where necessary, protected; Canada's international prominence and investment in mining are secured | |
| Unnecessary restrictions on market access and investment are minimized or eliminated | The Department was instrumental in providing technical and policy advice with the result that the European Union exempted recyclable materials from the scope of new legislation for the Registration, Evaluation and Authorization of Chemicals (REACH) and exempted mineral ores and concentrates from registration. |
| Canada influences intergovernmental organizations to develop a coordinated program to address the United Nations Commission on Sustainable Development's (UNCSD) 2010 agenda for mining sustainability | Asia-Pacific Economic Cooperation (APEC) Ministers Responsible for Mining, the African Mining Partnership and the Mines Ministers of the Americas included the development of an appropriate government response to the 2010 UNCSD meeting as work programs items within their forward planning agendas. |
| Aboriginals account for five percent of the labour force in Canada's mining industry | From 1996 to 2001 (the latest year for which data are available), Aboriginal participation in the mining sector grew from 3.6 to 5.3 percent of the workforce. |
| Aboriginal awareness of the benefits and impacts of mining is enhanced | NRCan, in partnership with Indian and Northern Affairs Canada (INAC), provincial governments and exploration and mining associations, provided four pilot information sessions on exploration and mining for Aboriginal communities in northern Ontario, Quebec's North Shore, northern Quebec, and Vancouver, British Columbia. NRCan, along with the Prospectors and Developers Association of Canada, the Mining Association of Canada, the Canadian Aboriginal Minerals Association (CAMA) and INAC, also released a Mining Information Kit for Aboriginal Communities. These activities helped to promote understanding by Aboriginal peoples and communities of all aspects of mining development. |
| Federal policies are developed in partnership with and supported by provincial and territorial mines ministers | Intergovernmental partnerships were strengthened through the adoption of a Mines Ministers' Framework for Action and the implementation of an action plan to advance shared priorities. |
| Sub-Activity/Expected Result - Minerals and metals S&T: Canadians benefit from research and development (R&D) with respect to minerals, metals and value-added products | |
| Labour and total factor productivity growth in Canada's minerals and metals industries are greater than the national average for all industries | Thirty-two projects undertaken throughout 2006-07 were directed to raising productivity levels in the minerals and metals sector. Five projects were completed during the year including: a project for a major gold producer to train 12 workers in effective experimental design using statistical techniques for use in improving their milling operations; and development of 3D mine ventilation computer modelling software that relates factors such as power requirements and fan-operating efficiency to determine optimum design to minimize ventilation costs. |
| The emission of greenhouse gases and pollutants by the minerals and metals and associated industries (e.g., transportation) are reduced | Seventy-two projects on the reduction, control or mitigation of effects of pollutants from the minerals industry were conducted. NRCan provided expert input to changes to Base Metal Smelter Regulations and Metal Mining Effluent Regulations, published during the year. Thirty-nine research projects were completed and 47 projects were undertaken to develop new materials and materials processing technologies to reduce greenhouse gas emissions. |
| The health and safety of workers in the mining industry are improved | Eighty-four projects improving health and safety of mining workers were conducted. NRCan completed the commercial transfer of an anti-vibration handle for rock drills to combat Raynaud's Syndrome (White Hand Disease) as well as the Diesel Emissions Evaluation Program which, among other things, developed a ceramic filter to reduce emission of fine particulates into the mine environment. |
| Sub-Activity/Expected Result - Explosives safety and security: Safety and security of workers and the public throughout Canada are improved with respect to explosives | |
| The number of explosives-related accidents is below or at least comparable to the average of the previous three years | Canada's excellent explosives safety statistics were maintained. There were no significant explosives-related accidents in Canada in 2006-07. |
| The quantity of incidents where explosives stolen is below or at least comparable to the average of the previous three years | Five thefts of explosives occurred in 2006, compared to ten in 2005 and six in 2004. |
| Sub-Activity/Expected Result - Minerals and metals programs: Canadians are provided with information to improve decisions regarding minerals and metals; regulatory processes meet Government of Canada objectives | |
| Canadians receive relevant, accurate, timely, and accessible statistics, as defined in Statistics Canada's Quality Assurance Framework, on the minerals and metals industries | Analyses and dissemination of statistical information were provided to Statistics Canada, provinces and territories, in accordance with the agreed schedule. |
| The environmental assessments of mining projects under the Canadian Environmental Assessment Act are completed within agreed-upon time lines | NRCan fulfilled its statutory obligations as a responsible authority under the Canadian Environmental Assessment Act as well as under northern resource management statutes and the Nunavut Land Claims Agreement with respect to the environmental assessment of mining projects. |
| The regulatory process (e.g., the environmental assessment process, and regulatory permitting, licensing and authorization) are streamlined through a single-window approach | NRCan cooperated with the provinces and territories and federal departments to develop recommendations for an improved regulatory framework for mining that is consistent, timely, predictable, effective in protecting the environment and coordinated across jurisdictions. |
| The quantity of rough diamonds imported from and exported to non-participants in the Kimberley Process is nil | The Canadian diamond trade is subject to import and export restrictions limited to participants in the Kimberley Process Certification Scheme; all of the 271 shipments exported and 320 shipments imported in calendar 2006 were transactions with participants. |
| PROGRAM ACTIVITY - NRCan is enabled by supportive corporate management functions | |
| Key Performance Indicators | Key Achievements |
| Sub-Activity/Expected Result - NRCan is supported by efficient and effective corporate management functions | |
| Actual departmental expenditures within -5 percent of planned spending (votes 1, 5 and 10) | NRCan was well within its expenditure target given that it underspent by 1.5 percent. |
| Evidence of significant human resources renewal initiatives implemented | NRCan has set a precedent within the Public Service with the development of a framework for standardizing the creation of EX-01 to EX-03 positions. |
| Degree to which the Department and the TBS have invested in NRCan's Long Term Capital Plan (LTCP) | The LTCP was developed and conditionally approved. |
| Degree to which NRCan invests in recapitalization of real property versus 4 percent standard benchmark | In the area of real property, NRCan invested $2.5 million in recapitalization; this is below the standard benchmark of 4 percent, which would have required NRCan to invest $41.6 million, a shortfall of $39.1 million. |
| Evidence of an enterprise approach to information management (IM) and information technology (IT) planning and investing | Completed an IM strategy framework and commenced work on an IM strategy; a strategic roadmap initiative was advanced and an IT infrastructure funding model was implemented; achieved 92 percent of compliance with the Management of IT Security Standard and completed assessments of 8 critical business functions. |
| Sub-Activity/Expected Result - NRCan is enabled to deliver value to Canadians supported by efficient and effective shared administrative services | |
| Total savings from shared services | NRCan generated savings of $3.3 million through its Shared Services Initiative. |
| Sub-Activity/Expected Result - Departmental management systems, programs, policies and initiatives are strengthened as a result of independent performance assessments | |
| The internal audit function meets the requirement of the Government of Canada Internal Audit Policy and is rated as satisfactory by the Comptroller General of Canada | Function rated as acceptable by the Comptroller General in the 2006 Management Accountability Framework (MAF) assessment. |
| The evaluation function meets the requirement of the Evaluation Policy and is rated as satisfactory by the Treasury Board Secretariat | Function meets the requirements of the evaluation policy and is rated as strong in the 2006 MAF assessment |
| Sub-Activity/Expected Result - NRCan is provided with comprehensive S&T analysis, policy, strategies and knowledge services | |
| Extent of NRCan's S&T influence (e.g. qualitative and quantitative evidence in policies, programs, practices and knowledge services) | Efforts were aimed at achieving a clearer understanding of NRCan's S&T role in the innovation system, to address barriers that inhibit a strong departmental positioning, and to provide the knowledge and insight to guide departmental investments and actions in the next decade. |
Section II – Analysis of Performance by Program Activity
This section provides a summary of planned and actual spending by program activity along with a summary of key accomplishments.
| PROGRAM ACTIVITY - EARTH SCIENCES - Earth sciences knowledge and tools enable Canadians to achieve economic opportunities, a clean environment, and adapt to a changing climate, in safety and security | |||
|---|---|---|---|
| Sub-Activities: Expected Results & Sub-sub-activities | Dept'l Priority* | Planned Spending | Actual Spending |
| Economic Opportunities: New economic opportunities created for Canadians | |||
| energy and mineral resource development | #1 | 33.5 | 29.5 |
| northern resources and development | other | 10.3 | 8.7 |
| geoscience for oceans management | other | 9.6 | 10.6 |
| supporting property rights on Canada, Aboriginal and Heritage lands | #4 | 16.5 | 18.7 |
| foundations for Canadian geographic information | #4 | 19.3 | 22.8 |
| international capacity-building and trade and investment | other | 2.4 | 2.5 |
| GeoConnections | #4 | 16.4 | 7.3 |
| delineating Canada's Continental Shelf according to UNCLOS | other | 6.7 | 4.7 |
| Polar Continental Shelf Project | #4 | 7.9 | 8.1 |
| Atlas of Canada | other | 3.3 | 0.7 |
| A clean environment: Reduced stress on the environmental ecosystems and human health | |||
| groundwater mapping | other | 3.4 | 4.0 |
| monitoring and assessment | #2 | 8.7 | 9.6 |
| Enhancing resilience to a changing climate: Canadians and their institutions understand and prepare for the effects of a changing climate | |||
| climate change - impacts and adaptation | #3 | 13.6 | 12.6 |
| Public safety and security: Increased safety and security of Canadians | |||
| reducing risks from natural hazards | #3 | 4.8 | 5.8 |
| Canadian Hazard Information Service | #3 | 6.7 | 7.9 |
| Canada/U.S. international boundary maintenance and 1925 treaty implementation | other | 2.9 | 3.6 |
| Geomatics Canada Revolving Fund | other | 0.0 | 0.5 |
| Management and support | other | 35.2 | 28.8 |
| Corporate Management** | other | 29.2 | 52.2 |
| Total | 230.4 | 238.6 | |
| FTEs | 1,637 | 1,448 | |
* In RPP 2006-07, planned spending for these items was presented under Priority #1 (Improve Resource Sector Productivity and Competitiveness); #2 (Advance Resource Efficiency and Conservation); #3 (Ensure the Safety and Security of People and Resources); #4 (Provide Science, Information and Tools for Decision-Making & Support Responsible Development of Canada's North); Other (Other Supporting and Enabling Initiatives/Services).**The apparent increase in corporate management costs reflects a change in reporting of some corporate activities (i.e., shared services, communications and information technology) which were previously included in sector/program sub-activities in the planned spending column. This change was made to improve accountability and transparency associated with reporting of these areas.
Operating Context
NRCan plays a pivotal role in the collection and dissemination of public-good and public-knowledge earth sciences information of major importance to Canada's energy, mining and forestry resources, among others.
Canada is a global leader in natural resource development. However, Canada's mineral and conventional energy reserves are declining, thus threatening the livelihood of many communities and negatively affecting the Canadian economy (natural resources account for 13 percent of GDP and employ close to 1 million people). Public geoscience knowledge is a key factor in stimulating investment to find additional resources and in providing practical experience for the next generation of scientists and technicians.

Some 10 million Canadians rely on groundwater for their drinking water. Yet the majority of Canadian aquifers have not been characterized in detail. Population growth, pollution, changing climate and increased urbanization are putting pressure on this resource. In addition, resource industries are also highly reliant on water, including the oil, gas and the emerging coalbed methane extraction sectors.
Canadians are using geospatial information and tools more than ever, including products such as Google Earth, satellite imagery and commercial global positioning systems (GPS) devices. However, much of this information changes rapidly and is often incomplete, making maintenance and new additions extremely important.
Changes in our climate are having a significant impact on Canadians, including the increased frequency and severity of extreme weather events (heat waves, flood and droughts), thawing of permafrost and the loss of northern ice, to name a few. These impacts poses increasing risks to Canadians health and safety, infrastructure, water and natural ecosystems. However, adaptation to climate change also provides the opportunity to capture potential benefits such as increased productivity from existing crop species as well as the possibility of developing new crop types.
Canadians face a wide range of infrequent natural hazards, including earthquakes, landslides and floods. More people, and the corresponding infrastructure, is affected as the population grows and becomes concentrated in particular areas of the country.
Key Accomplishments
NRCan has increased mineral and energy exploration investment made by the private sector as a result of public geoscience investments. It has done so through the following programs and initiatives.
- A recent survey indicates that National Atlas user satisfaction increased from 63 percent to 86 percent as a result of the integration oforama (digital maps).
- The Earth Observation Data Services ensures that Canadians have reliable and timely access to current and long-term series earth observation data. Data availability ranges from 95 percent to 99 percent, and is available for online access in as little as 30 minutes (raw data) to 2 hours (processed) from the start of reception.
- The Canadian Spatial Reference System GPS correcting services enables sub-metre, real-time geo-referencing with respect to the national reference nearly 100 percent of the time; by 2010, sub-ten centimetre accuracy will be available.
- GeoBase is a national partnership that is providing fundamental geospatial data of choice for Canada. The implementation of GeoBase has lead to increased efficiency and effectiveness through a common geospatial data infrastructure. Since 2005-06, the number of datasets downloaded annually has reached 1.7 M.
- NRCan's Paper to Digital initiative contributes directly to improved access to information and increases the availability of geospatial data (i.e., air photography andographic maps) for decision-support, economic, environmental and public safety decisions.
Under the Targeted Geoscience Initiative 3 (TGI 3), there has been an increase in private sector exploration expenditures in the TGI 3 areas of Flin Flon, Abitibi, Bathurst and the Cordillera which is estimated at $50 million to date. In addition, four more drilling targets have been identified in these areas. Studies of the TGI found that a $1 million investment in geoscience leveraged $5 million in industry exploration and resulted in discoveries worth $125 million in mineral resources.
The Northern Resource Development Program has made significant progress toward an expanded and improved public geoscience knowledge base for the territories and the northern parts of the provinces. The new maps and supporting analytical work have led to significant new land acquisition by exploration companies. In addition, new maps and geochemical analysis of north-western Alberta and north-eastern B.C. have led to new exploration for diamonds and zinc.
As part of work related to the United Nations Convention on the Law of the Sea, the Department conducted surveys to establish outer coastal limits, including bathymetric surveys on the Grand Bank to establish the outer limit of the continental shelf in that area. This work is important in that it helps to confirm the extent of the outer limits, and may increase the size of the limits of Canada's offshore claim.
The National Energy Board and key Canadian energy groups, such as the Petroleum Technology Alliance of Canada, now recognize gas hydrates as a potential component of Canada's future gas supply. The Department is contributing to the progress that has been made towards a better understanding of the physical properties of gas hydrates, leading to the completion of revised estimates of gas hydrate resources in the Mackenzie Delta and Beaufort Sea.
- The results of departmental mineral and energy resource assessments were used as part of a socio-economic study being carried out by Indian and Northern Affairs Canada (INAC) with respect to the Nahanni National Park proposed expansion.
- NRCan provided advice to the federal environmental assessment review of several key projects including Kemess Mine and the Canaport Liquefied Natural Gas terminal.
- Groundwater assessment work in Alberta led to Alberta's recognition of the NRCan National Ground Inventory as a primary source of groundwater information in their provincial framework to protect groundwater.
- The Prince Edward Island Department of Environment, Energy and Forestry is using NRCan nitrate dynamics research results in the province to support better agricultural practices.
- Work done in Oliver Township and region (Okanagan) is leading the town to incorporate mapping and related land-use models developed by NRCan in their local planning process.
Through the Secure Canadian Energy Supply Program, NRCan has been focusing on both conventional and unconventional basin resource assessments, including uranium, energy groundwater and Mackenzie Valley northern energy development. The Department provided input into the Mackenzie Valley pipeline project, including geoscience data in support of overall project design, environmental impact mitigation and land-use decisions. In addition, NRCan provided expert advice in support of a major groundwater survey that was carried out by the Alberta Energy and Utility Board.
As part of work undertaken to meet the Minister's responsibility under the Canada Lands Surveys Act, the Department maintained the standards for surveys, monitored compliance, managed the legal surveys records and provided access to key administrative datasets through GeoGratis, GeoBase and the Canada Lands Surveys Records. This information is widely used by land owners and land administering agencies and departments of the federal, territorial and Aboriginal governments.
NRCan maps and products are being used to support oceans management and policy decisions, such as identifying sensitive marine habitats in the Queen Charlotte Basin, Beaufort Sea and Placentia Bay, and as input to planning in the five Large Ocean Management Areas such as the East Scotian Shelf.
NRCan assessments of environmental hazards provide key data to support reduced stress on environmental ecosystems and human health. The Department's Environment and Health Program included the signing of collaborative agreements with a mining operator in British Columbia (B.C.) to develop environmental models to reduce the risk of exposure to the surrounding ecosystems. In addition, NRCan provided legislated environmental and resources assessments, used in projects such as the licensing phase for the Victor Diamond mine.
The Department's Groundwater Mapping Program identifies, maps and assesses prioritized regional-scale aquifers of Canada to estimate groundwater availability, vulnerability and sustainability. There are thirty key aquifers across Canada of which nine have been mapped and included in the National Groundwater Database.
Through its Environment and Health Program, NRCan is on target to produce a national forest fire facility with a focus on burn area inventory within its Canadian National Wildland Fire Information System by 2009. The Department, working with Health Canada, the Nova Scotia Department of Health Promotion and Protection and the Nova Scotia Department of Energy, undertook risk assessments associated with human exposure to potentially toxic metals associated with historic gold mines in Nova Scotia.
The degree of vulnerability of Canadians to various risks associated with climate change depends not just on the physical impacts, but also on their preparedness and capacity to respond.
In collaboration with Hydro-Quebec and Manitoba Hydro, NRCan is working to assess climate-related trends and variability in water supply using paleoclimatic data. In addition, the Department provided geospatial information and expertise to Agriculture and Agri-food Canada to be used to develop crop yield projections in the prairie provinces. These projections indicate that some crops such as spring wheat, may see significant decreases in yield in the future. The Department also provided new information, along with expert advice, on sea level rise and subsidence in the Fraser Delta to the municipal and regional authorities in support of revised flood risk management plans.
NRCan provides decision-makers with accurate and timely geospatial information which, in turn, provides organizations with the tools to safeguard communities and infrastructure.
For example, the North Atlantic Tsunami Warning System became operational in January 2007 in response to the need to protect Canadians. The system is based largely on the NRCan seismic network.
In addition, NRCan carried out several key geohazard assessments, including: applied earthquake studies in the urban areas of southwest B.C.; tsunami investigation on probable height of tsunami waves in order to develop appropriate preparedness; risk assessment analyses for B.C. Emergency Preparedness; and earthquake studies for the Ottawa and Quebec City areas. The Department also worked closely with the Canadian National Committee for Earthquake Engineering, ensuring uptake of earthquake information by the engineering community and its inclusion in the next version of the Canadian Building Code.
As part of Canada's obligations under the 1925 Treaty, the International Boundary Commission undertook emergency repairs to the Point Roberts range towers. In addition, boundary vista clearing took place along 218 km of border between Quebec/Maine and B.C./Southeast Alaska. All projects were completed on time and budget.
- On December 14, 2006, a coronal mass ejection event from the sun hit the earth sparking a severe geomagnetic storm. Using ground and space-based sensor systems, the Department successfully forecasted this event and alerted power utility operators in enough time that they were able to take mitigative action. As a result, despite the severity of the storm, there was no reported impact on the Canadian power distribution infrastructure.
- To ensure that NRCan meets its mandate of responding effectively to natural and man-made hazards for the safety and security of Canadians, the Department developed 11 civil emergency plans and conducted two exercise plans during 2006-07. This has contributed to the government's overall emergency management capability.
- The Department is taking action on an internal audit of the NRCan Business Continuity Plan (BCP) that finds the need to enhance the governance, business impact analysis and BCP program readiness and testing to better meet program requirements. More details can be found at http://www.nrcan.gc.ca/dmo/aeb/aeb-rpts-e.htm.
| PROGRAM ACTIVITY - ENERGY - Canadians benefit economically, environmentally, and socially from the sustainable production, development and use of Canada's abundant energy resources | |||
|---|---|---|---|
| Sub-Activities: Expected Results & Sub-sub-activities | Dept'l Priority* | Planned Spending** | Actual Spending |
| Energy policy: Domestic and international energy policy analysis, development and advice that supports the sustainable development of Canada's energy sector | |||
| energy policy development and analysis | #1 | 11.8 | 10.8 |
| opportunities envelope | #2 | 41.2 | 29.8 |
| Electricity and renewable energy: Sustainable development and safe and reliable delivery of electricity with a reduced environmental footprint | |||
| electricity resources policy | #1 | 3.8 | 5.4 |
| renewable energy programs | #2 | 49.5 | 32.6 |
| radioactive waste management programs | #2 | 8.7 | 71.9 |
| Petroleum resources: A fair, efficient and competitive oil, natural gas and petroleum products marketplace that is consistent with Canada's social and environmental goals | |||
| petroleum resources policy | #1 | 4.5 | 5.9 |
| CO2 capture and storage | other | 0.4 | 0.1 |
| statutory programs Atlantic | other | 558.7 | 702.9 |
| energy infrastructure protection | #3 | 7.7 | 3.5 |
| Energy efficiency and alternative transportation fuels: Improved energy efficiency of all sectors and increased production and use of alternative transportation fuels in Canada | |||
| housing | #2 | 50.0 | 67.2 |
| buildings | #2 | 47.5 | 37.8 |
| equipment | #2 | 12.9 | 9.0 |
| House-in-Order / government operations | #2 | 3.8 | 1.5 |
| industry | #2 | 7.2 | 5.4 |
| transportation | #2 | 50.5 | 46.2 |
| outreach | #2 | 3.7 | 1.2 |
| Energy S&T: Canadians derive new economic, environmental and social benefits through federal energy S&T | |||
| S&T - built environment | #2 | 18.8 | 23.0 |
| S&T - power generation | #2 | 25.9 | 23.4 |
| S&T - transportation | #2 | 25.0 | 21.8 |
| S&T - oil and gas | #2 | 39.7 | 23.5 |
| S&T - industrial sector | #2 | 24.5 | 21.5 |
| Management and support | other | 8.2 | 4.2 |
| Corporate management*** | other | 26.0 | 46.1 |
| Total | 1,030.1 | 1,194.7 | |
| FTEs | 1,222 | 1,334 | |
* In RPP 2006-07, planned spending for these items was presented under Priority #1 (Improve Resource Sector Productivity and Competitiveness); #2 (Advance Resource Efficiency and Conservation); #3 (Ensure the Safety and Security of People and Resources); #4 (Provide Science, Information and Tools for Decision-Making & Support Responsible Development of Canada's North); Other (Other Supporting and Enabling Initiatives/Services).
** Planned spending excludes $110M for the Newfoundland Fiscal Equalization Offset Payments; and $65M received via the Supplementary Estimates for activities related to the safe decommissioning of shutdown buildings and contaminated lands in order to meet federal regulatory requirements, and for the long-term strategy needed for the disposal of nuclear wastes (Nuclear Legacy Liabilities Program). ***The apparent increase in corporate management costs reflects a change in reporting of some corporate activities (i.e., shared services, communications and information technology) which were previously included in sector/program sub-activities in the planned spending column. This change was made to improve accountability and transparency associated with reporting of these areas.
Operating Context
Canadians enjoy an abundant and diverse supply of energy that is secure and reliable. As a net exporter of energy, Canada contributes to global energy security and diversity. In fact, Canada's energy production and exports are expected to increase over the next several decades.
While increasing international concerns over energy security and rising energy prices have resulted in a massive boom for Canada's energy sector, and our economy, there is also a growing need to address global environmental issues.

Effective regulations to protect the environment and ensure public health and safety are needed while taking into account the socio-economic importance of new energy projects to Canada. There is also a need for increased investment in energy technology, improving energy efficiency and conservation, and strengthening collaboration between governments and industry in these areas.
In the 2006 Speech from the Throne, the Government identified the reduction of air pollution and greenhouse gas (GHG) emissions as one of its priorities. Air pollution affects the health of Canadians and the environment in many ways, while GHG emissions contribute to global climate change.
As the lead federal department on natural resources, NRCan is significantly involved in addressing this priority. Indeed, energy production and consumption are responsible for a large proportion of emissions that affect the quality of air. Transportation, fossil fuel-fired electric power and upstream oil and gas activities produce over 80 percent of domestic emissions of nitrogen oxides, which are key to the formation of ground-level ozone and particulate matter (the main components of urban smog). These same sources also account for 40 percent of Canada's emissions of sulphur oxide, an important precursor to acid rain. Coal-fired electric power alone is responsible for 34 percent of domestic mercury emissions. Energy production and consumption also accounts for over 80 percent of GHG emissions. "Canada's Energy Outlook: The Reference Case 2006" suggests that fossil fuels will remain, under a business-as-usual scenario, the leading source of energy for Canadians for years to come.
The Government of Canada's Clean Air Agenda represents a new approach to reducing GHG emissions and improving air quality which will balance environmental protection while encouraging economic growth.
Key Accomplishments
Energy is a major pillar of the Canadian economy, representing 5.8 percent of our GDP in 2006. Canada's energy exports were $86 billion in 2006, representing approximately 19 percent of its merchandise trade exports. These figures are a strong indication of solid performance in the energy sector and suggest that Canada's energy policy is sound and appropriate. While air emissions from energy have increased with economic growth, progress is being made. For instance, Canada's emissions intensity, expressed as carbon dioxide (CO2) emissions from fuel combustion per unit of GDP, declined by 16 percent between 1990 and 2005.
At the 2006 Council of Energy Ministers' (CEM) meeting held in Whitehorse, federal-provincial and territorial ministers discussed emerging opportunities and challenges facing the Canadian energy sector. To this end, ministers identified three key priorities: regulatory efficiency, energy technology development and innovation, and energy efficiency. They committed to increasing their collaborative efforts in these priority areas.
The Department played a critical role to support the Government in developing and implementing the Clean Air Agenda. The work of the Department led to the announcement, in January 2007, of an investment of $2 billion in a suite of ecoENERGY Initiatives to encourage energy efficiency, increase the production of renewable energy from emerging sources, and reduce the environmental impact of conventional energy sources.
The Department has updated its modeling system on energy and emissions. The modeling system has been used to produce a new long-term projection of Canada's energy demand, supply and related GHG emissions ("Canada's Energy Outlook: The Reference Case 2006"), published in October 2006. The new Energy Outlook informs future policy development related to energy and the environment.
The Opportunities Envelope (OE), an initiative co-led by NRCan and Environment Canada, provided federal financial assistance to GHG mitigation projects and programs proposed by provinces and territories within their respective jurisdictions. Over the course of 2006-07, work continued in negotiating and signing contribution agreements for these initiatives that had previously been approved. In total, 23 contribution agreements were signed with the provincial/territorial proponents, representing a total estimated contribution spending of over $35 million. The funded initiatives are expected to reduce annual GHG emissions by some two megatonnes in 2008 and beyond, which meets program expectations. They should also abate local air pollution as well as lower energy costs for business, households and utilities.
During 2006-07, NRCan continued to play an active role in engaging with other countries on a bilateral and multilateral basis to promote Canadian energy policy approaches - the establishment of fair, transparent, predictable and stable economic, legal and regulatory frameworks - which helped to ensure fair access to foreign markets for Canadian energy companies.
Internationally, we represented Canada in various policy and technical fora to promote energy security and the clean and efficient production and use of energy. These fora include the: International Energy Agency; North American Energy Working Group; Asia-Pacific Economic Cooperation Energy Working Group (APEC EWG) and the U.N. Commission on Sustainable Development. We worked closely with DFAIT on the energy aspects of the G8 and participated in the Gleneagles Dialogue Process.
On the bilateral side, the U.S. remains a key partner. We have continued to work together during the past year to strengthen energy security and reliability and address the environmental impacts of energy production and use through collaboration on energy market and regulatory issues, increasing energy efficiency, and advancing energy S&T. We are also working with Mexico, through the Canada-Mexico Partnership Energy Working Group; and with the Asia Pacific region through the APEC EWG; and also with China through the Canada-China Joint Working Group on Energy Cooperation.
Through the past year, the nexus of energy and climate change has become a paramount issue at many high-level international discussions. NRCan represented Canada's interests on energy, technology, adaptation and forestry at international fora, both within and outside the U.N. processes. Under the U.N., the Department participated in policy development and negotiations at the Conference of the Parties to the Climate Change Convention (COP12) in Nairobi. It is engaged in the development of the architecture for the post-2012 agreement under the Kyoto Protocol. NRCan also led Canada's negotiations for the Experts Group on Technology Transfer and made strategic contributions to our Umbrella Group and European Union allies. We worked within other international bodies including the Organization for Economic Co-operation and Development (OECD) Annex 1 Experts group, the Centre for Clean Air Policy, and the Carbon Sequestration Leadership Forum, particularly relating the G8 request for early opportunities in Carbon Capture and Storage.
The Department explored options to support low-impact renewable electricity sources such as wind, biomass, geothermal, hydro and ocean energy.
- In October 2006, the Minister and U.S. Energy Secretary released the final report of the 2003 power outage task force. The Final Report on the Implementation of Task Force Recommendations denotes that the Canada-U.S. Power System Outage Task Force has fulfilled its mandate, and that the Task Force is being dissolved.
- The index of electricity reliability (IOR) is based on the system average interruption duration index; it calculates the average proportion of time that service is available for a customer. In 2003 (the latest year for which data is available), the IOR was 0.99878. When not including the impacts of the August 14th blackout and Hurricane Juan of 2003, the IOR increases to 0.99941.
- A relative increase in the production of electricity from natural gas and petroleum coke, and a relative decrease in nuclear and hydro, resulted in a 5 percent increase in GHG intensity of energy used to produce electricity from 1990 to 2004, from 31.5 tonnes/TJ to 33.0 tonnes/TJ. However, with a decrease from 36.1 tonnes/TJ in 2003 to 33.0 tonnes/TJ in 2004, the intensity effect is at its lowest level since 1997 because three nuclear reactors in Ontario, which had been shut down since the late 1990s, returned to service in 2003 and 2004, displacing electricity produced from coal and natural gas.
- In 2005, over 1600 PJ of electrical energy was produced from zero to low emission sources, up from about 1550 PJ in 2004. Moreover, in 2005, hydro accounted for 1290.4 PJ of the electrical energy produced (wind 5.6 PJ; nuclear 312.6 PJ; biomass 26.2 PJ).
- Under the initiative to Purchase Electricity from Renewable Resources, the total annual federal purchases are approximately 147 gigawatt hours per year. This includes about 90 gigawatt hours of electricity from emerging renewable energy sources that continue to be generated in Ontario through an agreement with Energy Ottawa, and 57.4 gigawatt hours of electricity from for federal facilities in Alberta, Saskatchewan and Prince Edward Island. While the program's funding expired as of March 31, 2007, the administration of these agreements will continue until the Saskatchewan agreement expires in 2012.
The Wind Power Production Incentive (WPPI) program entered into its final year. In total, 22 wind farms are receiving support under the program, representing 924 megawatts of wind energy capacity and total federal government investment of $314 million. The program had an objective of encouraging 1000 megawatts of new capacity by March 2007. An internal audit of the program found that there are opportunities for improvement with respect to program design, financial management and program administration. Details available at http://www.nrcan.gc.ca/dmo/aeb/aeb-rpts-e.htm.
Under the Renewable Energy Deployment Initiative (REDI), 426 industrial, commercial and institutional solar and biomass heating systems have been installed, and 6 solar domestic air and water heating pilot initiatives have resulted in 368 installed solar heating systems in the residential sector.
The government fully supports nuclear power as part of the Canadian energy mix as a stable source of base load generation with minimal climate change impacts. Over the course of the year, the government moved forward on two important policy issues - its review of the Nuclear Liability Act and its review of options for the long-term management of nuclear fuel waste.
This was the first year of implementation of Canada's long-term strategy to deal with nuclear legacy liabilities at Atomic Energy Canada Limited (AECL) research sites. Significant progress was made. A new waste analysis facility was constructed at Chalk River Laboratories, two shutdown buildings were decontaminated and demolished, and selected buried radioactive wastes were recovered and transferred to secure storage. Decommissioning work also proceeded at the Whiteshell Laboratories near Pinawa, Manitoba. NRCan is responsible for policy direction and oversight, including control of funding, and AECL is responsible for carrying out the work.
The Department made progress on its programs to address the cleanup of radioactive wastes. Canada entered into a Memorandum of Agreement with Saskatchewan to clean up Did you know? Public consultation efforts appear to be building public confidence in nuclear fuel cycle activities. Polling in the Port Hope area indicated that years of discussion and education have yielded steady growth in community awareness and understanding of waste cleanup efforts. Today, 73 percent of local residents are confident in the Government's proposal. Industry has also been active. Over 50,000 Canadians participated in helping the Nuclear Waste Management Organization develop recommendations on the long-term management of nuclear fuel waste for their report to the Minister of NRCan. legacy uranium mine and mill sites in northern Saskatchewan. Canada and Saskatchewan will each contribute $12.3 million to the $31.6 million estimated cost. Canada made a $1.1 million contribution to the project to enable the environmental assessment to be completed, meeting program expectations.
In terms of the cleanup of historic wastes in the Port Hope area of Ontario, a screening report was prepared and released on the cleanup and long-term management of historic wastes in the Municipality of Port Hope. The screening report concluded that the Port Hope Project is not likely to cause significant adverse environmental effects and the project is now moving to the licensing phase. The environmental assessment process of the Port Granby Project was delayed at the request of the Municipality.
As part of the Frontier and Offshore Regulatory Renewal Initiative (FORRI), amendments to the flow testing requirement in the current Drilling Regulations were promulgated. The amendment was a key deliverable of the Atlantic Energy Roundtable. It is expected that the amendment will reduce the cost to operators of drilling an offshore well by $10 million to $30 million, depending on the type of rig, water depth, and reservoir depth. Following consultation with industry, the combined Drilling and Production Regulations were re-drafted to be more goal-oriented. Stakeholder consultations on the new goal-oriented regulations were initiated at the end of the fiscal year. The drafting of new goal-oriented Diving Regulations was also initiated in 2006-07.
NRCan provided technical expertise to the Joint Review Panel for the Mackenzie Gas Project (MGP). In addition, NRCan participated and provided policy and market advice in discussions with the MGP proponents concerning financial support for the project. The Department also established and led an interdepartmental committee for an Alaskan natural gas pipeline. The committee reviewed the design of a regulatory/environmental review process to satisfy the requirements of federal, provincial governments and First Nation.
Moreover, NRCan created the Fuel Focus web site which contains clear, transparent and timely information on fuel prices, oil and gasoline markets, ways to manage energy costs and weekly petroleum product prices for 60 Canadian cities. In addition, the Department created a bi-weekly report providing readers with regular information on the various aspects of the gasoline market in Canada in an effort to raise awareness of the economic drivers influencing petroleum prices.
The Department's programs to improve energy efficiency and increase the production and use of alternative transportation fuels contribute to progress in key trends in Canada's energy use. From 1990 to 2004 (the latest year for which data are available), Canada's energy efficiency improved by an estimated 14 percent. In 2004 alone, these improvements reduced energy use by 902.7 petajoules from what it would have been.
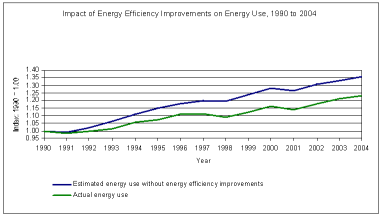
Over 3000 commercial, institutional and multi-unit residential organizations across Canada were members of the Existing Buildings Initiative (EBI) by the end of 2006-07. Projects that received financial incentives under EBI averaged about 20 percent energy savings, meeting program expectations.
For new construction, NRCan validated the design of 254 buildings to an average design performance of 36 percent better than the Model National Energy Code for Buildings, in 2006-07. The number of registered users of NRCan's building design energy simulation/compliance software increased to 6500, an increase of more than 1000, meeting program expectations.
In 2006-07, the EnerGuide for Houses Retrofit Incentive was wound down, with NRCan processing more than 105,000 grants. Carbon dioxide reductions of 902,000 tonnes were achieved over the life of the program, surpassing the target of 800,000 tonnes. With respect to building energy codes, the Canadian Commission on Building and Fire Codes approved a new business plan submitted by the NRCan-supported Buildings Energy Code Collaborative to update the Model National Energy Code for Buildings.
The EEP was developed to support the 2002 Climate Change Plan for Canada target of having 10 percent ethanol in 35 percent of the gasoline supply. This represents approximately 1.4 billion litres of annual ethanol production. Current production capacity of 680 million litres represents 49 percent of this target.
Through its equipment programs, NRCan sets energy efficiency standards and regulations and encourages the purchase of highly efficient products. The Energy Efficiency Regulations cover product groups that consume approximately 80 percent of the energy used in the residential Did you know? Through the Ethanol Expansion Program (EEP), NRCan increased renewable transportation fuel production and use in Canada. In 2006-07, four new ethanol plants that were allocated $51 million under the EEP were completed and started producing fuel ethanol. These four plants added 480 million litres to the Canadian annual ethanol production capacity that was 200 million litres. Four more ethanol plants under the EEP started construction in 2006-07 with a total an annual production capacity of 390 million litres. EEP started construction in 2006-07 with a total annual production capacity of 390 million litres.
The EEP was developed to support the 2002 Climate Change Plan for Canada target of having 10 percent ethanol in 35 percent of the gasoline supply. This represents approximately 1.4 billion litres of annual ethanol production. Current production capacity of 680 million litres represents 49 percent of this target.sector and 50 percent in the commercial and institutional sector. Canada's energy efficiency regulations are among the most stringent in the world. In 2006-07, Amendment 9 to the Energy Efficiency Regulations was finalized. The estimated energy saving impact of this amendment is 1.64 Petajoules by 2010.
An internal audit reveals that the initiative is well-managed in terms of NRCan's responsibility for achieving results and stewardship. A few minor improvements with respect to financial management and project administration in NRCan were identified and have been addressed through a management letter. Details available at http://www.nrcan.gc.ca/dmo/aeb/aeb-rpts-e.htm.
To influence the manufacture and availability of more efficient products, Canada adopted the internationally recognized ENERGY STARR symbol for a number of product categories in the residential, commercial and industrial sectors. Activities related to ENERGY STAR in Canada have led to an increase in awareness and take up of ENERGY STAR qualified products. The unaided awareness level has consistently increased from 13 percent in 2001 to 48 percent in 2006.
The Canadian Industry Program for Energy Conservation (CIPEC) is a unique industry-government partnership that is committed to promoting and encouraging energy efficiency improvements through voluntary action across Canada's industrial sectors (see http://www.oee.nrcan.gc.ca/ industrial/cipec.cfm). In 2006-07, the uptake of tools and services by industrial companies in CIPEC activities exceeded expectations; for example, 1303 people from the industrial sector attended Dollars to $ense workshops in 2006-07, leading to energy and GHG savings of 1.9 PJ and 208 kt. Energy audits conducted at 137 industrial facilities saved 2 PJ of energy and 137 kt of emissions also in 2006-07.
NRCan manages the 2005 voluntary agreement between the Government of Canada and the Canadian automotive industry to reduce GHG emissions from cars and light trucks by 5.3 Mt per year by 2010. The first progress update, prepared by the Joint Government-Industry GHG MOU Committee, was released in June 2006.
NRCan's demonstration of three "Star Trucks" has had an impact on the specification improvements of 66 trucks to date, resulting in GHG reductions of 2,000 tonnes per truck per year. NRCan conducted Fuel Management 101 workshops, and the 5th annual Truck Stop Quiet Zone campaign in which 70 truck stops participated, meeting program expectations.
Of the 400,000 new drivers taking driver education annually, 130,000 are exposed to NRCan's AUTO$MART Driver Education program. Currently, 33 percent of driver instructors in Canada have received driver training kits and/or training. There is a high rate of turnover in this industry; as a result, the target for this program is to ensure that, at all times, 50 percent of driver instructors are informed about energy efficient driving.
Idle free campaigns supported by NRCan have been conducted in communities that represent 32 percent of the Canadian population. Approximately 100 communities have independently launched a campaign and 90 percent will continue with their campaign in 2007-08. Many communities are implementing idling by-laws: 25 communities have already done so and 25 more are in the planning stages. Moreover, Be Tire Smart campaigns have been conducted in several regions with an estimated reach of six million Canadians. Based on surveys, the number of individuals that properly inflate their tires by measuring the tire pressure at least once a month has increased by 25 percent from 2003 to 2007.
NRCan is contributing to Canada's Clean Air Agenda, in part, through the ecoENERGY Technology Initiative, a major component of the energy S&T portfolio. The S&T programs are aimed at finding long-term solutions to reducing and eliminating air pollutants from the production and use of energy by developing and disseminating new knowledge and new technologies through research, development and demonstration (R,D&D) initiatives in clean fossil fuels, clean integrated electricity including clean coal, carbon capture and storage, distributed power generation, next generation nuclear, bio-based energy systems, low emission industrial systems, clean transportation systems, and the built environment, including renewable energy.
NRCan is advancing the secure and clean development of Canada's resources by providing expert scientific, technological and economic knowledge by working in partnership with all levels of government, universities, research institutes, the private sector, and international organizations. Its R,D&D activities advance scientific knowledge in support of policy development and regulatory initiatives, including technological advancement such as the creation of new materials, devices, products, processes, or improvement of existing ones. Later-stage development and demonstration help advance the commercialization and market uptake of the new technologies.
Over the past year, significant progress was made advancing technologies along the innovation curve. Many projects moved from bench-scale research to pilot-scale research, pilot-scale research to demonstration, and demonstration to commercialization (233 basic research projects; 237 applied research projects; 73 pilot plant activities; and 29 demonstration projects).
Technology successes resulted in more efficient and effective use of natural resources and advanced Canada's efforts to develop a cleaner, safer and more sustainable energy system. Advances in technology performance improved deployment prospects and helped increase the use of multiple energy sources for on- and off-grid power generation. Other work led to reductions in the energy intensity of Canada's industrial sectors, while efforts to shepherd innovative technologies from concept to commercialization dramatically reduced the time it takes getting technologies into the marketplace.
Some research led to new energy innovative processes and procedures, while others reduced harmful air emissions, saved money and increased comfort. Other outcomes and partnerships helped increase Canadians' scientific knowledge, strengthened our standing in the international community and increased our exports of innovative technologies (486 and 481 formal collaborations on domestic and international projects, respectively).
Many new codes, standards and regulations were developed, updated, adapted and enacted over the past year: 36 codes were published; 1005 presentations were made by scientists in the programs; 109 MOU and 36 patents were active; 9 patents and 55 licenses were issued. This breaks down barriers to adopting new technologies and advances market penetration, while also leading to a competitive advantage for Canadian industry. The enhanced regulatory environment helped channel and focus private industry creativity, thereby advancing Canadian competitiveness and ensuring better access to world markets.
It is through broad and far reaching strategic research and investments that our healthy and successful energy S&T organization helped Canadians derive new economic, environmental and social benefits. A small sample of the many achievements over the past year include:
- publication of the Canadian Hydrogen Installation Code as a National Standard for Canada;
- development of Canada's first certification program for solar domestic hot water systems, enabling these systems to be installed anywhere in Canada;
- established standards and codes for photovoltaic systems in Canada - past products were approved on a case-by-case basis, but last year, 159 products from 12 manufacturers listed to CSA 107.1-01 and 277 modules from 11 manufacturers listed in ULC-1703;
- instrumental in the ongoing Code Commission updating the Model National Energy Code for Buildings;
- discovered a novel physical process to reduce the viscosity of bitumen - the technology has the potential to monetize low value heavy oil reserves and could see widespread application at small scale production sites in Alberta and Saskatchewan within 10 years;
- sold eighteen licenses worldwide of AnemoScope, a wind mapping software, including Canada and such countries as the United Kingdom, France, Germany, Spain, and South Korea;
- helped develop a more efficient small hydro turbine with reduced operating costs for one of the most commonly used worldwide - its installation in China established the value of Canadian hydro power expertise in a market with more than 50 per cent of the world's small hydro power;
- supported development of the energy efficient Zone Comfort - a forced zone air system giving occupants independent control of the temperature in different parts of their homes;
- installed a 335kW natural gas combined heat and emergency power system at a long-term care facility to replace the oil-fired emergency plant - a critical component of this project was a revision to the CSA 282 code which previously did not allow natural gas to be used in emergency power systems;
- assisted in the development and installation of a new pulp and paper mill biomass waste digester that displaced natural gas, reduced amount of sludge going to landfill and resulted in a number of other Canadian companies to consider this option;
- provided key information on new testing procedures to the design of a commercial bitumen extraction plant;
- provided expertise on global ice loads on offshore structures used in the CSA Offshore Structures Code S471 and incorporated into the International Organization for Standardization TC67/SC7 Arctic Structures Standard; in addition, researchers provided key input leading to a new Emergency Evacuation and Rescue procedure from offshore platforms;
- instrumental in achieving improved efficiency of hydro turbines and generators with energy savings from the project outcomes yielding 1.1 PJ/yr; and with $4 billion in worldwide sales, a cumulative impact of 8 PJ of energy saved and corresponding CO2 emission reduction of 700 ktonnes.
| PROGRAM ACTIVITY - SUSTAINABLE FOREST - Healthy forests continue to provide balanced social, environmental and economic benefits to Canadians | |||
|---|---|---|---|
| Sub-Activities: Expected Results & Sub-sub-activities | Dept'l Priority* | Planned Spending** | Actual Spending |
| Leading change in Canada's forest sector: An integrated national forest sector innovation system that addresses current and emerging issues | |||
| partnership and sector outreach | #2 | 2.8 | 2.7 |
| key sector/horizontal issues | #2 | 1.5 | 1.9 |
| internal governance | other | 3.3 | 6.9 |
| information | other | 6.4 | 2.0 |
| Climate change: Canada's climate change forest reporting obligations are met, and forest-based options for adaptation to, and mitigation of, climate change are developed | |||
| impacts and adaptation of climate change on Canada's forests | #2 | 4.5 | 9.3 |
| meeting Canada's international climate change obligations | #2 | 6.1 | 5.6 |
| International: Canada is a globally-recognized leader of forest sector sustainability | |||
| secure and implement international arrangements and agreements | #1 | 1.1 | 0.8 |
| promote Canada's foreign and domestic policy objectives | other | 0.2 | 1.9 |
| Sustainability of Canada's forests: Forest losses are addressed through the provision of balanced social, economic and environmental information and advice | |||
| assessing Canada's forests | #2 | 10.0 | 9.8 |
| maintaining and enhancing forest sustainability through defining and mitigating threats | #2 | 10.2 | 9.6 |
| growing the limits of forest utilization | #1 | 36.4 | 49.3 |
| Strong communities: Forest-dependent communities have choices and options for economic opportunities | |||
| forest and community development | #4 | 2.0 | 4.2 |
| Aboriginal communities in Canada's forest sector | #4 | 6.3 | 5.9 |
| Competitiveness of Canada's forest products industry: Canada's forest industry competes successfully in the global forest products market | |||
| enhance global competitiveness of Canada's forest products industry | #1 | 1.8 | 2.1 |
| maintain, diversify and expand markets | #1 | 2.5 | 3.8 |
| diversify products, processes and end-uses through innovation | #1 | 17.1 | 16.4 |
| Management and support | other | 27.2 | 22.5 |
| Corporate management*** | other | 13.0 | 23.4 |
| Total | 152.4 | 178.1 | |
| FTEs | 974 | 974 | |
* In RPP 2006-07, planned spending for these items was presented under Priority #1 (Improve Resource Sector Productivity and Competitiveness); #2 (Advance Resource Efficiency and Conservation); #3 (Ensure the Safety and Security of People and Resources); #4 (Provide Science, Information and Tools for Decision-Making & Support Responsible Development of Canada's North); Other (Other Supporting and Enabling Initiatives/Services).
** Planned spending excludes $30M received via the Supplementary Estimates in support of the federal response to the Mountain Pine Beetle infestation in B.C. ***The apparent increase in corporate management costs reflects a change in reporting of some corporate activities (i.e., shared services, communications and information technology) which were previously included in sector/program sub-activities in the planned spending column. This change was made to improve accountability and transparency associated with reporting of these areas.
Operating Context

Canada's forests are our largest and most important biological resource. As one of the pillars of the Canadian economy, the forest sector was built on abundant, high-quality forests, and affordable energy resources. But in today's globalized economy, competitors have access to cheaper wood, faster-growing trees, lower-cost labor, and - in some cases - a lighter regulatory burden. Given the nature of this competitive environment, Canada's forest sector cannot maintain the status quo, waiting for the next up-turn in the business cycle to sustain its leadership.
The forest sector in Canada is passing through a period of structural change, and this has necessitated a shift in thinking. To remain competitive, Canada must capitalize on the skills, innovation, and creativity of our talented people to realize new and expanded value from forests, while setting a global standard for sustainability. The forest industry will drive its own future, but NRCan has not exempted itself from the need to contribute to this transformation by:
- embracing the inevitability of change and resisting the status quo;
- shifting the current thinking from the manufacturing of products to the knowledge economy;
- investing in people, innovation, and market development;
- setting new standards of social and environmental responsibility; and,
- encouraging the sector to become smarter, faster, and more efficient than the global competition.
By taking action in areas where it has a legitimate role, NRCan has been contributing to the forest sector's future success and worldwide competitiveness. This has included promoting and conducting forest R&D, and developing policies that reduce barriers to innovation and facilitate investments. NRCan has created value by promoting a culture of innovation, increasing investments to promote new technologies, and by improving the effectiveness of its R&D expenditures.
Did you know? Investments are being made in major forest initiatives.
- The Federal Response to the Mountain Pine Beetle (MPB) Infestation, which will entail a total of $200 million, including $25.8 million during fiscal 2006-07 in the following areas: controlling the spread ($20 million); recovering economic value ($2.9 million); and protecting forest resources and communities ($2.9 million);
- The Forest Industry Long-Term Competitiveness Strategy (FILCS), which will entail a total of $122.5 million. FILCS consists of: investments in forest innovation; the Canadian Wood Fibre Centre (CWFC); support for the establishment of FPInnovations; the Canada Wood Export Program; the Value to Wood Program; the North American Wood First Program, and support for a National Forest Pest Strategy.
Forest disturbances such as wildland fire, insect infestations, diseases, and extreme weather events have always had a significant impact on Canada's forests. A long-standing objective of NRCan has been to work with partners to develop and implement effective, long-term disturbance mitigation and adaptation strategies that include prevention, suppression, salvage and reforestation. The establishment and use of a national framework to assess indicators of forest sustainability, and the continuous improvement in the understanding of how these indicators of sustainability are affected by the interactions of human activities with natural processes are key elements of this effort to which NRCan has contributed. In working with its partners, NRCan has continued to strive to ensure that the best, most accurate and up-to-date knowledge of Canada's forest ecosystems is both available, and considered in forest management decision making.
Beginning in fiscal 2006-07, NRCan embarked upon a $322.5 million investment program to address key forest sector challenges, including forest industry long-term competitiveness, and forest pest management, in particular to address the current MPB infestation in B.C. This funding is part of the $400 million announced in Budget 2006 to assist the forest industry.
NRCan delivers its forest sector work within the framework of the following six expected results. These activities are interrelated elements of a comprehensive approach for influencing the future success of Canada's forest sector. NRCan has continued to pursue these expected results/activities through coordinated action with other federal departments, provinces and territories, industry players, and non-governmental organizations.
Key Accomplishments
The long-term economic growth of the Canadian forest industry is dependant upon its ability to remain competitive in an increasingly globalized economy. NRCan continues to work closely with public and private sector partners to develop a national approach to forest sector innovation that will allow the sector to become more effective and efficient than the global competition while setting new standards for sustainable forest management (SFM).
In January 2007, Canada's three existing forest products research institutes - Paprican, FERIC, and Forintek - announced their intent to merge, creating one of the world's largest forest sector research organizations. The newly consolidated institute - to be known as FPInnovations - also includes the NRCan-created Canadian Wood Fibre Centre (CWFC), which was launched in April 2006, and which conducts targeted research aimed at increasing value from Canadian forests. Funding from FILCS supported the development of FPInnovations, as well as full implementation of the CWFC.
Following the launch of the CWFC, a design team comprised of representatives from NRCan, the research institutes, industry, the provinces, and academia was created to establish and validate research priorities. Through this work, the design team delivered a draft development plan to articulate the mission, vision, and objectives of the Centre.
In partnership with the Canadian Council of Forest Ministers (CCFM), NRCan initiated work towards a successor to the current National Forest Strategy, which will expire in May 2008. During fiscal 2006-07, NRCan worked with provinces and territories to develop a discussion paper for the new strategy that proposes a vision and principles for SFM in Canada, as well as potential issues to be addressed.
NRCan is committed to developing a science-based approach to assist the forest sector in adapting to, and mitigating the impacts of climate change. The Department works to address forest-related aspects of climate change in partnership with other federal government departments, provincial and territorial governments, industry, academia, and other governmental and non-governmental organizations across Canada and throughout the world.
Throughout 2006-07, extensive work continued on improving the forest sector's ability to understand, predict, and assess changes to ecosystems as a result of climate change. NRCan has taken a leading role in determining possible climate-induced changes to natural forest disturbance regimes, such as fire, insect infestations, and disease.
NRCan assisted Environment Canada in successfully meeting a reporting commitment to the United Nations Framework Convention on Climate Change (UNFCCC) with its forest-sector contribution to the April 2006 National Inventory Report of Greenhouse Gas Sources and Sinks. NRCan also continues to improve information on forest contributions to climate change targets through the development of the National Forest Carbon Monitoring, Accounting, and Reporting System. An integrated science/policy risk analysis was completed around the question of whether to count Canada's managed forest towards Kyoto Protocol targets. Working closely with provinces and territories, the analysis used a sophisticated carbon budget model, and integrated the best science available, to estimate the probability of the managed forest being a sink or a source in the 2008-12 time period. This work resulted in the advice to exclude the managed forest under Kyoto.
It is the objective of NRCan to increase Canada's ability to advance the interests of its domestic forest sector at an international level. It is also the objective of NRCan to contribute to the development and implementation, within Canada, of the highest standards of SFM, and to encourage the acceptance and emulation of equally high standards by other forest countries.
To this end, NRCan has been partnering with the Department of Foreign Affairs and International Trade (DFAIT) and the Canadian International Development Agency (CIDA) in the leadership of an international effort to develop a legally binding instrument for sustainable forest management. To this end, NRCan, DFAIT, and CIDA co-hosted and attended meetings of 20 like-minded countries during 2006-07. NRCan coordinates Canada's input to these processes from domestic forest sector stakeholders such as the CCFM, the Canadian Environmental Network, and the National Aboriginal Forestry Association.
Together with DFAIT, NRCan also pursued preparations for Canada to become a signatory to the latest revision (January 2006) of the International Tropical Timber Agreement which aims to both conserve tropical forests and assist tropical-forest countries to develop economically. Moreover, recognizing the mutual interest of Canada and Russia in sound forest management, both countries signed a Statement of Technical Cooperation for a three-year period, with a view to improve sustainable management of the Russian forest. In 2006-07, significant progress was achieved towards introducing Canadian tools in Russia for fire management and forest carbon monitoring with a view of helping the country achieve its greenhouse gas reduction objectives.
Since the onset of the MPB infestation in B.C., NRCan has been working closely with its provincial counterparts to deliver a comprehensive, integrated strategy to combat the infestation. In 2006-07, the Department completed its work under the current MPB initiative and committed to continue and expand upon its success with the announcement of the new, $200-million Federal Response to the MPB. Along with protecting forest resources and communities, and recovering economic value from beetle-killed trees, these programs are developing measures for controlling the eastern spread of the MPB into Alberta and the boreal forest. More information on these initiatives can be found at http://www.tbs-sct.gc.ca/est-pre/estime.asp and http://mpb.cfs.nrcan.gc.ca.
The threat posed by the MPB demonstrates the impact that forest pests can have on communities, the economy, and the environment. NRCan is working in close collaboration with the CCFM and other federal, provincial, and territorial agencies to integrate forest pest management through the development of a National Forest Pest Strategy (NFPS). In 2006-07, CCFM members approved the NFPS prospectus and established a senior level steering group with representation from NRCan, the Canadian Food Inspection Agency, and the provinces of Alberta, B.C. and Ontario to deliver a draft strategy by September 2007.
Through its partnership with the CCFM and the provinces, NRCan is playing a major role in the implementation of the Canadian Wildland Fire Strategy (CWFS) which consists of developing fire danger rating systems, national fire data archives, public safety information, and enhanced risk assessment capabilities.
NRCan continues to provide S&T knowledge and expertise that supports the sustainable development of the forest sector. With the implementation of Phase III of the Genomics Initiative, NRCan is developing leading edge S&T to predict forest productivity, as well as susceptibility to pests and other natural disturbances. Ecosystem-based forest management practices are leading to improvements in conservation and sustainable management of Canada's forest resources.
Canada's forest-based communities are currently facing difficult challenges as a consequence of forest industry restructuring, changing markets, increased international competition, and major natural disturbances such as wildland fire and the current MPB infestation in Western Canada.
Canada's Model Forest Program (MFP) encourages the development, at the community level, of innovative practices and tools in sustainable forest management. Specific achievements include the support of over 250 research, demonstration and outreach partnership projects across Canada, and the engagement of approximately 500 partners drawn from industry, provincial governments, Aboriginal organizations, environmental and community groups. Fiscal year 2006-07 marked the final full year of operations for the MFP. After 15 years, the program will come to an end in summer 2007. Building on the success of the MFP, work has been finalized on a successor program, the Forest Communities Program (FCP). The new FCP will continue to use a community-based approach to address local challenges, but will shift the focus of activities from sustainable forest management to developing and sharing innovative tools and practices, which advance the sustainability of forest communities.
The First Nations Forestry Program (FNFP) supports projects that build the capacity and technical skills of First Nations to sustainably manage their forest lands and participate in forest development opportunities both on, and off reserve. For example, the program provides ongoing support for the Aboriginal Skills and Employment Partnership forestry initiative in New Brunswick, a five-year initiative that will produce forestry training for over 500 Aboriginal persons and job placements for over 100. Moreover, the FNFP is working with the Whitefeather initiative in Northern Ontario, and the First Nations in the Interlake region of Manitoba to develop regional-scale capacity-building forestry projects, and co-sponsored a major study and workshop in Whitehorse on Aboriginal forestry opportunities in the Yukon. The FNFP is jointly funded by NRCan and Indian and Northern Affairs Canada and delivered in partnership with First Nations.
During 2006-07, approximately 150 capacity-building projects, involving 155 First Nations communities, were funded by the FNFP. The program expended a total of $3.8 million, leveraging additional cash and in-kind contributions from partners for a total project value of $13.7 million.
The South Moresby Forest Replacement Account (SMFRA) was initially established to offset the losses in timber supply and forest-based employment on the Haida Gwaii/Queen Charlotte Islands (QCI) following the creation in 1987 of the South Moresby National Park Reserve (now called the Gwaii Haanas National Park Reserve and Haida Heritage Site). In March 2007, NRCan, Environment Canada and the Province of B.C. transferred $25.46 million ($24.0 million plus $1.46 million in accrued interest) of remaining funds from the SMFRA to the Gwaii Forest Charitable Trust, a locally-managed vehicle for the support of projects that contribute to the long-term sustainability of forest resources and community stability on the QCI. These funds were held in a special account in the B.C. Consolidated Revenue Fund. The transfer effectively terminated the SMFRA.
Over its lifetime, SMFRA made a positive contribution to the QCI economy and its communities, and helped to offset losses in local economic activity resulting from timber supply and employment reductions consequent to the creation of the Park Reserve. The delivery of, and participation in SMFRA evolved over time to better meet local needs and further involve local on-island participation.
Canada's forest industry is facing structural changes that are challenging its ability to compete in its key traditional markets. NRCan's response to these challenges is part of FILCS, including the expansion of both the Canada Wood Export and Value to Wood programs, as well as a new program - North American Wood First - designed to increase wood usage in the region's recreational, commercial and institutional applications. In addition, FILCS supports the development and adaptation of emerging and breakthrough technologies, such as conversion of forest biomass to new products (including fuels, chemicals and materials), biotechnology, and nanotechnology.
As a result of NRCan's efforts under the Canada Wood Export Program, rapid advances are being made in regulatory frameworks that enable wood use in China, Korea, Japan and other key markets. Since inception of the program in 2002, the annual volume of lumber sales in China has tripled to an estimated $90 million in 2007. In the Japan market, the program has helped maintain and grow Canadian dimensional lumber share and has re-positioned coastal B.C. lumber products to develop new opportunities. Sales into Korea have shown solid growth with volumes and sales return doubling over the last four years. Canadian speciality lumber product exports (particularly Western Red Cedar) have experienced a 30 percent increase in volume sales over the past three years in the United Kingdom market.
Detailed performance information for the Canada Wood Export Program can be found at http://www.tbs-sct.gc.ca/est-pre/estime.asp.
| PROGRAM ACTIVITY - MINERALS AND METALS - Canadians derive sustainable social and economic net benefits from the assessment, development and use of mineral expertise, mineral resources, and related industries | |||
|---|---|---|---|
| Sub-Activities: Expected Results & Sub-sub-activities | Dept'l Priority* | Planned Spending | Actual Spending |
| Fiscal and social policy: Investment in Canada's exploration and mining industries is strengthened | |||
| economic and regional analysis | #1 | 1.0 | 1.1 |
| tax and exploration | #1 | 1.0 | 1.2 |
| Aboriginal affairs and sustainable communities | #4 | 0.7 | 0.5 |
| Industry analysis and business development: Market access for mineral and metal commodities (including recyclables) and related industries is promoted and, where necessary, protected; Canada's international prominence and investment in mining are secured | |||
| international liaison and trade relations | #1 | 1.1 | 1.9 |
| industry and commodity market analysis | #1 | 1.1 | 2.1 |
| business development | #1 | 0.6 | 0.0 |
| Minerals and metals S&T: Canadians benefit from R&D with respect to minerals, metals and value-added products | |||
| mining, processing and environmental research | #1 | 15.8 | 14.6 |
| advanced material technology | #2 | 10.1 | 13.9 |
| Explosives safety and security: Safety and security of workers and the public throughout Canada are improved with respect to explosives | |||
| explosives regulations and permitting | #3 | 3.0 | 4.5 |
| explosives science and technology | #3 | 1.9 | 1.9 |
| Minerals and metals programs: Canadians are provided with information to improve decisions regarding minerals and metals; regulatory programs meet Government of Canada objectives | |||
| statistics collection and dissemination | other | 2.7 | 3.2 |
| environmental assessments and regulatory processes | #2 | 0.8 | 1.1 |
| special projects and strategic priorities | other | 0.5 | 0.6 |
| Management and support | other | 4.6 | 4.5 |
| Corporate management** | other | 13.1 | 23.2 |
| Total | 58.0 | 74.3 | |
| FTEs | 623 | 623 | |
* In RPP 2006-07, planned spending for these items was presented under Priority #1 (Improve Resource Sector Productivity and Competitiveness); #2 (Advance Resource Efficiency and Conservation); #3 (Ensure the Safety and Security of People and Resources); #4 (Provide Science, Information and Tools for Decision-Making & Support Responsible Development of Canada's North); Other (Other Supporting and Enabling Initiatives/Services). **The apparent increase in corporate management costs reflects a change in reporting of some corporate activities (i.e., shared services, communications and information technology) which were previously included in sector/program sub-activities in the planned spending column. This change was made to improve accountability and transparency associated with reporting of these areas.
Operating Context
The minerals and metals sector in Canada is an innovative, knowledge-based and widely diversified cluster involving extensive physical and human capital across the country, and connecting communities and regions with the global economy. It is an integral part of the socio-economic fabric of Canada, making major contributions domestically and internationally.
Strong market conditions stimulated by the growth of emerging economies, particularly in Asia, continue to feed a recent boom in the minerals and metals sector. Prices in global markets are near historically high levels. The levels of production, exploration and investment in the Canadian minerals and metals sector reflect this strength.
Production of most commodities increased in value in 2006 for a total of $33.6 billion, a 22.7 percent increase over 2005. Capital investment in the mining and mineral processing industries increased from $7.4 billion in 2005 to $7.5 billion in 2006. Canada's total exploration and deposit appraisal expenditures increased by 32 percent to $1.7 billion. New mine development in Canada was robust, with B.C. showing particular buoyancy. Total expenditure in mine complex development was $4.1 billion in 2006, an increase from $3.8 billion in 2005.
Strong commodity prices have also been accompanied by elevated levels of mergers and acquisitions worldwide and increased competition for access to ores and concentrates. In this regard, 2006 witnessed two of Canada's largest and oldest base-metal producers - Inco and Falconbridge - being absorbed into the operations of major global mining companies. Other mergers and takeovers affected uranium exploration and steel. In 2006, the total of such acquisitions was valued in excess of $40 billion. The scenario was quite different regarding gold as merger and acquisition activity was driven by Canadian companies acquiring other Canadian companies or smaller foreign companies. During 2006, companies like Barrick Gold Corporation (now ranked first worldwide in gold output), Goldcorp Inc. (ranked eighth), Kinross Gold Corporation (ranked eleventh) and IAMGold Corporation (ranked fifteenth) emerged as key players in the gold commodity sector. Companies such as Placer Dome Inc. and Cambior Inc. may no longer exist, but their assets remain under Canadian control.
Mining sectors are challenged to remain globally competitive and achieve strong environmental performance. For example, new mining projects require timely approvals so as to benefit from current market conditions; however, regulations are necessary to mitigate possible adverse effects of such projects. As a result, regulatory efficiency and effectiveness have become a key priority. Internationally, some countries have been very active in developing regulatory regimes to address the environmental and health effects of minerals and metals. While Canada supports their goals, the design of some initiatives has caused concerns over possible barriers to trade and negative effects on Canada and other minerals and metals producers. In this global industry where investment flows, economic efficiency and environmental performance are all interlinked, Canada has to assess international trends in policy and regulation. Canada continues to play a proactive role internationally in building agreement on common approaches, based on sustainable mining practices and technologies, and on robust development models that effectively and efficiently address the economic, environmental and social needs of producer countries and the global community.
Domestic challenges include the emergence of labour shortages, cost pressures associated with declining reserves, more complex or lower ore grades, the need to mine less accessible ores, distances to markets, and regulatory inefficiencies. The Government of Canada is working with the provinces, territories and stakeholders to address some of these issues and assure the future ability of the minerals and metals sector to contribute to Canadian well-being and prosperity.
It is also important to recognize Canada's strengths and areas of opportunity in the minerals and metals sector. Much of Canada's landmass has yet to be fully explored with current technologies. Diamonds have renewed the face of mining in Canada and world-class, base-metal discoveries such as Voisey's Bay are certain to reoccur. The knowledge capital resident in both public and private sectors and Canadian mining skills are respected throughout the world, and Canada is viewed as a safe destination for investment. The close proximity of Aboriginal communities to mining sites and the rapidly growing population of Aboriginal youth could help address the shortage of mine workers. NRCan and other government departments are helping to increase awareness among Aboriginal peoples of the potential for economic and social advancement offered by mineral development. Aboriginal peoples have shown strong interest and participation in developing the capacity to benefit from mineral opportunities. It is also necessary to continue the sector's record of strong performance results and high productivity growth which, building on excellent Canadian talent and technological innovation, has traditionally underpinned Canadian success.
Key Accomplishments

NRCan strives to promote an internationally competitive investment climate for the mineral industry within Canada. Based on 2006 exploration budget data, Canada has excelled in attracting the attention of investors in search of new mineral deposits. With more than 19 percent of the world's total exploration budget, Canada remained the single largest exploration investment recipient in the world.
Within Canada, the Department has contributed to public awareness of exploration tax incentives through information sessions across Canada. Also, it continues to provide leadership to the Intergovernmental Working Group on the Mineral Industry and advice and analysis to the Canadian Mines Ministers, Finance Canada and the Canada Revenue Agency on proposed improvements to Canada's mining taxation regime and its administration.
To attract international investment in Canada's exploration and mining industry, presentations were given at key financial centres in Asia and Europe on the competitive advantages of the fiscal regime in Canada. Foreign direct investment increased dramatically in the last two years, driven by higher commodity prices and the favourable investment climate.
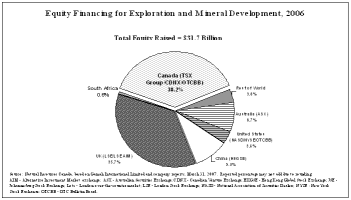
Despite intense competition from the United Kingdom, Canada has maintained its lead position in worldwide exploration and mineral development related equity financing. In 2006, Canadian-based companies raised more than $11 billion through Canadian financial institutions, or just under 40 percent of all equity, worldwide, for mineral exploration and development.
Canadian proven and probable (mineable) reserves of base metals and precious metals have been generally declining for more than twenty-five years. However, sustained high levels of exploration have led to modest improvements in the reserves of most base metals.
As part of the Action Plan of federal, provincial and territorial ministers, approved under their Framework for Action at the 2006 Mines Ministers' Conference, and to respond to a growing demand from Aboriginal communities across Canada, NRCan, in partnership with INAC, provincial governments and exploration and mining associations, held four pilot information sessions on exploration and mining for Aboriginal communities (in northern Ontario, Quebec's North Shore, northern Quebec, and Vancouver, B.C.). These sessions helped to increase community knowledge of mining activities and potential benefits and opportunities offered by participation in mineral projects. NRCan, in partnership with the Prospectors and Developers Association of Canada, the Mining Association of Canada, the Canadian Aboriginal Minerals Association (CAMA) and INAC also released a Mining Information Kit for Aboriginal Communities which promotes understanding by Aboriginal peoples and communities of all aspects of mining development for sound decision making (http://www.nrcan.gc.ca/mms/abor-auto/mine-kit_e.htm).

The information kit attracted strong interest from Indigenous peoples and organizations worldwide (e.g. Philippines, Peru, Ecuador, Australia, Norway, New Caledonia) that have now adopted it. In March 2007, at the invitation of the Commission of Indigenous Peoples of Philippines, NRCan, together with INAC and DFAIT, conducted capacity building workshops in Manila and Davao City which shared Canadian expertise and information on Aboriginal participation in the mining industry and responsible mineral development. Other Canadian participants included CAMA and Nunavik's Makivik Corporation.
In 2006-07, NRCan continued to lead, in partnership with provinces and territories under the umbrella of the Federal-Provincial-Territorial Committee on Mineral Statistics, the collection of a comprehensive and comparable set of statistics on mineral resource development activity from grass-roots exploration to mining projects. This unique set of public statistics was used to produce Map K300A entitled, Exploration, Deposit appraisal and Mine Complex Development Activity - Selection of Most Capital Intensive Projects for 2005. This map was adapted to produce a simplified version that includes Aboriginal communities, a useful tool to demonstrate the importance of the mining sector in Canada.
In 2006-07, NRCan used Canada's position as chair of the Intergovernmental Forum on Mining, Metals and Sustainable Development to increase membership from 33 to 37 countries. New members include Mexico and India, both of which are major producers, while India is also an increasingly important user of minerals and metals. The forum is an effective partnership to enhance the contribution of mining, minerals and metals to sustainable development. Through a substantive work program, the forum aims to develop a consensus and ensure comprehensive input by members to deliberations of the United Nations Commission on Sustainable Development (UNCSD).
NRCan worked with the forum and other bodies (APEC Ministers Responsible for Mining, the Africa Mining Partnership, Mines Ministers of the Americas) on joint work programs to increase the social and economic benefits of minerals and metals, and to address environmental, health and social impacts through improved governance, transparency, accountability, stakeholder participation and capacity building.
NRCan represented Canada in negotiating the Budapest Statement on Mercury, Lead and Cadmium at the Intergovernmental Forum on Chemical Safety (IFCS). The Budapest Statement promotes partnerships and gives priority to measures that address risks to human health and the environment from mercury releases. The IFCS forwarded the Statement to the United Nations Environment Program (UNEP) for consideration and UNEP established an ad hoc working group to review global approaches to deal with mercury releases. This will allow Canadian negotiators to seek global solutions to the long-range transport and deposition of mercury in the Arctic.
Canada also succeeded, based on NRCan's advice, in obtaining agreement in global negotiations at the Strategic Approach to International Chemicals Management's (SAICM) 1st International Conference on Chemicals Management on the value of adopting a risk-based approach towards the regulation of minerals and metals and continued support for existing multilateral and regional agreements. This agreement establishes the operating parameters for the SAICM and avoids duplication at the international level.
Minerals and metals S&T at NRCan consists of two main streams: i) technologies for mining and mineral processing; and ii) the fabrication and processing of metals alloys, metallic composites, and other advanced materials. The benefits include greater economic efficiency and productivity, improved environmental performance, and reduced risk to the health and safety of Canadians. Examples of projects undertaken in 2006-07 include the following:
- a project aimed at using bioleaching for the recovery of metals with the objective of establishing whether this technology could increase recoveries from low-grade Canadian base-metal deposits; if successful, this project could improve the economic viability of these deposits;
- the Diesel Emissions Evaluation Program developed and transferred knowledge of best practices to industry and to health and safety regulators, and led to the development of ceramic filters that significantly reduce emissions of fine particulates into the underground mine environment;
- a project was established to assess the environmental aspects of a proposed new method of tailings disposal at the Iron Ore Company of Canada's Wabush Lake mine in Labrador;
- a field study was initiated to provide a better indication of the maximum percentages of supplementary cementing materials that could be used in concrete exposed to de-icing salts; and
- the assessment of key properties of pipeline materials, including the fracture resistance and mechanical properties of high-strength steel pipe, the weldability of the pipe to ensure sufficient strength, and the corrosion protection afforded by coatings was undertaken.
Did you know?
- Thirty-two projects, which were undertaken in 2006-07, aimed to raise productivity levels in the minerals and metals sector. For example, a project for a major gold producer trained 12 workers in experimental design using statistical techniques with the objective of improving milling operations. Another project developed 3D mine ventilation modelling software that relates factors such as power requirements and fan-operating efficiency, and will be used to minimize ventilation costs through improved design.
- Seventy-two projects were conducted to reduce, control or mitigate the effects of pollutants from the minerals industry were conducted. NRCan provided expert input to Base Metal Smelter Regulations and Metal Mining Effluent Regulations.
- Thirty-nine of 47 research projects undertaken to develop new materials and materials processing technologies for the reduction of greenhouse gas emissions were completed.
- Eighty-four projects aimed at improving the health and safety of mining workers were conducted. NRCan completed the commercial transfer of an anti-vibration handle for rock drills to combat Raynaud's Syndrome (White Hand Disease).
Lightweight materials such as magnesium, aluminum, and ultra-high strength steel are being considered for automotive applications because of their potential to reduce weight, improve fuel efficiency (regardless of the fuel used), and reduce emissions. During 2006-07, NRCan continued to be the Secretariat for the Canadian Lightweight Materials Research Initiative (CLiMRI), a government-academic-industry research network that funds projects on the development of lightweight materials and components for fuel-efficient vehicles. Examples of CLiMRI projects include the following:
- research was conducted on key technological challenges to the use of aluminum in diesel engines that operate at high temperatures and pressures;
- studies examined the casting of components with very thin walls for structural applications- prototype castings showed a weight reduction from 14 kg to 9 kg;
- NRCan co-initiated, with the U.S. Department of Energy (USDOE), an international research program to develop a magnesium-intensive automobile front-end; this project involved partnering with USDOE, the U.S. Automotive Materials Partnership, and China's Ministry of Science and Technology; and
- in another Canada-US joint effort, a redesigned engine cradle resulted in a 35 percent weight reduction in comparison with the aluminum counterpart; and a 78 percent weight reduction when compared with the steel equivalent.
NRCan's Non-Destructive Testing Program (NDT) certifies personnel who apply non-destructive test methods to inspect critical components in engineered structures such as aircraft, nuclear reactors and pipelines. In 2006-07, the Department certified 556 inspectors (an increase of 12 percent from 2005-06) and renewed the certificates of 1,412 inspectors. At the end of March 2007, 4,590 inspectors held 11,500 certificates under the program.
Work continued during 2006-07 on the relocation of the CANMET Materials, Technology Laboratory to McMaster University in Hamilton, Ontario. Budget 2007 provided $6 million for annual operating costs, building on the $40 million for one-time relocation costs which was announced in Budget 2006. Further information on the Government's S&T Strategy can be found at the Industry Canada web site (http://ic.gc.ca).
Explosives, including propellants and pyrotechnics, are vital to the economy of Canada and the well-being of Canadians. Their uses include mining, road construction, the entertainment industry, and the automotive industry (as propellants for air bags). Explosives safety and security continue to be a high priority for Canadians. In 2006-07, there were no significant explosives-related accidents and thefts of explosives were lower than in the previous two years. In the security field, regulations were published in the Canada Gazette related to explosive precursors, and enhanced explosives security programs, including proposed background security checks for explosives possessors, were further developed.
During 2006-07, work continued to protect people and infrastructure from the effects of deliberate or accidental explosions. NRCan provided advice and research on the possible impact of blasts on key infrastructure and buildings, as well as advice on blast mitigation to stakeholders in critical sectors, such as pipelines and the electricity and nuclear industries. NRCan provided further research support to explosives risk management in 2006-07 through its safety-related test work, which included an investigation of the dangers of new firework formulations, a new test to address transportation hazards and an examination of the sensitivity of stored fireworks to bullet impact. Surveys of clients revealed a high level of satisfaction.
During 2006, NRCan collected and collated data from minerals and mining surveys in a timely fashion. Analyses and statistical information were provided to Statistics Canada, provinces and territories, in accordance with the agreed schedule. Comprehensive and accurate information and reports were made available through various channels including web and paper media.
NRCan also fulfilled its statutory obligations with respect to the environmental assessment of mining projects as a responsible authority under the Canadian Environmental Assessment Act (CEAA), northern resource management statutes and the Nunavut Land Claim Agreement. Four environmental assessments were concluded in 2006-07, including the comprehensive study of the Galore Creek project in British Columbia, managed as a pilot project pursuant to the 2005 Cabinet Directive on the implementation of CEAA. NRCan's work in support of regulatory streamlining in 2006-07 included an agreement among federal departments to make the process for determining the scope of projects under the CEAA more timely and efficient. NRCan also worked with the provinces, territories and other federal departments to develop recommendations for the Mines' Ministers on an improved regulatory framework for mining that is consistent, timely, predictable, effective in protecting the environment and coordinated across jurisdictions. These recommendations will be presented to Canada's mines ministers at their September 2007 conference.
The Canadian diamond trade is subject to import and export restrictions limited to the list of participants in the Kimberley Process Certification Scheme. The Export and Import of Rough Diamonds Act (EIRDA) provides the statutory authority for Canada to meet its obligations under the Kimberley Process while minimizing the administrative burden on Canadian diamond industry clients. In the 2006 calendar year, all 271 shipments for export and 320 shipments for import were with Kimberley Process participants, thus ensuring Canada met its obligations.
Operating Context
With respect to our organizational environment, NRCan is experiencing some significant challenges. For example, the Department has to maintain its key physical infrastructure when about 77 percent of its real property - largely in the National Capital Region (NCR) - is more than 35 years old. On the information management and information technology side (IM/IT), challenges in remaining technologically current to meet certain administrative and knowledge management requirements are being addressed through focused management.
NRCan has challenges in attracting and retaining highly qualified personnel. Currently, the annual recruitment rate is 7.9 percent with an annual separation rate of 8.6 percent. It is estimated that one-quarter of the Department's workforce will be eligible to retire by 2011.
1The resources for this program activity are distributed across all other program activities.
Key Accomplishments
Critical to the delivery of programs is its enabling infrastructure: equipment, real property and information technology. During 2006-07, a Long Term Capital Plan was developed and conditionally approved. In the area of real property, the Department invested $2.5 million in recapitalization; this is below the standard benchmark of 4 percent, which would have required NRCan to invest $41.6 million, a shortfall of $39.1 million. Recapitalization remains an ongoing challenge for the Department since the current capital allocation is inadequate to prevent the progressive deterioration of facilities.
To assist mitigating overall real property risks, the Department commenced implementation of a national real property framework to enable investment prioritization. In addition, NRCan has begun the development of a real property rationalization strategy to reduce risk and make best use of the limited funding. NRCan, in partnership with PWGSC, delivered key planning elements toward a Booth Street redevelopment project in the NCR.
In supporting of the government-wide HR renewal priority, NRCan advanced its own HR renewal agenda to form the basis for the departmental HR plan. Other important initiatives include enhancing the EX Performance Management Program and commencing work on HR performance measurement framework. Also, the Department has been successful in meeting the requirement for on-line assessments with 93 percent of all managers fulfilling this requirement.
Internal Audits
- An audit of IM identified three major findings with related recommendations regarding policy, governance and non-compliance.
- An audit of IT security finds that security is satisfactory with respect to outside threats but that the Department would have difficulties meeting the MITSS deadline.
- The Department needs to improve the management and operational practices for recipient audits.
- An audit of security of Cabinet documents finds that management reflects a general security conscious approach.
In supporting of the government-wide HR renewal priority, NRCan advanced its own HR renewal agenda to form the basis for the departmental HR plan. Other important initiatives include enhancing the EX Performance Management Program and commencing work on HR performance measurement framework. Also, the Department has been successful in meeting the requirement for on-line assessments with 93 percent of all managers fulfilling this requirement.
NRCan, as a knowledge-based organization, relies on its IT and IM for success. Fiscal year 2006-07 witnessed several achievements. For instance, NRCan moved towards an enterprise approach to IT and IM planning and investing by completing an IM Strategy Framework and commencing work on an IM Strategy. In addition, the I-Vision, a Strategic Roadmap initiative, was advanced and an IT infrastructure funding model was implemented. Success also depends on having a secure IT environment. Overall, the Department achieved 92 percent compliance with the Management of IT Security Standard (MITSS) and completed assessments of 8 critical business functions. Another achievement is the former sector libraries in the NCR and across Canada amalgamated into the NRCan library in December 2006. This means that the 13 libraries are now under one administration and speak with one voice for the Department.
Significant progress on specific items identified in the Management Accountability Framework (MAF) assessments include:
- completed a budget management framework to improve ability to forecast and manage our budget;
- implemented a new grants and contributions unit and created new procedures for approval;
- implemented a Transfer Payment Review Committee chaired by the Associate DM;
- published the Risk Management Policy and Guidelines;
- commenced work on a new Corporate Risk Profile; and
- begun implementation of the 2006-2011 Employment Equity Action Plan.
In 2006-07, the Department generated savings of $3.3 million through its Shared Services Initiative. These savings were achieved by consolidating selected administrative services, standardizing processes and capitalizing on the buying power of the Department through smarter procurement. For example, savings were realized through a request for volume discount of computer desktops, the rationalization of IT networks and servers, and standing offers for translation services. The shortfall in target savings was due in part to a lack of sufficient HR, operational and technical capacity to implement projects to achieve additional savings.
The 2006 Management Accountability Framework (MAF) assessment confirms that the evaluation function meets the requirements of the TB Evaluation Policy and is rated as "strong" by TBS. The assessment finds that NRCan evaluations have a strong focus on program improvement, performance, relevance and value for money. The assessment also finds that the evaluation function strongly supports expenditure and policy decision-making as evidenced by a deputy-chaired evaluation committee that oversees activities from evaluation planning to the implementation of recommendations and action plans.
Even though the Office of the Comptroller General 2006 MAF-based assessment rated the internal audit function as "acceptable", it was noted that some improvements in planning and reporting are required.
NRCan fleshed out its S&T contribution for natural resources and earth sciences in the context of departmental strategic direction and the evolving federal S&T landscape. These efforts were aimed at achieving a clearer understanding of NRCan's S&T role in the innovation system, to address barriers that inhibit a strong departmental positioning, and to provide the knowledge and insight to guide NRCan's investments and actions in the next decade.
In addition, the Department participated in the Federal Laboratory Infrastructure Project to influence federal strategies, policies, practices that impact on the Department. In consultation with 13 federal science-based departments and agencies, NRCan developed a prototype for a new horizontal information architecture for federal S&T presence on the Internet. A Collections Management Framework was developed to improve efficiencies, horizontal management and planning for future strategic investments for NRCan physical collections. In the same vein, the Department approved the Career Progression Management Framework for Federal Researchers - co-developed by the Government of Canada and the Professional Institute of Public Service - with a view to ensure that all science managers align their research to governmental priorities.
The Department implemented its first web-based S&T Information Management System (STIMS) which is totally aligned to the departmental Program Activity Architecture. The intent is to improve the collection, tracking and reporting of accurate and reliable performance information for sounder decision-making.
Section III – Supplementary Information
Organizational Information
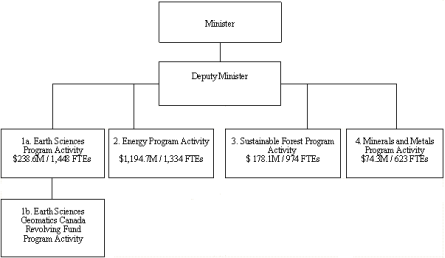
Program Activities - Accountabilities:
-
- Earth Sciences - Assistant Deputy Minister, Earth Sciences Sector
- Earth Sciences - Geomatics Canada Revolving Fund - Assistant Deputy Minister, Earth Sciences Sector
- Energy - Assistant Deputy Minister and Associate Assistant Deputy Minister, Energy Policy Sector; Assistant Deputy Minister, Energy Technology & Programs Sector
- Sustainable Forest - Assistant Deputy Minister, Canadian Forest Service
- Minerals and Metals - Assistant Deputy Minister, Minerals and Metals Sector
1. Comparison of Planned to Actual Spending and Full Time Equivalents
| ($ millions) | 2004-05 Actual |
2005-06 Actual |
2006-07 | |||
|---|---|---|---|---|---|---|
| Main Estimates |
Planned Spending |
Total Authorities |
Actual Spending |
|||
| Earth Sciences* | 228.1 | 224.7 | 230.0 | 230.4 | 256.0 | 238.6 |
| Energy | 848.2 | 1,222.8 | 985.8 | 1,030.1 | 1,225.4 | 1,194.7 |
| Forest | 168.6 | 158.7 | 152.0 | 152.4 | 180.2 | 178.1 |
| Minerals and Metals | 68.0 | 73.8 | 58.3 | 58.0 | 76.5 | 74.3 |
| Sub-total | 1,312.9 | 1,680.0 | 1,426.1 | 1,470.9 | 1,738.1 | 1,685.7 |
| Less: Non-respendable revenue | (218.8) | (564.9) | (549.8) | (549.8) | (468.3) | (468.3) |
| Plus: Cost of services received without charge | 39.1 | 43.0 | 38.2 | 38.2 | 40.1 | 40.1 |
| Net cost of program | 1,133.2 | 1,158.1 | 914.5 | 959.3 | 1,309.9 | 1,257.5 |
| Full Time Equivalents (FTEs) | 4,356 | 4,565 | 4,456 | 4,456 | 4,456 | 4,379 |
* Includes the Earth Sciences - Geomatics Canada Revolving Fund.
2. Use of Resources by Program Activity
| Program Activities | 2006-07 Budgetary ($ millions) | ||||||
|---|---|---|---|---|---|---|---|
| Operating | Capital | Grants | Contri- butions and Other Transfer Payments |
Total: Gross Budgetary Expen- ditures |
Less: Respen- dable Revenue |
Total: Net Budgetary Expen- ditures |
|
| Earth Sciences* | |||||||
| Main Estimates | 238.2 | 1.1 | 0.3 | 7.6 | 247.2 | (17.2) | 230.0 |
| Planned Spending | 237.0 | 1.1 | 0.3 | 9.2 | 247.6 | (17.2) | 230.4 |
| Total Authorities | 264.9 | 1.1 | 0.2 | 7.1 | 273.3 | (17.3) | 256.0 |
| Actual Spending | 243.9 | 0.9 | 0.2 | 7.1 | 252.1 | (13.5) | 238.6 |
| Variance | 21.0 | 0.2 | 0.0 | 0.0 | 21.2 | (3.8) | 17.4 |
| Energy | |||||||
| Main Estimates | 221.8 | 1.0 | 10.5 | 761.3 | 994.6 | (8.8) | 985.8 |
| Planned Spending | 243.8 | 1.0 | 10.5 | 783.6 | 1,038.9 | (8.8) | 1,030.1 |
| Total Authorities | 306.2 | 1.0 | 46.9 | 882.4 | 1,236.5 | (11.1) | 1,225.4 |
| Actual Spending | 290.0 | 0.8 | 46.9 | 866.2 | 1,203.9 | (9.2) | 1,194.7 |
| Variance | 16.2 | 0.2 | 0.0 | 16.2 | 32.6 | (1.9) | 30.7 |
| Forest | |||||||
| Main Estimates | 118.5 | 1.1 | 0.8 | 33.7 | 154.1 | (2.1) | 152.0 |
| Planned Spending | 118.9 | 1.1 | 0.8 | 33.7 | 154.5 | (2.1) | 152.4 |
| Total Authorities | 118.1 | 1.1 | 0.5 | 62.6 | 182.3 | (2.1) | 180.2 |
| Actual Spending | 117.1 | 1.0 | 0.5 | 60.7 | 179.3 | (1.4) | 178.1 |
| Variance | 1.0 | 0.1 | 0.0 | 1.9 | 3.0 | (0.7) | 2.1 |
| Minerals and Metals | |||||||
| Main Estimates | 64.9 | 0.5 | 0.1 | 0.4 | 65.9 | (7.6) | 58.3 |
| Planned Spending | 64.2 | 0.5 | 0.1 | 0.8 | 65.6 | (7.6) | 58.0 |
| Total Authorities | 82.8 | 0.5 | 0.0 | 0.8 | 84.1 | (7.6) | 76.5 |
| Actual Spending | 80.1 | 0.5 | 0.0 | 0.7 | 81.3 | (7.0) | 74.3 |
| Variance | 2.7 | 0.0 | 0.0 | 0.1 | 2.8 | (0.6) | 2.2 |
* Includes the Earth Sciences - Geomatics Canada Revolving fund
3. Voted and Statutory Items
| Vote or Statutory Item | 2006-07 ($ millions) | ||||
|---|---|---|---|---|---|
| Main Estimates | Planned Spending | Total Authorities | Actual Spending | ||
| 1 | Operating expenditures | 551.3 | 571.8 | 662.5 | 640.8 |
| 5 | Capital expenditures | 3.7 | 3.7 | 3.7 | 3.1 |
| 10 | Grants and contributions | 256.1 | 280.4 | 289.5 | 273.8 |
| (S) | Minister of Natural Resources - salary and motor car allowance | 0.1 | 0.1 | 0.1 | 0.1 |
| (S) | Contributions to employee benefit plans | 56.3 | 56.3 | 56.8 | 56.8 |
| (S) | In support of infrastructural costs directly or indirectly relating to the exploration, development, production or transportation of oil and gas in the offshore area of Nova Scotia* | 1.9 | 1.9 | 2.4 | 0.0 |
| (S) | In support of infrastructural costs directly or indirectly relating to the exploration, development, production or transportation of oil and gas in the offshore area of Newfoundland | 0.5 | 0.5 | 0.0 | 0.0 |
| (S) | Contribution to the Canada/Newfoundland Offshore Petroleum Board | 4.2 | 4.2 | 2.0 | 2.0 |
| (S) | Contribution to the Canada/Nova Scotia Offshore Petroleum Board | 2.9 | 2.9 | 2.4 | 2.4 |
| (S) | Payments to the Nova Scotia Offshore Revenue Account | 200.0 | 200.0 | 275.4 | 275.4 |
| (S) | Payments to the Newfoundland Offshore Petroleum Resource Revenue Fund | 349.1 | 349.1 | 313.4 | 313.4 |
| (S) | Earth Sciences-Geomatics Canada Revolving Fund | 0.0 | 0.0 | 11.1 | (0.5) |
| (S) | Newfoundland Fiscal Equalization Offset Payments | 0.0 | 0.0 | 109.8 | 109.8 |
| (S) | Grants in support of Energy Costs Assistance Measures | 0.0 | 0.0 | 7.2 | 7.2 |
| (S) | Refunds of amounts credited to revenues in previous years | 0.0 | 0.0 | 1.3 | 1.3 |
| (S) | Spending of proceeds from the disposal of surplus Crown assets | 0.0 | 0.0 | 0.5 | 0.5 |
| Total NRCan | 1,426.1 | 1,470.9 | 1,738.1 | 1,685.7 | |
* Expenditures deferred to fiscal year 2007-08.
4. Services Received Without Charge
| ($ millions) | 2006-07 |
|---|---|
| Accommodation provided by Public Works and Government Services Canada (PWGSC) | 10.9 |
| Contributions covering employers' share of employees' insurance premiums and expenditures paid by TBS (excluding revolving funds) | 27.5 |
| Worker's compensation coverage provided by Social Development Canada | 0.3 |
| Salary and associated expenditures of legal services provided by Justice Canada | 1.4 |
| Total Services Received without Charge | 40.1 |
5. Loans, Investments, and Advances (Non-budgetary)
| ($ millions) | April 1st 2005 |
April 1st 2006 |
New loans issued |
Payments received |
Outstanding balance March 31st 2007 |
|---|---|---|---|---|---|
| Strategic Outcome - Canadians derive sustainable social and economic benefits from the assessment, development and use of energy, forest and mineral resources, and have the knowledge to mitigate environmental impacts and respond effectively to natural and man-made hazards | |||||
| Loan to Atomic Energy of Canada Lt. for heavy water inventory | 3.5 | 2.5 | 0.0 | 1.5 | 1.0 |
| Loan to facilitate the implementation of the Hibernia Development Project | 36.8 | 27.6 | 0.0 | 18.4 | 9.2 |
| Loan to Nordion International Inc. | 82.0 | 78.0 | 0.0 | 74.0 | 4.0 |
| Investment in the Lower Churchill Development Corporation | 14.8 | 14.7 | 0.0 | 0.0 | 14.7 |
| Investment in Atomic Energy of Canada Ltd. | 164.2 | 164.2 | 0.0 | 164.2 | 0 |
| Total | 301.3 | 287.0 | 0.0 | 258.1 | 28.9 |
6. Source of Respendable and Non-Respendable Revenues by Program Activity (Excludes the Earth Sciences - Geomatics Canada Revolving Fund)
| ($ millions) | Actual 2004-05 |
Actual 2005-06 |
2006-07 | |||
|---|---|---|---|---|---|---|
| Main Estimates |
Planned Revenue |
Total Authorities |
Actual Revenue |
|||
| Respendable Revenue | ||||||
| Earth Sciences* | 19.3 | 19.7 | 17.2 | 17.2 | 17.3 | 13.5 |
| Energy | 7.8 | 7.7 | 8.8 | 8.8 | 11.1 | 9.2 |
| Forest | 2.1 | 1.7 | 2.1 | 2.1 | 2.1 | 1.4 |
| Minerals and Metals | 7.1 | 7.4 | 7.6 | 7.6 | 7.6 | 7.0 |
| Total Respendable Revenue | 36.3 | 36.5 | 35.7 | 35.7 | 38.1 | 31.1 |
| Non-Respendable Revenue | ||||||
| Earth Sciences* | 3.0 | 2.2 | 0.3 | 0.3 | 3.3 | 3.3 |
| Energy | 214.0 | 560.5 | 549.3 | 549.3 | 463.4 | 463.4 |
| Forest | 1.2 | 1.6 | 0.0 | 0.0 | 0.9 | 0.9 |
| Minerals and Metals | 0.6 | 0.6 | 0.2 | 0.2 | 0.7 | 0.7 |
| Total Non-Respendable Revenue | 218.8 | 564.9 | 549.8 | 549.8 | 468.3 | 468.3 |
| Total Respendable and Non-Respendable Revenue | 255.1 | 601.4 | 585.5 | 585.5 | 506.4 | 499.4 |
* Includes Earth Sciences - Geomatics Canada Revolving Fund.
7. Resource Requirements by Program Activity
| ($ millions) | 2006-2007 | |
|---|---|---|
| Planned Spending* | Actual Spending | |
| Earth Sciences | 230.4 | 238.1 |
| Energy | 1030.1 | 1,194.7 |
| Forest | 152.4 | 178.1 |
| Minerals and Metals | 58.0 | 74.3 |
| Earth Sciences - Geomatics Canada Revolving Fund | 0.0 | 0.5 |
| Total | 1,470.9 | 1,685.7 |
* Planned spending excludes: $110M for the Newfoundland Fiscal Equalization Offset Payments; $65M received via the Supplementary Estimates for activities related to the safe decommissioning of shutdown buildings and contaminated lands in order to meet federal regulatory requirements, and for the long-term strategy needed for the disposal of nuclear wastes (Nuclear Legacy Liabilities Program); and $30M received via Supplementary Estimates in support of the federal response to the Mountain Pine Beetle infestation in B.C.
8. Geomatics Canada Revolving Fund
| ($ millions) | Actual 2004-05 |
Actual 2005-06 |
2006-07 | |||
|---|---|---|---|---|---|---|
| Main Estimates | Planned Spending | Total Authorities | Actual Spending | |||
| Respendable revenues | ||||||
| Products | 11.1 | 11.9 | 9.9 | 0.9 | 0.9 | 8.7 |
| Services | 4.2 | 3.7 | 3.1 | 12.2 | 12.2 | 2.0 |
| Consulting | 0.8 | 1.5 | 1.2 | 4.6 | 4.6 | 0.5 |
| Total respendable revenues | 16.1 | 17.1 | 14.2 | 17.7 | 17.7 | 11.2 |
| Operating expenses: | ||||||
| Cost of sales | 3.5 | 3.3 | 2.6 | 3.5 | 3.5 | 2.7 |
| Salaries and employee benefits | 5.5 | 5.3 | 6.5 | 5.9 | 5.9 | 4.4 |
| Depreciation | 0.2 | 0.2 | 0.2 | 0.3 | 0.3 | 0.1 |
| Repairs and Maintenance | 0.6 | 0.5 | 0.4 | 0.7 | 0.7 | 0.3 |
| Administrative and support services | 1.6 | 1.9 | 1.5 | 2.3 | 2.3 | 1.4 |
| Utilities, materials, and supplies | 0.3 | 0.2 | 0.2 | 0.3 | 0.3 | 0.1 |
| Rental | 0.2 | 0.2 | 0.2 | 0.3 | 0.3 | 0.1 |
| Interest | 0.0 | 0.0 | 0.0 | 0.0 | 0.0 | 0.0 |
| Transportation and communication | 0.2 | 0.3 | 0.2 | 0.3 | 0.3 | 0.3 |
| Professional and special service | 2.7 | 3.2 | 2.4 | 3.3 | 3.3 | 1.8 |
| Total operating expenses | 14.8 | 15.1 | 14.2 | 16.9 | 16.9 | 11.2 |
| Operating surplus (deficit) | 1.3 | 2.0 | 0.0 | 0.8 | 0.8 | 0.0 |
| ($ millions) | Actual 2004-05 |
Actual 2005-06 |
2006-07 | |||
|---|---|---|---|---|---|---|
| Main Estimates | Planned Spending | Total Authorities | Actual Spending | |||
| Surplus (deficit) | 1.3 | 2.0 | 0.0 | 0.8 | 0.8 | 0.0 |
| Add non-cash items | ||||||
| Depreciation/ Amortization | 0.3 | 0.2 | 0.2 | 0.3 | 0.3 | 0.1 |
| Change in working capital | (0.6) | 0.3 | (0.4) | (1.1) | (1.1) | (0.2) |
| Other items | 0.0 | 0.1 | 0.2 | 0.2 | 0.2 | 0.0 |
| Investing activities | ||||||
| Capital acquisitions | 0.0 | 0.0 | 0.0 | (0.2) | (0.2) | 0.0 |
| Cash surplus (requirement) | 1.0 | 2.6 | 0.0 | 0.0 | 0.0 | (0.1) |
| ($ millions) | Actual 2004-05 |
Actual 2005-06 |
2006-07 | |||
|---|---|---|---|---|---|---|
| Main Estimates | Planned Spending | Total Authorities | Actual Spending | |||
| Authority | 5.0 | 5.0 | 5.0 | 5.0 | 5.0 | 5.0 |
| Drawdown: | ||||||
| Balance at April 1 | 4.1 | 5.1 | 7.7 | 7.7 | 7.7 | 7.7 |
| Surplus (drawdown) | 1.0 | 2.6 | 0.0 | 0.0 | 0.0 | (0.1) |
| Cash at March 31 | 5.1 | 7.7 | 7.7 | 7.7 | 7.7 | 7.6 |
| Adjustment for charges and credits against the authority after March 31 | (0.2) | (1.6) | (1.6) | (1.6) | (1.6) | (1.0) |
| Balance of authority at March 31 | 8.1 | 11.1 | 11.1 | 11.1 | 11.1 | 11.6 |
Note: columns may not add up due to rounding.
9A. User Fees
The User Fees Act requires departments to annually submit to Parliament a list of all user fees in effect, irrespective of when the fees were established.
| Fee Category | Explosives licence and inspection fees | |||
|---|---|---|---|---|
| Fee Type | Regulatory | |||
| Fee Setting Authority | Explosives Act | |||
| Date Last Modified | 1993 | |||
| Performance Standards | 95% of the time, initial factory applications will be completed within 60 days of receipt of completed documentation; renewals and all other authorizations will be processed within 30 days of a complete request. | |||
| Performance Results | Licensing turnaround times have been acceptable to stakeholders. Results indicate the standards were met or exceeded 95% of the time. | |||
| (thousands of dollars) | 2006-07 | 2007-08 | 2008-09 | 2009-10 |
| Forecast Revenue | 1,200 | 650 | 1,800 | 1,800 |
| Actual Revenue | 597 | n/a | n/a | n/a |
| Estimated Full Cost | 2066 | 3,148 | 3,148 | 3,148 |
| Fee Category | Seismic data | |||
|---|---|---|---|---|
| Fee Type | Optional | |||
| Fee Setting Authority | Resources and Technical Surveys Act | |||
| Date Last Modified | 2004 | |||
| Performance Standards | For provision of accurate location and magnitude of strong earthquakes in Canada, turnaround time is normally within 2 hours during working hours and within 4 hours outside of working hours. Preliminary confirmation is normally available to clients within 15 minutes during normal working hours and on our Web site. For all other requests for standard seismic data, turnaround time is within five working days. Complex requests are negotiated with the client. |
|||
| Performance Results | Service standards are reviewed annually (inquiries are recorded) - results indicate greater than 95% compliance with standards. | |||
| (thousands of dollars) | 2006-07 | 2007-08 | 2008-09 | 2009-10 |
| Forecast Revenue | 14 | 14 | 14 | 14 |
| Actual Revenue | 566 | n/a | n/a | n/a |
| Estimated Full Cost | 634 | 650 | 650 | 650 |
| Fee Category | Map products | |||
|---|---|---|---|---|
| Fee Type | Optional | |||
| Fee Setting Authority | Resources and Technical Surveys Act, Canada Land Surveys Act | |||
| Date Last Modified | 2004 | |||
| Performance Standards | Nationalographic System and Atlas of Canada Maps: NRCan sells maps on a wholesale basis to a limited distribution network, and service standards reflect this. Response time for information requests is two working days. Order processing time: three working days (excluding Saturdays, Sundays and Statutory holidays in the Province of Ontario), upon approved credit and provided account is in good standing. Hours of operation, 08:30 - 16:30 EST. | |||
| Performance Results | The Centre forographic Information of the Mapping Services Branch is certified ISO 9001:2000, hence undergoes regular management review of quality objectives, discrepancy reporting processes, and client consultation. Performance issues are addressed through ISO Quality Objectives which are updated each year to address issues that may arise. Aggregate annual data is available on request. | |||
| (thousands of dollars) | 2006-07 | 2007-08 | 2008-09 | 2009-10 |
| Forecast Revenue | 508 | 0 | 0 | 0 |
| Actual Revenue | 0 | n/a | n/a | n/a |
| Estimated Full Cost | 0 | 0 | 0 | 0 |
| Fee Category | ISO non-destructive testing | |||
|---|---|---|---|---|
| Fee Type | Optional | |||
| Fee Setting Authority | Resources and Technical Surveys Act | |||
| Date Last Modified | 2002 | |||
| Performance Standards |
|
|||
| Performance Results |
|
|||
| (thousands of dollars) | 2006-07 | 2007-08 | 2008-09 | 2009-10 |
| Forecast Revenue | 1,000 | 1,000 | 1,000 | 1,000 |
| Actual Revenue | 1,269 | n/a | n/a | n/a |
| Estimated Full Cost | 1,266 | 1,000 | 1,000 | 1,000 |
| Fee Category | Air Photo Products | |||
|---|---|---|---|---|
| Fee Type | Optional | |||
| Fee Setting Authority | Resources and Technical Surveys Act | |||
| Date Last Modified | 2004 | |||
| Performance Standards | Aerial Photography - Order processing time by the National Air PhotoLibrary is ten working days, priority service five working days; response time for information requests of ten working days 80% of the time; production error rate of 1.5% or less; hours of operation, 08:30 - 16:30 EST. | |||
| Performance Results | Performance issues are addressed through ISO Quality Objectives which are updated each year to address issues that arise. Performance results are monitored continuously. Aggregate annual data is available on request. | |||
| (thousands of dollars) | 2006-07 | 2007-08 | 2008-09 | 2009-10 |
| Forecast Revenue | 162 | 0 | 0 | 0 |
| Actual Revenue | 0 | n/a | n/a | n/a |
| Estimated Full Cost | 0 | 0 | 0 | 0 |
| Fee Category | Fees charged for the processing of access requests filed under the Access to Information Act. | |||
|---|---|---|---|---|
| Fee Type | Regulatory | |||
| Fee Setting Authority | Access to Information Act (ATIA) | |||
| Date Last Modified | 1992 | |||
| Performance Standards | Response provided within 30 days following receipt of request; the response time may be extended pursuant to section 9 of the ATIA. Notice of extension to be sent within 30 days after receipt of request. The ATIA provides fuller details: http://laws.justice.gc.ca/en/A-1/218072.html. | |||
| Performance Results | Met prescribed standards 91.5% of the time. | |||
| (thousands of dollars) | 2006-07 | 2007-08 | 2008-09 | 2009-10 |
| Forecast Revenue | 5 | 5 | 5 | 5 |
| Actual Revenue | 2 | n/a | n/a | n/a |
| Estimated Full Cost | 300 | 300 | 300 | 300 |
| Fee Category | Subscription data | |||
|---|---|---|---|---|
| Fee Type | Optional | |||
| Fee Setting Authority | Resources and Technical Surveys Act | |||
| Date Last Modified | 2004 | |||
| Performance Standards | Nationalographic Data Base (NTDB) - Response time for general information requests is two working days during business hours. Availability of web site is 24/7 90% of the time, monitored monthly. Preparation of a subscription agreement, within 10 working days of receipt. Return agreement signed by both parties within 10 working days after the document and the client's payment (when applicable) are received. Open connections following a subscription within 2 working days after payment of the subscription fees and the agreement signed by the client are received. | |||
| Performance Results | Complaints acknowledged within two working days - and as per ISO procedures, corrective action is taken immediately. Performance results are monitored continuously. Aggregate annual data is available on request. A sample survey of NTDB clients in 2006-2007 indicated that 100% were satisfied with the quality of the products. | |||
| (thousands of dollars) | 2006-07 | 2007-08 | 2008-09 | 2009-10 |
| Forecast Revenue | 540 | 500 | 500 | 500 |
| Actual Revenue | 533 | n/a | n/a | n/a |
| Estimated Full Cost | 640 | 560 | 560 | 560 |
| Fee Category | Other Products | |||
|---|---|---|---|---|
| Fee Type | Optional | |||
| Fee Setting Authority | Resources and Technical Surveys Act | |||
| Date Last Modified | 2004 | |||
| Performance Standards | For aeromagnetic (and gravity data), the Geoscience Data Centre provides maximum 10 day turn-around on external requests for data (average turnaround for a standard request is one day). We also provide on-line access through the Geoscience Data Repository for Geophysical and Geochemical Data (GDRGG). | |||
| Performance Results | Performance is aggregated against standards annually. 99% of requests are in compliance with standards. The number of inquiries has dropped significantly since data has been made available free of charge through the GDRGG. | |||
| (thousands of dollars) | 2006-07 | 2007-08 | 2008-09 | 2009-10 |
| Forecast Revenue | 272 | 300 | 200 | 200 |
| Actual Revenue | 243 | n/a | n/a | n/a |
| Estimated Full Cost | 239 | 295 | 197 | 197 |
| Totals | 2006-07 | 2007-08 | 2008-09 | 2009-10 |
|---|---|---|---|---|
| Forecast Revenue - Regulatory | 1,205 | 1,205 | 1,205 | 1,205 |
| Actual Revenue - Regulatory | 461 | n/a | n/a | n/a |
| Estimated Full Cost - Regulatory | 2,366 | 2,400 | 2,400 | 2,400 |
| Forecast Revenue - Optional | 2,496 | 1,814 | 1,714 | 1,714 |
| Actual Revenue - Optional | 2,611 | n/a | n/a | n/a |
| Estimated Full Cost - Optional | 2,779 | 2,505 | 2,407 | 2,407 |
| Total Forecast Revenue | 3,701 | 3,019 | 2,919 | 2,919 |
| Total Actual Revenue | 3,072 | n/a | n/a | n/a |
| Total Estimated Full Cost | 5,145 | 4,905 | 4,807 | 4,807 |
9B. User Fee - Policy on Service Standards for External Fees
The Policy on Service Standards for External Fees requires departments to report on the status of standards for all external fees charged on a non-contractual basis. Information on service standards for external fees can be found at http://publiservice.tbs-sct.gc.ca/rma/dpr2/06-07/index_e.asp.
10. Response to Parliamentary Committees, Audits and Evaluations
Response to Parliamentary Committees
During 2006-07, the Department did not provide any responses to parliamentary reports.
Response to the Auditor General
- NRCan was one of the key players in the Commissioner of the Environment and Sustainable Development 2006 Annual Report on Climate Change. The main issue was accountabilities between NRCan, Environment Canada (EC) and other departments, and stronger measurement of results for programs. On the whole, the report supported the Climate Change Initiative.
NRCan was mentioned in most chapters, but was heavily involved in Chapter 3: Reducing Greenhouse Gases Emitted During Energy Production and Consumption. All told, NRCan had to respond to eight recommendations, five of which were in Chapter 3. Details can be found at: http://www.oag-bvg.gc.ca/domino/reports.nsf/html/c2006menu_e.html. - In the Auditor General's Sixth Annual Report "Matters of Importance - 2006", NRCan was mentioned in Chapter 12: The Role of Federally Appointed Board Members - Sustainable Development Technologies Canada. The AG recommended that NRCan and EC consult the TBS and Privy Council Office to clarify the necessity for restricting the participation of federal government appointees to the Board of Directors of Sustainable Development Technology Canada in the decision-making process. Discussions have since been initiated.
External Audits
OAG audit on the Market Development Incentive Payments (MDIP) - The audit findings confirmed that NRCan "has complied, in all significant respects, with sections 14 and 15 of the Memorandum of Agreement during the year ended March 31, 2005".
The external auditors (KPMG) of the Geomatics Canada Revolving Fund (GCRF), opined that the financial statements present fairly, in all material respects, the financial position of the GCRF as of March 31, 2007 and the results of its operations and the changes in its financial position for the year then ended in accordance with the accounting principles for revolving funds of the Government of Canada. This is the eleventh consecutive year since the inception of the GCRF that external auditors have issued an unqualified opinion on the financial statements of the Fund.
Internal Audits
- Wind Power Production Incentive Program
- Security of Cabinet Documents
- Information Management at NRCan
- Information Technology (IT) Security
- Commercial Transportation Energy Efficiency and Fuels Initiative
- Recipient Audits
- Audit of the Federal House in Order (FHIO) Initiative
- NRCan Business Continuity Plan Program
- Compliance with the Export and Import of the Rough Diamonds Act (Kimberley Diamond Process)
Internal Evaluations
- Canada's Model Forest Program
- Saskatchewan Forest Centre
- Super-E House Initiative
- One-Tonne Challenge Program
- Energy Infrastructure Protection Division
- Climate Change Impacts and Adaptation Program
- Minerals and Metals Program
- Minerals and Metals Sector: In-House Language Training Program
- Petroleum Technology Research Centre
- Canadian Interagency Forest Fire Centre
More information on these internal audits and evaluations can be found at http://www.nrcan.gc.ca/dmo/aeb/aeb-index-e.htm.
11. Sustainable Development Strategy
NRCan's third Sustainable Development Strategy (SDS), Moving Forward, was tabled in the House of Commons in 2004. The SDS, which covers a three year period ending March 31, 2007, establishes a vision of a sustainable future. Four key results have been incorporated and measured to demonstrate progress towards this vision:
- Canadians make better decisions that advance sustainable development;
- Canadians are taking action to reduce greenhouse gas emissions and adapt to the effects of climate change;
- Canada is globally recognized as a responsible steward of our natural resources and is a world leader in advancing sustainable development internationally; and
- NRCan demonstrates its commitment to sustainable development in its operations.
Progress on each of the commitments, which support the key results in the strategy, is provided by way of a progress report that can be found on NRCan's sustainable development web site at http://www.nrcan.gc.ca/sd-dd/pubs/prog_e.html.
12. Procurement and Contracting
The 2006 Management Accountability Framework (MAF) assessment concluded that NRCan does maintain certain components of a strong procurement and governance framework, including a dedicated contracting unit, continuous training, and a clear system for the tracking and management of audit recommendations to ensure their timely implementation. In addition, the assessment confirms that the Department continues to show growth in acquisition card use, contributes procurement data in a complete and timely manner, and continues to post contracts above the $10,000 threshold as part of the proactive disclosure initiative.
Having said that, the Department obtained a rating of "opportunity for improvement" given that it does not have a contracts review committee in operation for procurement contracts. It is the Department's intention to address this gap during 2007-08.
13. Storage Tanks
The status of NRCan's registered fuel storage tanks, as at March 31, 2007, is indicated in the table below. This information is reported in the DPR as required under Schedule II of the Canadian Environmental Protection Act (CEPA).
| Type of Tank | # Registered | # Compliant | # Non-compliant | # Need Upgrading |
|---|---|---|---|---|
| Aboveground storage tank | 8 | 5 | 3 | 3 |
| Underground storage tank | 4 | 1 | 3 | 3 |
As of March 31, 2007, 2 above ground storage tanks were replaced with new compliant tanks. Assessment for further necessary action and timing for that action was initiated prior to March 31, 2007, with the view to meeting the requirements of the new storage tank regulations once they come into force.
14. Listing of Transfer Payment Programs Exceeding $5 million/year
In 2006-07, NRCan managed the following transfer payment programs in excess of $5 million. Further information on these transfer payment programs can be found at http://www.tbs-sct.gc.ca/est-pre/estime.asp.
- In support of the EnerGuide for Houses Retrofit Initiative
- In support of the Ethanol Expansion Program
- In support of the Energy Efficiency and Alternative Energy programs
- In support of the Technology and Innovation Initiative
- In support of climate change: the Opportunities Envelope
- Forest Research Institutes
- Payments to the Newfoundland Offshore Petroleum Resources Revenue Fund
- Payments to the Nova Scotia Offshore Revenue Account
- Payments for Newfoundland Offshore Equalization
- Wind Power Production Incentive Contribution Program
- Federal Response to the Mountain Pine Beetle Infestation in British Columbia
- Measures to Mitigate the Impact of the Mountain Pine Beetle
- Canada Softwood Lumber - Canada Wood Export Program
- Model Forest Program
15. Foundations (Conditional Grants)
In 2006-07, NRCan contributed to the following foundations (conditional grants). Further information can be found at http://www.tbs-sct.gc.ca/est-pre/estime.asp.
- Sustainable Development Technology Canada
- Green Municipal Fund
16. Horizontal Initiative - Clean Air Agenda
In 2006, the Government of Canada introduced the Clean Air Agenda, a key policy initiative to reduce air pollution and address climate change. The core element of the Government's approach is the Clean Air Regulatory Agenda which will establish mandatory targets for industrial emitters. It will also establish mandatory fuel consumption standards for motor vehicles, and strengthen energy efficiency regulations for consumer and commercial products.
A series of program measures, in support of the regulatory agenda, were subsequently announced in the area of clean energy, clean transport and biofuels.
Air pollution and climate change are complex issues that touch on the various areas of interest of NRCan: energy, earth sciences, forestry, and minerals and metals. As a result, NRCan has been tasked to implement a series of measures under the Clean Air Agenda. Regulations for energy efficiency levels in Canada will be toughened, and the Energy Efficiency Act will be amended. NRCan will work with Environment Canada, who has the lead, on the development of the regulations for industrial air emissions. As well, NRCan will use its science and program expertise to design and implement the suite of program measures in the areas of energy efficiency, renewable energy, and clean energy technologies. Successful implementation of these measures will be ensured through effective intra-departmental coordination.
In addition to NRCan, the Clean Air Agenda touches on issues related to a large number of other departments and agencies. Successful implementation of the agenda will require cooperation and collaboration between partnering departments. NRCan will participate actively in the inter-departmental process being set up to manage and report on the Clean Air Agenda.
Environment Canada is the government lead for the Clean Air Agenda. Supplementary information on this horizontal initiative can be found at: http://www.tbs-sct.gc.ca/rma/eppi-ibdrp/hrdb-rhbd/profil_e.asp.
17. Travel Policies
NRCan follows and uses the Treasury Board Secretariat's travel policies parameters as per instructions included in the Special Travel Authorities and the Travel Directive.
18. Citizen-Centered Service
During 2006-07, NRCan has been planning the implementation of the new Policy on Service for the Government of Canada, which is expected to be approved by the Treasury Board in the fall of 2007. The new policy will require departments to set delivery standards, monitor performance and measure client satisfaction. During 2006-07, NRCan provided input to the Treasury Board Secretariat to shape the new service policy and prepared a strategic plan to implement the policy at NRCan over the next three years.
Annex - Financial Statements
The Department has prepared financial statements in accordance with the Treasury Board Accounting Standard.
- Statements for the Geomatics Canada Revolving Fund have been posted on the following web site: http://www.nrcan.gc.ca/css/fmb/fmb-e.htm1.
- Statements for Natural Resources Canada can be found on the following pages.
1An electronic link to the revolving fund financial statements is sufficient for the DPR given that the statements are included in the Public Accounts which are tabled in Parliament before the DPR.
Natural Resources Canada
Statement of Management Responsibility
Responsibility for the integrity and objectivity of the accompanying financial statements for the year ended March 31, 2007 and all information contained in these statements rests with departmental management. These statements have been prepared by management in accordance with Treasury Board accounting policies which are consistent with Canadian generally accepted accounting principles for the public sector.
Management is responsible for the integrity and objectivity of the information in these financial statements. Some of the information in the financial statements is based on management's best estimates and judgments and gives due consideration to materiality. To fulfill its accounting and reporting responsibilities, management maintains a set of accounts that provides a centralized record of the department's financial transactions. Financial information submitted to the Public Accounts of Canada and included in the department's Departmental Performance Report is consistent with these financial statements.
Management maintains a system of financial management and internal control designed to provide reasonable assurance that financial information is reliable, that assets are safeguarded and that transactions are in accordance with the Financial Administration Act, are executed in accordance with prescribed regulations, within Parliamentary authorities, and are properly recorded to maintain accountability of Government funds. Management also seeks to ensure the objectivity and integrity of data in its financial statements by careful selection, training and development of qualified staff, by organizational arrangements that provide appropriate divisions of responsibility, and by communication programs aimed at ensuring that regulations, policies, standards and managerial authorities are understood throughout the department.
The mandate of the Audit and Evaluation Committee of Natural Resources Canada (NRCan), is to review and provide advice to the Deputy Minister on: NRCan Audit and Evaluation Policies; NRCan Annual Internal Audit and Evaluation Plans, Internal Audit, Evaluation and Special Review Reports, including management responses and commitments to implement remedial action; and the implementation in NRCan of the October, 2005 Treasury Board Policy on Internal Audit.
The financial statements of the department have not been audited.
|
original signed by M. McCuaig-Johnston acting for Cassie J. Doyle
Deputy Minister
Date signed
Ottawa Canada |
original signed by Richard S. Tobin
Senior Financial Officer
Date signed
Ottawa Canada |
| 2007 | 2006 | |
|---|---|---|
| Expenses (Note 4) | ||
| Energy | 1,273,151 | 1,087,505 |
| Earth Sciences | 339,872 | 259,524 |
| Forest | 218,918 | 169,344 |
| Mineral and Metals | 118,442 | 88,636 |
| Total expenses | 1,950,383 | 1,605,009 |
| Revenues (Note 5) | ||
| Energy | $465,050 | $566,722 |
| Earth Sciences | 16,466 | 22,782 |
| Mineral and Metals | 8,142 | 7,990 |
| Forest | 2,493 | 2,777 |
| Total revenues | 492,151 | 600,271 |
| Net cost of operations | 1,458,232 | 1,004,738 |
The accompanying notes form an integral part of these financial statements.
| 2007 | 2006 | |
|---|---|---|
| ASSETS | ||
| Financial assets | ||
| Accounts receivable and advances (Note 6) | 14,985 | 15,036 |
| Loans receivable (Note 7) | 95,555 | 101,536 |
| Investment (Note 8) | 164,159 | 164,159 |
| Total financial assets | 274,699 | 280,731 |
| Non-financial assets | ||
| Prepayments (Note 9) | 8,671 | 12,479 |
| Inventories | 10,978 | 13,151 |
| Tangible capital assets (Note 10) | 81,367 | 87,203 |
| Total non-financial assets | 101,016 | 112,833 |
| Total assets | 375,715 | 393,564 |
| LIABILITIES | ||
| Accounts payable and accrued liabilities | 431,097 | $358,365 |
| Vacation pay and compensatory leave | 25,818 | 26,184 |
| Employee severance benefits (Note 11) | 64,858 | 64,894 |
| Environmental liabilities (Note 14) | 387,793 | 192,148 |
| Capital lease obligations | 0 | |
| Other liabilities (Note 12) | 32,426 | 26,969 |
| Total liabilities | 941,992 | 668,560 |
| Equity of Canada | (566,277) | (274,996) |
| Total | 375,715 | 393,564 |
| Contractual Obligations (Note 15) | ||
The accompanying notes form an integral part of these financial statements.
| 2007 | 2006 | |
|---|---|---|
| Equity of Canada, beginning of year | (274,996) | (397,672) |
| Net cost of operations | (1,458,232) | (1,004,738) |
| Current year appropriations used (Note 3) | 1,685,732 | 1,680,002 |
| Revenue not available for spending | (451,906) | (554,869) |
| Change in net position in the Consolidated Revenue Fund (Note 3) | (106,931) | (40,724) |
| Services received without charge from other government departments (Note 16) | 40,054 | 43,005 |
| Equity of Canada, end of year | (566,277) | (274,996) |
The accompanying notes form an integral part of these financial statements.
| 2007 | 2006 | |
|---|---|---|
| Operating activities | ||
| Net cost of operations | 1,458,232 | 1,004,738 |
| Non-cash items: | ||
| Amortization of tangible capital assets | (15,465) | (17,728) |
| Gain (loss) on disposal of tangible capital assets | (62) | (19) |
| Services provided without charge | (40,054) | (43,005) |
| Adjustment to tangible capital assets | 334 | |
| Variations in Statement of financial position | ||
| Decrease (increase) in liabilities | (273,433) | 139,171 |
| Increase (decrease) in assets other than tangible capital assets | (12,014) | (11,194) |
| Cash used by operating activities | 1,117,204 | 1,072,297 |
| Capital investment activities | ||
| Acquisitions of tangible capital assets | 9,995 | 12,367 |
| Proceeds from disposal of tangible capital assets | (304) | (255) |
| Cash used by capital investment activities | 9,691 | 12,112 |
| Financing activities | ||
| Net cash provided by Government of Canada | (1,126,895) | (1,084,409) |
The accompanying notes form an integral part of these financial statements.
Natural Resources Canada
Notes to the Financial Statements (unaudited)
For the year ended March 31, 2007
1. Authority and Objectives
The Department of Natural Resources Canada (NRCan) was created on June 25, 1993 by the merger of the Department of Energy, Mines and Resources and the Department of Forestry. This organizational change was effected by Order in Council, pending the passage of legislation which occurred in 1994. The Department's mandate is primarily based on the Department of Natural Resources Act, the Resources and Technical Surveys Act and the Forestry Act.
NRCan's mandate is to ensure the sustainable development and responsible use of Canada's natural resources. Through innovation and partnership, the department plays a pivotal role in helping shape the enormous contributions of the natural resource sectors and related industries to the high quality of life of Canadians. NRCan fulfills its mandate through four main programs:
- The Energy Sectors connect Canadians with the latest information about smarter energy use, sources of energy and energy policy.
- The Earth Sciences Sector provides expertise to access, understand, and use Earth science information to deal with economic, environmental, and social changes. The sector collects studies and shares in disciplines such as geology, geomatics and paleontology to promote the sustainable use of Canada's natural resources.
- The Canadian Forest Service promotes the development of Canada's forests and the competitiveness of the Canadian forest sector, helping Canadians make sound decisions on the stewardship of our forests.
- The Minerals and Metals Sector is the federal government's primary source of scientific and technological knowledge and policy advice on Canada's mineral and metal resources and on explosives regulation and technology. The sector engages in innovative research and technology on Canada's mineral and metal resources, promoting their responsible development and use.
This mandate is delivered by the Department's 4,456 full time employees located in offices across Canada.
2. Summary of Significant Accounting Policies
The financial statements have been prepared in accordance with Treasury Board accounting policies which are consistent with Canadian generally accepted accounting principles for the public sector.
Significant accounting policies are as follows:
- Parliamentary Appropriations - NRCan is financed by the Government of Canada through Parliamentary appropriations. Appropriations provided to NRCan do not parallel financial reporting according to generally accepted accounting principles since appropriations are primarily based on cash flow requirements. Consequently, items recognized in the statement of operations and the statements of financial position are not necessarily the same as those provided through appropriations from Parliament. The Note 3 provides a high-level reconciliation between the bases of reporting.
- Consolidation - these financial statements include the accounts of the following sub-entity of NRCan: the Geomatics Canada Revolving Fund. The accounts of the Geomatics Canada Revolving Fund have been consolidated with those of NRCan. NRCan also records an investment in Atomic Energy of Canada Limited (AECL) that is recorded at cost. The results of AECL are not consolidated in these financial statements due to the fact that NRCan is not deemed to control the Crown Corporation.
- Net Cash Provided by Government - NRCan operates within the Consolidated Revenue Fund (CRF), which is administered by the Receiver General for Canada. All cash received by NRCan is deposited to the CRF and all cash disbursements made by NRCan are paid from the CRF. The net cash provided by Government is the difference between all cash receipts and all cash disbursements including transactions with other departments of the federal Government made by NRCan during the year.
- Change in net position in the Consolidated Revenue Fund is the difference between the net cash provided by Government and appropriations used in a year, excluding the amount of non respendable revenue recorded by NRCan. It results from timing differences between when a transaction affects appropriations and when it is processed through the CRF.
- Revenues:
- Revenues from regulatory fees are recognized in the accounts based on the services provided in the year.
- Other revenues are accounted for in the period in which the underlying transaction or event occurred that gave rise to the revenues.
- Return on investment in Crown Corporation is recognized in the period in which the income is received.
- Expenses - Expenses are recorded on the accrual basis:
- Grants are recognized in the year in which the conditions for payment are met. In the case of grants which do not form part of an existing program, the expense is recognized when the Government announces a decision to make a non-recurring transfer, provided the enabling legislation or authorization for payment receives parliamentary approval prior to the completion of the financial statements;
- Contributions are recognized in the year in which the recipient has met the eligibility criteria or fulfilled the terms of a contractual transfer agreement;
- Vacation pay and compensatory leave are expensed as the benefits accrue to employees under their respective terms of employment; and
- Services provided without charge by other government departments for accommodation, the employer's contribution to the health and dental insurance plans, workers compensation, and legal services are recorded as operating expenses at their estimated cost.
- Employee future benefits
- Pension benefits: Eligible employees participate in the Public Service Pension Plan, a multiemployer plan administered by the government of Canada. NRCan's contributions to the Plan are charged to expenses in the year incurred and represent the total departmental obligation to the Plan. Current legislation does not require the department to make contributions for any actuarial deficiencies to the Plan.
- Severance benefits: Employees are entitled to severance benefits under labour contracts or conditions of employment. These benefits are accrued as employees render the services necessary to earn them. The obligation relating to the benefits earned by employees is calculated using information derived from the results of the actuarially determined liability employee severance benefits for the Government as a whole.
- Accounts receivables are stated at amounts expected to be ultimately realized; a provision is made for receivables where recovery is considered uncertain.
- Loans with significant concessionary terms are recorded on the Statement of Financial Position at their estimated net present value. A portion of this unamortized discount is brought into income each year to reflect the change in the present value of the loan outstanding. An estimated allowance for uncollectibility is recorded where appropriate.
- Repayable contributions are contributions where the recipient is expected to repay the amount advanced. Depending on their nature, they are classified as either unconditionally repayable or conditionally repayable and are accounted for differently.
- Unconditionally repayable contributions are contributions that must be repaid without qualification. Normally, these contributions are provided with a low or no interest clause. They are in substance loans with significant concessionary terms and accounted for as such. They are recorded on the statement of financial position as loans at their estimated present value. A portion of this unamortized discount is brought into income each year to reflect the change in the present value of the contributions outstanding. An estimated allowance for un-collectibility is also recorded where appropriate.
- Conditionally repayable contributions are contributions that, all or part of which become repayable, if conditions specified in the contribution agreement come into effect. Accordingly, they are not recorded on the Statement of Financial Position until such time as the conditions specified in the agreement are satisfied at which time they are then recorded as a receivable and a reduction in transfer payment expenses. An estimated allowance for un-collectibility is recorded where appropriate.
- Contingent liabilities - Contingent liabilities are potential liabilities which may become actual liabilities when one or more future events occur or fail to occur. To the extent that the future event is likely to occur or fail to occur, and a reasonable estimate of the loss can be made, an estimated liability is accrued and an expense recorded. If the likelihood is not determinable or an amount cannot be reasonably estimated, the contingency is disclosed in the notes to the financial statements.
- Environmental liabilities - Environmental liabilities reflect the estimated costs related to the management and remediation of environmentally contaminated sites. Based on management's best estimates, a liability is accrued and an expense recorded when the contamination occurs or when the department becomes aware of the contamination and is obligated, or likely to be obligated to incur such costs. If the likelihood of NRCan's obligation to incur these costs is not determinable, or if an amount cannot be reasonably estimated, the costs are disclosed as contingent liabilities in the notes of the financial statements.
- Inventories - Inventories consist of parts, material and supplies held for future program delivery and not intended for re-sale. They are valued at cost. If they no longer have service potential, they are valued at the lower of cost or net realizable value.
- Foreign currency transactions - Transactions involving foreign currencies are translated into Canadian dollar equivalents using rates of exchange in effect at the time of those transactions. Monetary assets and liabilities denominated in a foreign currency are translated into Canadian dollars using the rate of exchange in effect on March 31. Gains and losses resulting from foreign currency transactions are included in the statement of operations.
- Tangible capital assets - All tangible capital assets and leasehold improvements having an initial cost of $10,000.00 or more ($1,000.00 or more for the Revolving Fund) are recorded at their acquisition cost. The department does not capitalize intangibles, works of art and historical treasures that have cultural, aesthetic or historical value, assets located on
Indian Reserves and museum collections.
Amortization of capital assets is done on a straight-line basis over the estimated useful life of the capital asset as follows:
Asset Class Amortization period Buildings 15 to 40 years Machinery and equipment 1 to 25 year Vehicles 3 to 20 years
- Measurement uncertainty - The preparation of financial statements in accordance with Treasury Board accounting policies which are consistent with Canadian generally accepted accounting principles for the public sector requires management to make estimates and assumptions that affect the reported amounts of assets, liabilities, revenues and expenses reported in the financial statements. At the time of preparation of these statements, management believes the estimates and assumptions to be reasonable. The most significant items where estimates are used are contingent liabilities, environmental liabilities, the liability for employee severance benefits and the useful life of tangible capital assets. Actual results could significantly differ from those estimated. Management's estimates are reviewed periodically and, as adjustments become necessary, they are recorded in the financial statements in the year they become known.
3. Parliamentary Appropriations
The department receives most of its funding through annual Parliamentary appropriations. Items recognized in the statement of operations and the statement of financial position in one year may be funded through Parliamentary appropriations in prior, current or future years. Accordingly, the Department has different net results of operations for the year on a government funding basis than on an accrual accounting basis. The differences are reconciled in the following tables:
| 2007 | 2006 | |
|---|---|---|
| (in thousands of dollars) | ||
| Net cost of operations | 1,458,232 | 1,004,738 |
| Adjustments for items affecting net cost of operations but not affecting Appropriations: | ||
| Add (Less): | ||
| NRCan's appropriations | ||
| Service provided without charge | (40,054) | (43,005) |
| Amortization of tangible capital assets | (15,465) | (17,728) |
| Amortization of unamortized discount loans | 8,219 | 6,330 |
| Payments to Department of Justice | (1,319) | (1,612) |
| Revenue not available for spending | 451,906 | 554,869 |
| Vacation Pay and Compensatory Leave | 365 | (1,237) |
| Adjustments of previous years Inventory | (2,174) | (1,982) |
| Adjustments of previous years Accounts Payable | 4,130 | 7,017 |
| Refunds of prior years expenditures | 11,927 | 2,880 |
| Allowance for Environmental Liabilities | (195,645) | 8,534 |
| Refunds of Program Expenditures | 9,266 | - |
| Employee severance benefits | 36 | (6,405) |
| Other adjustments | (57) | 143 |
| 231,135 | 507,804 | |
| Adjustments for items not affecting net cost of operations but affecting Appropriations | ||
| Add: | ||
| Receivables, Advances, and Prepayments | 1,464 | 5,093 |
| Acquisitions of tangible capital assets | 126 | 12,367 |
| Reductions from prepaid expenses | (5,225) | - |
| Expenses to Federation of Canadian Municipalities | - | 150,000 |
| (3,635) | 167,460 | |
| Current year appropriations used | 1,685,732 | 1,680,002 |
| Appropriations Provided | ||
|---|---|---|
| 2007 | 2006 | |
| (in thousands of dollars) | ||
| Vote 1 - Operating expenditures | 662,547 | 617,108 |
| Vote 5 - Capital expenditures | 3,711 | 7,701 |
| Vote 10 - Transfer payments | 289,501 | 297,989 |
| Statutory amounts | 782,340 | 885,543 |
| Less: | ||
| Appropriations available for future years | (14,305) | (13,698) |
| Lapsed appropriations - Operating | (21,786) | (25,524) |
| Lapsed appropriations - Capital | (562) | (2,003) |
| Lapsed appropriations - Transfer payment | (15,714) | (87,114) |
| Current year appropriations used | 1,685,732 | 1,680,002 |
| 2007 | 2006 | |
|---|---|---|
| (in thousands of dollars) | ||
| Net cash provided by Government | 1,126,895 | 1,084,409 |
| Revenue not available for spending | 451,906 | 554,869 |
| Change in net position in the Consolidated Revenue Fund | ||
| Variation in accounts receivable and advances | 51 | 7,546 |
| Variation in accounts payable and accrued liabilities | 72,732 | (141,092) |
| Other adjustments | 34,148 | 174,270 |
| 106,931 | 40,724 | |
| Current year appropriations used | 1,685,732 | 1,680,002 |
4. Expenses
The following table presents details of expenses by category:
| 2007 | 2006 | |
|---|---|---|
| (in thousands of dollars) | ||
| Transfer payments | ||
| Other level of government | 732,945 | 650,238 |
| Industry | 135,060 | 120,981 |
| Non-profit organizations | 61,141 | 67,297 |
| Individuals | 46,259 | 22,038 |
| Other countries and international organizations | 1,293 | 916 |
| Total transfer payments | 976,698 | 861,470 |
| Operating expenses | ||
| Salary and employee benefits | 432,901 | 441,807 |
| Professional and special services | 198,765 | 133,682 |
| Allowance for environmental liabilities | 195,645 | 8,534 |
| Transportation and communication | 35,269 | 38,945 |
| Utilities, materials and supplies | 23,817 | 23,378 |
| Rentals | 22,536 | 25,709 |
| Acquisition of machine and equipment | 21,437 | 27,574 |
| Amortization | 15,465 | 17,728 |
| Information | 8,476 | 17,201 |
| Repairs and maintenance | 7,828 | 8,685 |
| Environmental studies research | 2,538 | 2,510 |
| Acquisition of land, building and work | 1,092 | 2,955 |
| Other | 7,916 | (5,169) |
| Total operating expenses | 973,685 | 743,539 |
| Total Expenses | 1,950,383 | 1,605,009 |
5. Revenues
The following table presents details of revenues by category:
| 2007 | 2006 | |
|---|---|---|
| (in thousands of dollars) | ||
| Sales of goods and services - external parties: | ||
| Rights and privileges | 396,052 | 453,375 |
| Services of non-regulatory nature | 22,120 | 26,430 |
| Sales of goods and information products | 5,646 | 8,685 |
| Services of regulatory nature | 1,312 | 957 |
| Lease and use of public property | 324 | 684 |
| Other fees and charges | 182 | 1,272 |
| Interest | 47,764 | 37,441 |
| Amortization of discount loans | 8,219 | 6,330 |
| Fines | 7,870 | 62,383 |
| Environmental Research Fund | 2,468 | 2,500 |
| Return on investment - Other enterprise crown corporation | 76 | 94 |
| Gains on disposal of tangible capital assets | 44 | 98 |
| Other | 74 | 22 |
| Total | 492,151 | 600,271 |
6. Accounts Receivable and Advances
The following presents details of accounts receivable and advances:
| 2007 | 2006 | |
|---|---|---|
| (in thousands of dollars) | ||
| Receivables from other federal government departments and agencies | 9,240 | 5,775 |
| Receivables from external parties | 6,832 | 10,392 |
| Less: Allowance for doubtful accounts on external receivables | (1,300) | (1,345) |
| 5,532 | 9,047 | |
| Employee advances | 213 | 214 |
| Total | 14,985 | 15,036 |
7. Loans Receivable
| 2007 | 2006 | |
|---|---|---|
| (in thousands of dollars) | ||
| Loan to Hibernia Interest Assistance | 39,978 | 39,978 |
| Unamortized discount | (3,247) | (4,871) |
| Allowance for uncollectibility | (999) | (999) |
| Loan balance - Hibernia Interest | 35,732 | 34,108 |
| Loan to Nordion International Inc. | 74,000 | 78,000 |
| Unamortized discounts | (30,000) | (33,333) |
| Loan balance - Nordion | 44,000 | 44,667 |
| Loan to Hibernia Development Project | 18,400 | 27,600 |
| Unamortized discounts | (4,077) | (7,339) |
| Loan balance - Hibernia | 14,323 | 20,261 |
| Loan to Atomic Energy of Canada Limited | 1,500 | 2,500 |
| Total | 95,555 | 101,536 |
Hibernia Interest Assistance Loan
Unconditional repayable contribution; interest free; first instalments paid on March 31, 2001. Repayment starts eight years from the first annual instalment; the first repayment date is March 1, 2009. Balance outstanding as of March 31, 2007 is $39,978,000. The estimated present value is $35,732,000 as at March 31, 2007.
Nordion International Inc. (loan)
Interest Free Loan Agreement; to be repaid over 30 semi-annual payments commencing October 1, 2000; fully secured by a financial instrument in Canada's name which guarantees that the loan will be repaid. Balance remaining as of March 31, 2007 is $74,000,000. Due to the concessionary terms of this loan, the estimated present value is $44,000,000 as at March 31, 2007.
Hibernia Development Project (loan)
Interest Free Loan Agreements; repayment in 10 consecutive equal annual instalments commencing June 30, 1999. Currently outstanding is Murphy Atlantic Offshore Oil Co. Ltd. $10,400,000 (estimated present value $8,100,000) and Mobile Canada Hibernia Co. Ltd $8,000,000 (estimated present value $6,200,000).
Loan to Atomic Energy of Canada (AECL)
Interest bearing loan at an average floating rate of 4.2570% (2006-2007); maturing September 2008. NRCan invoices AECL twice per year (May & November). As of March 31, 2007, balance for Heavy Water Inventory loan amounted to $1,500,000.
8. Investment
Investment in Atomic Energy Canada Limited (AECL)
NRCan has purchased common shares of Atomic Energy of Canada Limited, a Crown Corporation, for a total value of $164,159,000.
9. Prepayments
| 2007 | 2006 | |
|---|---|---|
| (in thousands of dollars) | ||
| Prepaid transfer payments | 5,821 | 12,143 |
| Prepaid expenses | 2,850 | 336 |
| Total | 8,671 | 12,479 |
10. Tangible Capital Assets
(in thousands of dollars)
| Cost | Accumulated amortization | 2007 | 2006 | |||||||
|---|---|---|---|---|---|---|---|---|---|---|
| Capital asset class | Opening balance | Acqui- sitions |
Dispo- sals and write-offs |
Closing balance | Opening balance | Amorti- zation |
Dispo- sals and write-offs |
Closing balance | Net book value | Net book value |
| Land | 7,905 | 7,905 | 0 | 7,905 | 7,905 | |||||
| Buildings | 141,782 | 141,782 | 102,819 | 5,684 | 108,503 | 33,279 | 38,963 | |||
| Machinery and equipment | 215,846 | 8,920 | 3,043 | 221,723 | 180,309 | 8,606 | 3,010 | 185,905 | 35,818 | 35,537 |
| Vehicles | 12,807 | 1,075 | 1,517 | 12,365 | 8,009 | 1,175 | 1,184 | 8,000 | 4,365 | 4,798 |
| Total | 378,340 | 9,995 | 4,560 | 383,775 | 291,137 | 15,465 | 4,194 | 302,408 | 81,367 | 87,203 |
Amortization expense for the year ended March 31, 2007 is $ 15,465 (2006 - $17,728).
11. Employee Benefits
- Pension benefits: NRCan employees participate in the Public Service Pension Plan, which is sponsored and administered by the Government of Canada. Pension benefits accrue up to a maximum period of 35 years at a rate of 2 percent per year of pensionable service, times the average of the best five consecutive years of earnings. The benefits are integrated with
Canada/Quebec Pension Plans benefits and they are indexed to inflation.
Both the employees and the department contribute to the cost of the plan. The 2006-07 expense amounts to $57,600,000 ($62,800,000 in 2005-06), which represents approximately 2.2 times (2.6 in 2005-06) the contributions by employees.
The department's responsibility with regard to the Plan is limited to its contributions. Actuarial surpluses or deficiencies are recognized in the financial statements of the Government of Canada, as the Plan's sponsor.
- Severance benefits: The department provides severance benefits to its employees based on eligibility, years of service and final salary. These severance benefits are not pre-funded. Benefits will be paid from future appropriations. Information about the severance benefits, measured as at March 31, is as follows:
2007 2006 (in thousands of dollars) Accrued benefit obligation, beginning of year 64,894 58,489 Expense for the year (30) 6,480 Benefits paid during the year (6) (75) Accrued benefit obligation, end of year 64,858 64,894
12. Other Liabilities
| (in thousands of dollars) | April 1, 2006 | Receipts and other credits | Payments and other charges | March 31, 2007 |
|---|---|---|---|---|
| Guarantee deposits - Oil and gas | 11,571 | 703,862 | (701,372) | 14,061 |
| Contractors security deposits | 92 | (92) | ||
| Shared costs projects | 9,250 | 13,199 | (11,284) | 11,165 |
| Market development and incentive payments - Alberta | 4,778 | 4,798 | (4,785) | 4,791 |
| Shared costs agreements - Research | 1,278 | 7,099 | (5,968) | 2,409 |
| Total | 26,969 | 728,958 | (723,501) | 32,426 |
Guarantee deposits - Oil and gas: This account was established to record securities in the form of cash, promissory notes, and bonds which are required to be issued to, and held by the Government of Canada pursuant to an Exploration License in accordance with section 24 of the Canada Petroleum Resources Act. These securities are a performance guarantee that the agreed exploration will be performed in the manner and time frame specified. Interest is not paid on these deposits.
Shared cost projects - This account was established to facilitate the retention and disbursement of moneys received from private organizations and other governments for cost-sharing scientific projects.
Market development and incentive payments - Alberta: This account records money received from the Government of Alberta, to encourage the expansion of natural gas market in Alberta and provinces to the East, in accordance with an agreement between the Government of Canada and the Government of Alberta dated September 1, 1981 and pursuant to section 39 of the Energy Administration Act. The original term of the agreement was from November 1, 1981 to January 31, 1987. As a result of the Western Accord of March 25, 1985, payments from the Government of Alberta terminated as at April 30, 1986, however, payments are being made from the account for selected programs which encourage the use of natural gas for vehicles.
Shared cost agreements - Research: This account was established to facilitate the retention and disbursement of moneys received from private industries and other governments for joint projects or shared-cost research agreements.
13. Equity of Canada
NRCan includes in its revenues and expenses the transactions of certain consolidated accounts established for specified purposes. Legislation required that the revenues of these specified purpose accounts to be earmarked and that related payments and expenses be charged against such revenues. The transactions do not represent liabilities to third parties but are internally restricted for specified purposes. NRCan has one such account entitled Environmental Research Fund. This account was established pursuant to subsection 76(1) of the Canada Petroleum Resources Act. The purpose of the fund is to finance environmental and social studies pertaining to the manner in which, and the terms and conditions under which, exploration development and production activities on frontier land, authorized under this Act or any other Act of Parliament, should be conducted.
| 2007 | 2006 | |
|---|---|---|
| Restricted - Environmental Studies Research Fund | (in thousands of dollars) | |
| Opening balance | 2,552 | 2,562 |
| Revenues | 2,468 | 2,500 |
| Expenses | (2,538) | (2,510) |
| Closing balance | 2,482 | 2,552 |
| Unrestricted equity | (568,759) | (277,548) |
| Total equity of Canada | (566,277) | (274,996) |
14. Contingent liabilities
- Contaminated sites
Liabilities are accrued to record the estimated costs related to the management and remediation of contaminated sites where the department is obligated or likely to be obligated to incur such costs. The department has identified approximately 11 sites (11 sites in 2006) where such action is possible and for which a liability of $387,800,000 ($192,100,000 in 2006) has been recorded. The significant increase in 2007 is primarily a result of the revised assessment of the cost estimate for one of the sites. NRCan's ongoing efforts to assess contaminated sites may result in additional environmental liabilities related to newly identified sites, or changes in the assessments or intended use of existing sites. These liabilities will be accrued by the department in the year in which they become known. - Claims and litigation
Claims have been made against the department in the normal course of operations. Legal proceedings for claims totaling approximately $720,600,000 ($720,900,000 in 2006) were still pending at March 31, 2007. Some of these potential liabilities may become actual liabilities when one or more future events occur or fail to occur. To the extent that the future event is likely to occur or fail to occur, and a reasonable estimate of the loss can be made, an estimated liability is accrued and an expense recorded in the financial statements.
15. Contractual Obligations
The nature of the department's activities can result in some large mutli-year contracts and obligations whereby the department will be obligated to make future payments when the services/goods are received. Significant contractual obligations that can be reasonably estimated are summarized as follows:
| (in thousands of dollars) | 2008 | 2009 | 2010 | 2011 | 2012 and thereafter | Total |
|---|---|---|---|---|---|---|
| Transfer Payments | 26,700 | 28,600 | 28,600 | 28,600 | 136,900 | 249,400 |
16. Related party transactions
The department is related as a result of common ownership to all Government of Canada departments, agencies, and Crown corporations. The department enters into transactions with these entities in the normal Course of business and on normal trade terms. Also, during the year, the department received services which were obtained without charge from other Government departments as presented in part (a).
-
Services provided without charge:
During the year the department received without charge from other departments, accommodations, legal fees and the employer's contribution to the health and dental insurance plans. These services received without charge are as follows:Services provided without charge Amount
(in thousands of dollars)2007 2006 Accommodation provided by Public Works and Government Services Canada 10,909 14,092 Contributions covering employer's share of employees' insurance premiums and costs paid by Treasury Board Secretariat 27,455 27,132 Worker's compensation cost provided by Human Resources Canada 252 297 Legal services provided by Department of Justice 1,438 1,484 Total 40,054 43,005
The Government has structured some of its administrative activities for efficiency and cost-effectiveness purposes so that one department performs these on behalf of all without charge. The costs of these services, which include payroll and cheque issuance services provided by Public Works and Government Services Canada and audit services provided by the Office of the Auditor General, are not included as an expense in the department's Statement of Operations.
-
Payables and receivables outstanding at year-end with related parties:
Payables and receivables outstanding at year-end with related parties: Amount
(in thousands of dollars)2007 2006 Accounts payable to other government departments and agencies 10,766 9,227
17. Comparative information
Comparative figures have been reclassified to conform to the current year's presentation.
9B. User Fees � Policy on Standards for External Fees
| External Fee | Service Standard | Performance Result | Stakeholder Consultation |
|---|---|---|---|
| Explosives licence and inspection fees | 95% of the time, initial factory applications will be completed within 60 days of receipt of completed documentation; renewals and all other authorizations will be processed within 30 days of a complete request. See other info below or visit our web site at http://www.nrcan.gc.ca/mms/explosif/ licen/licen_e.html. |
Licensing turnaround times have been acceptable to stakeholders. Results indicate the standards were met or exceeded 95% of the time. | Stakeholder groups are in agreement with licensing and authorization service standards. No formal complaints to this proposal have been received. |
| Seismic data | For provision of accurate location and magnitude of strong earthquakes in Canada, turnaround time is normally within 2 hours during working hours and within 4 hours outside of working hours. Preliminary confirmation is normally available to clients within 15 minutes during normal working hours and on our Web site at www.seismo.nrcan.gc.ca.
For all other requests for standard seismic data, turnaround time is within 5 working days. Complex requests are negotiated with the client. |
Service standards are reviewed annually (inquiries are recorded) - results indicate greater than 95% compliance with standards. | None planned at present (regular consultation provided through the Lithoprobe Seismic Processing Facility in Calgary). Client feedback on service expectations encouraged through questionnaire that accompanies responses to data requests. |
| Map products | National Topographic System and Atlas of Canada Maps: NRCan sells maps on a wholesale basis to a limited distribution network, and service standards reflect this.
Response time for information requests is 2 working days. Order processing time: 3 working days (excluding Saturdays, Sundays and Statutory holidays in the Province of Ontario), upon approved credit and provided account is in good standing. Hours of operation, 08:30 - 16:30 EST. |
The Centre for Topographic Information of the Mapping Services Branch is certified ISO 9001:2000, hence undergoes regular management review of quality objectives, discrepancy reporting processes, and client consultation. Performance issues are addressed through ISO Quality Objectives which are updated each year to address issues that may arise.
Aggregate annual data is available on request. |
Regular discussions and meetings are held with stakeholders. Service standards are reviewed continuously and included as part of the Discrepancy Management Reports (DMRs). Ongoing client and service feedback are used to ensure constant improvement as part of ISO 9001 quality system. |
| ISO non-destructive testing |
|
|
Fee adjustments are presented and negotiated with the 12 member advisory body of stakeholders. Previously the agreed price structure associated with fees for required services and reports is put into effect and not changed for 3 years. The stakeholders like the stability in knowing what they will be paying for the next 3 years. The revised plan is to move to annual fee adjustments based on actual costs. From January through June 2006, extensive consultations on exam fees were held with 8 exam centres, the advisory board, and the union representing 2,000 clients. The objective of these consultations was to isolate cost drivers in order to derive a formula driven fee structure. We also conducted an environmental scan, comparing our fees to those of NDT certification bodies in the UK, Australia, and the USA. |
| Air Photo products | Aerial Photography - Order processing time by the National Air Photo Library is 10 working days, priority service 5 working days; response time for information requests of 10 working days 80% of the time; production error rate of 1.5% or less; hours of operation, 08:30 - 16:30 EST. | As with maps, performance issues are addressed through ISO Quality Objectives which are updated each year to address issues that arise.
Performance results are monitored continuously. Aggregate annual data is available on request. |
Major survey completed in 2004. Service standards are reviewed continuously and included as part of the Discrepancy Management Reports (DMRs). Ongoing client and service feedback are used to ensure constant improvement as part of ISO 9001 quality system. |
| Fees charged for the processing of access requests filed under the Access to Information Act | Response provided within 30 days following receipt of request; the response time may be extended pursuant to section 9 of the ATIA. Notice of extension to be sent within 30 days after receipt of request. The Access to Information Act provides fuller details: http://laws.justice.gc.ca/en/A-1/218072.html. | Met prescribed standards 91.5% of the time. | The service standard is established by the Access to Information Act and the Access to Information Regulations. Consultations with stakeholders were undertaken by the Department of Justice and the Treasury Board Secretariat for amendments done in 1986 and 1992. |
| Subscription data | National Topographic Data Base (NTDB) - Response time for general information requests is 2 working days during business hours. Availability of web site is 24/7 90% of the time, monitored monthly. Preparation of a subscription agreement, within 10 working days of receipt. Return agreement signed by both parties within 10 working days after the document and the client's payment (when applicable) are received. Open connections following a subscription within 2 working days after payment of the subscription fees and the agreement signed by the client are received. | Complaints acknowledged within 2 working days - and as per ISO procedures, corrective action is taken immediately.
Performance results are monitored continuously. Aggregate annual data is available on request. A sample survey of NTDB clients in 2006/2007 indicated that 100% were satisfied with the quality of the products. |
Client consultation is ongoing - part of regular ISO process. |
| Other products | For aeromagnetic (and gravity data), the Geoscience Data Centre (GDC) of ESS provides maximum 10 day turn-around on external requests for data (average turnaround for a standard request is 1 day). We also provide on-line access through the Geoscience Data Repository for Geophysical and Geochemical Data (GDRGG). For more info on service standards see the Web site: http://www.ess.nrcan.gc.ca/intl/ standards/index_e.php. |
Performance is aggregated against standards annually. 99% of requests are in compliance with standards.
The number of inquiries has dropped significantly since data has been made available free of charge through the GDRGG. |
Client consultation is performed on an ongoing basis. All web-based clients are provided with a client satisfaction questionnaire including a request for suggestions for improvement. Advent of the GDRGG (web-based access) has significantly reduced requests via the GDC. |
Other information:
The Explosives Regulatory Division (ERD) remains committed to managing its regulatory activities in an effective and efficient manner to ensure public and worker health and safety while protecting Canada's explosives supply from criminal and terrorist interests. ERD is committed to delivering 95% of decisions on requests for explosives product authorizations, importation permits, display fireworks and pyrotechnics certificates, user magazine licences, vendor magazine licences, manufacturing certificates and factory licence renewals within 30 days of the receipt of complete applications and all necessary documentation. In the case of initial applications for a factory licence where the review is a more time consuming process, ERD is committed to delivering 95% of decisions within 60 days of the receipt of complete applications and all necessary documentation.
The proposed performance standards reflect a reasonable amount of time that could be taken to complete a regulatory activity (e.g., the amount of time required to review and make a decision regarding an application for a license). The standards identify an intent to meet the standard at least 95% of the time. This reflects the fact than on occasion, a regulatory decision may be delayed due to circumstances beyond ERD control and that on occasion, spikes in workload may prevent all decisions to be reached within the defined time frame.
Details on Transfer Payment Programs
Exceeding $5 Million per Year
14. Listing of Transfer Payment Programs Exceeding $5 million/year
In 2006-07, NRCan managed the following transfer payment programs in excess of $5 million.
- In support of the EnerGuide for Houses Retrofit Initiative
- In support of the Ethanol Expansion Program
- In support of the Energy Efficiency and Alternative Energy programs
- In support of the Technology and Innovation Initiative
- In support of climate change: the Opportunities Envelope
- Forest Research Institutes
- Payments to the Newfoundland Offshore Petroleum Resources Revenue Fund
- Payments to the Nova Scotia Offshore Revenue Account
- Payments for Newfoundland Offshore Equalization
- Wind Power Production Incentive Contribution Program
- Federal Response to the Mountain Pine Beetle Infestation in British Columbia
- Measures to Mitigate the Impact of the Mountain Pine Beetle
- Canada Softwood Lumber – Canada Wood Export Program
- Model Forest Program
1) Name of Transfer Payment Program: In support of the EnerGuide for Houses (EGH) Retrofit Incentive
2) Start Date: October 2003
4) Description of Transfer Payment Program: This grant was established to encourage home owners to make energy efficiency improvements to their homes in order to reduce energy consumption and resulting greenhouse gas (GHG) emissions. The grant was based on the measured improvement in the EnerGuide for Houses home energy rating resulting from retrofit.
5) Strategic Outcome: Canadians derive sustainable social and economic benefits from the assessment, development and use of energy, forest and mineral resources, and have the knowledge to mitigate environmental impacts and respond effectively to natural and man-made hazards.
6) Results achieved: Key performance information for the EnerGuide for Houses (EGH) Retrofit Incentive is provided in the DPR under Section II - Analysis of Performance by Program Activity - Energy. Comprehensive performance reporting on the department's energy efficiency, alternative transportation fuels and renewable energy programs is provided in the department's annual Report to Parliament under the Energy Efficiency Act. The report for fiscal year 2006-07 is expected to be tabled in Parliament by the end of 2007.
| (in millions of $) | 7) Actual Spending 2004-05 |
8) Actual Spending 2005-06 |
9) Planned Spending 2006-07 |
10) Total Authorities 2006-07 |
11) Actual Spending 2006-07 |
12) Variances |
|---|---|---|---|---|---|---|
| 13) Program Activity: Energy | ||||||
| 14) Total Grants | 10.9 | 11.9 | 9.8 | 41.0 | 46.7 | (5.7) |
| 14) Total Contributions | ||||||
| 14) Total Other Transfer Payments | ||||||
| 15) Total PA | ||||||
16) Comments on Variances: It was identified to the Minister and to Central Agencies in early March that there was a high probability that the program would be oversubscribed by the end of the year requiring an additional $5,700,000 in grants. The additional grant expenses would be processed under the statutory authority provided under the Energy Costs Assistance Measures Act and the department would offset the shortfall to the statutory payments from lapsing departmental resources. The program exceeded its GHG targets, achieving a total of 0.8Mt savings.
17) Significant audit and evaluation findings and URL to last audit and/or evaluation:
Audit of EGH in 2004:
http://www2cm.nrcan.gc.ca/nrcan/index_e.aspx?DetailID=57
Auditor General:
http://www.oag-bvg.gc.ca/domino/reports.nsf/html/c20060903ce.html
1) Name of Transfer Payment Program: Contributions in support of the Ethanol Expansion Program
2) Start Date: August 2003
4) Description of Transfer Payment Program: This program provided repayable contributions for the construction or expansion of fuel ethanol plants in Canada, in two rounds.
5) Strategic Outcome: Canadians derive sustainable social and economic benefits from the assessment, development and use of energy, forest and mineral resources, and have the knowledge to mitigate environmental impacts and respond effectively to natural and man-made hazards.
6) Results achieved: Key performance information on the Ethanol Expansion Program is provided in the DPR under Section II - Analysis of Performance by Program Activity - Energy. Comprehensive performance reporting on the department's energy efficiency, alternative transportation fuels and renewable energy programs is provided in the department's annual Report to Parliament under the Energy Efficiency Act. The report for fiscal year 2006-07 is expected to be tabled in Parliament by the end of 2007.
| (in millions of $) | 7) Actual Spending 2004-05 |
8) Actual Spending 2005-06 |
9) Planned Spending 2006-07 |
10) Total Authorities 2006-07 |
11) Actual Spending 2006-07 |
12) Variances |
|---|---|---|---|---|---|---|
| 13) Program Activity: Energy | ||||||
| 14) Total Grants | ||||||
| 14) Total Contributions | 31.2 | 30.5 | 35.0 | 35.3 | 33.7 | 1.6 |
| 14) Total Other Transfer Payments | ||||||
| 15) Total PA | ||||||
16) Comments on Variances: The variance of $1,600,000 is due to the uncertainty of the amount of liability under some agreements. The final accounting of all agreements under this program may reduce this variance.
17) Significant audit and evaluation findings and URL to last audit and/or evaluation: Ethanol Expansion Program Audit, 2006, is available on the Audit and Evaluation Branch website at:
http://www2cm.nrcan.gc.ca/nrcan/index_e.aspx?ArticleID=576
1) Name of Transfer Payment Program: In support of the efficiency and alternative energy programs
2) Start Date: April 1, 1997
4) Description of Transfer Payment Program: This program provides contribution funding for a variety of energy efficiency and alternative energy initiatives.
5) Strategic Outcome: Canadians derive sustainable social and economic benefits from the assessment, development and use of energy, forest and mineral resources, and have the knowledge to mitigate environmental impacts and respond effectively to natural and man-made hazards.
6) Results achieved: Key performance information is provided in the DPR under Section II - Analysis of Performance by Program Activity - Energy. Comprehensive performance reporting on energy efficiency, alternative transportation fuels and renewable energy programs is provided in the department's annual Report to Parliament under the Energy Efficiency Act. The report for fiscal year 2006-07 is expected to be tabled in Parliament by the end of 2007.
| (in millions of $) | 7) Actual Spending 2004-05 |
8) Actual Spending 2005-06 |
9) Planned Spending 2006-07 |
10) Total Authorities 2006-07 |
11) Actual Spending 2006-07 |
12) Variances |
|---|---|---|---|---|---|---|
| 13) Program Activity: Energy | ||||||
| 14) Total Grants | ||||||
| 14) Total Contributions | 63.9 | 77.2 | 44.7 | 54.9 | 53.9 | 1.0 |
| 14) Total Other Transfer Payments | ||||||
| 15) Total PA | ||||||
16) Comments on Variances: The variance is explained by delays due to climate change program review.
17) Significant audit and evaluation findings and URL to last audit and/or evaluation:
REDI's latest full evaluation (2003) is available on the Audit and Evaluation Branch web site at http://www2cm.nrcan.gc.ca/nrcan/index_e.aspx?DetailID=74.
Strategic Review of the New Housing Element of the Energy Efficient Housing Initiative, 2006, is available on the Audit and Evaluation Branch website at: http://www2cm.nrcan.gc.ca/nrcan/index_e.aspx?DetailID=567.
Audit of the Commercial Building Incentive Program, 2003 is available on the Audit and Evaluation Branch web site at: http://www2cm.nrcan.gc.ca/nrcan/index_e.aspx?DetailID=54.
Audit of Commercial/Institutional Buildings Retrofit Initiative, 2004, is available on the Audit and Evaluation Branch web site at: http://www2cm.nrcan.gc.ca/nrcan/index_e.aspx?DetailID=43.
Audit of the Federal House in Order Initiative (FHIO), 2006, is available on the Audit and Evaluation Branch web site at: http://www.nrcan.gc.ca/dmo/aeb/aeb-rpts-2006-A06012-e.htm.
Audit of the Commercial Transportation Energy Efficiency and Fuels Initiative (CTEEFI), 2006, is available on the Audit and Evaluation Branch web site at: http://www.nrcan.gc.ca/dmo/aeb/aeb-rpts-2006-A06005-e.htm.
1) Name of Transfer Payment Program: Contributions in support of the Technology and Innovation Initiative
2) Start Date: October 10, 2003
4) Description of Transfer Payment Program: To contribute to the objectives of Canada's climate change agenda by reducing long-term greenhouse gas (GHG) emissions by means of longer-term advanced technologies and enhanced innovative capacity through research, development and demonstration.
5) Strategic Outcome: Canadians derive sustainable social and economic benefits from the assessment, development and use of energy, forest and mineral resources, and have the knowledge to mitigate environmental impacts and respond effectively to natural and man-made hazards.
6) Results achieved:
Technology and Innovation Research and Development (T&I R&D) Component: Transfer Payments are one of the tools used to perform R&D and comprised 22% of the total T&I R&D budget of $30M in 2006/07. Transfer Payments directly supported 110 of the 322 projects funded by T&I R&D. Recipients included 14 universities across Canada,
several provincial research organizations as well as a variety of research associations and private companies.
The funding of these projects directly supports T&I R&D in its five strategic priorities of: cleaner fossil fuels; advanced end-use efficiency; decentralized energy production; biotechnology; and the hydrogen economy. The following are some highlights of funding in 2006/07:
Area: Cleaner Fossil Fuels: NRCan in collaboration with the Alberta Research Council, Alberta Newsprint Company, and the Alberta Energy Research Institute, supported the development of a micro-porous hollow fiber membrane module as gas-liquid contactor to achieve efficient low cost carbone dioxide (CO2) and sulphur dioxide (SO2) capture from flue gas, natural gas, biogas, and for CBM and other applications. The estimated operational cost reduction is 25-30% compared to conventional technology. Development of a quantitative model, with Alberta Research Council, of the variation of coal permeability due to changes in sorbed gas content and stress will allow more accurate assessment of the potential for CO2 storage in natural gas production from coals. Collaboration with the Petroleum Technology Alliance Canada provided an assessment of further development of bitumen recovery technology for "inaccessible" resources. The report built on a number of previous roadmaps and reports prepared over the past 10 years. It is intended to begin defining details around key R&D paths for specific resources.
Area: Advanced End-Use Efficiency: NRCan in collaboration with Ecologix is developing the initial concept, technical strategy, and business case for the ZoneComfort™ product that will reduce peak electrical demand and smog from power generation during summer heat waves. The commercialization of this product has now become available. Also included in this area is the commercialization of software modelling tools that permit the 3D visualization of flames, the spectral energy produced by those flames and the transfer of radiant heat to industrial processes. The tools have been successfully tested in the steelmaking, smelting, and refining industries. The theories that permit the rapid and accurate calculation of radiant flame properties were carried out at the University of Waterloo. This project has applicability to industrial processes that account for 13 Mt/a GHG (10% of industrial total) with potential for 3% to 4% reduction if widely adopted. In the transportation sector, GHG Emissions from Off-Road Machines resulted in a paper published and was recognized by the Society of Automotive Engineers (SAE) as being "among the most outstanding SAE technical papers of 2006" and will be published in SAE's highly respected publication 2006 Transactions.
Area: Biotechnology: Collaboration with industry and various municipalities to support the production of bio-energy from residual wastes from the municipal, agricultural and industrial sectors. Research in this area enables researchers, policy makers and the farming community to assess the sustainability of anaerobic digestion.
Area: Decentralized Energy Production: Development of innovative variable-speed small hydro turbine systems to increase low-head distributed power generation, and to achieve environment-friendliness and cost-effectiveness. Reduction in fish mortality in small turbines would remove an environmental barrier and reduce installation costs of small low head hydro. The variable speed will increase system efficiency.
Area: Hydrogen: Collaboration with the University of Victoria to examine the feasibility of a hydrogen-based renewable-energy-powered residential cogeneration system for grid-connected houses. The paper "The Simulation of a Renewable-Energy-Powered Hydrogen-Based Residential System" was presented at the SimBuild conference in Boston in August 2006 and received the Award for Best Paper by the American chapter of the International Building Performance Simulation Association.
Demonstration Component: During 2006/07, the T&I demonstration component, referred to as the Technology Early Action Measures (TEAM) program, disbursed $5.7M in contributions (G&Cs), providing funding to 14 demonstration projects, 11 of which were started in prior years, and 3 of which were started in-year. In total, 14 new clean energy demonstration projects were approved during the year, with a TEAM investment of $14.2M and a total project value of $111M. TEAM demonstration projects are typically multi-year, ranging from 1-3 years. Contributions typically represent 90% or more of TEAM's annual budget, and are the primary means of funding clean technology demonstration projects. Since inception in 1998, TEAM has funded 120 clean energy demonstration projects, many of which are flagship NRCan projects. Total disbursements to date are approximately $113M, and total project value exceeds $1.1B. The following are highlights of funding and other activities in 2006/07:
- Disbursements assisted Canadian proponents in achieving the following: (1) ATFCAN led a consortium of Canadian companies providing natural gas engine technology for commercial vehicles and trucks, in partnership with leading Indian car and truck manufacturers, in India, (2) Vaperma Inc. demonstrated a much higher efficiency process for producing ethanol at a Greenfield Ethanol
facility, (3) Enbridge is demonstrating electricity production by harnessing pressure let-down energy through turbine and fuel cell technology in its natural gas pipeline system, (4) work was commenced on an integrated energy system for the Dockside Green residential development in Victoria, one of the few LEED platinum developments in Canada, and (5) Milligan demonstrated a new
bio-diesel production process using off-spec waste canola seed.
- Some of the new projects approved included: (1) oil sands natural gas displacement and emissions sequestration project, (2) new low emission heavy oil extraction process, (3) direct-fired biomass gasification for a pulp and paper plant, (4) demonstration of CO2 as a refrigerant for supermarkets, (5) demonstration of Canadian energy efficient chiller technology in Cuba, (6)
production of hydrogen from landfill gas, and (7) demonstration of EcoSmart concrete technology in a large construction project designed by Canadian architectural and engineering firms in Dubai.
- In 2006/07, TEAM implemented qualitative assessments for air quality impacts from demonstration projects. TEAM is a leader in ISO standards and tools development, relating to the measurement and reporting of demonstration project GHG outcomes and results. In addition, TEAM drafted a verification protocol to provide a method to audit GHG results.
| (in millions of $) | 7) Actual Spending 2004-05 |
8) Actual Spending 2005-06 |
9) Planned Spending 2006-07 |
10) Total Authorities 2006-07 |
11) Actual Spending 2006-07 |
12) Variances |
|---|---|---|---|---|---|---|
| 13) Program Activity: Energy | ||||||
| 14) Total Grants | ||||||
| 14) Total Contributions | 3.0 | 13.5 | 30.1 | 12.2 | 12.0 | 0.2 |
| 14) Total Other Transfer Payments | ||||||
| 15) Total PA | ||||||
16) Comments on Variances:
Demonstration component: The climate change review, change in government, and Treasury Board processes introduced a funding freeze in 2005/06 and 2006/07. As a result of this freeze, operations were significantly affected, resulting in reduced G&C disbursements in 2006/07. This spending will be shifted out to 2007/08.
17) Significant audit and evaluation findings and URL to last audit and/or evaluation: Evaluation of TEAM, as a component of the Climate Change Action Fund http://www2cm.nrcan.gc.ca/nrcan/index_e.aspx?DetailID=392; TEAM was also one of the programs evaluated in the Examination of Federal Energy & Environmental S&T Investment (completed in 2006/07).
1) Name of Transfer Payment Program: Contributions in support of Climate Change : The Opportunities Envelope Initiative
2) Start Date: May 09, 2005
4) Description of Transfer Payment Program: The Opportunities Envelope supports greenhouse gas (GHG) mitigating initiatives proposed by the provinces and territories
5) Strategic Outcome: Canadians derive sustainable social and economic benefits from the assessment, development and use of energy, forest and mineral resources, and have the knowledge to mitigate environmental impacts and respond effectively to natural and man-made hazards.
6) Results achieved: 23 agreements signed providing estimated annual reductions of 2.0 megatonnes of GHG emissions
| (in millions of $) | 7) Actual Spending 2004-05 |
8) Actual Spending 2005-06 |
9) Planned Spending 2006-07 |
10) Total Authorities 2006-07 |
11) Actual Spending 2006-07 |
12) Variances |
|---|---|---|---|---|---|---|
| 13) Program Activity: Energy | ||||||
| 14) Total Grants | ||||||
| 14) Total Contributions | 0.0 | 6.2 | 40.1 | 40.1 | 29.4 | 10.7 |
| 14) Total Other Transfer Payments | ||||||
| 15) Total PA | ||||||
16) Comments on Variances: Some projects were delayed in starting and/or were unable to spend as forecast, or withdrew.
17) Significant audit and evaluation findings and URL to last audit and/or evaluation:
1) Name of Transfer Payment Program: Renewal and enhancement of funding for the forest research institutes
2) Start Date: 2005-06
4) Description of Transfer Payment Program: The objective of providing funding to the forest research institutes is to support NRCan's goal of sustainable natural resources development by helping to create an economically competitive forest sector through increased productivity, market access and value-added product development, while encouraging improved environmental performance and forest workplace health and safety practices.
Specifically, funding is provided to Forintek Canada Corp (Forintek) and the Forest Engineering Research Institute of Canada (FERIC) to conduct research in the following priority areas: (i) enhancing productivity; (ii) reducing costs of production; (iii) maintaining and improving market access; (iv) cutting energy consumption while advancing non-fossil fuel options; and (v) improving environmental performance through new processes and technologies.
5) Strategic Outcome: Canadians derive sustainable social and economic benefits from the assessment, development and use of energy, forest and mineral resources, and have the knowledge to mitigate environmental impacts and respond effectively to natural and man-made hazards.
6) Results achieved: In 2006-07, progress in research has been made in a number of areas. Below are some highlights of progress as they relate to the program's objectives.
Forintek's research continued to explore new uses for mountain pine beetle infested timber. Research during the year demonstrated that lodgepole pine affected by the beetle is suitable raw material for high density fibreboard. This development is particularly significant in that it is estimated that 200 million cubic meters of lodgepole pine will be dead and unsalvageable in 10 to 15 years.
In support of enhancing productivity, Forintek developed models that can predict product recovery accurately and directly from forest inventory measurements. Once completed, significant productivity gains can be expected. For a typical Canadian sawmill, a 1% increase in lumber value recovery equates to $250,000 annually.
Forintek also developed a new technique that not only reduces the amount of glue used in the plywood lamination process but also improves the quality of plywood veneer surface. It is expected that this process improvement could result in a saving of up to $675,000 annually at a typical Canadian softwood plywood mill.
In support of maintaining and improving market access, Forintek continued its work in the development of impartial technical data and knowledge to support and influence international codes and standards. During the year, through Forintek's efforts, Canadian timber species and design values were included in Shanghai's draft municipal building code.
In support of cutting energy consumption, FERIC research conducted a study on two trucks that were identical except for their engine size. The data collected demonstrated that the truck with the smaller engine was more energy efficient and just as productive when it came to the quantity of wood transported. The energy efficiency of the smaller engine made it possible to save roughly 4,000 litres of fuel (based on 100,000 km traveled) during the study year.
FERIC also continued its tests of the applicability of hydrogen injection and hybrid systems within the off-road sector of the forestry industry. This research, when completed, could potentially decrease hauling costs, reduce fuel consumption, and reduce emissions per tonne of timber delivered.
Forintek maintains a research program that responds to consumers' growing concern for the environment. Researchers have been actively involved in helping the panelboard industry prepare for compliance with new government guidelines on process emissions. Work completed during the year demonstrated that although emission levels vary, output is well below provincial guidelines.
| (in millions of $) | 7) Actual Spending 2004-05 |
8) Actual Spending 2005-06 |
9) Planned Spending 2006-07 |
10) Total Authorities 2006-07 |
11) Actual Spending 2006-07 |
12) Variances |
|---|---|---|---|---|---|---|
| 13) Program Activity: Sustainable Forest | ||||||
| 14) Total Grants | ||||||
| 14) Total Contributions | 4.9 | 5.2 | 5.3 | 5.3 | 5.3 | 0.0 |
| 14) Total Other Transfer Payments | ||||||
| 15) Total PA | ||||||
16) Comments on Variances:
17) URL to last evaluation:
1) Name of Transfer Payment Program: Payments to the Newfoundland and Labrador Offshore Petroleum Resource Revenue Fund
2) Start Date: 1987
4) Description of Transfer Payment Program: To make payments to the province equivalent to amounts received by Canada in relation to offshore activities in accordance with provisions of the Canada Newfoundland Atlantic Accord Implementation Act.
5) Strategic Outcome: Canadians derive sustainable social and economic benefits from the assessment, development and use of energy, forest and mineral resources, and have the knowledge to mitigate environmental impacts and respond effectively to natural and man-made hazards.
6) Results achieved: Payments were made to the province in accordance with the provisions of the Act
| (in millions of $) | 7) Actual Spending 2004-05 |
8) Actual Spending 2005-06 |
9) Planned Spending 2006-07 |
10) Total Authorities 2006-07 |
11) Actual Spending 2006-07 |
12) Variances |
|---|---|---|---|---|---|---|
| 13) Program Activity: Energy | ||||||
| 14) Total Grants | ||||||
| 14) Total Contributions | 175.0 | 427.7 | 349.1 | 313.4 | 313.4 | |
| 14) Total Other Transfer Payments | ||||||
| 15) Total PA | ||||||
16) Comments on Variances:
17) Significant audit and evaluation findings and URL to last audit and/or evaluation:
1) Name of Transfer Payment Program: Payments to the Nova Scotia Offshore Revenue Account
2) Start Date: 1993
4) Description of Transfer Payment Program: To make payments to the province equivalent to amounts received by Canada in relation to offshore activities in accordance with provisions of the Canada Nova Scotia Offshore Petroleum Resource Accord Implementation Act.
5) Strategic Outcome: Canadians derive sustainable social and economic benefits from the assessment, development and use of energy, forest and mineral resources, and have the knowledge to mitigate environmental impacts and respond effectively to natural and man-made hazards.
6) Results achieved: Payments were made to the province in accordance with the provisions of the Act.
| (in millions of $) | 7) Actual Spending 2004-05 |
8) Actual Spending 2005-06 |
9) Planned Spending 2006-07 |
10) Total Authorities 2006-07 |
11) Actual Spending 2006-07 |
12) Variances |
|---|---|---|---|---|---|---|
| 13) Program Activity: Energy | ||||||
| 14) Total Grants | ||||||
| 14) Total Contributions | 80.4 | 217.8 | 312.0 | 275.4 | 275.4 | |
| 14) Total Other Transfer Payments | ||||||
| 15) Total PA | ||||||
16) Comments on Variances:
17) Significant audit and evaluation findings and URL to last audit and/or evaluation:
1) Name of Transfer Payment Program: Newfoundland Offshore Equalization
2) Start Date: 2002
4) Description of Transfer Payment Program: To make payments to the province to compensate for part of the reduction in fiscal equalization entitlements that would result from offshore revenues being included in the equalization program.
5) Strategic Outcome: Canadians derive sustainable social and economic benefits from the assessment, development and use of energy, forest and mineral resources, and have the knowledge to mitigate environmental impacts and respond effectively to natural and man-made hazards.
6) Results achieved: Payments were made to the province in accordance with the provisions of the Act
| (in millions of $) | 7) Actual Spending 2004-05 |
8) Actual Spending 2005-06 |
9) Planned Spending 2006-07 |
10) Total Authorities 2006-07 |
11) Actual Spending 2006-07 |
12) Variances |
|---|---|---|---|---|---|---|
| 13) Program Activity: Energy | ||||||
| 14) Total Grants | ||||||
| 14) Total Contributions | 96.3 | 0.0 | 109.8 | 109.8 | 109.8 | |
| 14) Total Other Transfer Payments | ||||||
| 15) Total PA | ||||||
16) Comments on Variances:
17) Significant audit and evaluation findings and URL to last audit and/or evaluation:
1) Name of Transfer Payment Program: Wind Power Production Incentive Contribution Program
2) Start Date: April 1, 2002
4) Description of Transfer Payment Program: The WPPI Program was set up to help establish wind energy as a full-fledged competitor in the electricity market by providing – over a period of ten years – a financial incentive of about 1 cent per each kilowatt-hour produced from the installation of 1,000 MW of new wind power capacity in Canada by 2007. The Government of Canada is to provide – over a 10-year period – an incentive averaging 1 cent per each kilowatt-hour produced from a qualifying wind energy project.
5) Strategic Outcome: Canadians derive sustainable social and economic benefits from the assessment, development and use of energy, forest and mineral resources, and have the knowledge to mitigate environmental impacts and respond effectively to natural and man-made hazards.
6) Results achieved: At year end, 22 wind farms were in operation representing 924 megawatts of new wind energy capacity in Canada and about $315 million in contribution funding over 14 years.
| (in millions of $) | 7) Actual Spending 2004-05 |
8) Actual Spending 2005-06 |
9) Planned Spending 2006-07 |
10) Total Authorities 2006-07 |
11) Actual Spending 2006-07 |
12) Variances |
|---|---|---|---|---|---|---|
| 13) Program Activity: Energy | ||||||
| 14) Total Grants | ||||||
| 14) Total Contributions | 5.5 | 10.5 | 33.9 | 33.9 | 24.9 | 9.0 |
| 14) Total Other Transfer Payments | ||||||
| 15) Total PA | ||||||
16) Comments on Variances: Wind farms supported under the program had lower than expected production numbers resulting in lower payments to producers. $9.0 M lapse = $5 M reprofiled (WPPI) + $3M reprofiled (WPPI -2) + $1 M to reserve (WPPI-2) on Dec 19/06.
17) Significant audit and evaluation findings and URL to last audit and/or evaluation:
1) Name of Transfer Payment Program: Federal Response to the Mountain Pine Beetle Infestation in British Columbia
2) Start Date: 2006-07
4) Description of Transfer Payment Program: The purpose of the Federal Response to the Mountain Pine Beetle (FR-MPB) program is to slow the spread of the beetle, recover economic value from trees killed by the beetle, and protect communities and forest resources in areas affected by the infestation.
5) Strategic Outcome: Canadians derive sustainable social and economic benefits from the assessment, development and use of energy, forest and mineral resources, and have the knowledge to mitigate environmental impacts and respond effectively to natural and man-made hazards.
6) Results achieved: In 2006-07, the Government of Canada announced the new, $200-million FR-MPB program. Through this program, NRCan will work closely with provincial counterparts to deliver a comprehensive, integrated strategy to combat the beetle infestation. Additional information about this program can be found at http://mpb.cfs.nrcan.gc.ca.
Slowing the Spread
The principal aim of the FR-MPB program is to slow the eastward spread of the beetle outbreak. NRCan is working to develop effective monitoring and control methods. Digital mapping has been completed on 3,750,000 hectares of beetle impacted forests in the Quesnel and Fort St. James, B.C. management units, providing critical information on the rate and severity of MPB infestation. MPB
detection activities were completed on 2,300 hectares and direct control of beetles, using fall and burn, was completed on 3,000 infested trees within B.C. provincial park forests. An additional 90,000 beetle infested trees were removed through fall and burn on provincial forest lands along the BC-Alberta border to further control the rate of spread east of the Rocky Mountains.
The MPB is causing widespread destruction of the lodgepole pine, but also poses a potential threat to the jack pine forests of western Canada. NRCan has developed the initial models of stand susceptibility and connectivity of the jack pine forests to MPB infestation. This information is being used by the Province of Alberta in delivering the provincial beetle response.
Recovering Economic Value
The program is also focused on developing options for recovering as much economic value as possible from trees killed by the MPB. Mapping has been completed for active beetle and harvest designation on more than 18,000 hectares. In addition to supporting control activities, this mapping aids in the identification and prioritization of salvageable tree stands. NRCan is also leading the
development of non-traditional products and markets for beetle-affected timber.
Protecting Communities and Forest Resources
The program will assist in the delivery of activities designed to reduce the threat of wildland fire facing many communities surrounded by dead trees. In 2006-07, forest fuel management plans were completed for three First Nations communities and fuel load management accomplished on 115 hectares. The construction of fireguards was also completed on the south and southwest sides of the
town of Banff, in Banff National Park.
| (in millions of $) | 7) Actual Spending 2004-05 |
8) Actual Spending 2005-06 |
9) Planned Spending 2006-07 |
10) Total Authorities 2006-07 |
11) Actual Spending 2006-07 |
12) Variances |
|---|---|---|---|---|---|---|
| 13) Program Activity: Sustainable Forest | ||||||
| 14) Total Grants | ||||||
| 14) Total Contributions | 0.0 | 0.0 | 24.8 | 24.8 | 24.8 | 0.0 |
| 14) Total Other Transfer Payments | ||||||
| 15) Total PA | ||||||
16) Comments on Variances:
17) Significant audit and evaluation findings and URL to last audit and/or evaluation:
1) Name of Transfer Payment Program: Measures to Mitigate the Impact of the Mountain Pine Beetle
2) Start Date: 2002-03
4) Description of Transfer Payment Program: The purpose of the program is to mitigate the impact of the mountain pine beetle (MPB) epidemic in British Columbia, to assist in efforts to control the emerging MPB infestation in Alberta, and to reduce the risk of future MPB epidemics.
5) Strategic Outcome: Canadians derive sustainable social and economic benefits from the assessment, development and use of energy, forest and mineral resources, and have the knowledge to mitigate environmental impacts and respond effectively to natural and man-made hazards.
6) Results achieved: In 2006-07, the MPB Initiative (MPBI) engaged governmental partners, industry, First Nations, private landowners, and the public to deliver programs, research, and information needed to mitigate the impact of the mountain pine beetle (MPB). To meet the objectives of the MPBI, activities have been focused in three strategic areas that address a range of social, economic, and environmental impacts. These areas of focus are:
- improving the economic and ecological efficiency of ongoing timber salvage efforts;
- implementing a research and development program to enable the development, demonstration, and dissemination of forest management options to reduce the risk of future MPB epidemics; and
- improving the operational abilities and willingness of First Nations and private landowners to effectively manage MPB impacts through the use of forestland rehabilitation programs.
Economically and environmentally efficient methods for utilizing beetle-killed timber are being developed through the MPBI. In cooperation with industry, NRCan examined top priority questions related to the use of post-beetle fibre in the production of both chemical and mechanical pulp. The characteristic blue stain of beetle-affected wood fibre poses potential limitations to its commercial use in areas such as pulp production. During 2006-07, the department released field data on the impact of time since beetle-kill on timber production quality, which will help to prioritize timber salvage efforts. Addressing the potential for alternative uses, the program delivered a comprehensive examination and quantification of the financial dimensions to utilizing post-beetle fibre as a source for bioenergy production.
Research and development programs are leading to effective methods for controlling the spread of the MPB and mitigating the risk of future epidemics. In 2006-07, NRCan published the comprehensive book - The Mountain Pine Beetle - A Synthesis of Biology, Management, and Impacts on Lodgepole Pine. This has proven to be an extremely valuable resource for researchers and forest managers alike, and was the most frequently downloaded publication from the Canadian Forest Service web site in 2006-07. A copy may be downloaded at http://bookstore.cfs.nrcan.gc.ca. Research is also being conducted to assess the MPB risk to Alberta. Connectivity pathways from British Columbia into Alberta forests have been identified, and a preliminary examination of the vulnerability of jack pine to beetle attack has been completed.
Along with beetle control programs in federal mountain parks, NRCan has delivered 80 projects with non-industrial forestland owners and 27 projects with First Nations to address beetle control and post-beetle forest rehabilitation. The department has also hosted MPB information sessions for the public and the forestry sector in both British Columbia and Alberta. These sessions have raised awareness around the MPB epidemic and the programs and resources available to those who are being impacted.
The MPBI has been successful in establishing the foundation for dealing with the variety of impacts caused by the MPB epidemic. Recognizing the need to continue and expand upon this work, the Government of Canada announced the Federal Response to the Mountain Pine Beetle program in January 2007. Details of this new, $200-million program can be found at http://mpb.cfs.nrcan.gc.ca.
| (in millions of $) | 7) Actual Spending 2004-05 |
8) Actual Spending 2005-06 |
9) Planned Spending 2006-07 |
10) Total Authorities 2006-07 |
11) Actual Spending 2006-07 |
12) Variances |
|---|---|---|---|---|---|---|
| 13) Program Activity: Sustainable Forest | ||||||
| 14) Total Grants | ||||||
| 14) Total Contributions | 3.5 | 4.5 | 5.7 | 5.3 | 5.3 | 0.0 |
| 14) Total Other Transfer Payments | ||||||
| 15) Total PA | ||||||
16) Comments on Variances:
17) Significant audit and evaluation findings and URL to last audit and/or evaluation: Audit & Evaluation Branch conducted a program evaluation in 2006-2007. The final report can be found at http://www.nrcan.gc.ca/dmo/aeb/aeb-rpts-2007-e.htm.
1) Name of Transfer Payment Program: Canada Softwood Lumber - Canada Wood Export Program
2) Start Date: 2002-03
4) Description of Transfer Payment Program: There are two initiatives in this program: the Canada Wood Export Program and the Value-Added Research Initiative. The purpose of these initiatives is to mitigate the impact of the U.S. softwood lumber decisions by providing indirect assistance to the Canadian softwood lumber industry. These measures will provide long term benefits to the industry. The Canada Wood Export Program was the only program of the two funded in excess of $5million in fiscal 2006-07.
Canada Wood Export Program: The objective is to establish a national market development program to expand the export of Canadian wood products to international markets. The objective will be achieved through increasing the acceptance of the Canadian system of wood frame construction and the related increase in the use of Canadian primary and secondary wood products in residential construction. In the short term, there would be initial impacts of increased project economies and effectiveness resulting from partnering with and among industry associations. In the intermediate term, increased acceptance and knowledge of Canadian wood products in many international markets is expected. The long term should see an overall increase in sustainable prosperity in the Canadian wood product sector. There should be an increased level of market development by the private sector. In addition, product acceptance of existing and new products should ensure opportunities for export growth over what would have been achieved without the implementation of the program.
5) Strategic Outcome: Canadians derive sustainable social and economic benefits from the assessment, development and use of energy, forest and mineral resources, and have the knowledge to mitigate environmental impacts and respond effectively to natural and man-made hazards.
6) Results achieved:
Canada Wood Export Program: Canada Wood has successfully integrated Canadian wood products associations into operating coordinated offshore offices in the UK, Belgium, China, Japan and Korea, with representation in Taiwan. The Program has raised the profile of Canadian wood products in these markets, influenced the development of residential codes and
standards to accommodate wood use and helped increase wood exports to our key offshore markets.
China - Key Results
- First Draft of Shanghai local wood frame construction (WFC) code and fire code completed - awaiting approval.
- Completion of a re-roofing project.
- Improved Quality Assurance Program.
- Successful delivery of courses at Chinese Universities.
- Wood exports to China increased by $100 million since 2000 - now totalling $121 million.
Japan Key Results
- Ministerial approval of post and beam structures in fire-protected zones.
- Acceptance of jack pine as an approved species in the manufacture of structural laminated wood products in Japan.
- Approval of the certification of Canada Tsuga kiln dried product line with strength equivalency to engineered wood products.
- Hard wood maple and birch are gaining acceptance.
- After years of decline - exports to Japan have stabilized.
South Korea - Key Results
- Opening of a Canada Wood office in Seoul.
- Successful delivery of WFC technical training for Korean builders and architects.
- Establishment of a strong working relationship with Korean wood associations.
- 38% increase in the value of wood exports in 2006 - totalling $100 million.
Europe - Key Results
- Greater awareness of the benefits of WFC (Super E, prefab).
- Successful delivery of technical seminars to architects and designer (Canada Wood Days).
- Increased the awareness of Canadian coastal and hardwood species.
- 18% increase in value of wood exports - totalling $632 million.
| (in millions of $) | 7) Actual Spending 2004-05 |
8) Actual Spending 2005-06 |
9) Planned Spending 2006-07 |
10) Total Authorities 2006-07 |
11) Actual Spending 2006-07 |
12) Variances |
|---|---|---|---|---|---|---|
| 13) Program Activity: Sustainable Forest | ||||||
| 14) Total Grants | ||||||
| 14) Total Contributions | 19.0 | 9.8 | 11.0 | 6.9 | 6.8 | 0.1 |
| 14) Total Other Transfer Payments | ||||||
| 15) Total PA | ||||||
16) Comments on Variances:
17) URL to last evaluation:
1) Name of Transfer Payment Program: Model Forest Program (MFP)
2) Start Date: 1992-93
4) Description of Transfer Payment Program: The purpose of the MFP is to increase the implementation of innovative sustainable forest management throughout Canada's managed forested land base.
The activities of the MFP are expected to increase the implementation of sustainable forest management practices throughout Canada's managed forested land base. Through the development, testing and promotion of sustainable forest management (SFM) processes and tools, model forests – and Canada – will be, and will be seen to be a leader in SFM. There will be greater adoption of best management practices by both those involved in model forest partnerships and others.
After 15 years, the MFP will come to an end in summer 2007. Work is underway to finalize the planning and implementation of a successor program to the MFP, the Forest Communities Program (FCP). The new FCP is scheduled to commence operations in summer 2007, and will continue to use a community-based approach to address local challenges, but will shift the focus of activities from sustainable forest management to developing and sharing innovative tools and practices which advance the sustainability of forest-dependent communities.
5) Strategic Outcome: Canadians derive sustainable social and economic benefits from the assessment, development and use of energy, forest and mineral resources, and have the knowledge to mitigate environmental impacts and respond effectively to natural and man-made hazards.
6) Results achieved: In 2006-07, the MFP supported over 250 research, demonstration and outreach partnership projects across Canada, engaging approximately 500 partners drawn from industry, provincial governments, land use planning authorities, Aboriginal organizations, environmental and community groups. The bulk of project activity took place at the 11 model forests sites across Canada and two special project areas in Labrador and Prince Edward Island. Projects ranged from developing knowledge, methodologies and tools to mitigate the impacts on wildlife of timber harvesting to better stewardship of private lands to exploring innovative software applications for forest management planning. At the national level, the program supported national initiatives to advance community adaptability to climate change, Aboriginal youth involvement in forestry, private woodlot management, and carbon accounting at the local or forest stand level. The Canadian Model Forest Network (CMFN) website www.modelforest.net provides a comprehensive overview of model forest activities and research.
The impacts and influence of the MFP can be measured through behavioural change as forest managers in Canada and abroad adopt model forest developed concepts, tools, and practices. Recent examples include the following:
- The adoption of wildlife protection guidelines by a number of jurisdictions based on model forest generated research.
- Changes in provincial approaches to land use planning and protection as a result of collaborative projects led by model forests.
- The uptake, both within Canada and abroad, of an important new modelling tool designed to evaluate the impact of operational-scale forest management decisions on carbon storage and release. This model and its accompanying guidebook are important milestones in in a major multi-year collaborative project between the CMFN and the Carbon Accounting Team of the Canadian Forest Service.
Including Canada, the model forest concept has been adopted, or is under development, at 41 sites in 18 countries around the world. Canada's model forest experience and expertise continues to be in great demand. In 2006-07, mentorship, technical assistance, and knowledge transfer activities were underway between several Canadian model forests and model forests in Latin America, Russia and Europe.
| (in millions of $) | 7) Actual Spending 2004-05 |
8) Actual Spending 2005-06 |
9) Planned Spending 2006-07 |
10) Total Authorities 2006-07 |
11) Actual Spending 2006-07 |
12) Variances |
|---|---|---|---|---|---|---|
| 13) Program Activity: Sustainable Forest | ||||||
| 14) Total Grants | ||||||
| 14) Total Contributions | 6.7 | 6.6 | 6.0 | 6.1 | 6.1 | 0.0 |
| 14) Total Other Transfer Payments | ||||||
| 15) Total PA | ||||||
16) Comments on Variances:
17) Significant audit and evaluation findings and URL to last audit and/or evaluation: http://www.nrcan.gc.ca/dmo/aeb/aeb-rpts-2006-E05002-e.htm
Foundations (Conditional Grants)
In 2006-07, NRCan contributed to the following foundations (conditional grants). Further information can be found at http://www.tbs-sct.gc.ca/est-pre/estime.asp.
1) Name of Recipient: Sustainable Development Technology Canada (SDTC)
2) Start Date: April 2002
5) Description: To stimulate the development and demonstration of Canadian technologies aimed at climate change, clean air, clean water and clean soil.
6) Strategic Outcome: Canadians derive sustainable social and economic benefits from the assessment, development and use of energy, forest and mineral resources, and have the knowledge to mitigate environmental impacts and respond effectively to natural and man-made hazards.
7) Achieved results or progress made: (within departmental overall plans)
Over the life of its operations, SDTC will expend $280 million primarily on climate change projects, $70 million on air quality projects and $200 million on the development and demonstration of new technologies for clean water and clean soil. Out of the climate change/air quality allocation, SDTC will provide at least $50 million towards projects related to the development and
demonstration of technologies for the hydrogen economy and at least $50 million for projects related to clean fossil fuels.
NRCan is not responsible for reporting specifically on SDTC progress and results. However, as the designated minister under the SDTC Act, the Minister of NRCan tables the SDTC annual report in Parliament. This report is available at the SDTC website at http://www.sdtc.ca/en/index.htm. The following is a summary of SDTC accomplishments as reported in the 2006 annual report.
In 2006, SDTC announced 35 projects for funding, with SDTC providing $76M (30%), private sector participants providing $157M (62%) and other government programs providing $22M (8%), for a total project value of $255M. Since its inception, SDTC has committed $238M (28%) in technology development and demonstration funding for 107 projects, while the private sector contributed $499M (59%) and $109M (13%) came from other public sources, for a total project value of $846M. These 107 projects are reported by SDTC to have the potential for 12.6 Mt of CO2 emission reductions annually by 2012.
A total of 10 projects has been completed to date. Seven were completed in 2005 and three in 2006.
In 2006, SDTC operational expenses were $7.4M, compared with $5.9M in 2005. The approved operating budget for 2007 is $8.7M. 2006 project disbursements were $32.1M, compared to $13.3M in 2005, with the 2007 figure forecast at $70M. Total project disbursements as of December 31, 2006, stood at $57M. SDTC's investment portfolio had an overall market value of $525.5M on August 31, 2006. Accordingly, SDTC's earnings on the investment of the $550M received from the government have largely offset the combined operating costs and project disbursements to date.
77% of the 107 projects funded to date (82 projects) was classified as principally having a climate change impact, 17% (18 projects) was classified as having a clean air impact, and 84% (90 projects) had both climate change and clean air impacts. These figures are close to the targets of 80% climate change and 20% clean air.
| (in millions of $) | 8) Actual Spending 2004-05 |
9) Actual Spending 2005-06 |
10) Planned Spending 2006-07 |
11) Total Authorities 2006-07 |
12) Actual Spending 2006-07 |
13) Variances |
|---|---|---|---|---|---|---|
| 14) Program Activity (PA): Energy* | 100.0 | 0.0 | 0.0 | 0.0 | 0.0 |
15) Comments on Variances: In total $275 million expended by NRCan ($50M was incurred in 2001-02)
16) Significant audit and evaluation findings and URL to last audit and/or evaluation:
First Interim Evaluation (June 2006) (http://www.sdtc.ca/en/news/Interim_Evaluation_Report.pdf)
As required by Funding Agreement Three, SDTC carried out an interim evaluation of its operations in 2006. The evaluation was conducted by an independent consultant, who made a number of recommendations to SDTC. Although key informants praised the high quality of SDTC's operations, the evaluation report found that many expressed concerns over the slow pace of the funding process as
well as the level of details required for Statements of Interest (SOI) and proposals. In particular, the informants identified significant concerns with the lengthy contracting process, while recognizing that external factors beyond SDTC's control can have a significant contributing role. The evaluation found that fewer than half of all approved projects (at the end of 2005) had
signed contracts (32 of 76). As a result, on December 31, 2005 (with 4 of its 9 funding years completed), SDTC had committed $169M to clean energy technology projects, but only $25M disbursed. Hence, NRCan and Environment Canada concluded that SDTC would need to increase its funding commitments and disbursements substantially. The two departments will assess SDTC's response, once
released, and discuss with the Foundation the implementation of the report's recommendations. In particular, shortening of the contracting process will need to be addressed. A second interim evaluation will be due in 2009 or after two-thirds of the funds have been committed (whichever comes first).
CESD Climate Change Audit - Chapter 1 (September 2006) (http://www.oag-bvg.gc.ca/domino/reports.nsf/html/c20060901ce.html/$file/c20060901ce.pdf)
In December 2005, the Office of the Auditor General's Commissioner of the Environment and Sustainable Development (CESD) initiated an audit of SDTC. This audit encompassed all aspects of SDTC's operations and was part of the CESD audit of climate change programs in the federal government. The audit objective was to assess how well SDTC was fulfilling its mandate to support and fund
the development and demonstration of climate change technologies and act as a catalyst in building a sustainable development technology infrastructure in Canada. The audit was also to determine whether the federal government had ensured that SDTC activities were effectively aligned with other federal climate change activities and whether the government's oversight of SDTC was
appropriate and provided Parliament with suitable information in a timely manner. The full audit report was tabled by the Auditor General in September 2006. Chapter 1 (the report on SDTC) was positive in its assessment of the two sponsoring departments (NRCan and Environment Canada) and indicated that the departments had taken reasonable steps to ensure the alignment of SDTC's climate
change activities with federal efforts and to oversee the Foundation. The report recommended that SDTC adopt alternative approaches to reporting projected reductions in greenhouse gas (GHG) emissions, using a conservative approach. This recommendation was a reflection of SDTC's claim that the projects approved to date could lead to a 12.5 Mt reduction in GHG emissions. The report
recommended that SDTC re-examines the appropriateness of the rate it uses to discount project applicants' GHG claims and that it also takes into account the effect of project delays.
AG November 2006 Report - Chapter 12 (October 2006) (http://www.oag-bvg.gc.ca/domino/reports.nsf/html/20061112ce.html/$file/20061112ce.pdf)
In Chapter 12 of the Auditor General's November 2006 Report, entitled "The Role of Federal Appointees on the Board of Directors of Sustainable Development Technologies Canada (SDTC)", the Auditor General reported on an investigation into the question whether the government's position on the role of federal appointees on SDTC's Board of Directors supports effective board governance.
This investigation was in part triggered by the insertion of Clause 15.20 in the third funding agreement with SDTC, which limits the participation of government appointees in board meetings. At various occasions, the Foundation had raised concerns about how the clause would affect the board governance.
In its report, the AG concluded that the government's decision to restrict the role of federally-appointed directors affected the SDTC Board's governance, impeded SDTC's operations and contradicted the government's own position on the matter. The OAG recommended that NRCan and Environment Canada consult with TBS and the Privy Council Office to clarify the role of federal appointees on the board of directors of SDTC. Following the release of this report, the suggested consultations have taken place and TBS has advised the sponsoring departments that Clause 15.20 can be removed.
Evaluation of Foundations (March 2007) (http://www.tbs-sct.gc.ca/report/orp/2007/ef-fe/ef-fe_e.asp)
This report presents the findings of an evaluation of the use of foundations as instruments of public policy. The evaluation study was conducted by KPMG LLP (KPMG) on behalf of the Government of Canada between September 2006, and January 2007. The study addresses the government's commitments to the Standing Senate Committee on National Finance and Standing Committee on Public Accounts
to undertake an evaluation of the use of foundations as tools for the delivery of public policy, particularly with respect to the use of up-front conditional grant assistance. The evaluation examined the following: (i) the overall appropriateness of the use of the foundation model as an instrument of public policy; (ii) effectiveness of foundations; and (iii) operating and
administration (O&A) costs of foundations as compared to existing department-run programs for delivering policy.
The study found that the 16 foundations evaluated differ in mandate, scales of operation, business models and range of activities, and that they differ from departmental programs. The study's short time frame prevented a reliable comparison of operating and administrative costs between foundations and departmental programs. Analysis was based on the cost structures and trends of foundations compared to operating and administrative costs of similar government organizations.
The study's overall findings were positive and concluded that foundations, such as the SDTC, are cost-effective, successful in achieving results, fulfilling their mandates and complementing related government programs; however, the study noted also that proposal assessments for new foundations should be strengthened to ensure the most appropriate, effective and efficient method of delivering public policy. TBS is now studying the evaluation results and recommendations, and is considering the need for further research into the future use of the foundation model for delivering public policy. Potential future requests from the standing committees will determine if the Government will need to provide additional input.
17) URL to recipient's site: http://www.sdtc.ca/en/index.htm.
18) URL to recipient's annual report: http://www.sdtc.ca/en/news/annual_reports.htm.
* NRCan share only
1) Name of Recipient: Federation of Canadian Municipalities' (FCM) Green Municipal Fund (GMF)
2) Start Date: Budget 2000
5) Description: The intent of the GMF is to encourage investment in environmental municipal infrastructure. Specifically, the priorities of the fund is to have a positive impact on the health and the quality of life of Canadians by reducing greenhouse gas (GHG) emissions, improving local air, water and soil quality and promoting renewable energy by supporting environmental studies and projects within the municipal sector.
The GMF is equally co-funded by NRCan and Environment Canada (EC) who have provided endowments to the FCM which manages the funds at arms' length, creating a strong partnership between the FCM and the Government of Canada. The FCM Board of Directors, formally designated as the decision making body for the funds, is advised by a 15 member council with five federal appointees. The Council plays a key role, supported by the FCM secretariat and the GMF Peer Review Committee.
The FCM, a not-for-profit non-governmental organization, operates the GMF through an arms-length-agreement with EC and NRCan. Created in 2000 with two arms-length funding agreements totaling $125 million, the GMFs were doubled in 2002 with an additional $125 million. The latest funding agreement (2005) added another $300 million to the funds and merged the two funds into one fund, the GMF.
This fund supports grants, loans and loan guarantees and is consistent with the purpose and intent of the original agreements. $150 million dollars of this fund is to be used exclusively to provide loans for the remediation and redevelopment of municipal contaminated sites (Brownfields). The new agreement contains some significant revisions which are expected to substantially increase the environmental, social, and economic benefits of the GMF by increasing their size, flexibility, and clarity.
For more information on the GMF, including GMF Annual Report 2005-2006 and an overview of GMF projects, consult the foundation's website at http://www.sustainablecommunities.fcm.ca/GMF/.
6) Strategic Outcome: Canadians derive sustainable social and economic benefits from the assessment, development and use of energy, forest and mineral resources, and have the knowledge to mitigate environmental impacts and respond effectively to natural and man-made hazards.
7) Results achieved: Within departmental overall plans, encouraging local environmental action in key sectors including:
- energy;
- water;
- waste;
- sustainable transportation;
- brownfield remediation; and
- planning.
Performance results reported here are those reported by the FCM in material distributed to the responsible departments (NRCan and EC) in their 2005-2006 annual report.
Since 2000, the GMF has approved and funded 522 studies, field tests and capital projects, for committed funding of $304M, leveraging more than $1.8B of economic activities across Canada.
FCM estimates the potential environmental impacts from these investments include the reduction of: 641 tonnes NOx; 65 tonnes SOx; 512 tonnes PM10; 1.2 megatonnes CO2; or an equivalent of taking 201,000 cars off the road annually.
In 2005-2006, the GMF approved over $9M in grants and almost $55M in loans to 31 capital projects. This includes the Request for Proposal (RFP) for brownfields which financed loans totalling over $15M for 12 projects, leveraging over $39M in economic activity. These projects will remove or remediate approximately 650 thousand cubic metres of polluted soil from over 1 million square meters of property.
In 2005-2006, over $10M in grants supported 84 feasibility studies, field tests and sustainable community plans, a figure similar to the previous year.
The GMF set a 2005-2006 goal of regional balance. This was achieved with the exception of Quebec, where the numbers are expected to climb with increased outreach to that province and the adaption of the RFP process to facilitate GMF applications from Quebec.
In 2005-2006, GMF agreed to sell the Emission Reduction Rights from the Nanaimo landfill gas capture project to an Alberta-based energy utility, possibly recovering the value of the original grant. If successful, this mechanism may be replicated in future funding agreements.
When it becomes available, the 2006-2007 GMF annual report will be posted on the foundation's web site.
| (in millions of $) | 8) Actual Spending 2004-05 |
9) Actual Spending 2005-06 |
10) Planned Spending 2006-07 |
11) Total Authorities 2006-07 |
12) Actual Spending 2006-07 |
13) Variances |
|---|---|---|---|---|---|---|
| 14) Program Activity: | 0.0 | 150.0 | 0.0 | 0.0 | 0.0 | 0.0 |
15) Comments on Variances:
16) Significant audit and evaluation findings and URL to last audit and/or evaluation:
17) URL to recipient's site: http://www.sustainablecommunities.fcm.ca/GMF/.
18) URL to recipient's Annual Report: http://www.sustainablecommunities.fcm.ca/GMF/Annual_Report/.
*NRCan's share is 275M.